Zip Codes with the Highest Percentage of Population Employed in Farming, Fishing & Forestry in Bloomington, IN
RELATED REPORTS & OPTIONS
Farming, Fishing & Forestry
Bloomington
Compare Zip Codes
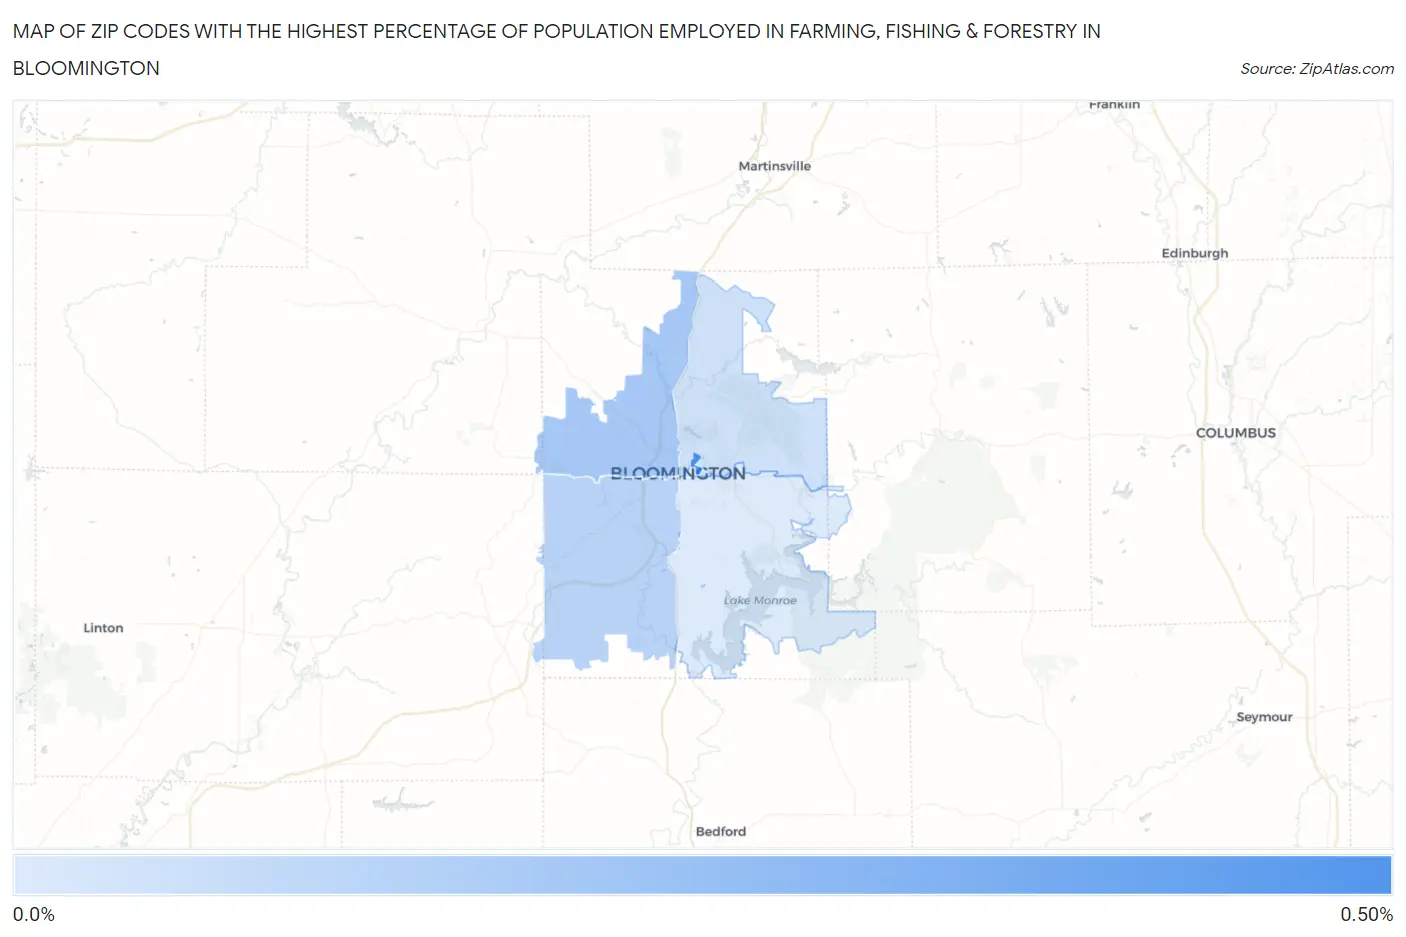
Map of Zip Codes with the Highest Percentage of Population Employed in Farming, Fishing & Forestry in Bloomington
0.0%
0.50%
Zip Codes with the Highest Percentage of Population Employed in Farming, Fishing & Forestry in Bloomington, IN
| Zip Code | % Employed | vs State | vs National | |
| 1. | 47406 | 0.44% | 0.39%(+0.055)#268 | 0.61%(-0.166)#13,388 |
| 2. | 47404 | 0.17% | 0.39%(-0.213)#361 | 0.61%(-0.434)#16,545 |
| 3. | 47403 | 0.12% | 0.39%(-0.261)#381 | 0.61%(-0.481)#17,357 |
| 4. | 47408 | 0.055% | 0.39%(-0.330)#405 | 0.61%(-0.551)#18,569 |
| 5. | 47401 | 0.019% | 0.39%(-0.366)#415 | 0.61%(-0.586)#19,082 |
1
Common Questions
What are the Top 5 Zip Codes with the Highest Percentage of Population Employed in Farming, Fishing & Forestry in Bloomington, IN?
Top 5 Zip Codes with the Highest Percentage of Population Employed in Farming, Fishing & Forestry in Bloomington, IN are:
What zip code has the Highest Percentage of Population Employed in Farming, Fishing & Forestry in Bloomington, IN?
47406 has the Highest Percentage of Population Employed in Farming, Fishing & Forestry in Bloomington, IN with 0.44%.
What is the Percentage of Population Employed in Farming, Fishing & Forestry in Bloomington, IN?
Percentage of Population Employed in Farming, Fishing & Forestry in Bloomington is 0.090%.
What is the Percentage of Population Employed in Farming, Fishing & Forestry in Indiana?
Percentage of Population Employed in Farming, Fishing & Forestry in Indiana is 0.39%.
What is the Percentage of Population Employed in Farming, Fishing & Forestry in the United States?
Percentage of Population Employed in Farming, Fishing & Forestry in the United States is 0.61%.