Bicknell, IN Map & Demographics
Bicknell Map
Bicknell Overview
$31,180
PER CAPITA INCOME
$68,600
AVG FAMILY INCOME
$49,420
AVG HOUSEHOLD INCOME
44.0%
WAGE / INCOME GAP [ % ]
56.0¢/ $1
WAGE / INCOME GAP [ $ ]
0.43
INEQUALITY / GINI INDEX
2,818
TOTAL POPULATION
1,431
MALE POPULATION
1,387
FEMALE POPULATION
103.17
MALES / 100 FEMALES
96.93
FEMALES / 100 MALES
41.6
MEDIAN AGE
2.7
AVG FAMILY SIZE
2.2
AVG HOUSEHOLD SIZE
1,532
LABOR FORCE [ PEOPLE ]
66.9%
PERCENT IN LABOR FORCE
2.1%
UNEMPLOYMENT RATE
Bicknell Zip Codes
Bicknell Area Codes
Income in Bicknell
Income Overview in Bicknell
Per Capita Income in Bicknell is $31,180, while median incomes of families and households are $68,600 and $49,420 respectively.
| Characteristic | Number | Measure |
| Per Capita Income | 2,818 | $31,180 |
| Median Family Income | 878 | $68,600 |
| Mean Family Income | 878 | $75,299 |
| Median Household Income | 1,270 | $49,420 |
| Mean Household Income | 1,270 | $67,054 |
| Income Deficit | 878 | $0 |
| Wage / Income Gap (%) | 2,818 | 44.03% |
| Wage / Income Gap ($) | 2,818 | 55.97¢ per $1 |
| Gini / Inequality Index | 2,818 | 0.43 |
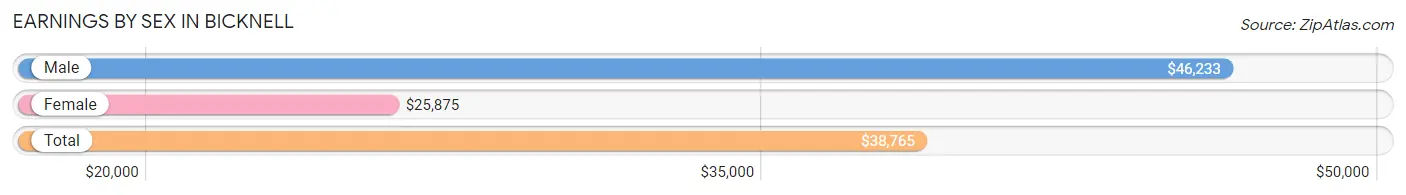
Earnings by Sex in Bicknell
Average Earnings in Bicknell are $38,765, $46,233 for men and $25,875 for women, a difference of 44.0%.
| Sex | Number | Average Earnings |
| Male | 865 (55.3%) | $46,233 |
| Female | 699 (44.7%) | $25,875 |
| Total | 1,564 (100.0%) | $38,765 |
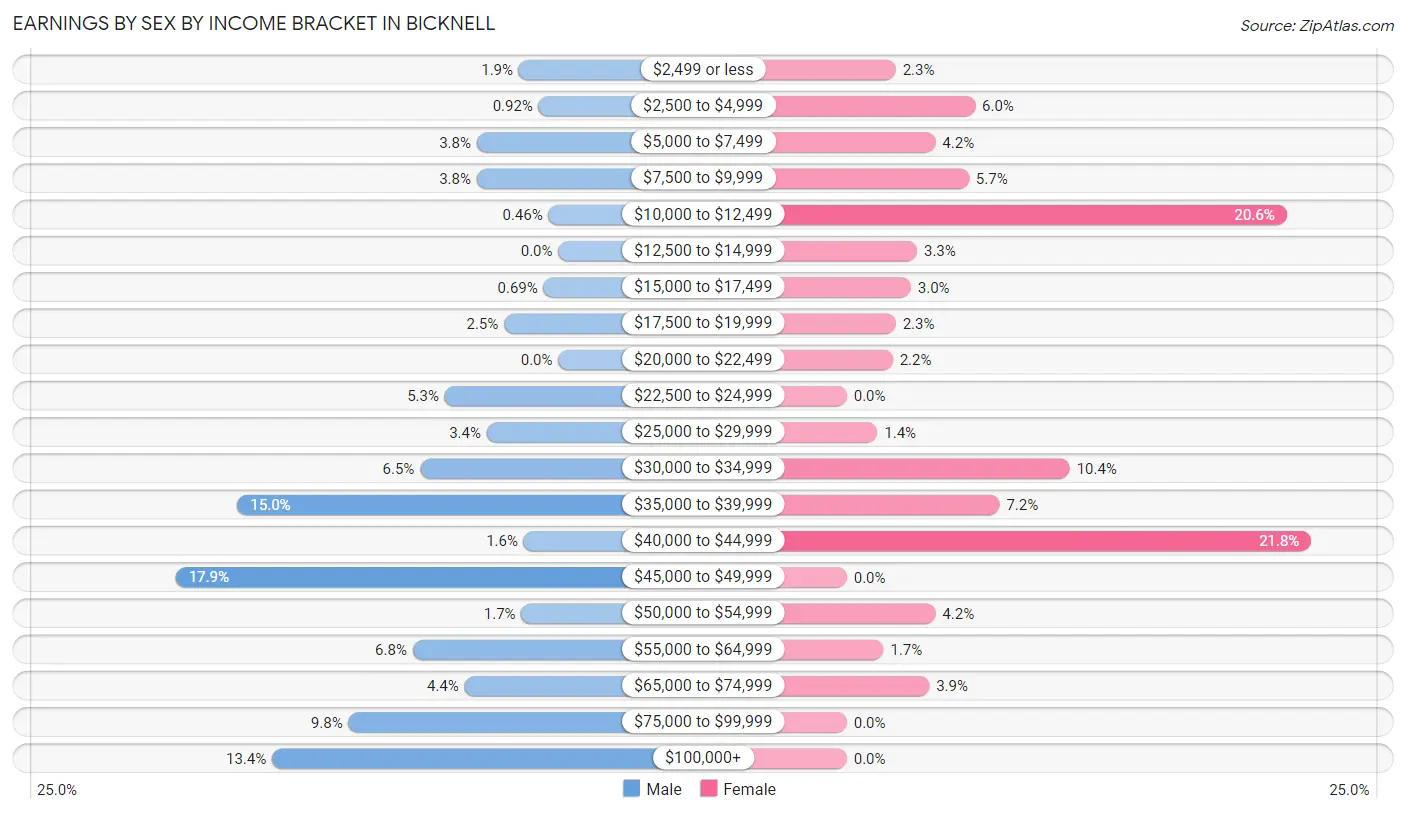
Earnings by Sex by Income Bracket in Bicknell
The most common earnings brackets in Bicknell are $45,000 to $49,999 for men (155 | 17.9%) and $40,000 to $44,999 for women (152 | 21.7%).
| Income | Male | Female |
| $2,499 or less | 16 (1.8%) | 16 (2.3%) |
| $2,500 to $4,999 | 8 (0.9%) | 42 (6.0%) |
| $5,000 to $7,499 | 33 (3.8%) | 29 (4.2%) |
| $7,500 to $9,999 | 33 (3.8%) | 40 (5.7%) |
| $10,000 to $12,499 | 4 (0.5%) | 144 (20.6%) |
| $12,500 to $14,999 | 0 (0.0%) | 23 (3.3%) |
| $15,000 to $17,499 | 6 (0.7%) | 21 (3.0%) |
| $17,500 to $19,999 | 22 (2.5%) | 16 (2.3%) |
| $20,000 to $22,499 | 0 (0.0%) | 15 (2.1%) |
| $22,500 to $24,999 | 46 (5.3%) | 0 (0.0%) |
| $25,000 to $29,999 | 29 (3.4%) | 10 (1.4%) |
| $30,000 to $34,999 | 56 (6.5%) | 73 (10.4%) |
| $35,000 to $39,999 | 130 (15.0%) | 50 (7.1%) |
| $40,000 to $44,999 | 14 (1.6%) | 152 (21.7%) |
| $45,000 to $49,999 | 155 (17.9%) | 0 (0.0%) |
| $50,000 to $54,999 | 15 (1.7%) | 29 (4.2%) |
| $55,000 to $64,999 | 59 (6.8%) | 12 (1.7%) |
| $65,000 to $74,999 | 38 (4.4%) | 27 (3.9%) |
| $75,000 to $99,999 | 85 (9.8%) | 0 (0.0%) |
| $100,000+ | 116 (13.4%) | 0 (0.0%) |
| Total | 865 (100.0%) | 699 (100.0%) |
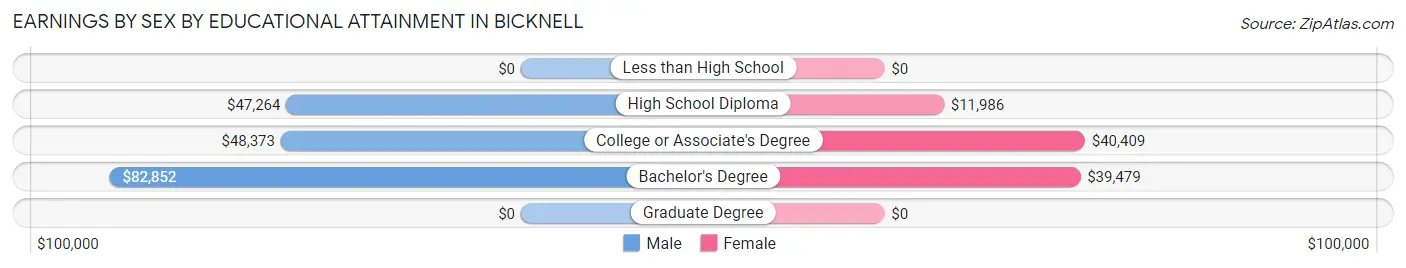
Earnings by Sex by Educational Attainment in Bicknell
Average earnings in Bicknell are $49,367 for men and $31,528 for women, a difference of 36.1%. Men with an educational attainment of bachelor's degree enjoy the highest average annual earnings of $82,852, while those with high school diploma education earn the least with $47,264. Women with an educational attainment of college or associate's degree earn the most with the average annual earnings of $40,409, while those with high school diploma education have the smallest earnings of $11,986.
| Educational Attainment | Male Income | Female Income |
| Less than High School | - | - |
| High School Diploma | $47,264 | $11,986 |
| College or Associate's Degree | $48,373 | $40,409 |
| Bachelor's Degree | $82,852 | $39,479 |
| Graduate Degree | - | - |
| Total | $49,367 | $31,528 |
Family Income in Bicknell
Family Income Brackets in Bicknell
According to the Bicknell family income data, there are 183 families falling into the $35,000 to $49,999 income range, which is the most common income bracket and makes up 20.8% of all families. Conversely, the $200,000+ income bracket is the least frequent group with only 11 families (1.3%) belonging to this category.
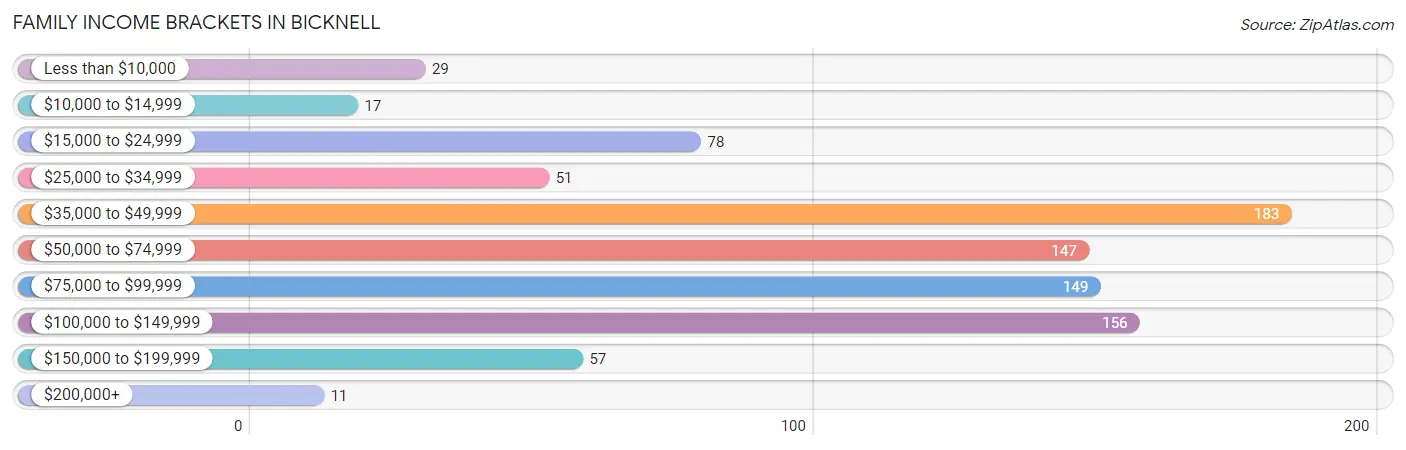
| Income Bracket | # Families | % Families |
| Less than $10,000 | 29 | 3.3% |
| $10,000 to $14,999 | 17 | 1.9% |
| $15,000 to $24,999 | 78 | 8.9% |
| $25,000 to $34,999 | 51 | 5.8% |
| $35,000 to $49,999 | 183 | 20.8% |
| $50,000 to $74,999 | 147 | 16.7% |
| $75,000 to $99,999 | 149 | 17.0% |
| $100,000 to $149,999 | 156 | 17.8% |
| $150,000 to $199,999 | 57 | 6.5% |
| $200,000+ | 11 | 1.3% |
Family Income by Famaliy Size in Bicknell
3-person families (199 | 22.7%) account for the highest median family income in Bicknell with $93,662 per family, while 3-person families (199 | 22.7%) have the highest median income of $31,221 per family member.
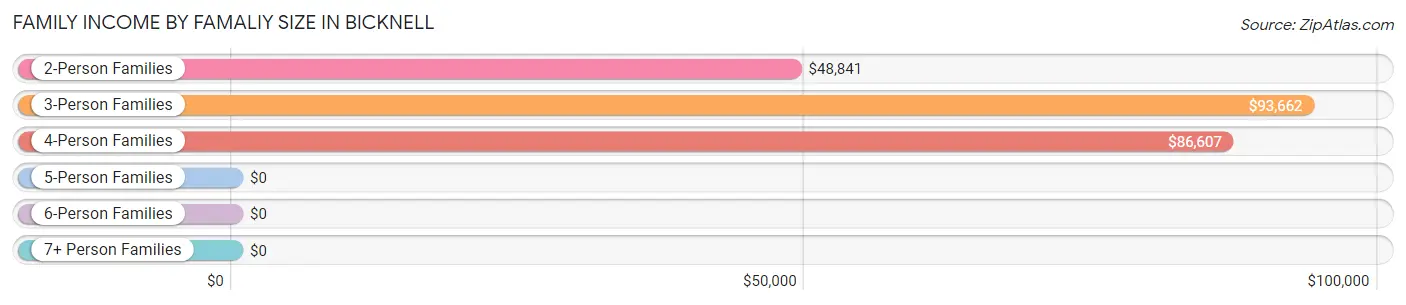
| Income Bracket | # Families | Median Income |
| 2-Person Families | 450 (51.2%) | $48,841 |
| 3-Person Families | 199 (22.7%) | $93,662 |
| 4-Person Families | 214 (24.4%) | $86,607 |
| 5-Person Families | 15 (1.7%) | $0 |
| 6-Person Families | 0 (0.0%) | $0 |
| 7+ Person Families | 0 (0.0%) | $0 |
| Total | 878 (100.0%) | $68,600 |
Family Income by Number of Earners in Bicknell
The median family income in Bicknell is $68,600, with families comprising 3+ earners (70) having the highest median family income of $100,786, while families with no earners (101) have the lowest median family income of $27,784, accounting for 8.0% and 11.5% of families, respectively.
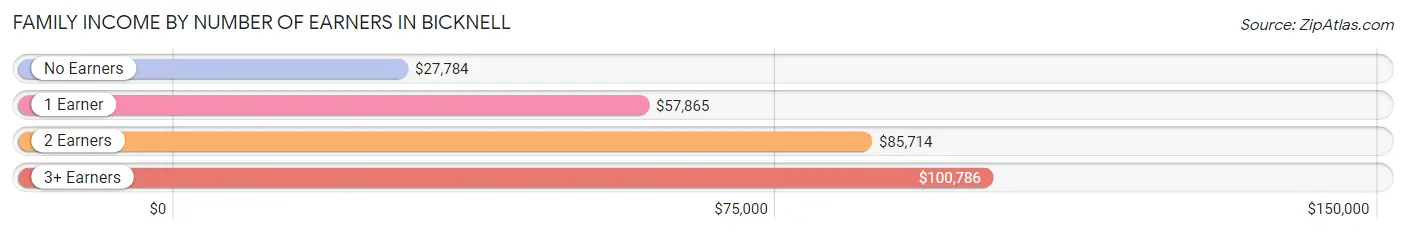
| Number of Earners | # Families | Median Income |
| No Earners | 101 (11.5%) | $27,784 |
| 1 Earner | 297 (33.8%) | $57,865 |
| 2 Earners | 410 (46.7%) | $85,714 |
| 3+ Earners | 70 (8.0%) | $100,786 |
| Total | 878 (100.0%) | $68,600 |
Household Income in Bicknell
Household Income Brackets in Bicknell
With 198 households falling in the category, the $35,000 to $49,999 income range is the most frequent in Bicknell, accounting for 15.6% of all households. In contrast, only 24 households (1.9%) fall into the $200,000+ income bracket, making it the least populous group.
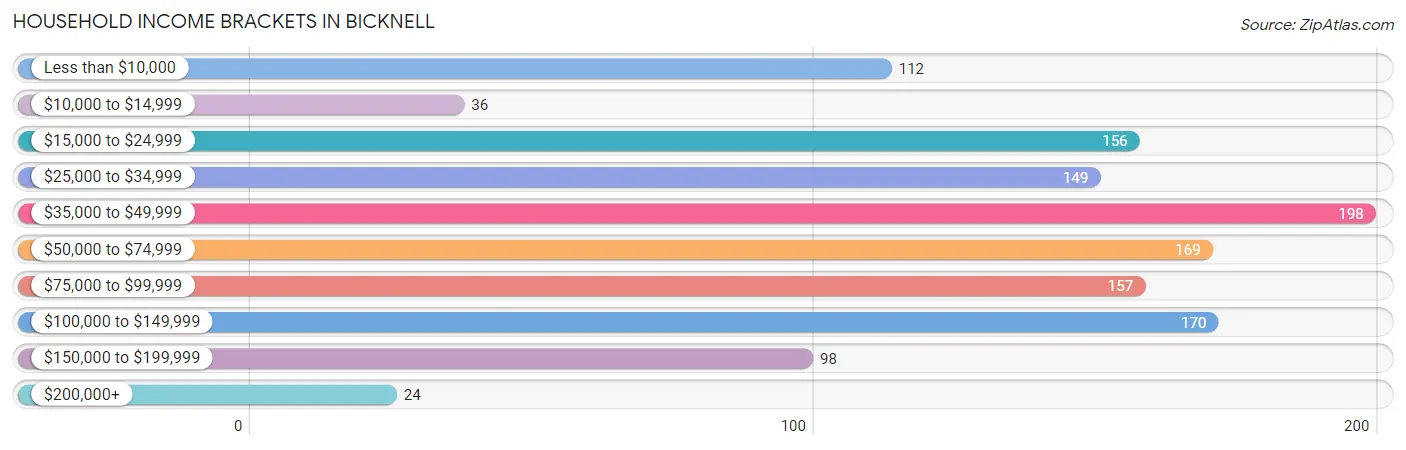
| Income Bracket | # Households | % Households |
| Less than $10,000 | 112 | 8.8% |
| $10,000 to $14,999 | 36 | 2.8% |
| $15,000 to $24,999 | 156 | 12.3% |
| $25,000 to $34,999 | 149 | 11.7% |
| $35,000 to $49,999 | 198 | 15.6% |
| $50,000 to $74,999 | 169 | 13.3% |
| $75,000 to $99,999 | 157 | 12.4% |
| $100,000 to $149,999 | 170 | 13.4% |
| $150,000 to $199,999 | 98 | 7.7% |
| $200,000+ | 24 | 1.9% |
Household Income by Householder Age in Bicknell
The median household income in Bicknell is $49,420, with the highest median household income of $76,382 found in the 15 to 24 years age bracket for the primary householder. A total of 94 households (7.4%) fall into this category. Meanwhile, the 65+ years age bracket for the primary householder has the lowest median household income of $28,816, with 334 households (26.3%) in this group.
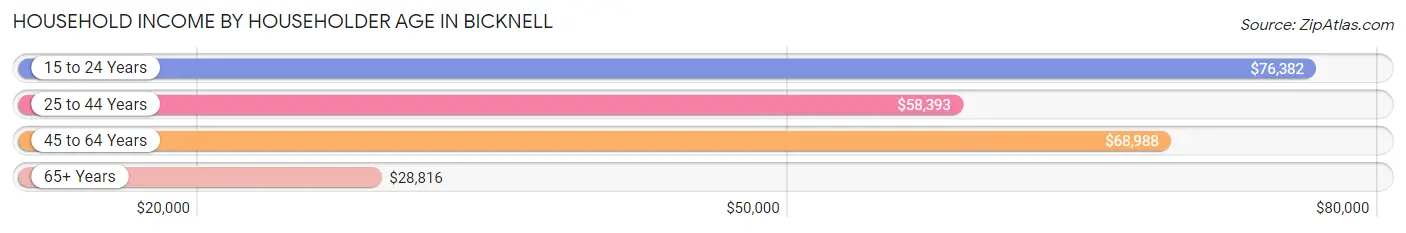
| Income Bracket | # Households | Median Income |
| 15 to 24 Years | 94 (7.4%) | $76,382 |
| 25 to 44 Years | 437 (34.4%) | $58,393 |
| 45 to 64 Years | 405 (31.9%) | $68,988 |
| 65+ Years | 334 (26.3%) | $28,816 |
| Total | 1,270 (100.0%) | $49,420 |
Poverty in Bicknell
Income Below Poverty by Sex and Age in Bicknell
With 6.6% poverty level for males and 20.3% for females among the residents of Bicknell, 75 year old and over males and 12 to 14 year old females are the most vulnerable to poverty, with 12 males (21.4%) and 28 females (52.8%) in their respective age groups living below the poverty level.
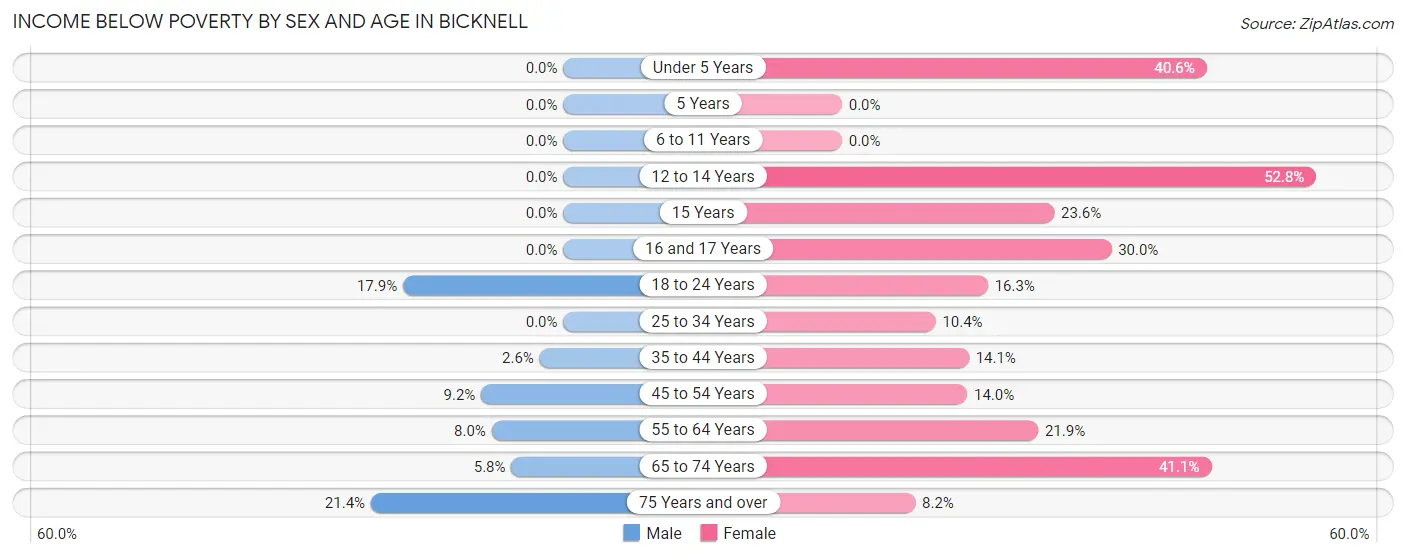
| Age Bracket | Male | Female |
| Under 5 Years | 0 (0.0%) | 26 (40.6%) |
| 5 Years | 0 (0.0%) | 0 (0.0%) |
| 6 to 11 Years | 0 (0.0%) | 0 (0.0%) |
| 12 to 14 Years | 0 (0.0%) | 28 (52.8%) |
| 15 Years | 0 (0.0%) | 13 (23.6%) |
| 16 and 17 Years | 0 (0.0%) | 9 (30.0%) |
| 18 to 24 Years | 40 (17.9%) | 26 (16.3%) |
| 25 to 34 Years | 0 (0.0%) | 12 (10.4%) |
| 35 to 44 Years | 7 (2.6%) | 38 (14.1%) |
| 45 to 54 Years | 14 (9.1%) | 24 (14.0%) |
| 55 to 64 Years | 15 (8.0%) | 33 (21.8%) |
| 65 to 74 Years | 7 (5.8%) | 65 (41.1%) |
| 75 Years and over | 12 (21.4%) | 8 (8.2%) |
| Total | 95 (6.6%) | 282 (20.3%) |
Income Above Poverty by Sex and Age in Bicknell
According to the poverty statistics in Bicknell, males aged under 5 years and females aged 5 years are the age groups that are most secure financially, with 100.0% of males and 100.0% of females in these age groups living above the poverty line.
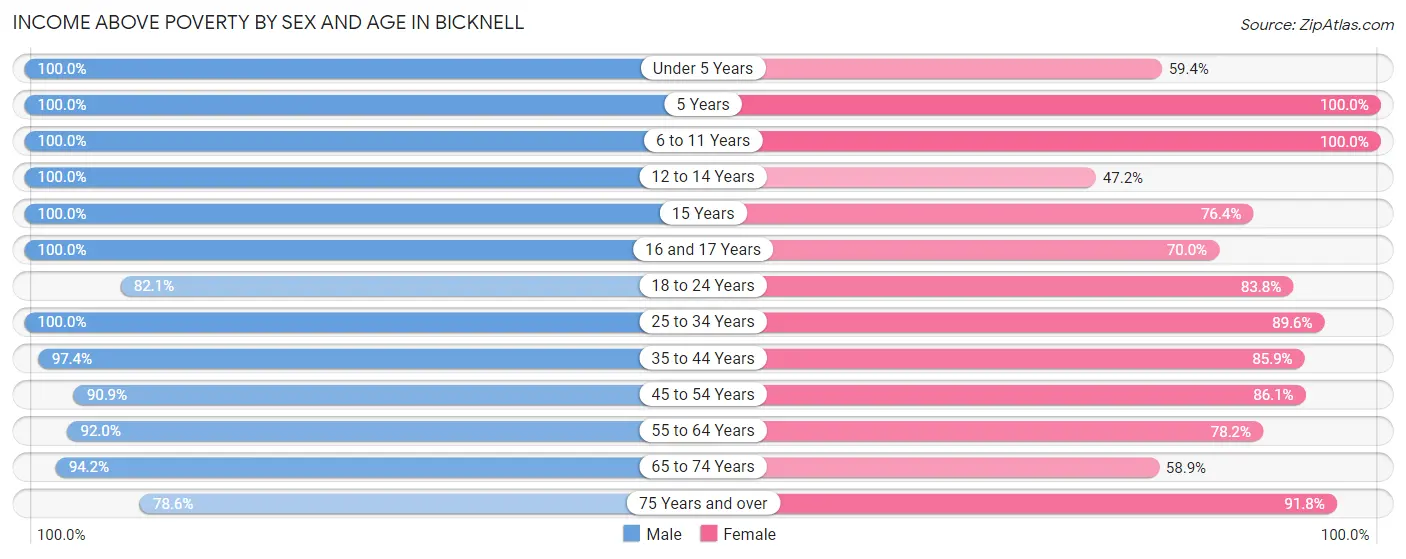
| Age Bracket | Male | Female |
| Under 5 Years | 51 (100.0%) | 38 (59.4%) |
| 5 Years | 55 (100.0%) | 18 (100.0%) |
| 6 to 11 Years | 150 (100.0%) | 44 (100.0%) |
| 12 to 14 Years | 27 (100.0%) | 25 (47.2%) |
| 15 Years | 11 (100.0%) | 42 (76.4%) |
| 16 and 17 Years | 23 (100.0%) | 21 (70.0%) |
| 18 to 24 Years | 184 (82.1%) | 134 (83.8%) |
| 25 to 34 Years | 107 (100.0%) | 103 (89.6%) |
| 35 to 44 Years | 258 (97.4%) | 231 (85.9%) |
| 45 to 54 Years | 139 (90.8%) | 148 (86.1%) |
| 55 to 64 Years | 173 (92.0%) | 118 (78.1%) |
| 65 to 74 Years | 114 (94.2%) | 93 (58.9%) |
| 75 Years and over | 44 (78.6%) | 90 (91.8%) |
| Total | 1,336 (93.4%) | 1,105 (79.7%) |
Income Below Poverty Among Married-Couple Families in Bicknell
The poverty statistics for married-couple families in Bicknell show that 5.4% or 36 of the total 663 families live below the poverty line. Families with no children have the highest poverty rate of 8.4%, comprising of 36 families. On the other hand, families with 1 or 2 children have the lowest poverty rate of 0.0%, which includes 0 families.
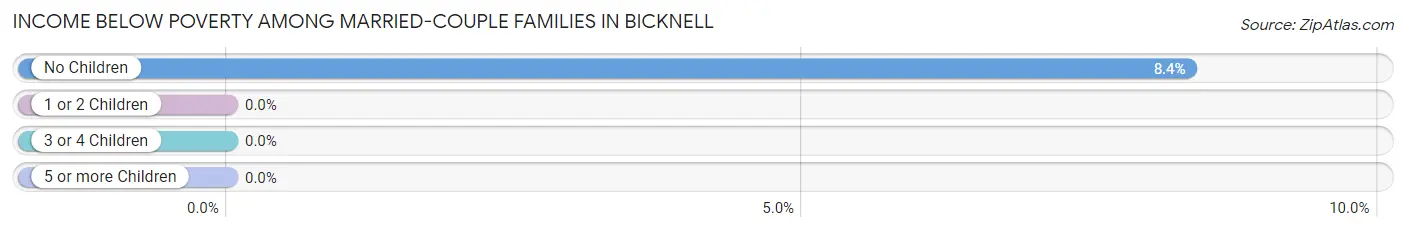
| Children | Above Poverty | Below Poverty |
| No Children | 395 (91.6%) | 36 (8.4%) |
| 1 or 2 Children | 217 (100.0%) | 0 (0.0%) |
| 3 or 4 Children | 15 (100.0%) | 0 (0.0%) |
| 5 or more Children | 0 (0.0%) | 0 (0.0%) |
| Total | 627 (94.6%) | 36 (5.4%) |
Income Below Poverty Among Single-Parent Households in Bicknell
According to the poverty data in Bicknell, 31.4% or 16 single-father households and 36.6% or 60 single-mother households are living below the poverty line. Among single-father households, those with no children have the highest poverty rate, with 16 households (100.0%) experiencing poverty. Likewise, among single-mother households, those with 1 or 2 children have the highest poverty rate, with 60 households (50.8%) falling below the poverty line.
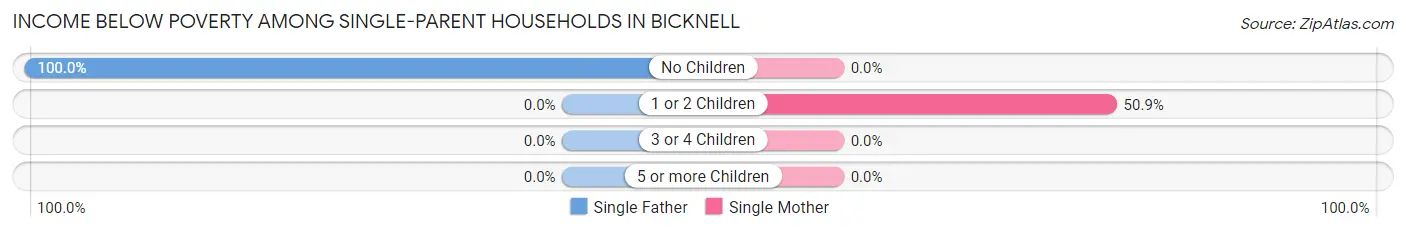
| Children | Single Father | Single Mother |
| No Children | 16 (100.0%) | 0 (0.0%) |
| 1 or 2 Children | 0 (0.0%) | 60 (50.8%) |
| 3 or 4 Children | 0 (0.0%) | 0 (0.0%) |
| 5 or more Children | 0 (0.0%) | 0 (0.0%) |
| Total | 16 (31.4%) | 60 (36.6%) |
Income Below Poverty Among Married-Couple vs Single-Parent Households in Bicknell
The poverty data for Bicknell shows that 36 of the married-couple family households (5.4%) and 76 of the single-parent households (35.3%) are living below the poverty level. Within the married-couple family households, those with no children have the highest poverty rate, with 36 households (8.4%) falling below the poverty line. Among the single-parent households, those with 1 or 2 children have the highest poverty rate, with 60 household (39.2%) living below poverty.
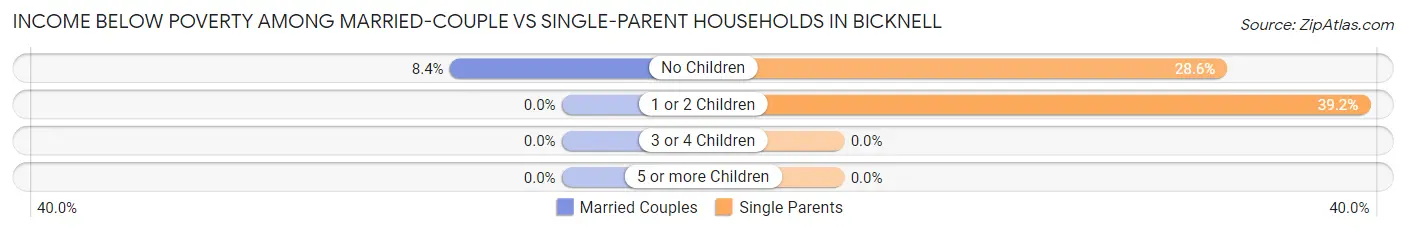
| Children | Married-Couple Families | Single-Parent Households |
| No Children | 36 (8.4%) | 16 (28.6%) |
| 1 or 2 Children | 0 (0.0%) | 60 (39.2%) |
| 3 or 4 Children | 0 (0.0%) | 0 (0.0%) |
| 5 or more Children | 0 (0.0%) | 0 (0.0%) |
| Total | 36 (5.4%) | 76 (35.3%) |
Race in Bicknell
The most populous races in Bicknell are White / Caucasian (2,564 | 91.0%), Two or more Races (189 | 6.7%), and Asian (37 | 1.3%).
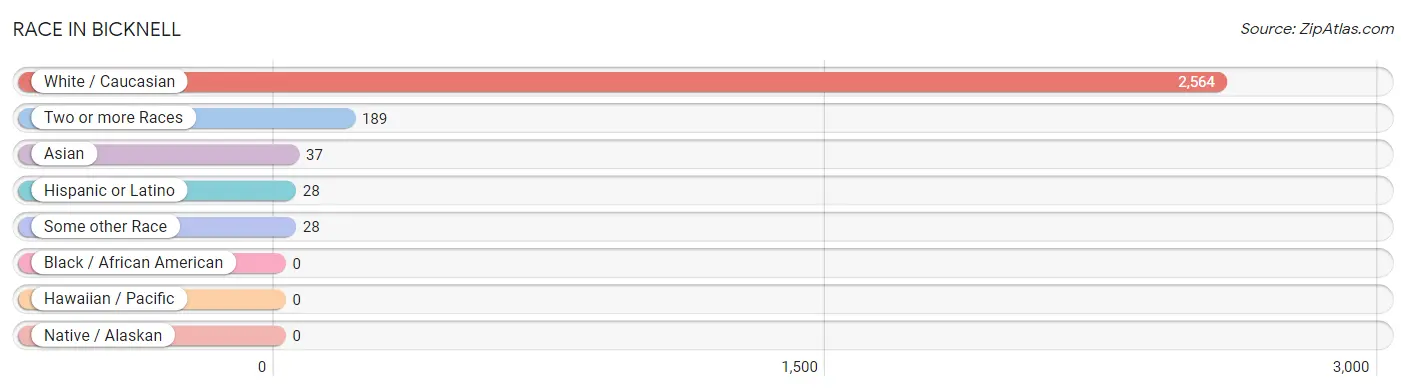
| Race | # Population | % Population |
| Asian | 37 | 1.3% |
| Black / African American | 0 | 0.0% |
| Hawaiian / Pacific | 0 | 0.0% |
| Hispanic or Latino | 28 | 1.0% |
| Native / Alaskan | 0 | 0.0% |
| White / Caucasian | 2,564 | 91.0% |
| Two or more Races | 189 | 6.7% |
| Some other Race | 28 | 1.0% |
| Total | 2,818 | 100.0% |
Ancestry in Bicknell
The most populous ancestries reported in Bicknell are American (271 | 9.6%), German (253 | 9.0%), English (235 | 8.3%), Irish (119 | 4.2%), and Korean (81 | 2.9%), together accounting for 34.0% of all Bicknell residents.
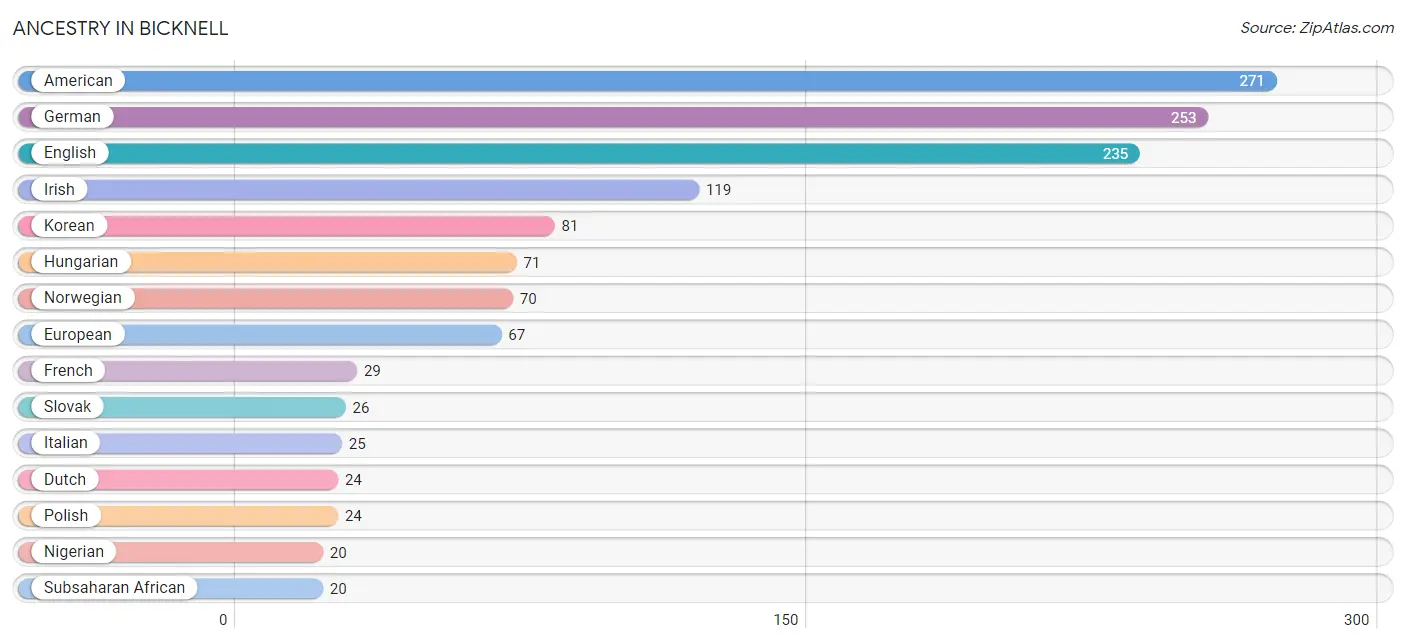
| Ancestry | # Population | % Population |
| American | 271 | 9.6% |
| Dutch | 24 | 0.9% |
| English | 235 | 8.3% |
| European | 67 | 2.4% |
| French | 29 | 1.0% |
| German | 253 | 9.0% |
| Greek | 8 | 0.3% |
| Hungarian | 71 | 2.5% |
| Irish | 119 | 4.2% |
| Iroquois | 9 | 0.3% |
| Italian | 25 | 0.9% |
| Korean | 81 | 2.9% |
| Mexican | 16 | 0.6% |
| Nigerian | 20 | 0.7% |
| Norwegian | 70 | 2.5% |
| Polish | 24 | 0.9% |
| Puerto Rican | 12 | 0.4% |
| Scottish | 18 | 0.6% |
| Slovak | 26 | 0.9% |
| Subsaharan African | 20 | 0.7% |
| Welsh | 11 | 0.4% | View All 21 Rows |
Immigrants in Bicknell
The most numerous immigrant groups reported in Bicknell came from Asia (37 | 1.3%), Philippines (37 | 1.3%), and South Eastern Asia (37 | 1.3%), together accounting for 3.9% of all Bicknell residents.
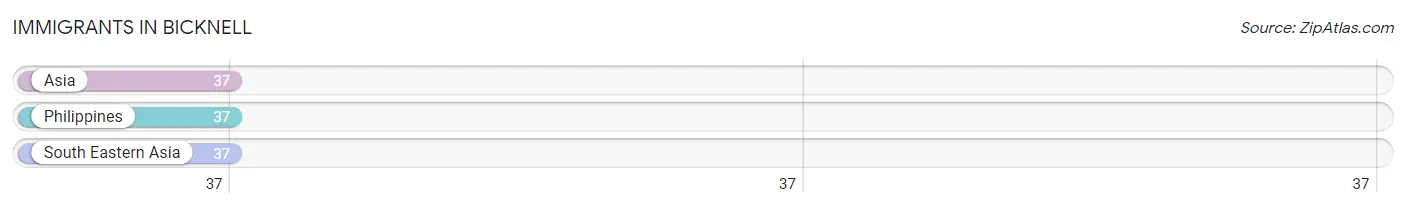
| Immigration Origin | # Population | % Population |
| Asia | 37 | 1.3% |
| Philippines | 37 | 1.3% |
| South Eastern Asia | 37 | 1.3% | View All 3 Rows |
Sex and Age in Bicknell
Sex and Age in Bicknell
The most populous age groups in Bicknell are 20 to 24 Years (216 | 15.1%) for men and 40 to 44 Years (157 | 11.3%) for women.
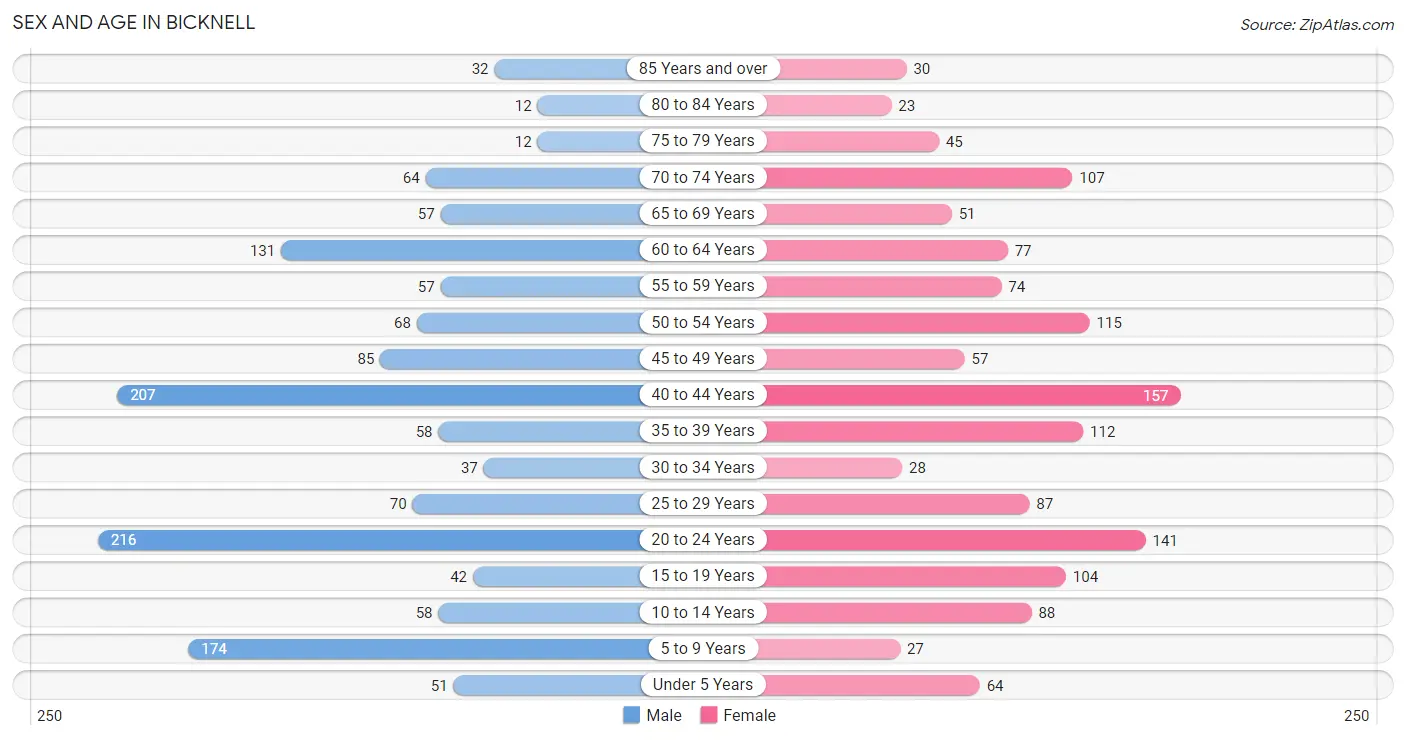
| Age Bracket | Male | Female |
| Under 5 Years | 51 (3.6%) | 64 (4.6%) |
| 5 to 9 Years | 174 (12.2%) | 27 (1.9%) |
| 10 to 14 Years | 58 (4.1%) | 88 (6.3%) |
| 15 to 19 Years | 42 (2.9%) | 104 (7.5%) |
| 20 to 24 Years | 216 (15.1%) | 141 (10.2%) |
| 25 to 29 Years | 70 (4.9%) | 87 (6.3%) |
| 30 to 34 Years | 37 (2.6%) | 28 (2.0%) |
| 35 to 39 Years | 58 (4.1%) | 112 (8.1%) |
| 40 to 44 Years | 207 (14.5%) | 157 (11.3%) |
| 45 to 49 Years | 85 (5.9%) | 57 (4.1%) |
| 50 to 54 Years | 68 (4.8%) | 115 (8.3%) |
| 55 to 59 Years | 57 (4.0%) | 74 (5.3%) |
| 60 to 64 Years | 131 (9.1%) | 77 (5.6%) |
| 65 to 69 Years | 57 (4.0%) | 51 (3.7%) |
| 70 to 74 Years | 64 (4.5%) | 107 (7.7%) |
| 75 to 79 Years | 12 (0.8%) | 45 (3.2%) |
| 80 to 84 Years | 12 (0.8%) | 23 (1.7%) |
| 85 Years and over | 32 (2.2%) | 30 (2.2%) |
| Total | 1,431 (100.0%) | 1,387 (100.0%) |
Families and Households in Bicknell
Median Family Size in Bicknell
The median family size in Bicknell is 2.70 persons per family, with married-couple families (663 | 75.5%) accounting for the largest median family size of 2.77 persons per family. On the other hand, single male/father families (51 | 5.8%) represent the smallest median family size with 1.88 persons per family.
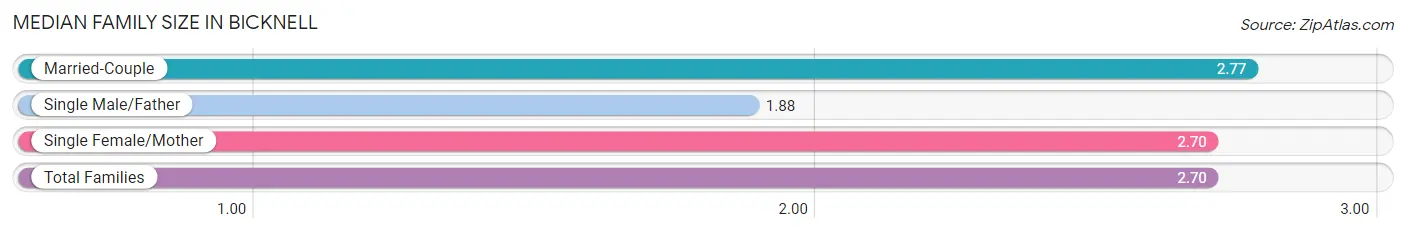
| Family Type | # Families | Family Size |
| Married-Couple | 663 (75.5%) | 2.77 |
| Single Male/Father | 51 (5.8%) | 1.88 |
| Single Female/Mother | 164 (18.7%) | 2.70 |
| Total Families | 878 (100.0%) | 2.70 |
Median Household Size in Bicknell
The median household size in Bicknell is 2.21 persons per household, with single female/mother households (164 | 12.9%) accounting for the largest median household size of 2.88 persons per household. non-family households (392 | 30.9%) represent the smallest median household size with 1.02 persons per household.
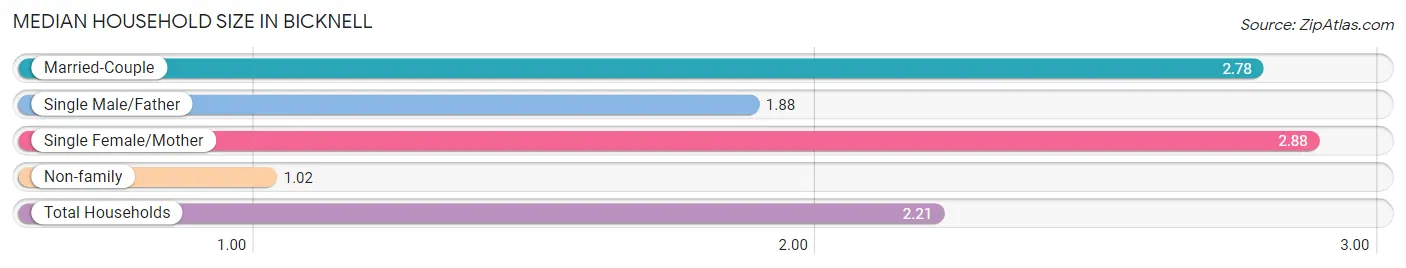
| Household Type | # Households | Household Size |
| Married-Couple | 663 (52.2%) | 2.78 |
| Single Male/Father | 51 (4.0%) | 1.88 |
| Single Female/Mother | 164 (12.9%) | 2.88 |
| Non-family | 392 (30.9%) | 1.02 |
| Total Households | 1,270 (100.0%) | 2.21 |
Household Size by Marriage Status in Bicknell
Out of a total of 1,270 households in Bicknell, 878 (69.1%) are family households, while 392 (30.9%) are nonfamily households. The most numerous type of family households are 2-person households, comprising 440, and the most common type of nonfamily households are 1-person households, comprising 383.
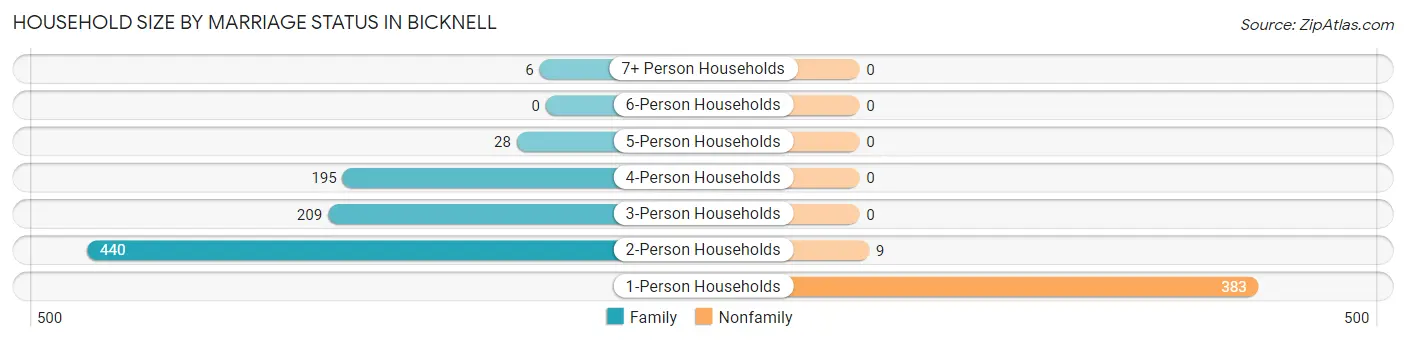
| Household Size | Family Households | Nonfamily Households |
| 1-Person Households | - | 383 (30.2%) |
| 2-Person Households | 440 (34.6%) | 9 (0.7%) |
| 3-Person Households | 209 (16.5%) | 0 (0.0%) |
| 4-Person Households | 195 (15.3%) | 0 (0.0%) |
| 5-Person Households | 28 (2.2%) | 0 (0.0%) |
| 6-Person Households | 0 (0.0%) | 0 (0.0%) |
| 7+ Person Households | 6 (0.5%) | 0 (0.0%) |
| Total | 878 (69.1%) | 392 (30.9%) |
Female Fertility in Bicknell
Fertility by Age in Bicknell
Average fertility rate in Bicknell is 64.0 births per 1,000 women. Women in the age bracket of 20 to 34 years have the highest fertility rate with 113.0 births per 1,000 women. Women in the age bracket of 20 to 34 years acount for 64.4% of all women with births.
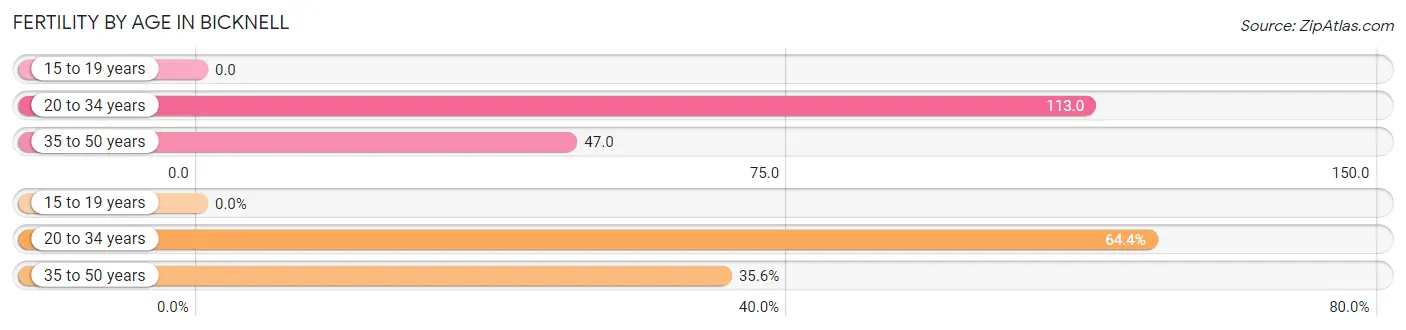
| Age Bracket | Women with Births | Births / 1,000 Women |
| 15 to 19 years | 0 (0.0%) | 0.0 |
| 20 to 34 years | 29 (64.4%) | 113.0 |
| 35 to 50 years | 16 (35.6%) | 47.0 |
| Total | 45 (100.0%) | 64.0 |
Fertility by Age by Marriage Status in Bicknell
62.2% of women with births (45) in Bicknell are married. The highest percentage of unmarried women with births falls into 20 to 34 years age bracket with 58.6% of them unmarried at the time of birth, while the lowest percentage of unmarried women with births belong to 35 to 50 years age bracket with 0.0% of them unmarried.
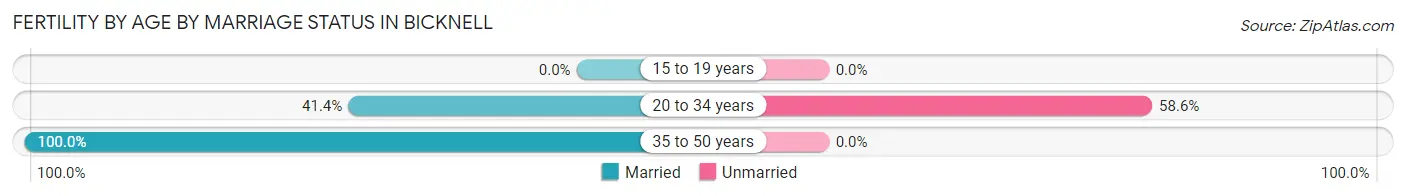
| Age Bracket | Married | Unmarried |
| 15 to 19 years | 0 (0.0%) | 0 (0.0%) |
| 20 to 34 years | 12 (41.4%) | 17 (58.6%) |
| 35 to 50 years | 16 (100.0%) | 0 (0.0%) |
| Total | 28 (62.2%) | 17 (37.8%) |
Fertility by Education in Bicknell
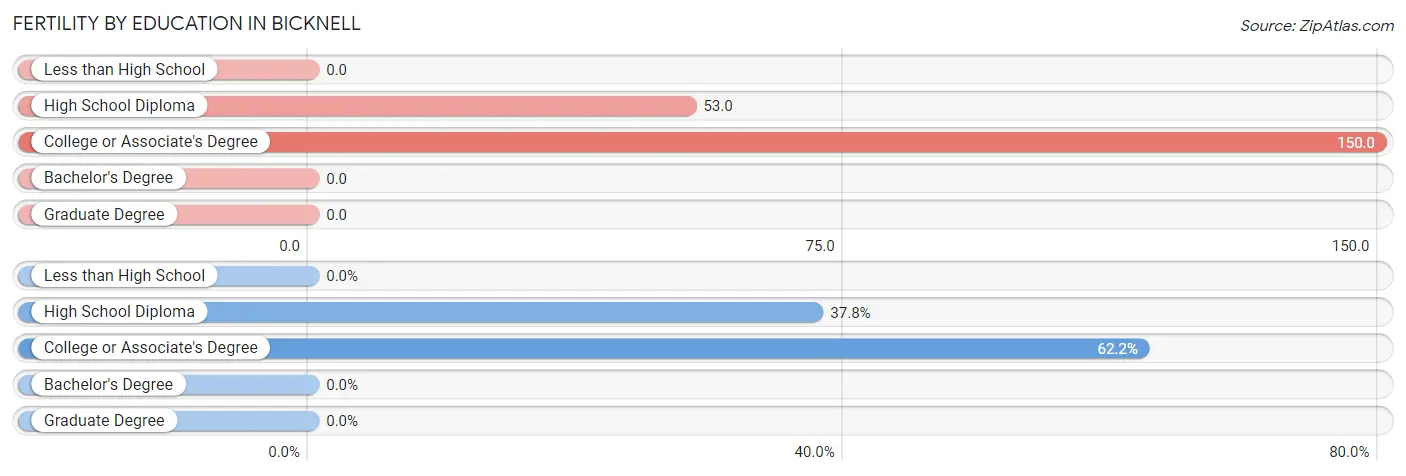
| Educational Attainment | Women with Births | Births / 1,000 Women |
| Less than High School | 0 (0.0%) | 0.0 |
| High School Diploma | 17 (37.8%) | 53.0 |
| College or Associate's Degree | 28 (62.2%) | 150.0 |
| Bachelor's Degree | 0 (0.0%) | 0.0 |
| Graduate Degree | 0 (0.0%) | 0.0 |
| Total | 45 (100.0%) | 64.0 |
Fertility by Education by Marriage Status in Bicknell
37.8% of women with births in Bicknell are unmarried. Women with the educational attainment of college or associate's degree are most likely to be married with 100.0% of them married at childbirth, while women with the educational attainment of high school diploma are least likely to be married with 100.0% of them unmarried at childbirth.
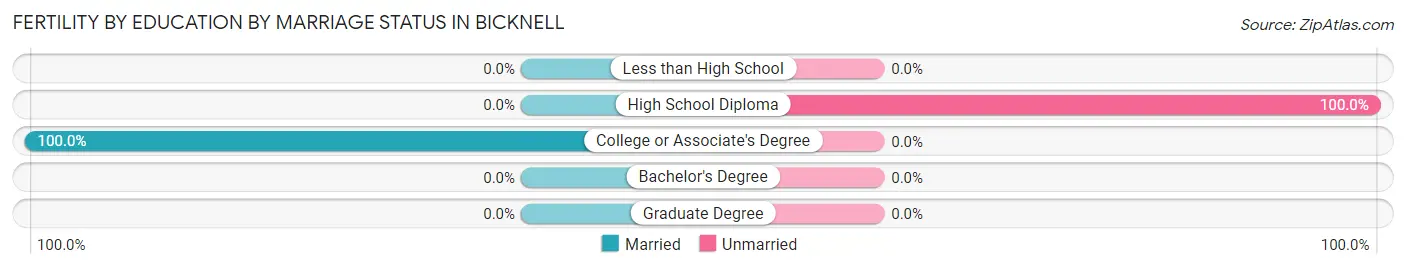
| Educational Attainment | Married | Unmarried |
| Less than High School | 0 (0.0%) | 0 (0.0%) |
| High School Diploma | 0 (0.0%) | 17 (100.0%) |
| College or Associate's Degree | 28 (100.0%) | 0 (0.0%) |
| Bachelor's Degree | 0 (0.0%) | 0 (0.0%) |
| Graduate Degree | 0 (0.0%) | 0 (0.0%) |
| Total | 28 (62.2%) | 17 (37.8%) |
Employment Characteristics in Bicknell
Employment by Class of Employer in Bicknell
Among the 1,499 employed individuals in Bicknell, private company employees (1,189 | 79.3%), not-for-profit organizations (129 | 8.6%), and local government employees (69 | 4.6%) make up the most common classes of employment.
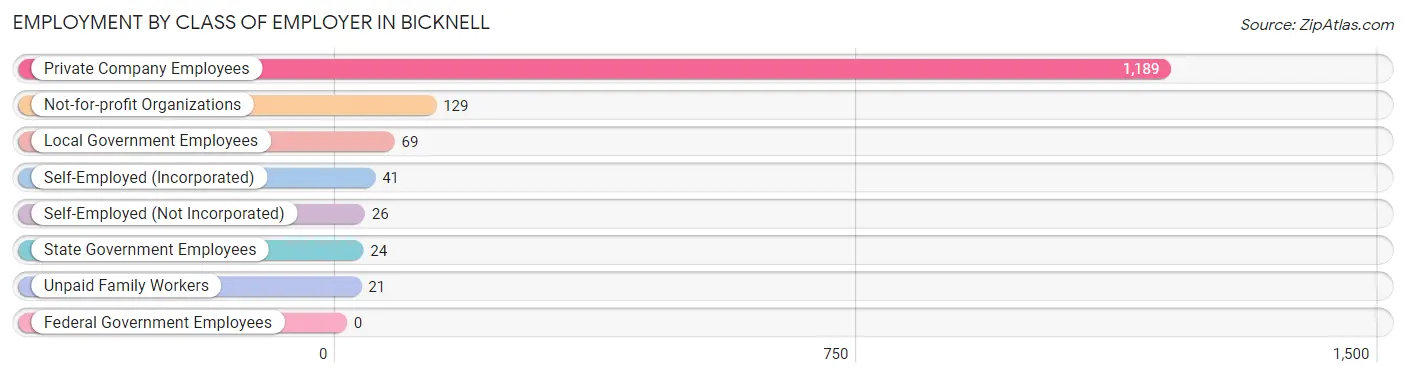
| Employer Class | # Employees | % Employees |
| Private Company Employees | 1,189 | 79.3% |
| Self-Employed (Incorporated) | 41 | 2.7% |
| Self-Employed (Not Incorporated) | 26 | 1.7% |
| Not-for-profit Organizations | 129 | 8.6% |
| Local Government Employees | 69 | 4.6% |
| State Government Employees | 24 | 1.6% |
| Federal Government Employees | 0 | 0.0% |
| Unpaid Family Workers | 21 | 1.4% |
| Total | 1,499 | 100.0% |
Employment Status by Age in Bicknell
According to the labor force statistics for Bicknell, out of the total population over 16 years of age (2,290), 66.9% or 1,532 individuals are in the labor force, with 2.1% or 32 of them unemployed. The age group with the highest labor force participation rate is 25 to 29 years, with 100.0% or 157 individuals in the labor force. Within the labor force, the 30 to 34 years age range has the highest percentage of unemployed individuals, with 18.5% or 12 of them being unemployed.
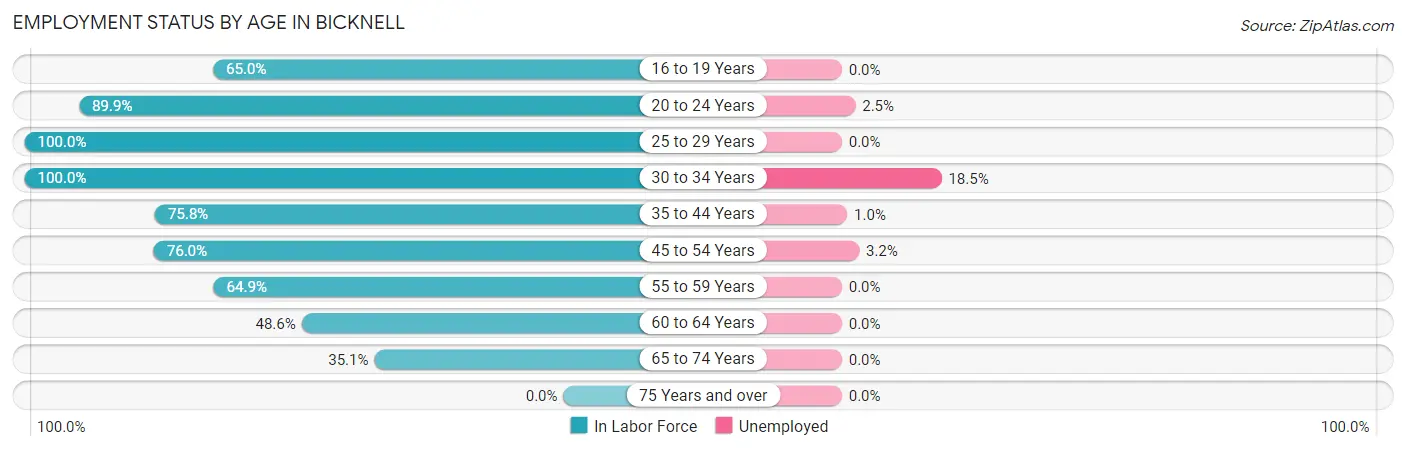
| Age Bracket | In Labor Force | Unemployed |
| 16 to 19 Years | 52 (65.0%) | 0 (0.0%) |
| 20 to 24 Years | 321 (89.9%) | 8 (2.5%) |
| 25 to 29 Years | 157 (100.0%) | 0 (0.0%) |
| 30 to 34 Years | 65 (100.0%) | 12 (18.5%) |
| 35 to 44 Years | 405 (75.8%) | 4 (1.0%) |
| 45 to 54 Years | 247 (76.0%) | 8 (3.2%) |
| 55 to 59 Years | 85 (64.9%) | 0 (0.0%) |
| 60 to 64 Years | 101 (48.6%) | 0 (0.0%) |
| 65 to 74 Years | 98 (35.1%) | 0 (0.0%) |
| 75 Years and over | 0 (0.0%) | 0 (0.0%) |
| Total | 1,532 (66.9%) | 32 (2.1%) |
Employment Status by Educational Attainment in Bicknell
According to labor force statistics for Bicknell, 74.6% of individuals (1,059) out of the total population between 25 and 64 years of age (1,420) are in the labor force, with 2.3% or 24 of them being unemployed. The group with the highest labor force participation rate are those with the educational attainment of bachelor's degree or higher, with 92.6% or 162 individuals in the labor force. Within the labor force, individuals with less than high school education have the highest percentage of unemployment, with 50.0% or 12 of them being unemployed.
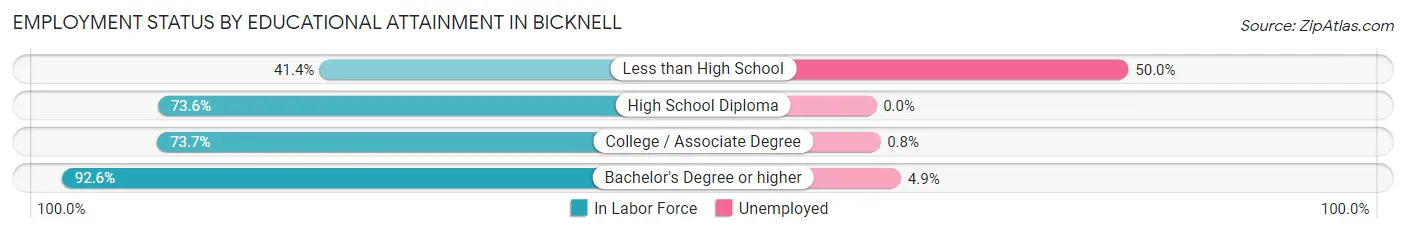
| Educational Attainment | In Labor Force | Unemployed |
| Less than High School | 24 (41.4%) | 29 (50.0%) |
| High School Diploma | 362 (73.6%) | 0 (0.0%) |
| College / Associate Degree | 512 (73.7%) | 6 (0.8%) |
| Bachelor's Degree or higher | 162 (92.6%) | 9 (4.9%) |
| Total | 1,059 (74.6%) | 33 (2.3%) |
Employment Occupations by Sex in Bicknell
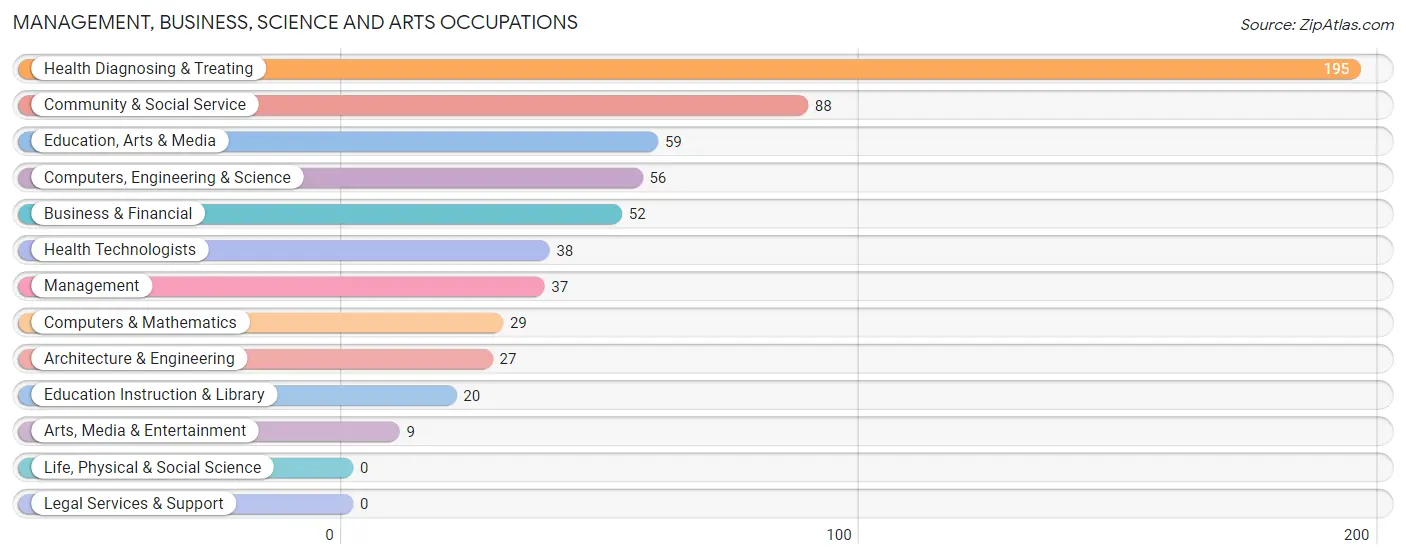
Management, Business, Science and Arts Occupations
The most common Management, Business, Science and Arts occupations in Bicknell are Health Diagnosing & Treating (195 | 13.0%), Community & Social Service (88 | 5.9%), Education, Arts & Media (59 | 3.9%), Computers, Engineering & Science (56 | 3.7%), and Business & Financial (52 | 3.5%).
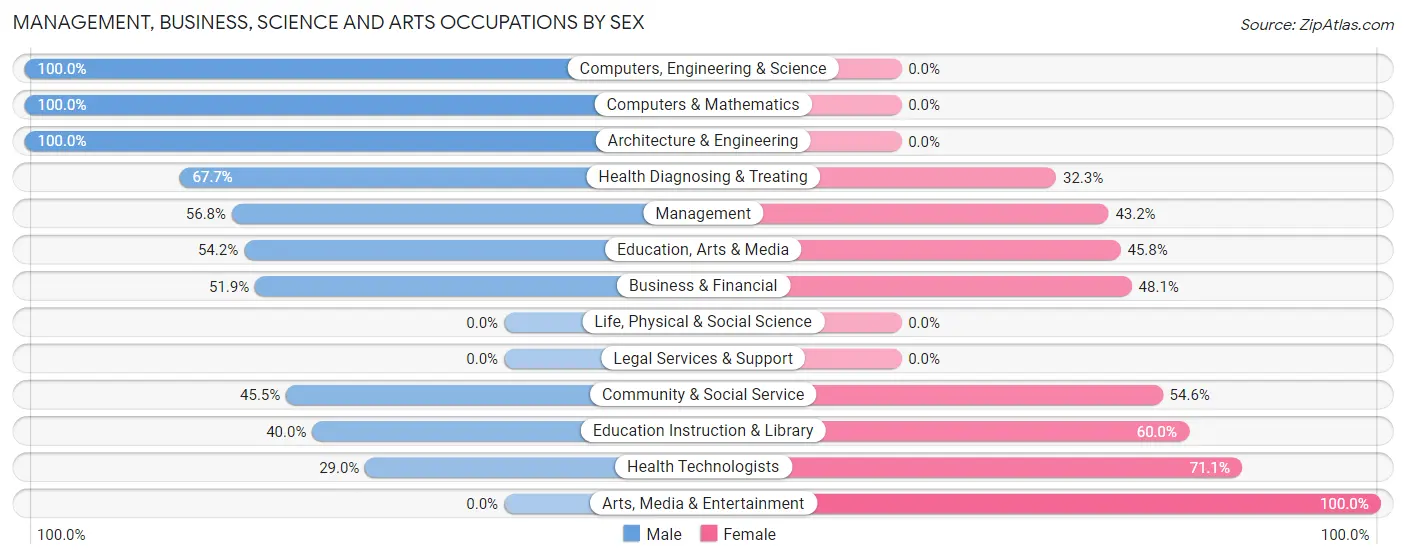
Management, Business, Science and Arts Occupations by Sex
Within the Management, Business, Science and Arts occupations in Bicknell, the most male-oriented occupations are Computers, Engineering & Science (100.0%), Computers & Mathematics (100.0%), and Architecture & Engineering (100.0%), while the most female-oriented occupations are Arts, Media & Entertainment (100.0%), Health Technologists (71.1%), and Education Instruction & Library (60.0%).
| Occupation | Male | Female |
| Management | 21 (56.8%) | 16 (43.2%) |
| Business & Financial | 27 (51.9%) | 25 (48.1%) |
| Computers, Engineering & Science | 56 (100.0%) | 0 (0.0%) |
| Computers & Mathematics | 29 (100.0%) | 0 (0.0%) |
| Architecture & Engineering | 27 (100.0%) | 0 (0.0%) |
| Life, Physical & Social Science | 0 (0.0%) | 0 (0.0%) |
| Community & Social Service | 40 (45.5%) | 48 (54.5%) |
| Education, Arts & Media | 32 (54.2%) | 27 (45.8%) |
| Legal Services & Support | 0 (0.0%) | 0 (0.0%) |
| Education Instruction & Library | 8 (40.0%) | 12 (60.0%) |
| Arts, Media & Entertainment | 0 (0.0%) | 9 (100.0%) |
| Health Diagnosing & Treating | 132 (67.7%) | 63 (32.3%) |
| Health Technologists | 11 (28.9%) | 27 (71.1%) |
| Total (Category) | 276 (64.5%) | 152 (35.5%) |
| Total (Overall) | 839 (56.0%) | 660 (44.0%) |
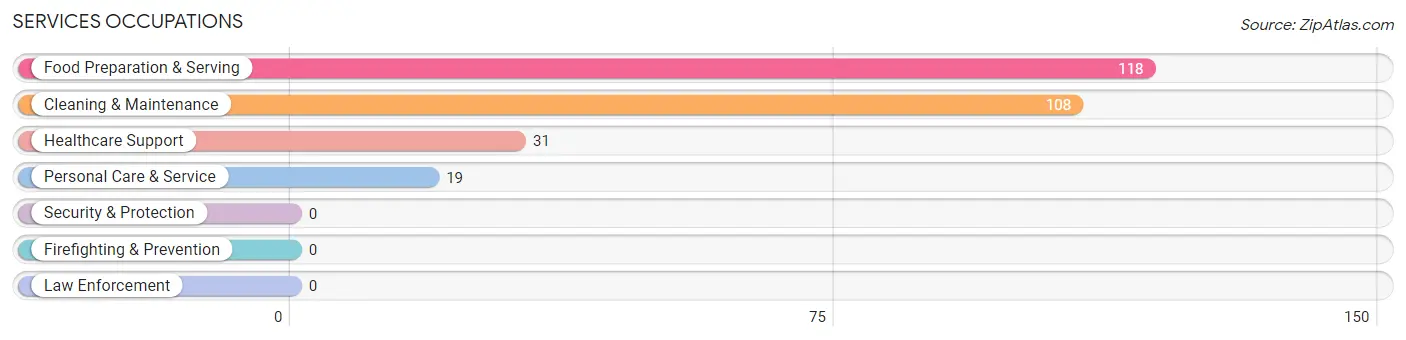
Services Occupations
The most common Services occupations in Bicknell are Food Preparation & Serving (118 | 7.9%), Cleaning & Maintenance (108 | 7.2%), Healthcare Support (31 | 2.1%), and Personal Care & Service (19 | 1.3%).
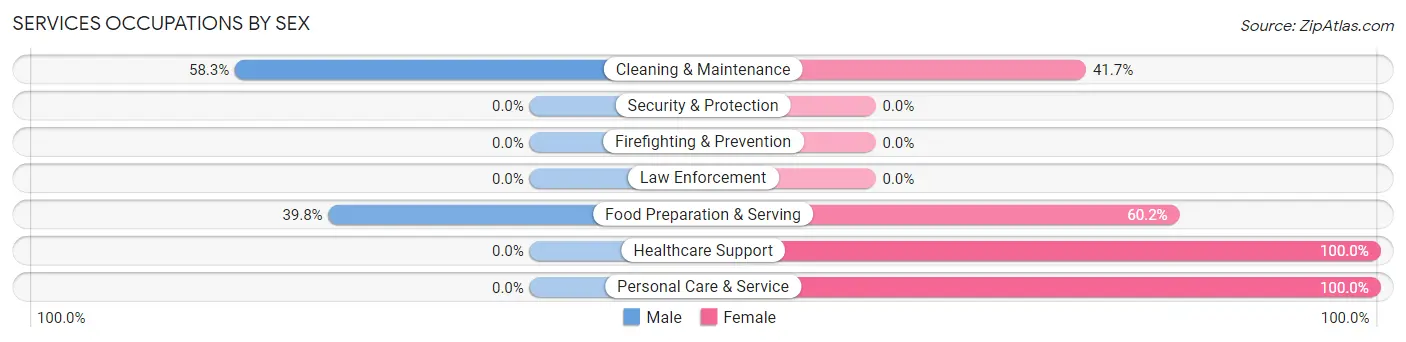
Services Occupations by Sex
Within the Services occupations in Bicknell, the most male-oriented occupations are Cleaning & Maintenance (58.3%), and Food Preparation & Serving (39.8%), while the most female-oriented occupations are Healthcare Support (100.0%), Personal Care & Service (100.0%), and Food Preparation & Serving (60.2%).
| Occupation | Male | Female |
| Healthcare Support | 0 (0.0%) | 31 (100.0%) |
| Security & Protection | 0 (0.0%) | 0 (0.0%) |
| Firefighting & Prevention | 0 (0.0%) | 0 (0.0%) |
| Law Enforcement | 0 (0.0%) | 0 (0.0%) |
| Food Preparation & Serving | 47 (39.8%) | 71 (60.2%) |
| Cleaning & Maintenance | 63 (58.3%) | 45 (41.7%) |
| Personal Care & Service | 0 (0.0%) | 19 (100.0%) |
| Total (Category) | 110 (39.9%) | 166 (60.1%) |
| Total (Overall) | 839 (56.0%) | 660 (44.0%) |
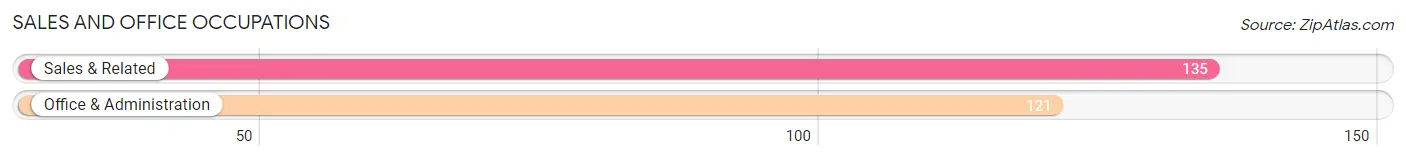
Sales and Office Occupations
The most common Sales and Office occupations in Bicknell are Sales & Related (135 | 9.0%), and Office & Administration (121 | 8.1%).
Sales and Office Occupations by Sex
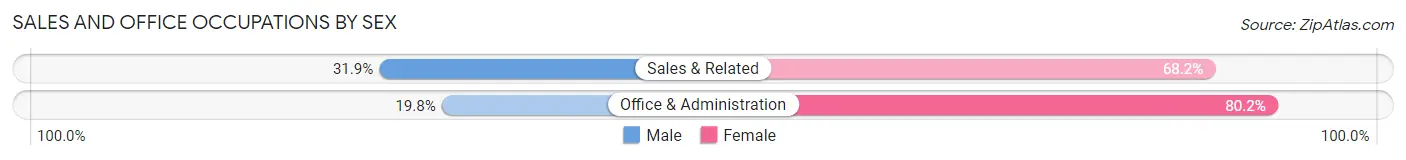
| Occupation | Male | Female |
| Sales & Related | 43 (31.9%) | 92 (68.1%) |
| Office & Administration | 24 (19.8%) | 97 (80.2%) |
| Total (Category) | 67 (26.2%) | 189 (73.8%) |
| Total (Overall) | 839 (56.0%) | 660 (44.0%) |
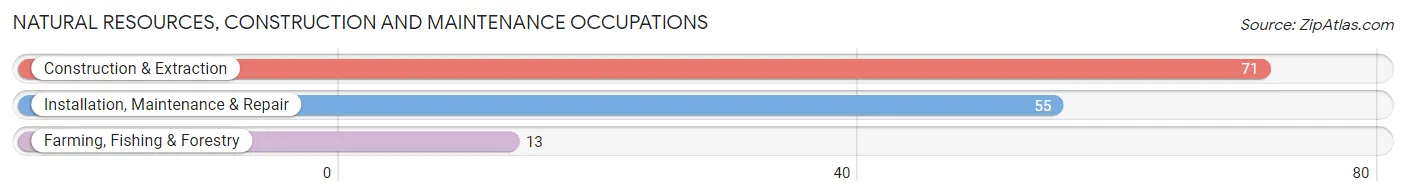
Natural Resources, Construction and Maintenance Occupations
The most common Natural Resources, Construction and Maintenance occupations in Bicknell are Construction & Extraction (71 | 4.7%), Installation, Maintenance & Repair (55 | 3.7%), and Farming, Fishing & Forestry (13 | 0.9%).
Natural Resources, Construction and Maintenance Occupations by Sex
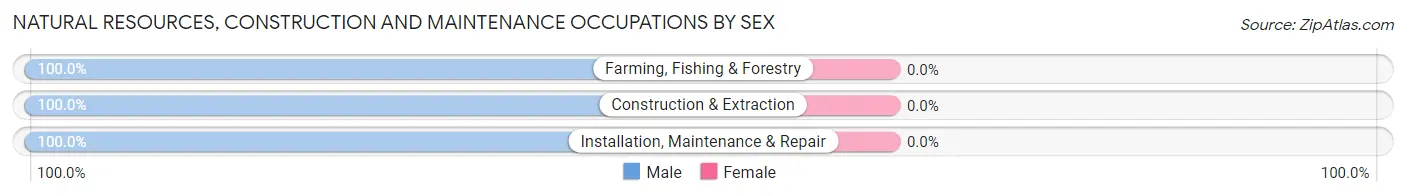
| Occupation | Male | Female |
| Farming, Fishing & Forestry | 13 (100.0%) | 0 (0.0%) |
| Construction & Extraction | 71 (100.0%) | 0 (0.0%) |
| Installation, Maintenance & Repair | 55 (100.0%) | 0 (0.0%) |
| Total (Category) | 139 (100.0%) | 0 (0.0%) |
| Total (Overall) | 839 (56.0%) | 660 (44.0%) |
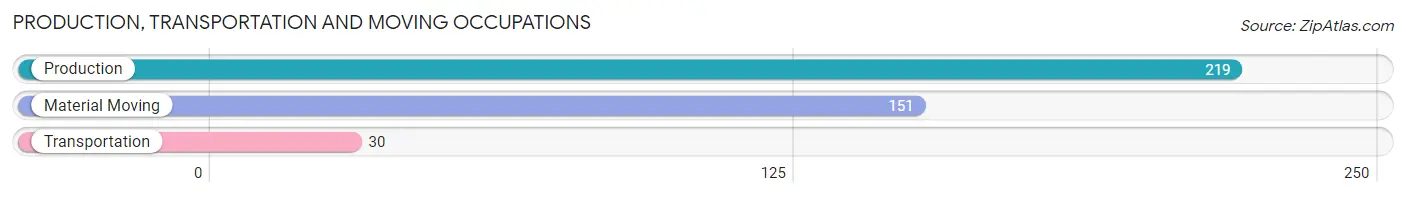
Production, Transportation and Moving Occupations
The most common Production, Transportation and Moving occupations in Bicknell are Production (219 | 14.6%), Material Moving (151 | 10.1%), and Transportation (30 | 2.0%).
Production, Transportation and Moving Occupations by Sex
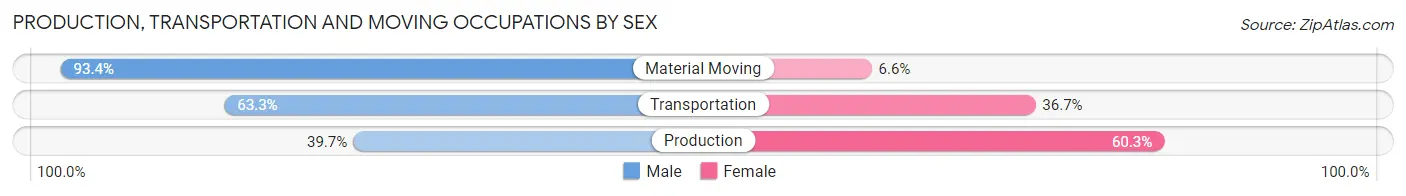
| Occupation | Male | Female |
| Production | 87 (39.7%) | 132 (60.3%) |
| Transportation | 19 (63.3%) | 11 (36.7%) |
| Material Moving | 141 (93.4%) | 10 (6.6%) |
| Total (Category) | 247 (61.8%) | 153 (38.3%) |
| Total (Overall) | 839 (56.0%) | 660 (44.0%) |
Employment Industries by Sex in Bicknell
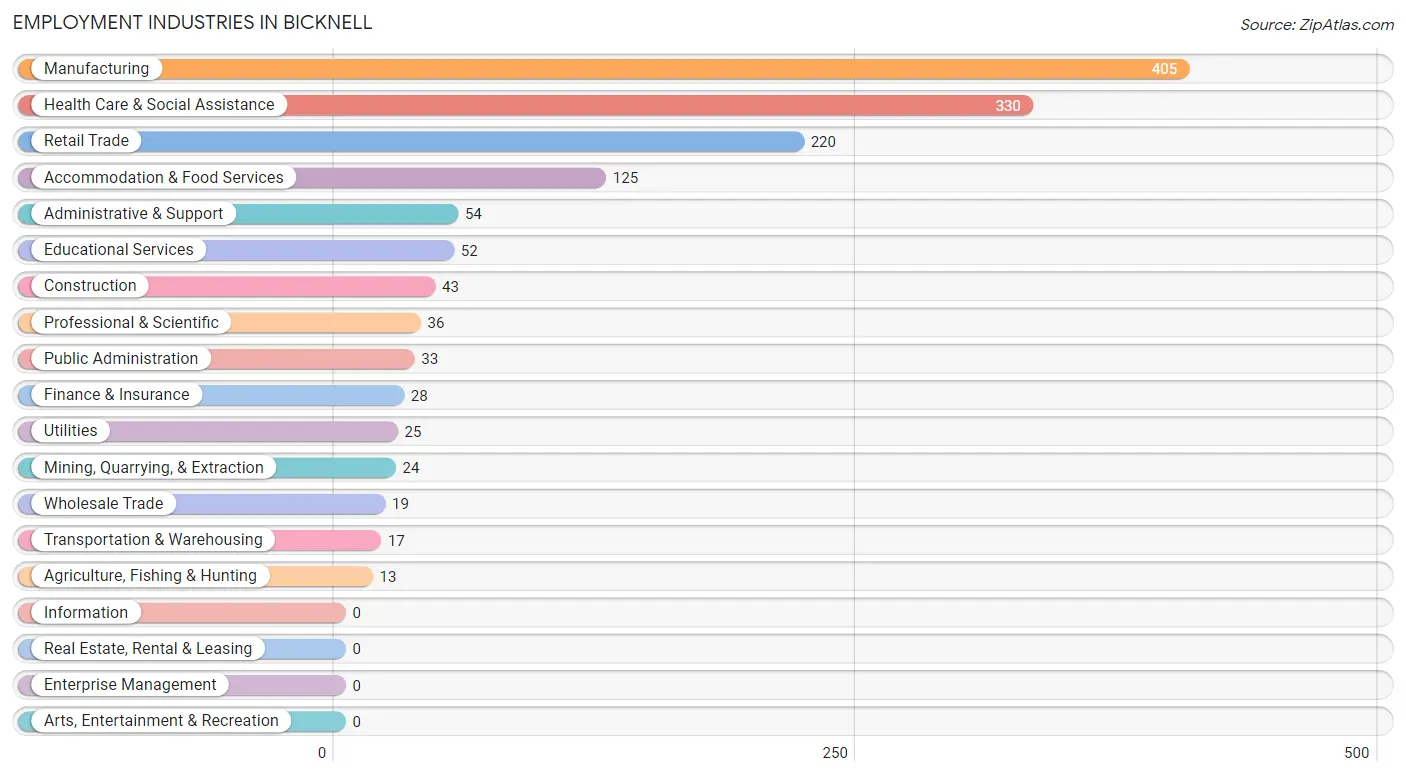
Employment Industries in Bicknell
The major employment industries in Bicknell include Manufacturing (405 | 27.0%), Health Care & Social Assistance (330 | 22.0%), Retail Trade (220 | 14.7%), Accommodation & Food Services (125 | 8.3%), and Administrative & Support (54 | 3.6%).
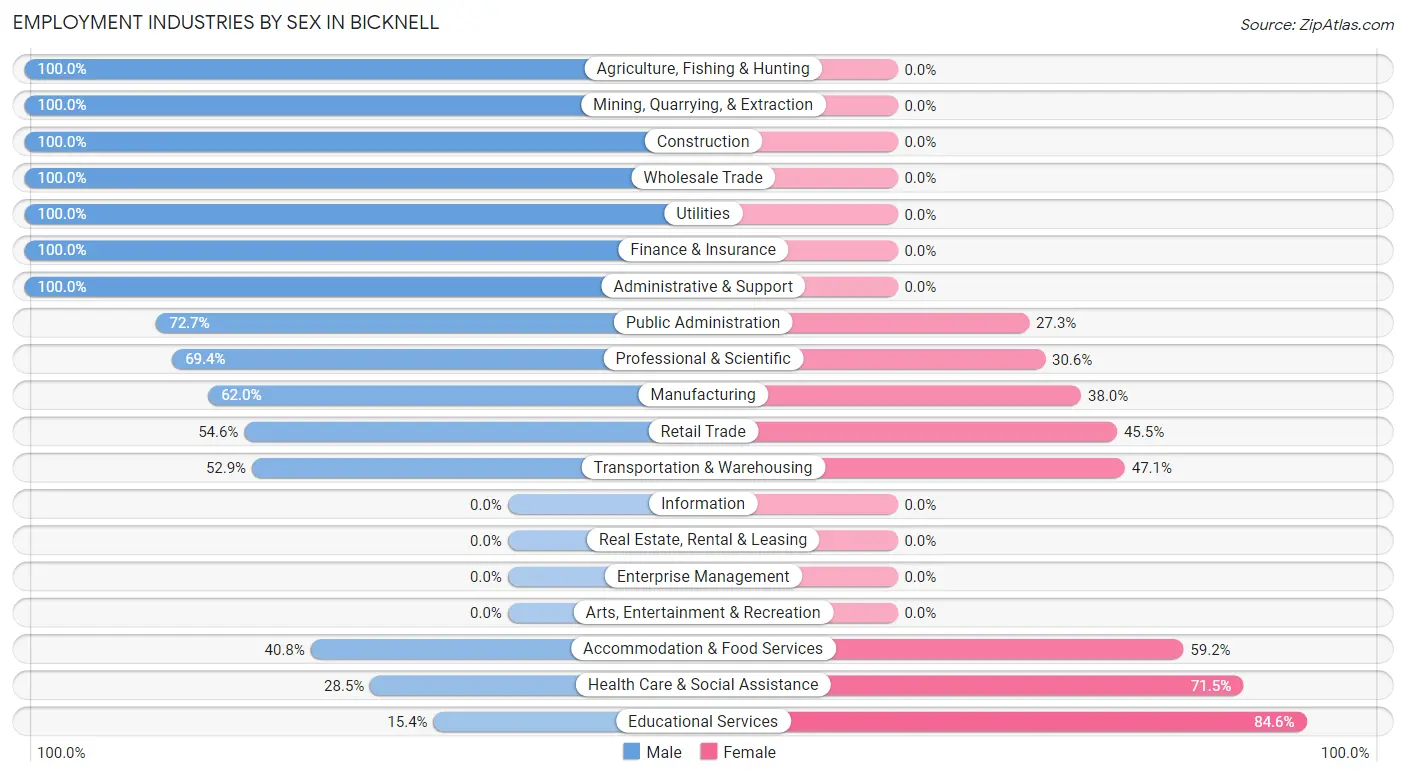
Employment Industries by Sex in Bicknell
The Bicknell industries that see more men than women are Agriculture, Fishing & Hunting (100.0%), Mining, Quarrying, & Extraction (100.0%), and Construction (100.0%), whereas the industries that tend to have a higher number of women are Educational Services (84.6%), Health Care & Social Assistance (71.5%), and Accommodation & Food Services (59.2%).
| Industry | Male | Female |
| Agriculture, Fishing & Hunting | 13 (100.0%) | 0 (0.0%) |
| Mining, Quarrying, & Extraction | 24 (100.0%) | 0 (0.0%) |
| Construction | 43 (100.0%) | 0 (0.0%) |
| Manufacturing | 251 (62.0%) | 154 (38.0%) |
| Wholesale Trade | 19 (100.0%) | 0 (0.0%) |
| Retail Trade | 120 (54.5%) | 100 (45.5%) |
| Transportation & Warehousing | 9 (52.9%) | 8 (47.1%) |
| Utilities | 25 (100.0%) | 0 (0.0%) |
| Information | 0 (0.0%) | 0 (0.0%) |
| Finance & Insurance | 28 (100.0%) | 0 (0.0%) |
| Real Estate, Rental & Leasing | 0 (0.0%) | 0 (0.0%) |
| Professional & Scientific | 25 (69.4%) | 11 (30.6%) |
| Enterprise Management | 0 (0.0%) | 0 (0.0%) |
| Administrative & Support | 54 (100.0%) | 0 (0.0%) |
| Educational Services | 8 (15.4%) | 44 (84.6%) |
| Health Care & Social Assistance | 94 (28.5%) | 236 (71.5%) |
| Arts, Entertainment & Recreation | 0 (0.0%) | 0 (0.0%) |
| Accommodation & Food Services | 51 (40.8%) | 74 (59.2%) |
| Public Administration | 24 (72.7%) | 9 (27.3%) |
| Total | 839 (56.0%) | 660 (44.0%) |
Education in Bicknell
School Enrollment in Bicknell
The most common levels of schooling among the 590 students in Bicknell are elementary school (165 | 28.0%), high school (145 | 24.6%), and college / undergraduate (106 | 18.0%).
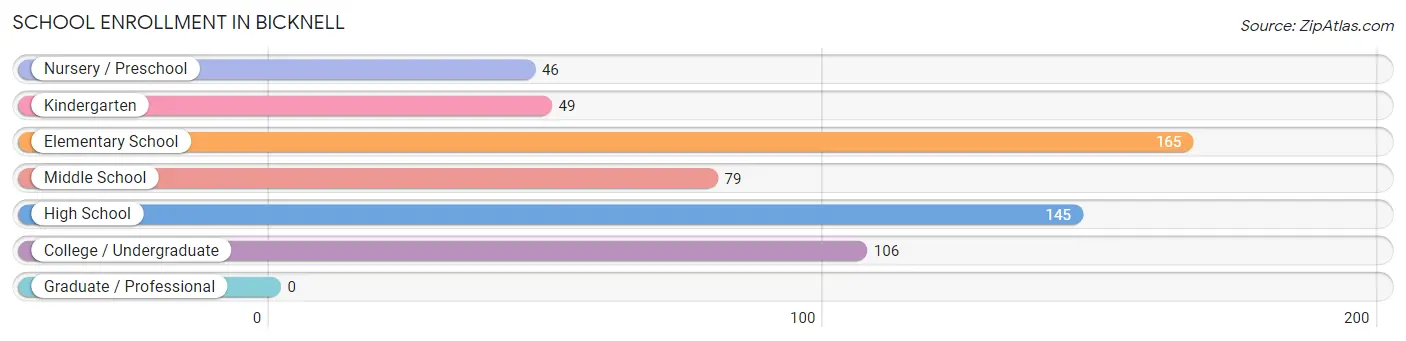
| School Level | # Students | % Students |
| Nursery / Preschool | 46 | 7.8% |
| Kindergarten | 49 | 8.3% |
| Elementary School | 165 | 28.0% |
| Middle School | 79 | 13.4% |
| High School | 145 | 24.6% |
| College / Undergraduate | 106 | 18.0% |
| Graduate / Professional | 0 | 0.0% |
| Total | 590 | 100.0% |
School Enrollment by Age by Funding Source in Bicknell
Out of a total of 590 students who are enrolled in schools in Bicknell, 113 (19.2%) attend a private institution, while the remaining 477 (80.8%) are enrolled in public schools. The age group of 20 to 24 year olds has the highest likelihood of being enrolled in private schools, with 20 (32.8% in the age bracket) enrolled. Conversely, the age group of 3 to 4 year olds has the lowest likelihood of being enrolled in a private school, with 13 (100.0% in the age bracket) attending a public institution.
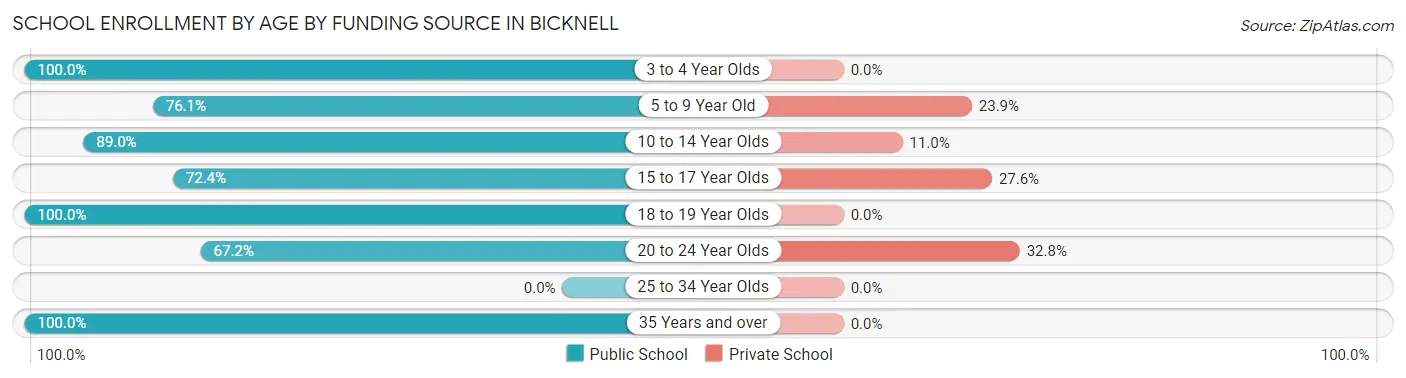
| Age Bracket | Public School | Private School |
| 3 to 4 Year Olds | 13 (100.0%) | 0 (0.0%) |
| 5 to 9 Year Old | 153 (76.1%) | 48 (23.9%) |
| 10 to 14 Year Olds | 130 (89.0%) | 16 (11.0%) |
| 15 to 17 Year Olds | 76 (72.4%) | 29 (27.6%) |
| 18 to 19 Year Olds | 19 (100.0%) | 0 (0.0%) |
| 20 to 24 Year Olds | 41 (67.2%) | 20 (32.8%) |
| 25 to 34 Year Olds | 0 (0.0%) | 0 (0.0%) |
| 35 Years and over | 45 (100.0%) | 0 (0.0%) |
| Total | 477 (80.8%) | 113 (19.2%) |
Educational Attainment by Field of Study in Bicknell
Social sciences (59 | 26.7%), business (49 | 22.2%), science & technology (25 | 11.3%), computers & mathematics (24 | 10.9%), and liberal arts & history (19 | 8.6%) are the most common fields of study among 221 individuals in Bicknell who have obtained a bachelor's degree or higher.
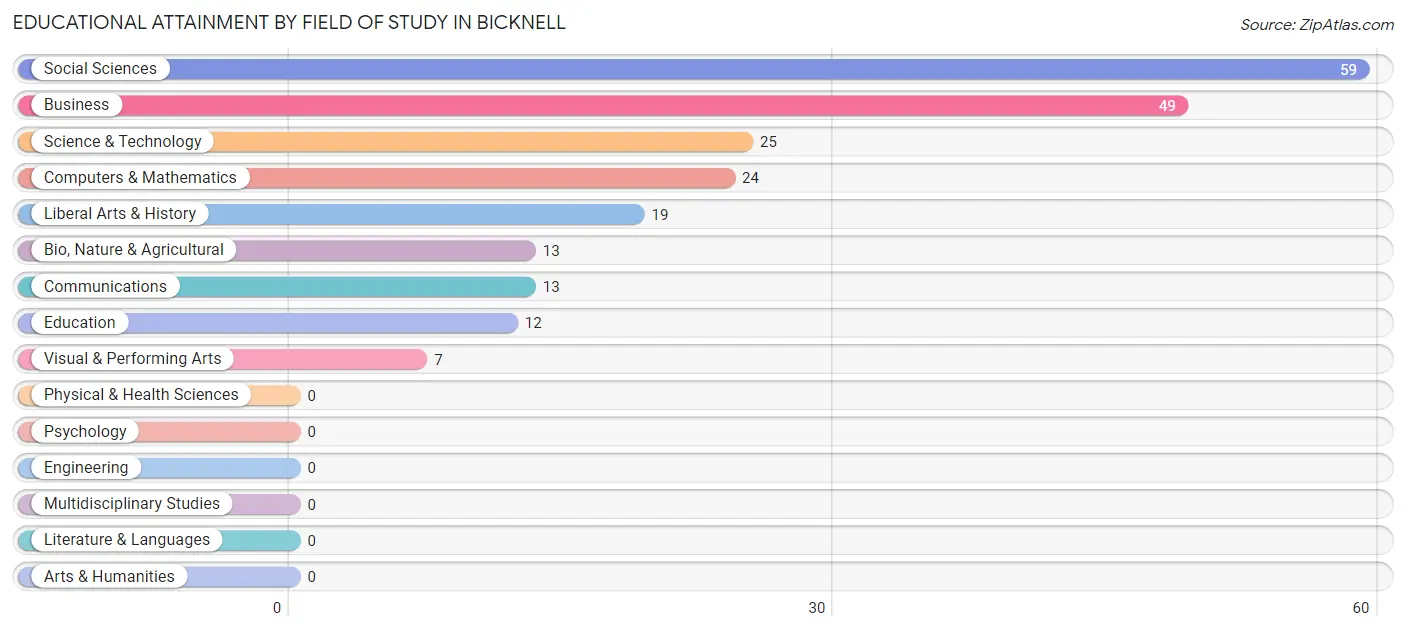
| Field of Study | # Graduates | % Graduates |
| Computers & Mathematics | 24 | 10.9% |
| Bio, Nature & Agricultural | 13 | 5.9% |
| Physical & Health Sciences | 0 | 0.0% |
| Psychology | 0 | 0.0% |
| Social Sciences | 59 | 26.7% |
| Engineering | 0 | 0.0% |
| Multidisciplinary Studies | 0 | 0.0% |
| Science & Technology | 25 | 11.3% |
| Business | 49 | 22.2% |
| Education | 12 | 5.4% |
| Literature & Languages | 0 | 0.0% |
| Liberal Arts & History | 19 | 8.6% |
| Visual & Performing Arts | 7 | 3.2% |
| Communications | 13 | 5.9% |
| Arts & Humanities | 0 | 0.0% |
| Total | 221 | 100.0% |
Transportation & Commute in Bicknell
Vehicle Availability by Sex in Bicknell
The most prevalent vehicle ownership categories in Bicknell are males with 2 vehicles (316, accounting for 37.7%) and females with 2 vehicles (268, making up 47.9%).
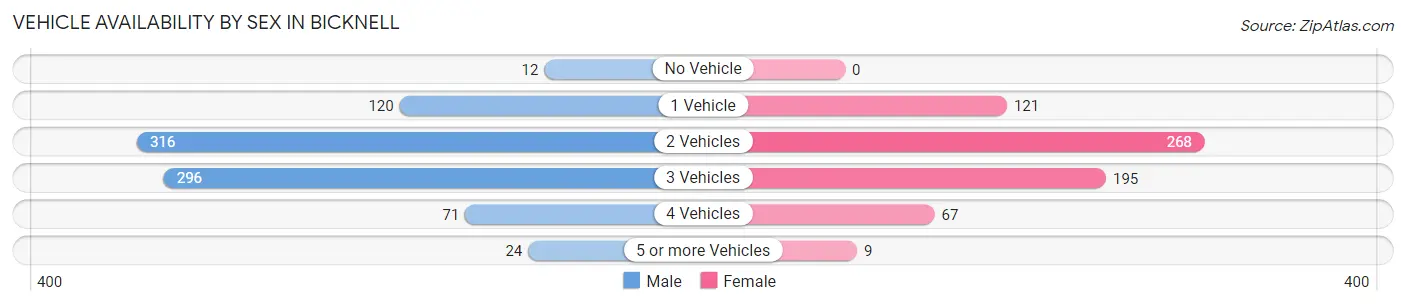
| Vehicles Available | Male | Female |
| No Vehicle | 12 (1.4%) | 0 (0.0%) |
| 1 Vehicle | 120 (14.3%) | 121 (18.3%) |
| 2 Vehicles | 316 (37.7%) | 268 (40.6%) |
| 3 Vehicles | 296 (35.3%) | 195 (29.5%) |
| 4 Vehicles | 71 (8.5%) | 67 (10.2%) |
| 5 or more Vehicles | 24 (2.9%) | 9 (1.4%) |
| Total | 839 (100.0%) | 660 (100.0%) |
Commute Time in Bicknell
The most frequently occuring commute durations in Bicknell are 30 to 34 minutes (493 commuters, 34.1%), 20 to 24 minutes (212 commuters, 14.7%), and 25 to 29 minutes (149 commuters, 10.3%).
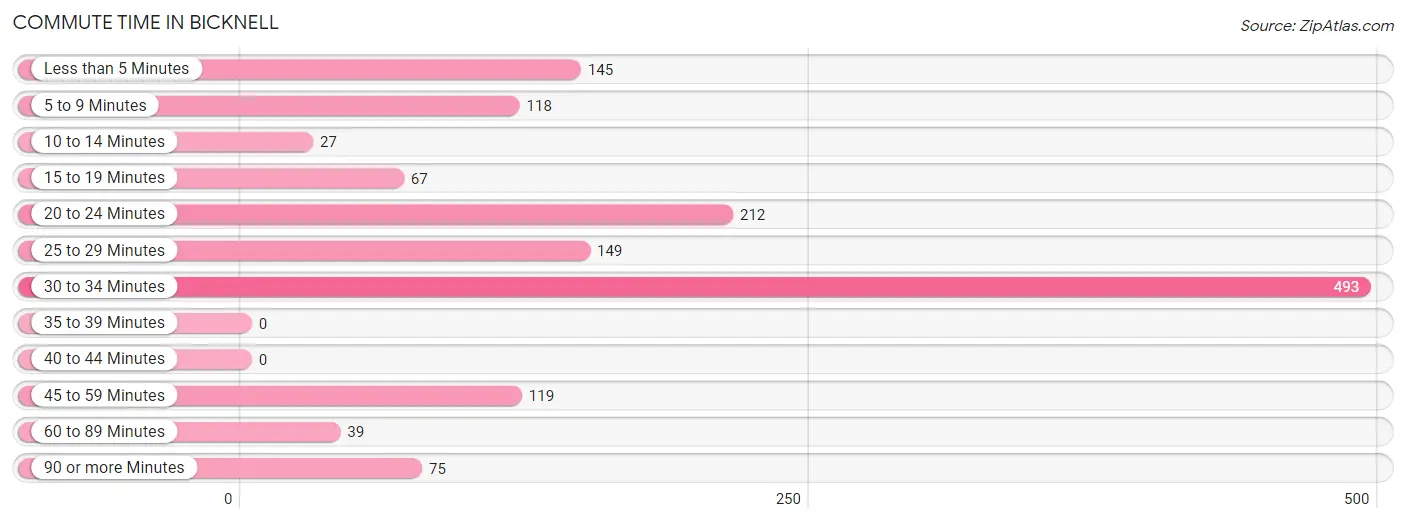
| Commute Time | # Commuters | % Commuters |
| Less than 5 Minutes | 145 | 10.0% |
| 5 to 9 Minutes | 118 | 8.2% |
| 10 to 14 Minutes | 27 | 1.9% |
| 15 to 19 Minutes | 67 | 4.6% |
| 20 to 24 Minutes | 212 | 14.7% |
| 25 to 29 Minutes | 149 | 10.3% |
| 30 to 34 Minutes | 493 | 34.1% |
| 35 to 39 Minutes | 0 | 0.0% |
| 40 to 44 Minutes | 0 | 0.0% |
| 45 to 59 Minutes | 119 | 8.2% |
| 60 to 89 Minutes | 39 | 2.7% |
| 90 or more Minutes | 75 | 5.2% |
Commute Time by Sex in Bicknell
The most common commute times in Bicknell are 30 to 34 minutes (313 commuters, 39.0%) for males and 30 to 34 minutes (180 commuters, 28.0%) for females.
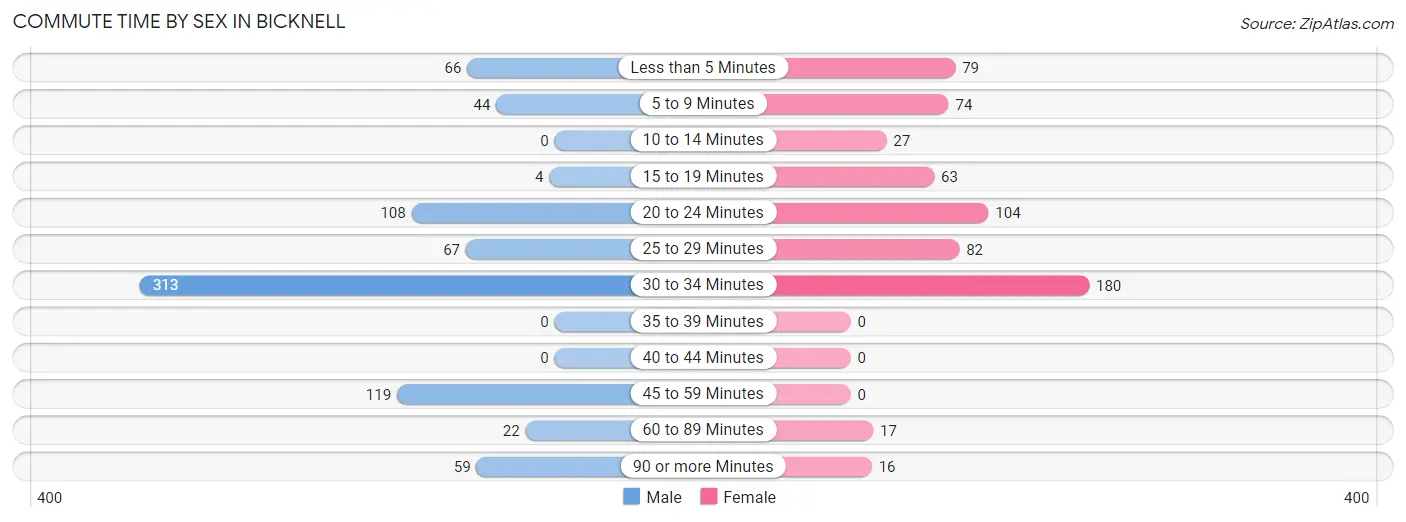
| Commute Time | Male | Female |
| Less than 5 Minutes | 66 (8.2%) | 79 (12.3%) |
| 5 to 9 Minutes | 44 (5.5%) | 74 (11.5%) |
| 10 to 14 Minutes | 0 (0.0%) | 27 (4.2%) |
| 15 to 19 Minutes | 4 (0.5%) | 63 (9.8%) |
| 20 to 24 Minutes | 108 (13.5%) | 104 (16.2%) |
| 25 to 29 Minutes | 67 (8.4%) | 82 (12.8%) |
| 30 to 34 Minutes | 313 (39.0%) | 180 (28.0%) |
| 35 to 39 Minutes | 0 (0.0%) | 0 (0.0%) |
| 40 to 44 Minutes | 0 (0.0%) | 0 (0.0%) |
| 45 to 59 Minutes | 119 (14.8%) | 0 (0.0%) |
| 60 to 89 Minutes | 22 (2.7%) | 17 (2.6%) |
| 90 or more Minutes | 59 (7.4%) | 16 (2.5%) |
Time of Departure to Work by Sex in Bicknell
The most frequent times of departure to work in Bicknell are 4:00 PM to 11:59 PM (167, 20.8%) for males and 7:00 AM to 7:29 AM (101, 15.7%) for females.
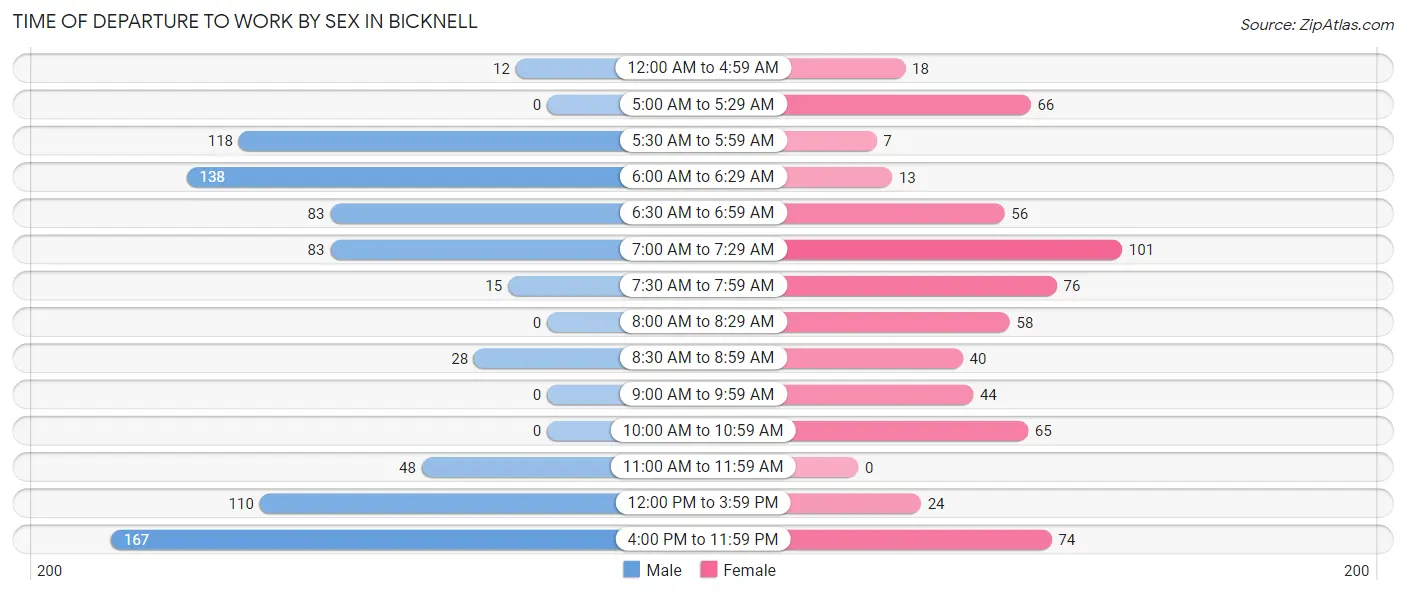
| Time of Departure | Male | Female |
| 12:00 AM to 4:59 AM | 12 (1.5%) | 18 (2.8%) |
| 5:00 AM to 5:29 AM | 0 (0.0%) | 66 (10.3%) |
| 5:30 AM to 5:59 AM | 118 (14.7%) | 7 (1.1%) |
| 6:00 AM to 6:29 AM | 138 (17.2%) | 13 (2.0%) |
| 6:30 AM to 6:59 AM | 83 (10.3%) | 56 (8.7%) |
| 7:00 AM to 7:29 AM | 83 (10.3%) | 101 (15.7%) |
| 7:30 AM to 7:59 AM | 15 (1.9%) | 76 (11.8%) |
| 8:00 AM to 8:29 AM | 0 (0.0%) | 58 (9.0%) |
| 8:30 AM to 8:59 AM | 28 (3.5%) | 40 (6.2%) |
| 9:00 AM to 9:59 AM | 0 (0.0%) | 44 (6.9%) |
| 10:00 AM to 10:59 AM | 0 (0.0%) | 65 (10.1%) |
| 11:00 AM to 11:59 AM | 48 (6.0%) | 0 (0.0%) |
| 12:00 PM to 3:59 PM | 110 (13.7%) | 24 (3.7%) |
| 4:00 PM to 11:59 PM | 167 (20.8%) | 74 (11.5%) |
| Total | 802 (100.0%) | 642 (100.0%) |
Housing Occupancy in Bicknell
Occupancy by Ownership in Bicknell
Of the total 1,270 dwellings in Bicknell, owner-occupied units account for 846 (66.6%), while renter-occupied units make up 424 (33.4%).
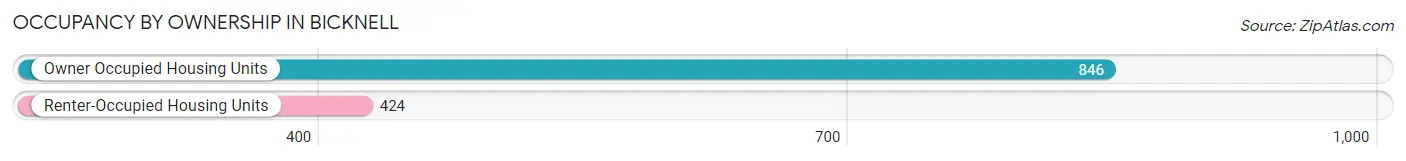
| Occupancy | # Housing Units | % Housing Units |
| Owner Occupied Housing Units | 846 | 66.6% |
| Renter-Occupied Housing Units | 424 | 33.4% |
| Total Occupied Housing Units | 1,270 | 100.0% |
Occupancy by Household Size in Bicknell
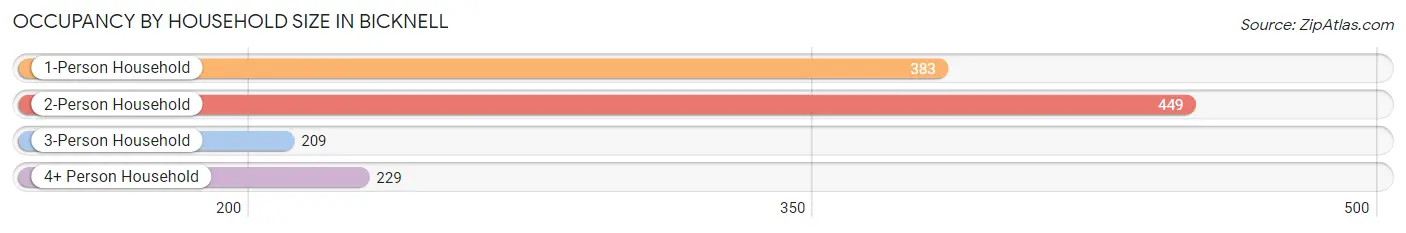
| Household Size | # Housing Units | % Housing Units |
| 1-Person Household | 383 | 30.2% |
| 2-Person Household | 449 | 35.3% |
| 3-Person Household | 209 | 16.5% |
| 4+ Person Household | 229 | 18.0% |
| Total Housing Units | 1,270 | 100.0% |
Occupancy by Ownership by Household Size in Bicknell
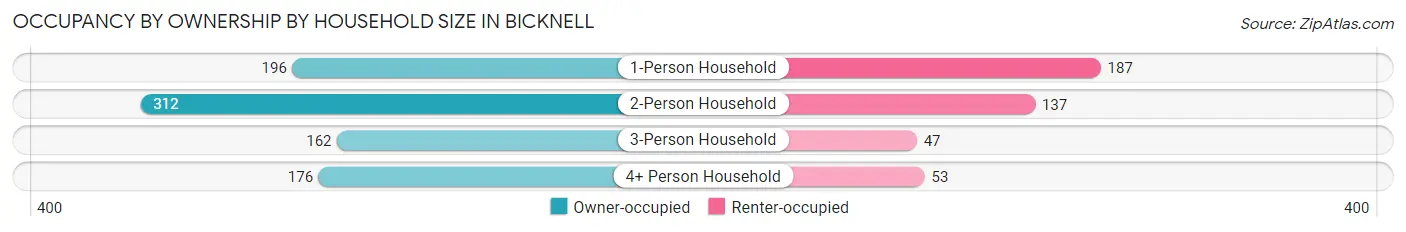
| Household Size | Owner-occupied | Renter-occupied |
| 1-Person Household | 196 (51.2%) | 187 (48.8%) |
| 2-Person Household | 312 (69.5%) | 137 (30.5%) |
| 3-Person Household | 162 (77.5%) | 47 (22.5%) |
| 4+ Person Household | 176 (76.9%) | 53 (23.1%) |
| Total Housing Units | 846 (66.6%) | 424 (33.4%) |
Occupancy by Educational Attainment in Bicknell
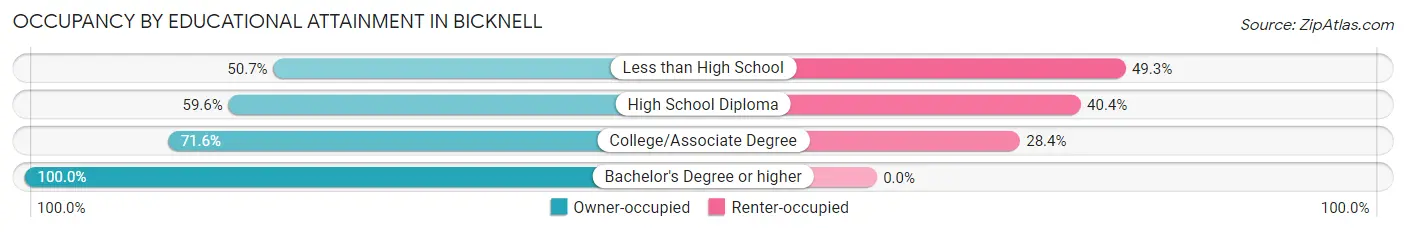
| Household Size | Owner-occupied | Renter-occupied |
| Less than High School | 76 (50.7%) | 74 (49.3%) |
| High School Diploma | 302 (59.6%) | 205 (40.4%) |
| College/Associate Degree | 366 (71.6%) | 145 (28.4%) |
| Bachelor's Degree or higher | 102 (100.0%) | 0 (0.0%) |
Occupancy by Age of Householder in Bicknell
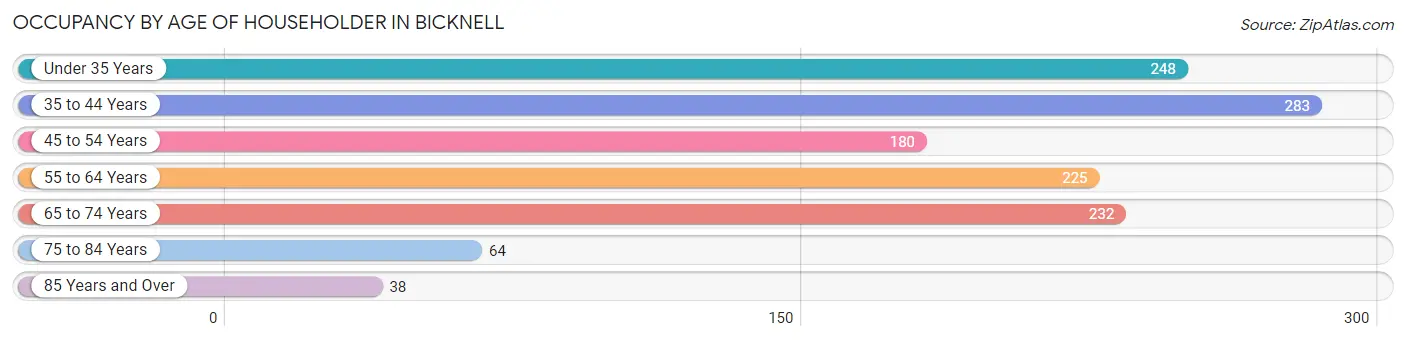
| Age Bracket | # Households | % Households |
| Under 35 Years | 248 | 19.5% |
| 35 to 44 Years | 283 | 22.3% |
| 45 to 54 Years | 180 | 14.2% |
| 55 to 64 Years | 225 | 17.7% |
| 65 to 74 Years | 232 | 18.3% |
| 75 to 84 Years | 64 | 5.0% |
| 85 Years and Over | 38 | 3.0% |
| Total | 1,270 | 100.0% |
Housing Finances in Bicknell
Median Income by Occupancy in Bicknell
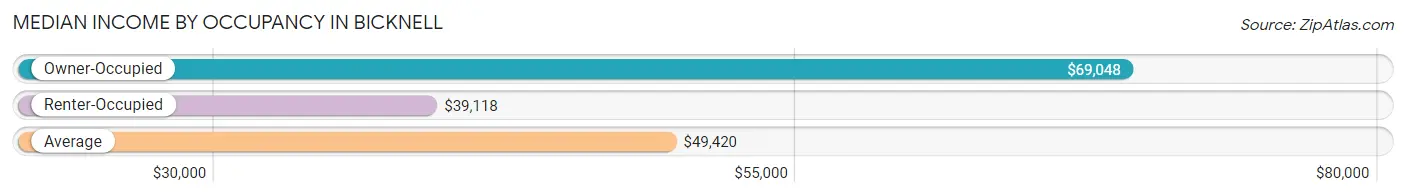
| Occupancy Type | # Households | Median Income |
| Owner-Occupied | 846 (66.6%) | $69,048 |
| Renter-Occupied | 424 (33.4%) | $39,118 |
| Average | 1,270 (100.0%) | $49,420 |
Occupancy by Householder Income Bracket in Bicknell
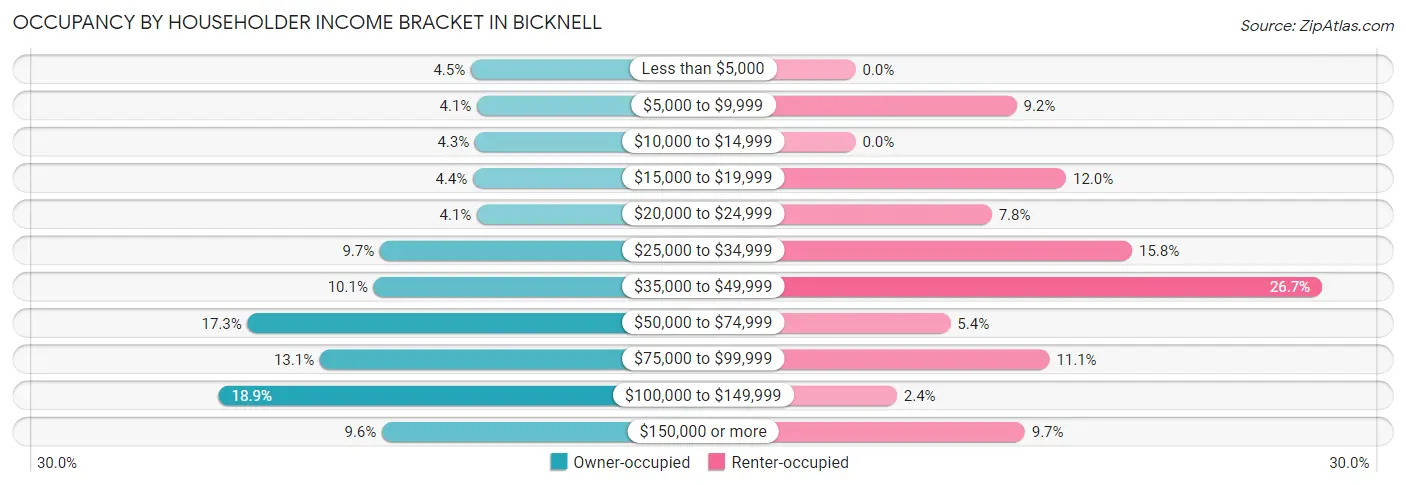
| Income Bracket | Owner-occupied | Renter-occupied |
| Less than $5,000 | 38 (4.5%) | 0 (0.0%) |
| $5,000 to $9,999 | 35 (4.1%) | 39 (9.2%) |
| $10,000 to $14,999 | 36 (4.3%) | 0 (0.0%) |
| $15,000 to $19,999 | 37 (4.4%) | 51 (12.0%) |
| $20,000 to $24,999 | 35 (4.1%) | 33 (7.8%) |
| $25,000 to $34,999 | 82 (9.7%) | 67 (15.8%) |
| $35,000 to $49,999 | 85 (10.1%) | 113 (26.7%) |
| $50,000 to $74,999 | 146 (17.3%) | 23 (5.4%) |
| $75,000 to $99,999 | 111 (13.1%) | 47 (11.1%) |
| $100,000 to $149,999 | 160 (18.9%) | 10 (2.4%) |
| $150,000 or more | 81 (9.6%) | 41 (9.7%) |
| Total | 846 (100.0%) | 424 (100.0%) |
Monthly Housing Cost Tiers in Bicknell
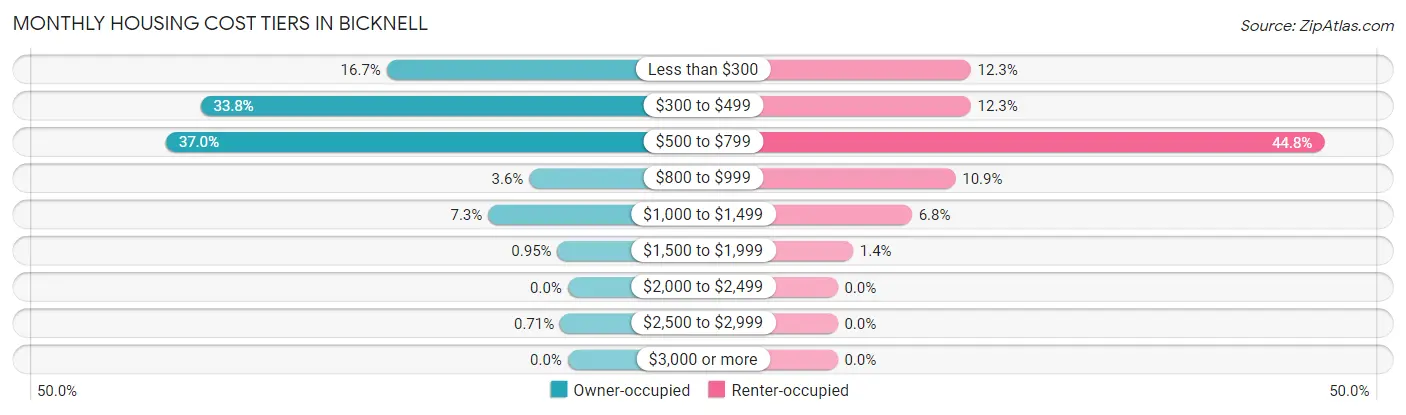
| Monthly Cost | Owner-occupied | Renter-occupied |
| Less than $300 | 141 (16.7%) | 52 (12.3%) |
| $300 to $499 | 286 (33.8%) | 52 (12.3%) |
| $500 to $799 | 313 (37.0%) | 190 (44.8%) |
| $800 to $999 | 30 (3.5%) | 46 (10.8%) |
| $1,000 to $1,499 | 62 (7.3%) | 29 (6.8%) |
| $1,500 to $1,999 | 8 (0.9%) | 6 (1.4%) |
| $2,000 to $2,499 | 0 (0.0%) | 0 (0.0%) |
| $2,500 to $2,999 | 6 (0.7%) | 0 (0.0%) |
| $3,000 or more | 0 (0.0%) | 0 (0.0%) |
| Total | 846 (100.0%) | 424 (100.0%) |
Physical Housing Characteristics in Bicknell
Housing Structures in Bicknell
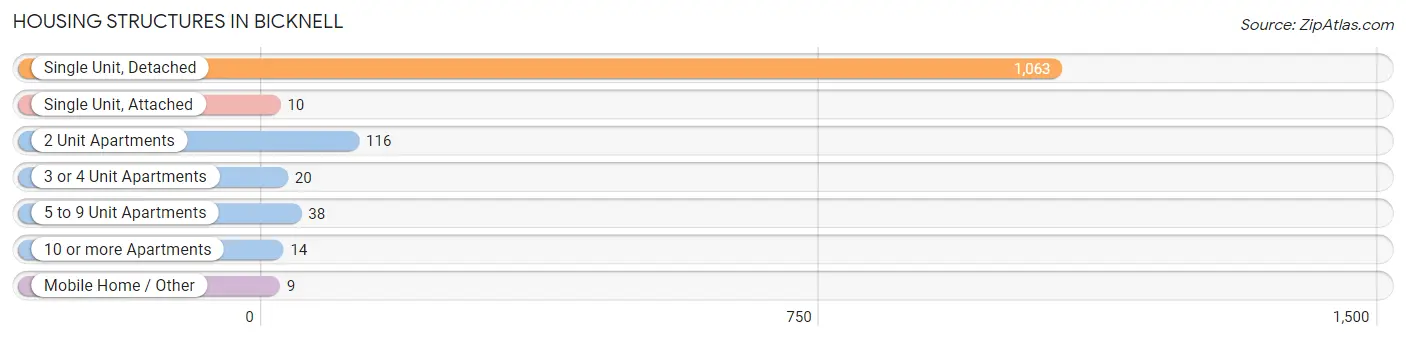
| Structure Type | # Housing Units | % Housing Units |
| Single Unit, Detached | 1,063 | 83.7% |
| Single Unit, Attached | 10 | 0.8% |
| 2 Unit Apartments | 116 | 9.1% |
| 3 or 4 Unit Apartments | 20 | 1.6% |
| 5 to 9 Unit Apartments | 38 | 3.0% |
| 10 or more Apartments | 14 | 1.1% |
| Mobile Home / Other | 9 | 0.7% |
| Total | 1,270 | 100.0% |
Housing Structures by Occupancy in Bicknell
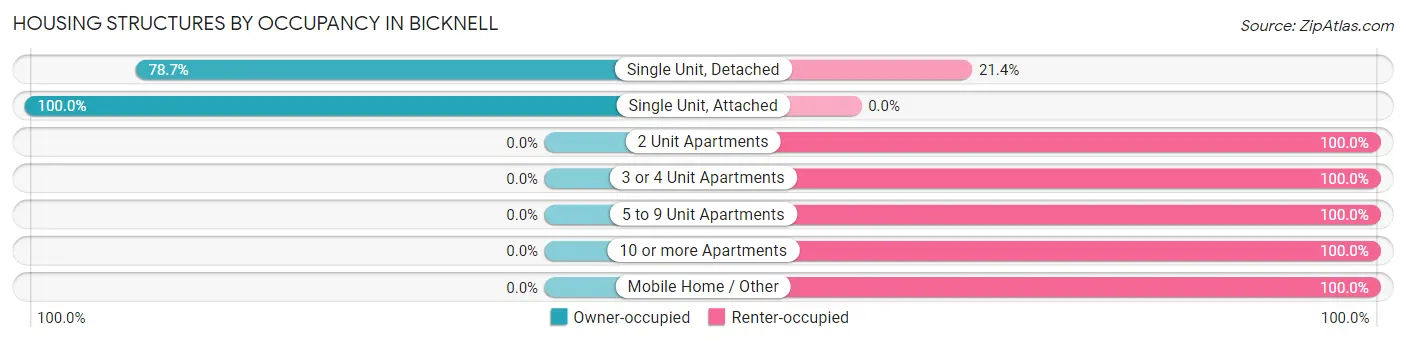
| Structure Type | Owner-occupied | Renter-occupied |
| Single Unit, Detached | 836 (78.6%) | 227 (21.3%) |
| Single Unit, Attached | 10 (100.0%) | 0 (0.0%) |
| 2 Unit Apartments | 0 (0.0%) | 116 (100.0%) |
| 3 or 4 Unit Apartments | 0 (0.0%) | 20 (100.0%) |
| 5 to 9 Unit Apartments | 0 (0.0%) | 38 (100.0%) |
| 10 or more Apartments | 0 (0.0%) | 14 (100.0%) |
| Mobile Home / Other | 0 (0.0%) | 9 (100.0%) |
| Total | 846 (66.6%) | 424 (33.4%) |
Housing Structures by Number of Rooms in Bicknell
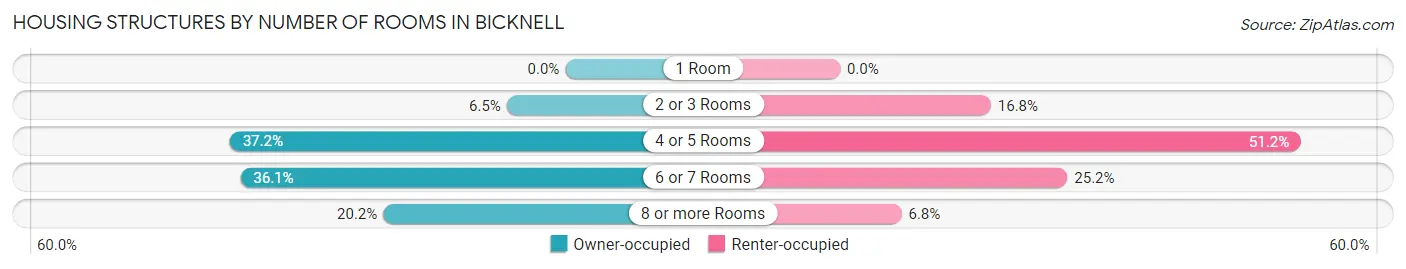
| Number of Rooms | Owner-occupied | Renter-occupied |
| 1 Room | 0 (0.0%) | 0 (0.0%) |
| 2 or 3 Rooms | 55 (6.5%) | 71 (16.8%) |
| 4 or 5 Rooms | 315 (37.2%) | 217 (51.2%) |
| 6 or 7 Rooms | 305 (36.0%) | 107 (25.2%) |
| 8 or more Rooms | 171 (20.2%) | 29 (6.8%) |
| Total | 846 (100.0%) | 424 (100.0%) |
Housing Structure by Heating Type in Bicknell
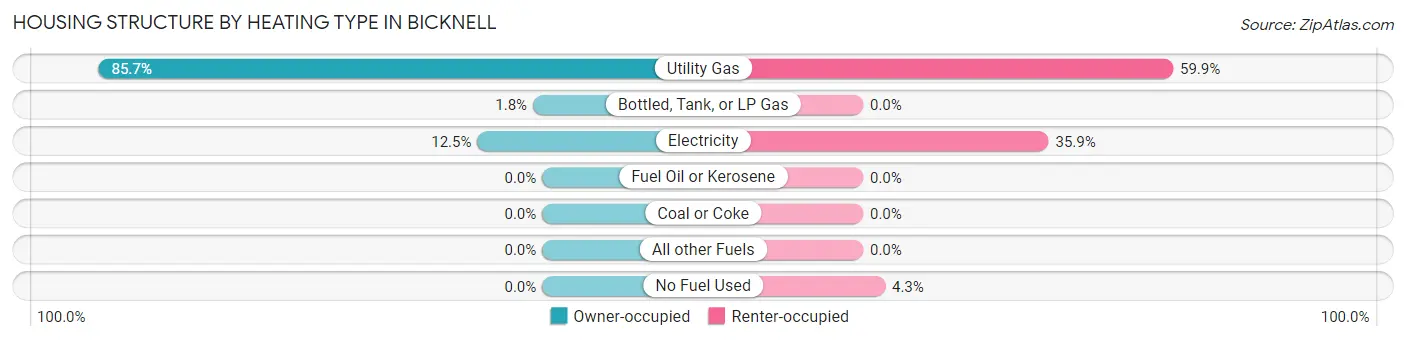
| Heating Type | Owner-occupied | Renter-occupied |
| Utility Gas | 725 (85.7%) | 254 (59.9%) |
| Bottled, Tank, or LP Gas | 15 (1.8%) | 0 (0.0%) |
| Electricity | 106 (12.5%) | 152 (35.8%) |
| Fuel Oil or Kerosene | 0 (0.0%) | 0 (0.0%) |
| Coal or Coke | 0 (0.0%) | 0 (0.0%) |
| All other Fuels | 0 (0.0%) | 0 (0.0%) |
| No Fuel Used | 0 (0.0%) | 18 (4.3%) |
| Total | 846 (100.0%) | 424 (100.0%) |
Household Vehicle Usage in Bicknell
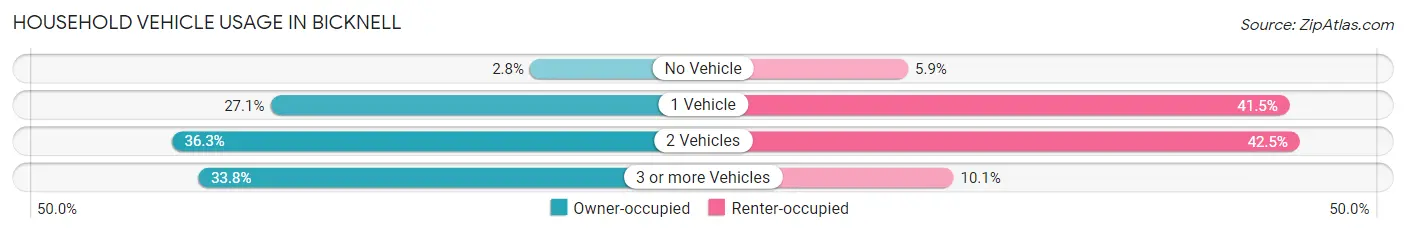
| Vehicles per Household | Owner-occupied | Renter-occupied |
| No Vehicle | 24 (2.8%) | 25 (5.9%) |
| 1 Vehicle | 229 (27.1%) | 176 (41.5%) |
| 2 Vehicles | 307 (36.3%) | 180 (42.4%) |
| 3 or more Vehicles | 286 (33.8%) | 43 (10.1%) |
| Total | 846 (100.0%) | 424 (100.0%) |
Real Estate & Mortgages in Bicknell
Real Estate and Mortgage Overview in Bicknell
| Characteristic | Without Mortgage | With Mortgage |
| Housing Units | 530 | 316 |
| Median Property Value | $48,300 | $83,300 |
| Median Household Income | $47,292 | $66 |
| Monthly Housing Costs | $391 | $0 |
| Real Estate Taxes | $497 | $43 |
Property Value by Mortgage Status in Bicknell
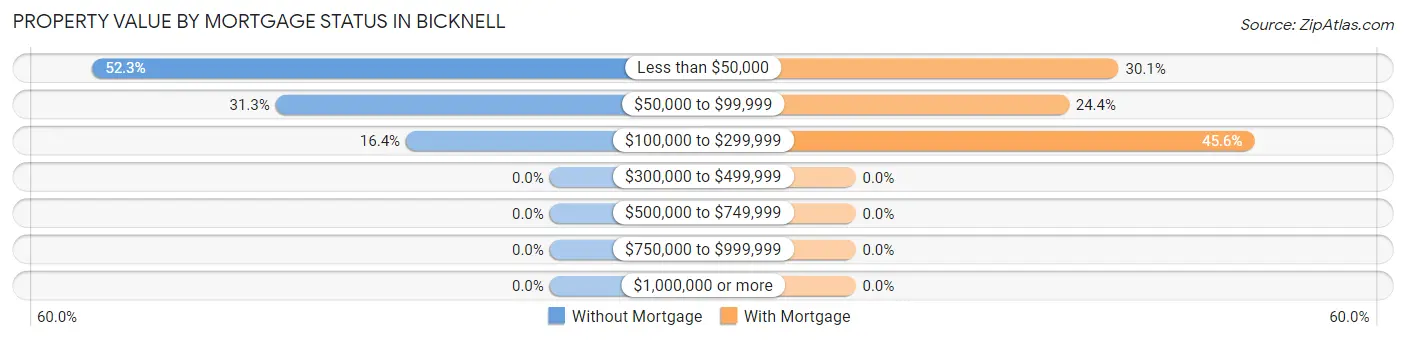
| Property Value | Without Mortgage | With Mortgage |
| Less than $50,000 | 277 (52.3%) | 95 (30.1%) |
| $50,000 to $99,999 | 166 (31.3%) | 77 (24.4%) |
| $100,000 to $299,999 | 87 (16.4%) | 144 (45.6%) |
| $300,000 to $499,999 | 0 (0.0%) | 0 (0.0%) |
| $500,000 to $749,999 | 0 (0.0%) | 0 (0.0%) |
| $750,000 to $999,999 | 0 (0.0%) | 0 (0.0%) |
| $1,000,000 or more | 0 (0.0%) | 0 (0.0%) |
| Total | 530 (100.0%) | 316 (100.0%) |
Household Income by Mortgage Status in Bicknell
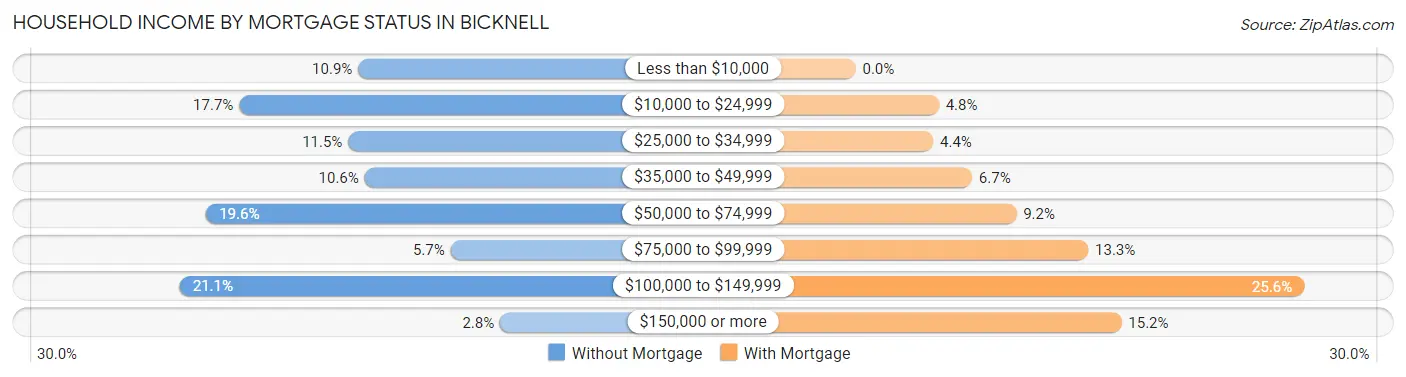
| Household Income | Without Mortgage | With Mortgage |
| Less than $10,000 | 58 (10.9%) | 0 (0.0%) |
| $10,000 to $24,999 | 94 (17.7%) | 15 (4.8%) |
| $25,000 to $34,999 | 61 (11.5%) | 14 (4.4%) |
| $35,000 to $49,999 | 56 (10.6%) | 21 (6.7%) |
| $50,000 to $74,999 | 104 (19.6%) | 29 (9.2%) |
| $75,000 to $99,999 | 30 (5.7%) | 42 (13.3%) |
| $100,000 to $149,999 | 112 (21.1%) | 81 (25.6%) |
| $150,000 or more | 15 (2.8%) | 48 (15.2%) |
| Total | 530 (100.0%) | 316 (100.0%) |
Property Value to Household Income Ratio in Bicknell
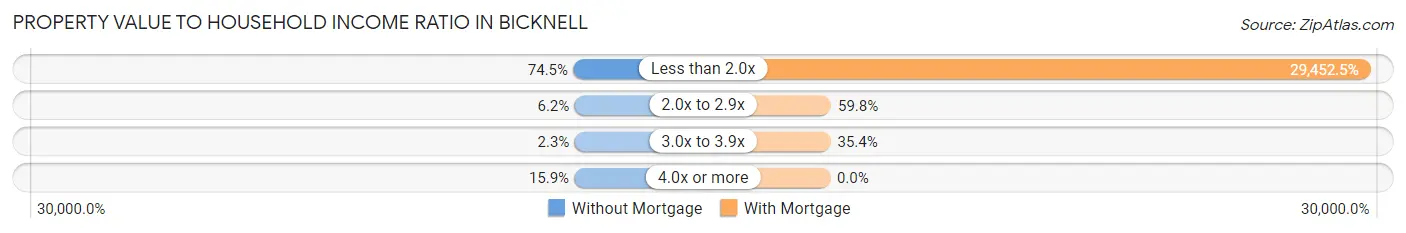
| Value-to-Income Ratio | Without Mortgage | With Mortgage |
| Less than 2.0x | 395 (74.5%) | 93,070 (29,452.5%) |
| 2.0x to 2.9x | 33 (6.2%) | 189 (59.8%) |
| 3.0x to 3.9x | 12 (2.3%) | 112 (35.4%) |
| 4.0x or more | 84 (15.9%) | 0 (0.0%) |
| Total | 530 (100.0%) | 316 (100.0%) |
Real Estate Taxes by Mortgage Status in Bicknell
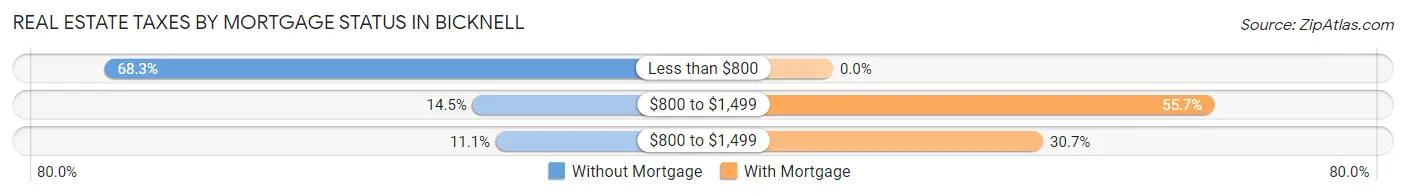
| Property Taxes | Without Mortgage | With Mortgage |
| Less than $800 | 362 (68.3%) | 0 (0.0%) |
| $800 to $1,499 | 77 (14.5%) | 176 (55.7%) |
| $800 to $1,499 | 59 (11.1%) | 97 (30.7%) |
| Total | 530 (100.0%) | 316 (100.0%) |
Health & Disability in Bicknell
Health Insurance Coverage by Age in Bicknell
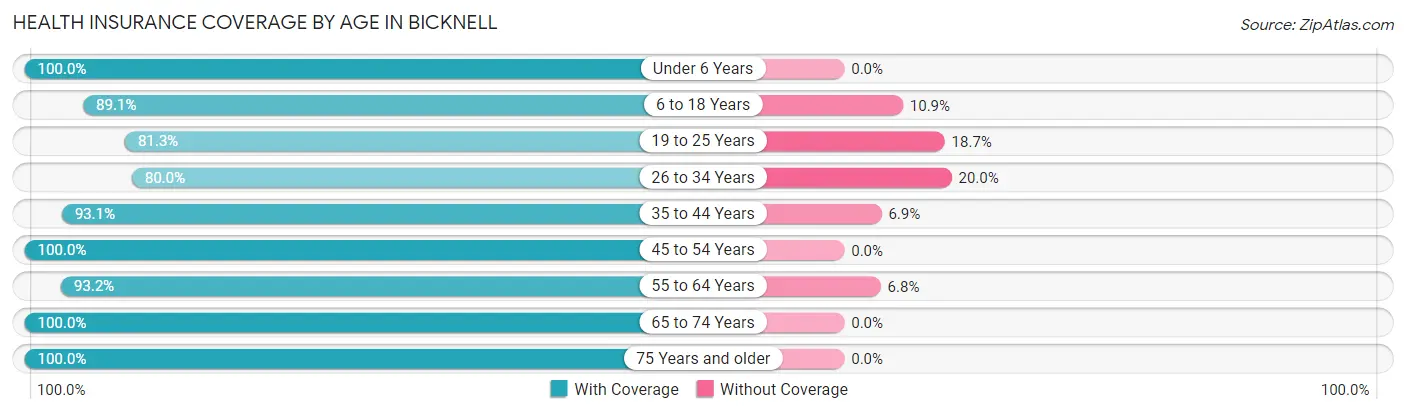
| Age Bracket | With Coverage | Without Coverage |
| Under 6 Years | 188 (100.0%) | 0 (0.0%) |
| 6 to 18 Years | 367 (89.1%) | 45 (10.9%) |
| 19 to 25 Years | 343 (81.3%) | 79 (18.7%) |
| 26 to 34 Years | 132 (80.0%) | 33 (20.0%) |
| 35 to 44 Years | 497 (93.1%) | 37 (6.9%) |
| 45 to 54 Years | 325 (100.0%) | 0 (0.0%) |
| 55 to 64 Years | 316 (93.2%) | 23 (6.8%) |
| 65 to 74 Years | 279 (100.0%) | 0 (0.0%) |
| 75 Years and older | 154 (100.0%) | 0 (0.0%) |
| Total | 2,601 (92.3%) | 217 (7.7%) |
Health Insurance Coverage by Citizenship Status in Bicknell
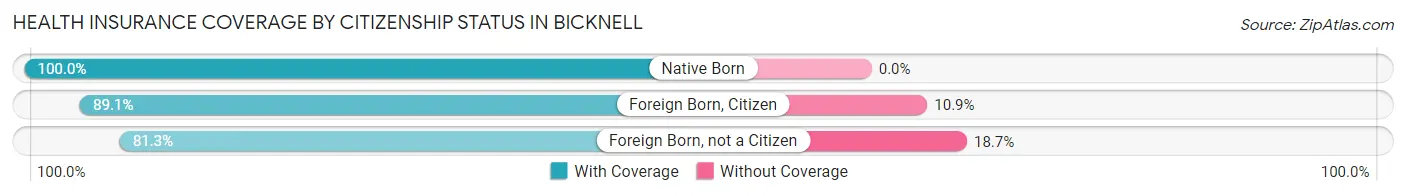
| Citizenship Status | With Coverage | Without Coverage |
| Native Born | 188 (100.0%) | 0 (0.0%) |
| Foreign Born, Citizen | 367 (89.1%) | 45 (10.9%) |
| Foreign Born, not a Citizen | 343 (81.3%) | 79 (18.7%) |
Health Insurance Coverage by Household Income in Bicknell
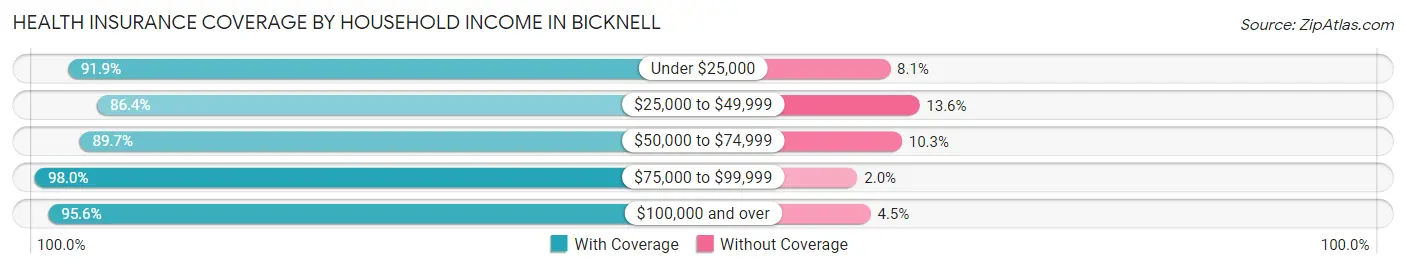
| Household Income | With Coverage | Without Coverage |
| Under $25,000 | 419 (91.9%) | 37 (8.1%) |
| $25,000 to $49,999 | 578 (86.4%) | 91 (13.6%) |
| $50,000 to $74,999 | 392 (89.7%) | 45 (10.3%) |
| $75,000 to $99,999 | 449 (98.0%) | 9 (2.0%) |
| $100,000 and over | 752 (95.6%) | 35 (4.4%) |
Public vs Private Health Insurance Coverage by Age in Bicknell
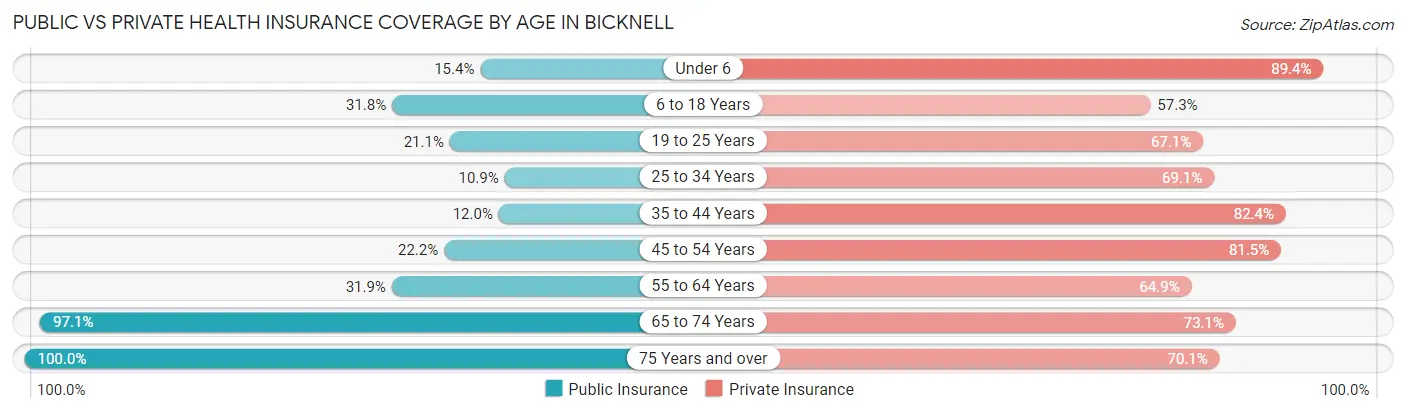
| Age Bracket | Public Insurance | Private Insurance |
| Under 6 | 29 (15.4%) | 168 (89.4%) |
| 6 to 18 Years | 131 (31.8%) | 236 (57.3%) |
| 19 to 25 Years | 89 (21.1%) | 283 (67.1%) |
| 25 to 34 Years | 18 (10.9%) | 114 (69.1%) |
| 35 to 44 Years | 64 (12.0%) | 440 (82.4%) |
| 45 to 54 Years | 72 (22.2%) | 265 (81.5%) |
| 55 to 64 Years | 108 (31.9%) | 220 (64.9%) |
| 65 to 74 Years | 271 (97.1%) | 204 (73.1%) |
| 75 Years and over | 154 (100.0%) | 108 (70.1%) |
| Total | 936 (33.2%) | 2,038 (72.3%) |
Disability Status by Sex by Age in Bicknell
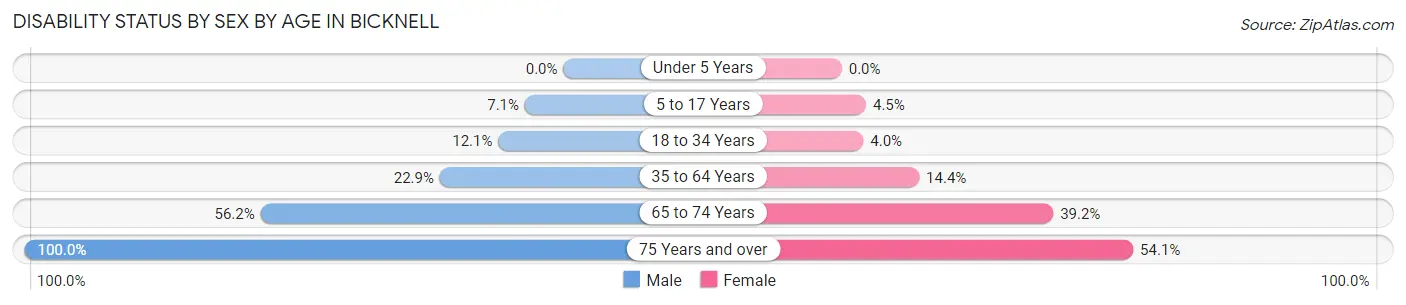
| Age Bracket | Male | Female |
| Under 5 Years | 0 (0.0%) | 0 (0.0%) |
| 5 to 17 Years | 19 (7.1%) | 9 (4.5%) |
| 18 to 34 Years | 40 (12.1%) | 11 (4.0%) |
| 35 to 64 Years | 139 (22.9%) | 85 (14.4%) |
| 65 to 74 Years | 68 (56.2%) | 62 (39.2%) |
| 75 Years and over | 56 (100.0%) | 53 (54.1%) |
Disability Class by Sex by Age in Bicknell
Disability Class: Hearing Difficulty
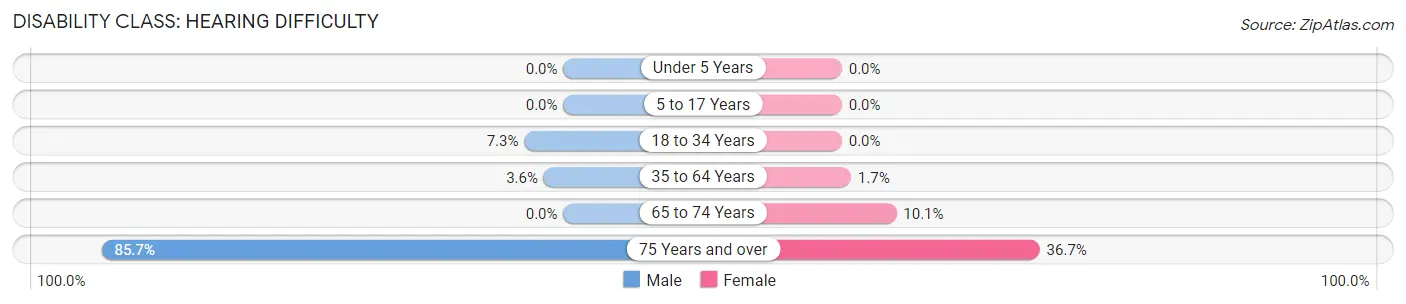
| Age Bracket | Male | Female |
| Under 5 Years | 0 (0.0%) | 0 (0.0%) |
| 5 to 17 Years | 0 (0.0%) | 0 (0.0%) |
| 18 to 34 Years | 24 (7.2%) | 0 (0.0%) |
| 35 to 64 Years | 22 (3.6%) | 10 (1.7%) |
| 65 to 74 Years | 0 (0.0%) | 16 (10.1%) |
| 75 Years and over | 48 (85.7%) | 36 (36.7%) |
Disability Class: Vision Difficulty
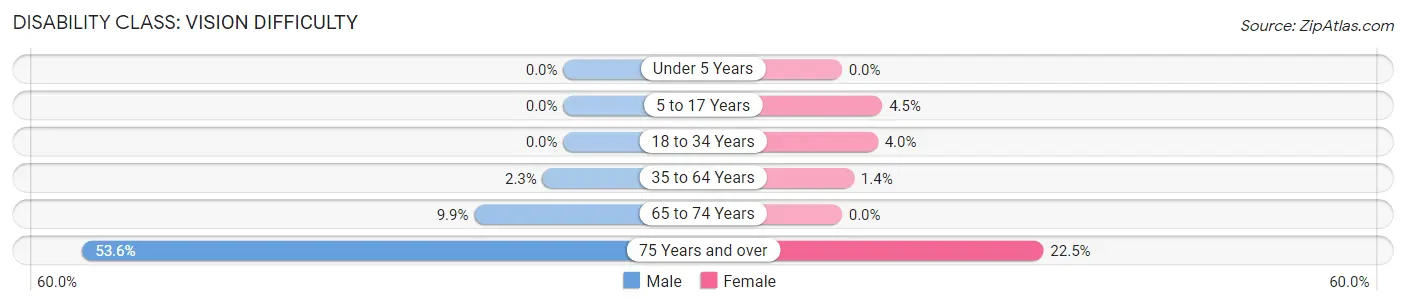
| Age Bracket | Male | Female |
| Under 5 Years | 0 (0.0%) | 0 (0.0%) |
| 5 to 17 Years | 0 (0.0%) | 9 (4.5%) |
| 18 to 34 Years | 0 (0.0%) | 11 (4.0%) |
| 35 to 64 Years | 14 (2.3%) | 8 (1.3%) |
| 65 to 74 Years | 12 (9.9%) | 0 (0.0%) |
| 75 Years and over | 30 (53.6%) | 22 (22.5%) |
Disability Class: Cognitive Difficulty
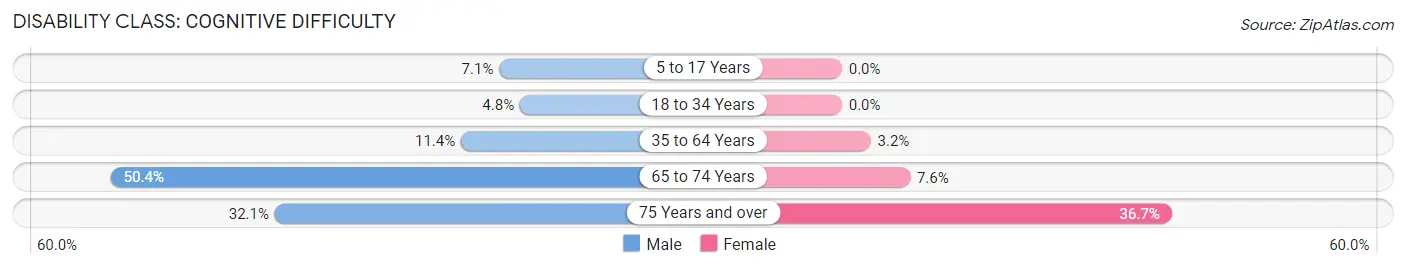
| Age Bracket | Male | Female |
| 5 to 17 Years | 19 (7.1%) | 0 (0.0%) |
| 18 to 34 Years | 16 (4.8%) | 0 (0.0%) |
| 35 to 64 Years | 69 (11.4%) | 19 (3.2%) |
| 65 to 74 Years | 61 (50.4%) | 12 (7.6%) |
| 75 Years and over | 18 (32.1%) | 36 (36.7%) |
Disability Class: Ambulatory Difficulty
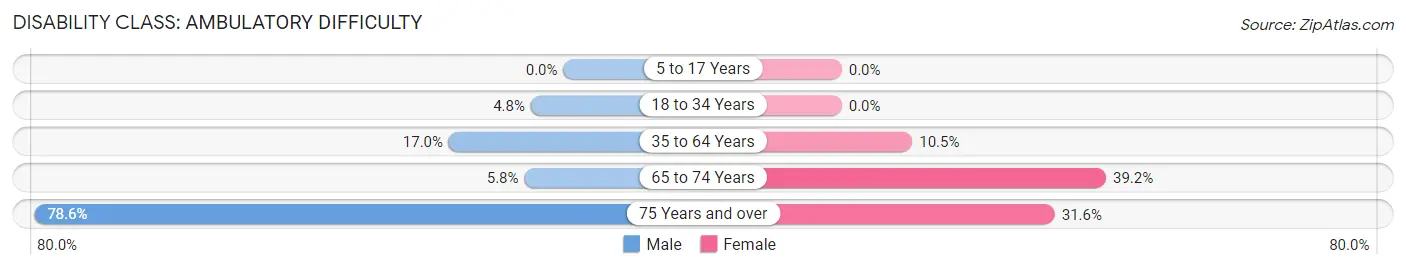
| Age Bracket | Male | Female |
| 5 to 17 Years | 0 (0.0%) | 0 (0.0%) |
| 18 to 34 Years | 16 (4.8%) | 0 (0.0%) |
| 35 to 64 Years | 103 (17.0%) | 62 (10.5%) |
| 65 to 74 Years | 7 (5.8%) | 62 (39.2%) |
| 75 Years and over | 44 (78.6%) | 31 (31.6%) |
Disability Class: Self-Care Difficulty
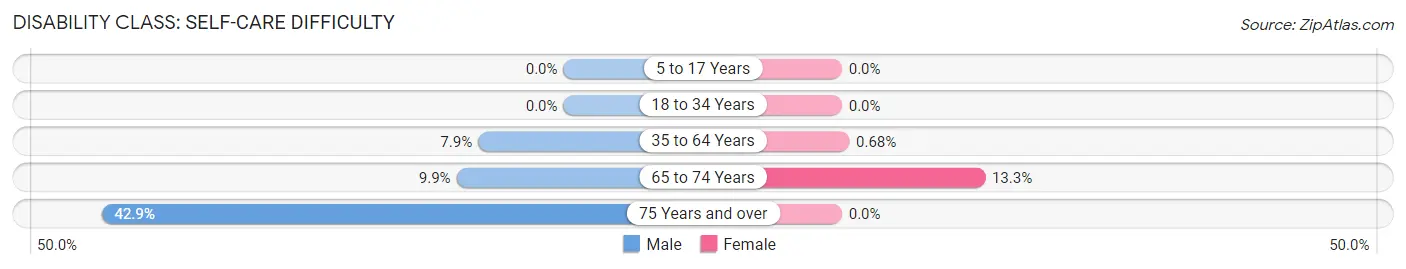
| Age Bracket | Male | Female |
| 5 to 17 Years | 0 (0.0%) | 0 (0.0%) |
| 18 to 34 Years | 0 (0.0%) | 0 (0.0%) |
| 35 to 64 Years | 48 (7.9%) | 4 (0.7%) |
| 65 to 74 Years | 12 (9.9%) | 21 (13.3%) |
| 75 Years and over | 24 (42.9%) | 0 (0.0%) |
Technology Access in Bicknell
Computing Device Access in Bicknell
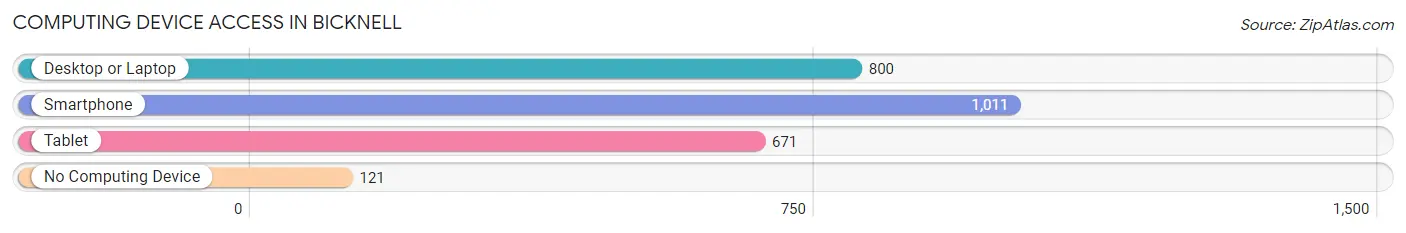
| Device Type | # Households | % Households |
| Desktop or Laptop | 800 | 63.0% |
| Smartphone | 1,011 | 79.6% |
| Tablet | 671 | 52.8% |
| No Computing Device | 121 | 9.5% |
| Total | 1,270 | 100.0% |
Internet Access in Bicknell
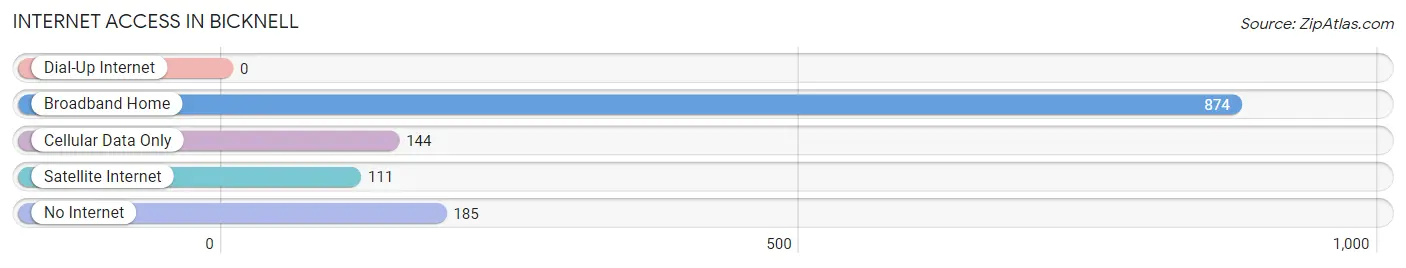
| Internet Type | # Households | % Households |
| Dial-Up Internet | 0 | 0.0% |
| Broadband Home | 874 | 68.8% |
| Cellular Data Only | 144 | 11.3% |
| Satellite Internet | 111 | 8.7% |
| No Internet | 185 | 14.6% |
| Total | 1,270 | 100.0% |
Bicknell Summary
Bicknell is a city located in Knox County, Indiana, United States. It is the county seat of Knox County. The population was 2,819 at the 2010 census.
History
Bicknell was founded in 1872 by William Bicknell, a local businessman. The town was named after him. The first post office was established in 1873. The town was incorporated in 1875.
In the late 19th century, Bicknell was a major center of coal mining in the area. The coal industry was the main source of employment for the town's residents. The coal mines were closed in the early 20th century, and the town's economy shifted to agriculture and manufacturing.
Geography
Bicknell is located at 38°41'25"N 87°20'45"W (38.690278, -87.345833). According to the 2010 census, the city has a total area of 1.3 square miles (3.4 km2), all land.
Demographics
As of the census of 2010, there were 2,819 people, 1,093 households, and 717 families residing in the city. The population density was 2,164.2 people per square mile (832.7/km2). There were 1,193 housing units at an average density of 914.6 per square mile (353.2/km2). The racial makeup of the city was 97.2% White, 0.3% African American, 0.3% Native American, 0.3% Asian, 0.2% from other races, and 1.7% from two or more races. Hispanic or Latino of any race were 1.2% of the population.
There were 1,093 households, out of which 32.2% had children under the age of 18 living with them, 48.2% were married couples living together, 14.2% had a female householder with no husband present, and 33.2% were non-families. 28.7% of all households were made up of individuals, and 13.2% had someone living alone who was 65 years of age or older. The average household size was 2.50 and the average family size was 3.06.
The median age in the city was 38.2 years. 25.3% of residents were under the age of 18; 8.2% were between the ages of 18 and 24; 24.2% were from 25 to 44; 25.7% were from 45 to 64; and 16.6% were 65 years of age or older. The gender makeup of the city was 48.2% male and 51.8% female.
Economy
Bicknell's economy is largely based on agriculture and manufacturing. The city is home to several manufacturing companies, including a plastics plant, a metal fabrication plant, and a food processing plant. The city also has a number of retail stores and restaurants.
The city is also home to a number of small businesses, including a lumber yard, a hardware store, and a number of auto repair shops. The city is also home to a number of medical facilities, including a hospital, a nursing home, and a number of medical offices.
The city is served by the Vincennes University Jasper Campus, which offers a variety of educational programs. The city is also home to a number of churches, including the First United Methodist Church, the First Baptist Church, and the Church of the Nazarene.
Conclusion
Bicknell is a small city located in Knox County, Indiana. It was founded in 1872 and has a population of 2,819 as of the 2010 census. The city's economy is largely based on agriculture and manufacturing, and it is home to a number of small businesses, medical facilities, and educational institutions. Bicknell is a great place to live and work, and it is a great example of a small town in Indiana.
Common Questions
What is Per Capita Income in Bicknell?
Per Capita income in Bicknell is $31,180.
What is the Median Family Income in Bicknell?
Median Family Income in Bicknell is $68,600.
What is the Median Household income in Bicknell?
Median Household Income in Bicknell is $49,420.
What is Income or Wage Gap in Bicknell?
Income or Wage Gap in Bicknell is 44.0%.
Women in Bicknell earn 56.0 cents for every dollar earned by a man.
What is Inequality or Gini Index in Bicknell?
Inequality or Gini Index in Bicknell is 0.43.
What is the Total Population of Bicknell?
Total Population of Bicknell is 2,818.
What is the Total Male Population of Bicknell?
Total Male Population of Bicknell is 1,431.
What is the Total Female Population of Bicknell?
Total Female Population of Bicknell is 1,387.
What is the Ratio of Males per 100 Females in Bicknell?
There are 103.17 Males per 100 Females in Bicknell.
What is the Ratio of Females per 100 Males in Bicknell?
There are 96.93 Females per 100 Males in Bicknell.
What is the Median Population Age in Bicknell?
Median Population Age in Bicknell is 41.6 Years.
What is the Average Family Size in Bicknell
Average Family Size in Bicknell is 2.7 People.
What is the Average Household Size in Bicknell
Average Household Size in Bicknell is 2.2 People.
How Large is the Labor Force in Bicknell?
There are 1,532 People in the Labor Forcein in Bicknell.
What is the Percentage of People in the Labor Force in Bicknell?
66.9% of People are in the Labor Force in Bicknell.
What is the Unemployment Rate in Bicknell?
Unemployment Rate in Bicknell is 2.1%.