Bedford, IN Map & Demographics
Bedford Map
Bedford Overview
$30,190
PER CAPITA INCOME
$73,365
AVG FAMILY INCOME
$49,492
AVG HOUSEHOLD INCOME
37.1%
WAGE / INCOME GAP [ % ]
62.9¢/ $1
WAGE / INCOME GAP [ $ ]
0.45
INEQUALITY / GINI INDEX
13,802
TOTAL POPULATION
6,507
MALE POPULATION
7,295
FEMALE POPULATION
89.20
MALES / 100 FEMALES
112.11
FEMALES / 100 MALES
42.5
MEDIAN AGE
2.9
AVG FAMILY SIZE
2.1
AVG HOUSEHOLD SIZE
6,358
LABOR FORCE [ PEOPLE ]
55.9%
PERCENT IN LABOR FORCE
3.1%
UNEMPLOYMENT RATE
Bedford Zip Codes
Bedford Area Codes
Income in Bedford
Income Overview in Bedford
Per Capita Income in Bedford is $30,190, while median incomes of families and households are $73,365 and $49,492 respectively.
| Characteristic | Number | Measure |
| Per Capita Income | 13,802 | $30,190 |
| Median Family Income | 3,267 | $73,365 |
| Mean Family Income | 3,267 | $80,707 |
| Median Household Income | 6,374 | $49,492 |
| Mean Household Income | 6,374 | $64,092 |
| Income Deficit | 3,267 | $0 |
| Wage / Income Gap (%) | 13,802 | 37.10% |
| Wage / Income Gap ($) | 13,802 | 62.90¢ per $1 |
| Gini / Inequality Index | 13,802 | 0.45 |
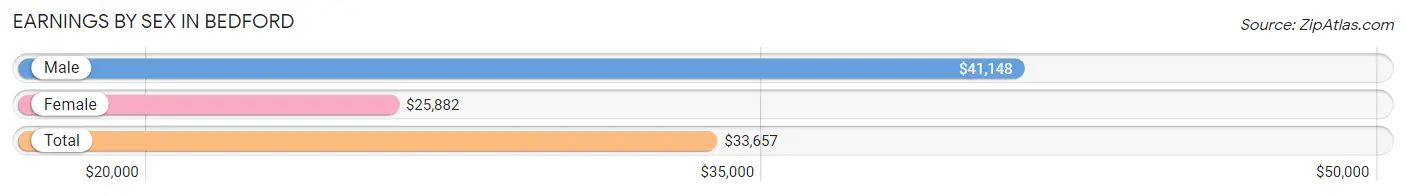
Earnings by Sex in Bedford
Average Earnings in Bedford are $33,657, $41,148 for men and $25,882 for women, a difference of 37.1%.
| Sex | Number | Average Earnings |
| Male | 3,438 (50.4%) | $41,148 |
| Female | 3,376 (49.5%) | $25,882 |
| Total | 6,814 (100.0%) | $33,657 |
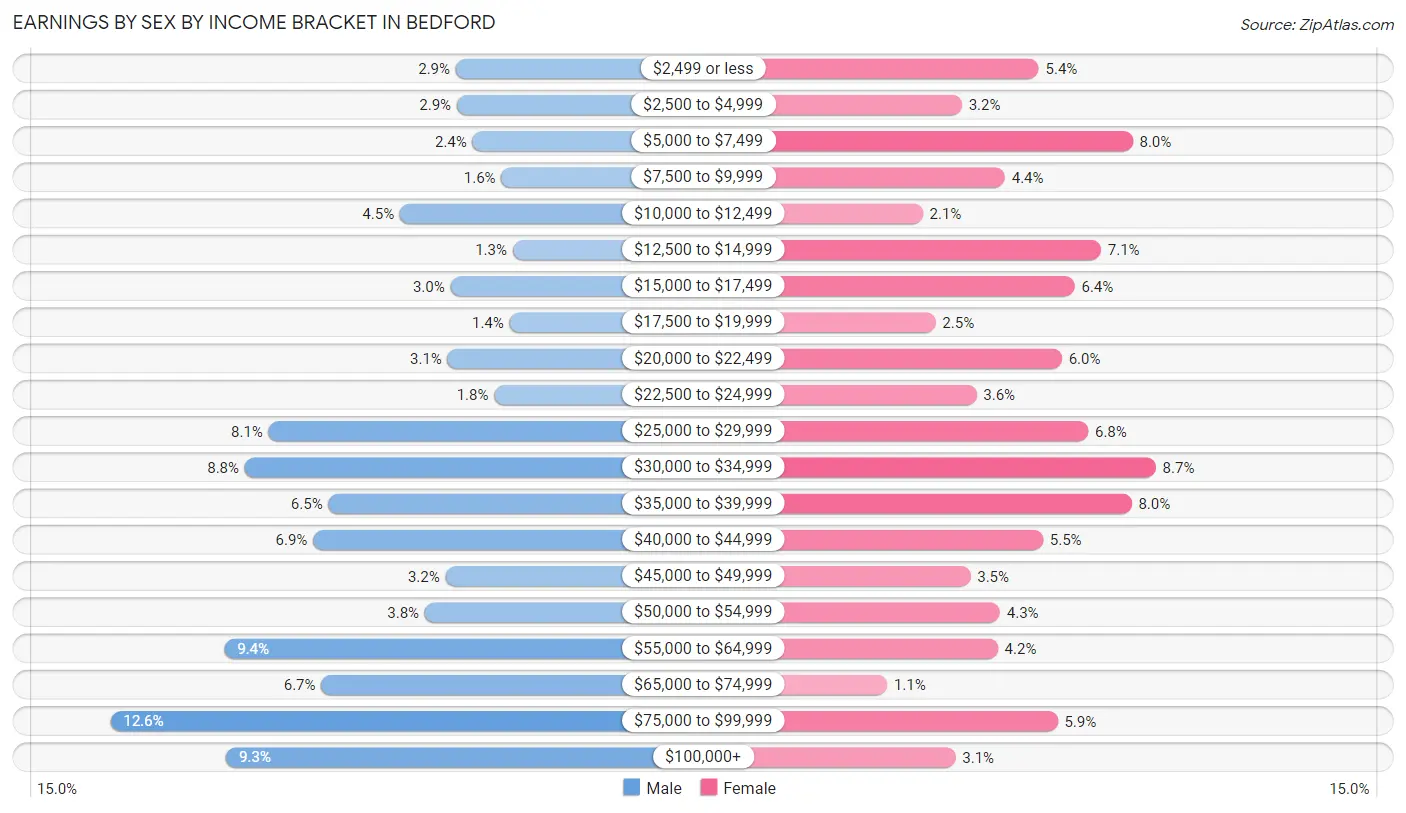
Earnings by Sex by Income Bracket in Bedford
The most common earnings brackets in Bedford are $75,000 to $99,999 for men (433 | 12.6%) and $30,000 to $34,999 for women (293 | 8.7%).
| Income | Male | Female |
| $2,499 or less | 99 (2.9%) | 182 (5.4%) |
| $2,500 to $4,999 | 98 (2.9%) | 109 (3.2%) |
| $5,000 to $7,499 | 83 (2.4%) | 271 (8.0%) |
| $7,500 to $9,999 | 55 (1.6%) | 150 (4.4%) |
| $10,000 to $12,499 | 153 (4.4%) | 72 (2.1%) |
| $12,500 to $14,999 | 44 (1.3%) | 241 (7.1%) |
| $15,000 to $17,499 | 104 (3.0%) | 216 (6.4%) |
| $17,500 to $19,999 | 47 (1.4%) | 84 (2.5%) |
| $20,000 to $22,499 | 107 (3.1%) | 204 (6.0%) |
| $22,500 to $24,999 | 62 (1.8%) | 123 (3.6%) |
| $25,000 to $29,999 | 280 (8.1%) | 229 (6.8%) |
| $30,000 to $34,999 | 303 (8.8%) | 293 (8.7%) |
| $35,000 to $39,999 | 222 (6.5%) | 270 (8.0%) |
| $40,000 to $44,999 | 237 (6.9%) | 186 (5.5%) |
| $45,000 to $49,999 | 109 (3.2%) | 117 (3.5%) |
| $50,000 to $54,999 | 129 (3.7%) | 145 (4.3%) |
| $55,000 to $64,999 | 323 (9.4%) | 143 (4.2%) |
| $65,000 to $74,999 | 229 (6.7%) | 38 (1.1%) |
| $75,000 to $99,999 | 433 (12.6%) | 200 (5.9%) |
| $100,000+ | 321 (9.3%) | 103 (3.0%) |
| Total | 3,438 (100.0%) | 3,376 (100.0%) |
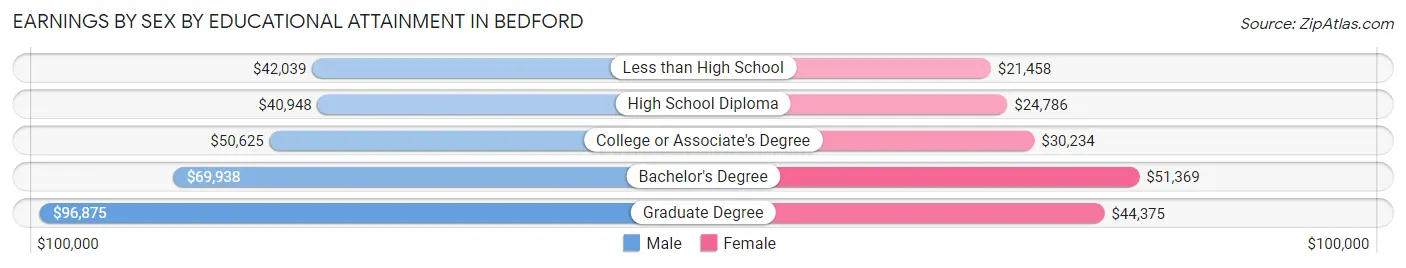
Earnings by Sex by Educational Attainment in Bedford
Average earnings in Bedford are $45,204 for men and $30,181 for women, a difference of 33.2%. Men with an educational attainment of graduate degree enjoy the highest average annual earnings of $96,875, while those with high school diploma education earn the least with $40,948. Women with an educational attainment of bachelor's degree earn the most with the average annual earnings of $51,369, while those with less than high school education have the smallest earnings of $21,458.
| Educational Attainment | Male Income | Female Income |
| Less than High School | $42,039 | $21,458 |
| High School Diploma | $40,948 | $24,786 |
| College or Associate's Degree | $50,625 | $30,234 |
| Bachelor's Degree | $69,938 | $51,369 |
| Graduate Degree | $96,875 | $44,375 |
| Total | $45,204 | $30,181 |
Family Income in Bedford
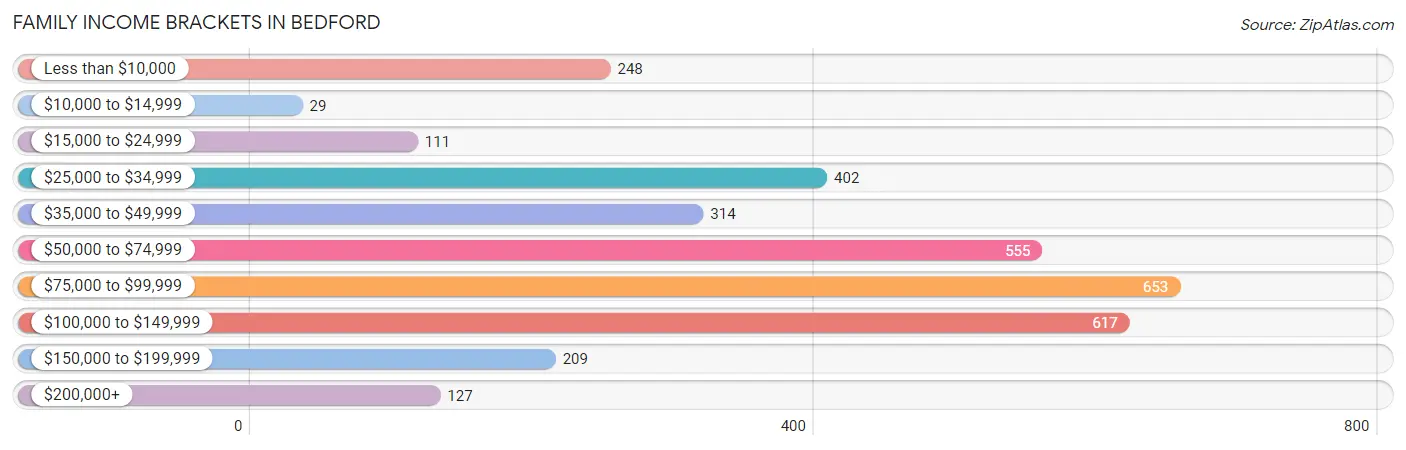
Family Income Brackets in Bedford
According to the Bedford family income data, there are 653 families falling into the $75,000 to $99,999 income range, which is the most common income bracket and makes up 20.0% of all families. Conversely, the $10,000 to $14,999 income bracket is the least frequent group with only 29 families (0.9%) belonging to this category.
| Income Bracket | # Families | % Families |
| Less than $10,000 | 248 | 7.6% |
| $10,000 to $14,999 | 29 | 0.9% |
| $15,000 to $24,999 | 111 | 3.4% |
| $25,000 to $34,999 | 402 | 12.3% |
| $35,000 to $49,999 | 314 | 9.6% |
| $50,000 to $74,999 | 555 | 17.0% |
| $75,000 to $99,999 | 653 | 20.0% |
| $100,000 to $149,999 | 617 | 18.9% |
| $150,000 to $199,999 | 209 | 6.4% |
| $200,000+ | 127 | 3.9% |
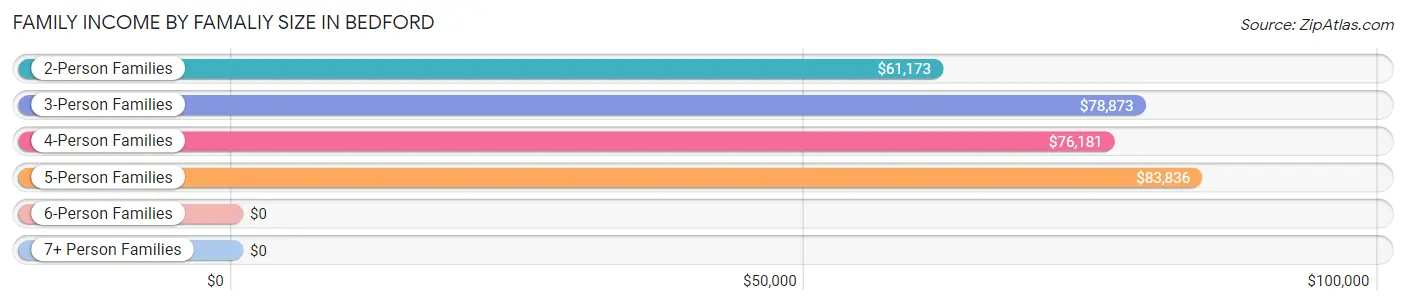
Family Income by Famaliy Size in Bedford
5-person families (355 | 10.9%) account for the highest median family income in Bedford with $83,836 per family, while 2-person families (1,790 | 54.8%) have the highest median income of $30,586 per family member.
| Income Bracket | # Families | Median Income |
| 2-Person Families | 1,790 (54.8%) | $61,173 |
| 3-Person Families | 712 (21.8%) | $78,873 |
| 4-Person Families | 283 (8.7%) | $76,181 |
| 5-Person Families | 355 (10.9%) | $83,836 |
| 6-Person Families | 39 (1.2%) | $0 |
| 7+ Person Families | 88 (2.7%) | $0 |
| Total | 3,267 (100.0%) | $73,365 |
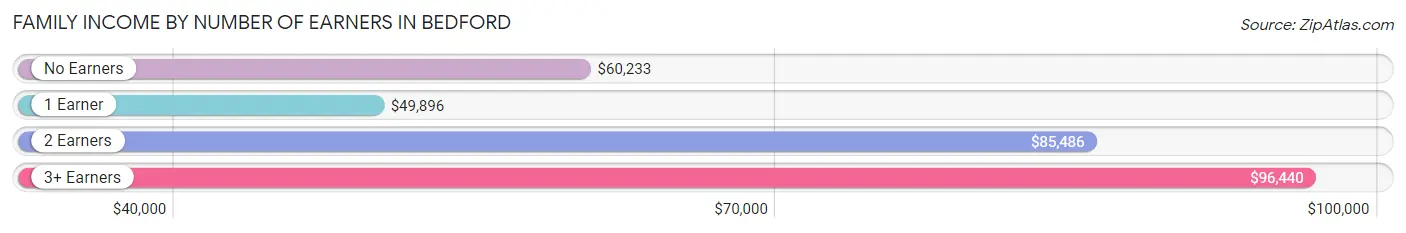
Family Income by Number of Earners in Bedford
The median family income in Bedford is $73,365, with families comprising 3+ earners (489) having the highest median family income of $96,440, while families with 1 earner (1,079) have the lowest median family income of $49,896, accounting for 15.0% and 33.0% of families, respectively.
| Number of Earners | # Families | Median Income |
| No Earners | 680 (20.8%) | $60,233 |
| 1 Earner | 1,079 (33.0%) | $49,896 |
| 2 Earners | 1,019 (31.2%) | $85,486 |
| 3+ Earners | 489 (15.0%) | $96,440 |
| Total | 3,267 (100.0%) | $73,365 |
Household Income in Bedford
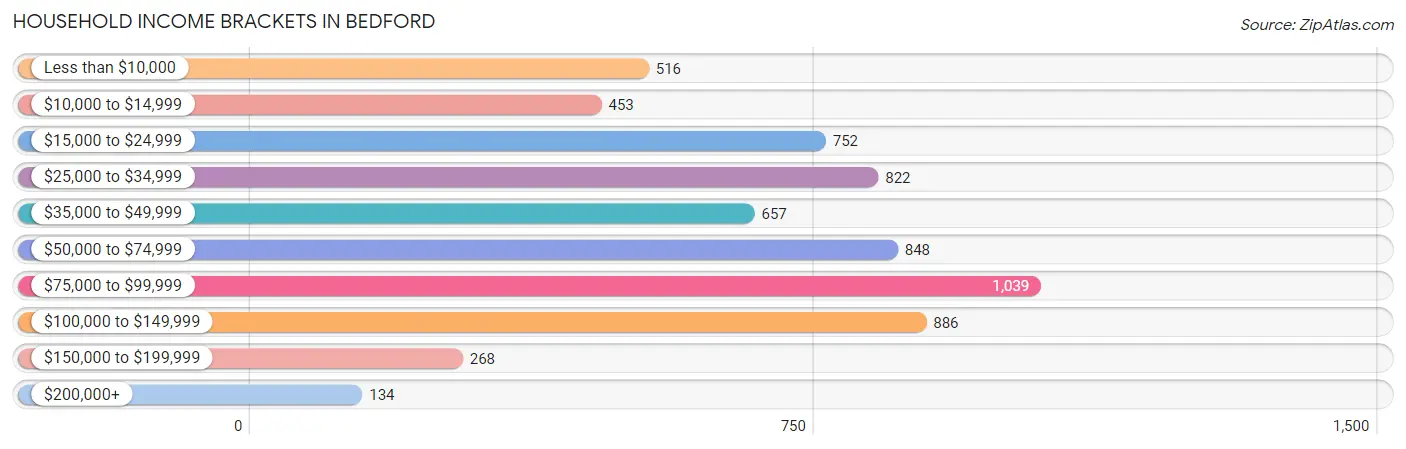
Household Income Brackets in Bedford
With 1,039 households falling in the category, the $75,000 to $99,999 income range is the most frequent in Bedford, accounting for 16.3% of all households. In contrast, only 134 households (2.1%) fall into the $200,000+ income bracket, making it the least populous group.
| Income Bracket | # Households | % Households |
| Less than $10,000 | 516 | 8.1% |
| $10,000 to $14,999 | 453 | 7.1% |
| $15,000 to $24,999 | 752 | 11.8% |
| $25,000 to $34,999 | 822 | 12.9% |
| $35,000 to $49,999 | 657 | 10.3% |
| $50,000 to $74,999 | 848 | 13.3% |
| $75,000 to $99,999 | 1,039 | 16.3% |
| $100,000 to $149,999 | 886 | 13.9% |
| $150,000 to $199,999 | 268 | 4.2% |
| $200,000+ | 134 | 2.1% |
Household Income by Householder Age in Bedford
The median household income in Bedford is $49,492, with the highest median household income of $65,625 found in the 45 to 64 years age bracket for the primary householder. A total of 1,986 households (31.2%) fall into this category. Meanwhile, the 15 to 24 years age bracket for the primary householder has the lowest median household income of $26,510, with 341 households (5.3%) in this group.
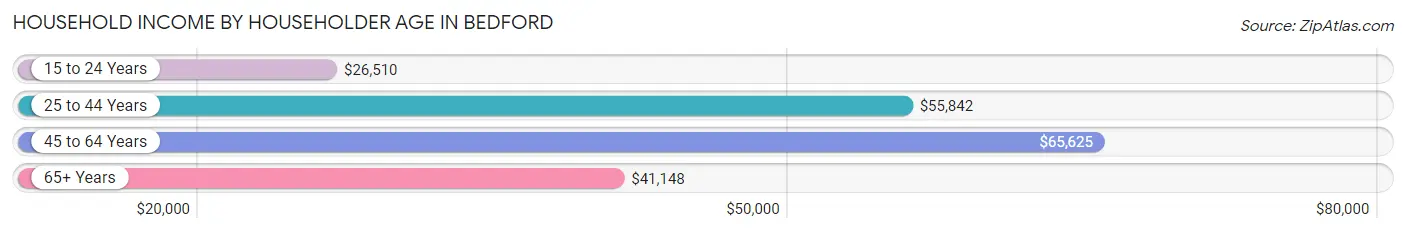
| Income Bracket | # Households | Median Income |
| 15 to 24 Years | 341 (5.3%) | $26,510 |
| 25 to 44 Years | 1,959 (30.7%) | $55,842 |
| 45 to 64 Years | 1,986 (31.2%) | $65,625 |
| 65+ Years | 2,088 (32.8%) | $41,148 |
| Total | 6,374 (100.0%) | $49,492 |
Poverty in Bedford
Income Below Poverty by Sex and Age in Bedford
With 11.2% poverty level for males and 19.7% for females among the residents of Bedford, 5 year old males and 15 year old females are the most vulnerable to poverty, with 7 males (35.0%) and 29 females (76.3%) in their respective age groups living below the poverty level.
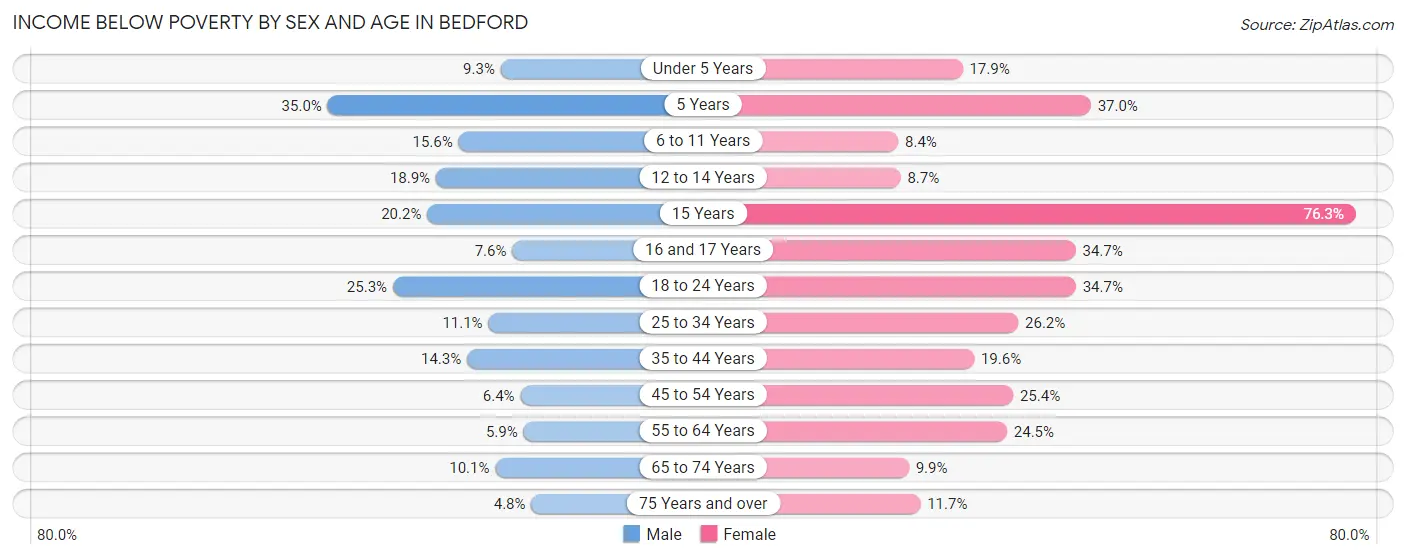
| Age Bracket | Male | Female |
| Under 5 Years | 32 (9.3%) | 38 (17.9%) |
| 5 Years | 7 (35.0%) | 34 (37.0%) |
| 6 to 11 Years | 54 (15.6%) | 47 (8.4%) |
| 12 to 14 Years | 63 (18.9%) | 27 (8.7%) |
| 15 Years | 19 (20.2%) | 29 (76.3%) |
| 16 and 17 Years | 20 (7.6%) | 42 (34.7%) |
| 18 to 24 Years | 103 (25.3%) | 181 (34.7%) |
| 25 to 34 Years | 98 (11.1%) | 210 (26.2%) |
| 35 to 44 Years | 117 (14.3%) | 192 (19.6%) |
| 45 to 54 Years | 47 (6.4%) | 165 (25.4%) |
| 55 to 64 Years | 55 (5.9%) | 214 (24.5%) |
| 65 to 74 Years | 64 (10.1%) | 92 (9.9%) |
| 75 Years and over | 21 (4.8%) | 103 (11.7%) |
| Total | 700 (11.2%) | 1,374 (19.7%) |
Income Above Poverty by Sex and Age in Bedford
According to the poverty statistics in Bedford, males aged 75 years and over and females aged 6 to 11 years are the age groups that are most secure financially, with 95.3% of males and 91.6% of females in these age groups living above the poverty line.
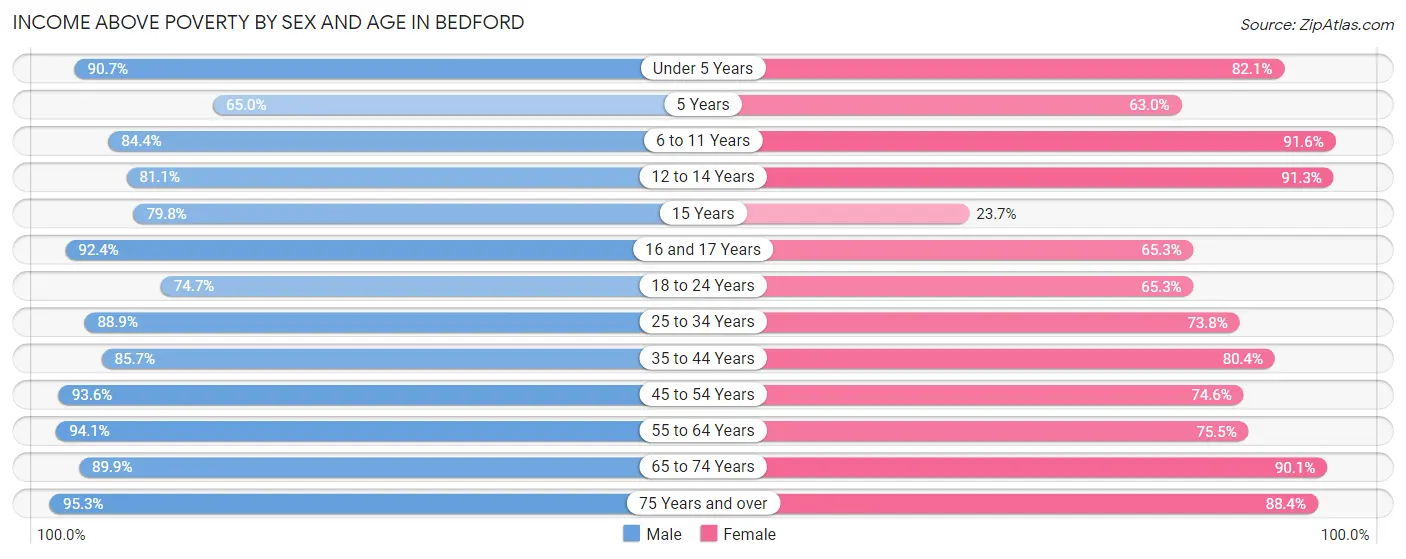
| Age Bracket | Male | Female |
| Under 5 Years | 312 (90.7%) | 174 (82.1%) |
| 5 Years | 13 (65.0%) | 58 (63.0%) |
| 6 to 11 Years | 293 (84.4%) | 515 (91.6%) |
| 12 to 14 Years | 270 (81.1%) | 283 (91.3%) |
| 15 Years | 75 (79.8%) | 9 (23.7%) |
| 16 and 17 Years | 244 (92.4%) | 79 (65.3%) |
| 18 to 24 Years | 304 (74.7%) | 340 (65.3%) |
| 25 to 34 Years | 783 (88.9%) | 592 (73.8%) |
| 35 to 44 Years | 701 (85.7%) | 786 (80.4%) |
| 45 to 54 Years | 691 (93.6%) | 484 (74.6%) |
| 55 to 64 Years | 875 (94.1%) | 659 (75.5%) |
| 65 to 74 Years | 569 (89.9%) | 834 (90.1%) |
| 75 Years and over | 421 (95.3%) | 781 (88.3%) |
| Total | 5,551 (88.8%) | 5,594 (80.3%) |
Income Below Poverty Among Married-Couple Families in Bedford
The poverty statistics for married-couple families in Bedford show that 7.4% or 171 of the total 2,295 families live below the poverty line. Families with 5 or more children have the highest poverty rate of 56.5%, comprising of 26 families. On the other hand, families with 3 or 4 children have the lowest poverty rate of 0.0%, which includes 0 families.
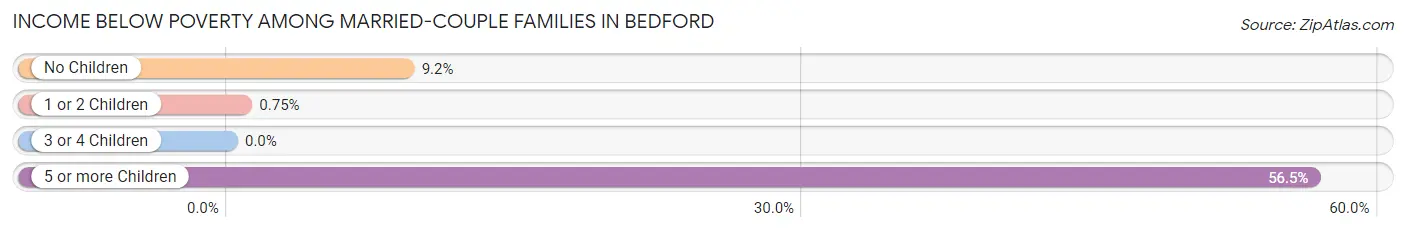
| Children | Above Poverty | Below Poverty |
| No Children | 1,387 (90.8%) | 141 (9.2%) |
| 1 or 2 Children | 529 (99.3%) | 4 (0.7%) |
| 3 or 4 Children | 188 (100.0%) | 0 (0.0%) |
| 5 or more Children | 20 (43.5%) | 26 (56.5%) |
| Total | 2,124 (92.5%) | 171 (7.4%) |
Income Below Poverty Among Single-Parent Households in Bedford
According to the poverty data in Bedford, 15.7% or 35 single-father households and 27.1% or 203 single-mother households are living below the poverty line. Among single-father households, those with 1 or 2 children have the highest poverty rate, with 35 households (36.5%) experiencing poverty. Likewise, among single-mother households, those with 1 or 2 children have the highest poverty rate, with 167 households (37.4%) falling below the poverty line.
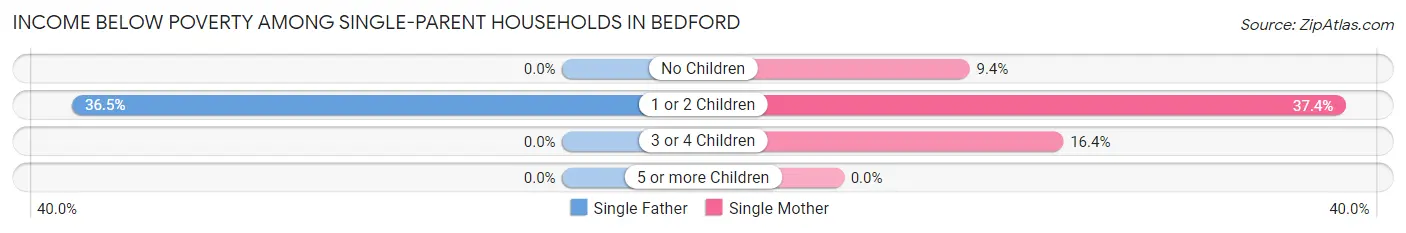
| Children | Single Father | Single Mother |
| No Children | 0 (0.0%) | 18 (9.4%) |
| 1 or 2 Children | 35 (36.5%) | 167 (37.4%) |
| 3 or 4 Children | 0 (0.0%) | 18 (16.4%) |
| 5 or more Children | 0 (0.0%) | 0 (0.0%) |
| Total | 35 (15.7%) | 203 (27.1%) |
Income Below Poverty Among Married-Couple vs Single-Parent Households in Bedford
The poverty data for Bedford shows that 171 of the married-couple family households (7.4%) and 238 of the single-parent households (24.5%) are living below the poverty level. Within the married-couple family households, those with 5 or more children have the highest poverty rate, with 26 households (56.5%) falling below the poverty line. Among the single-parent households, those with 1 or 2 children have the highest poverty rate, with 202 household (37.2%) living below poverty.
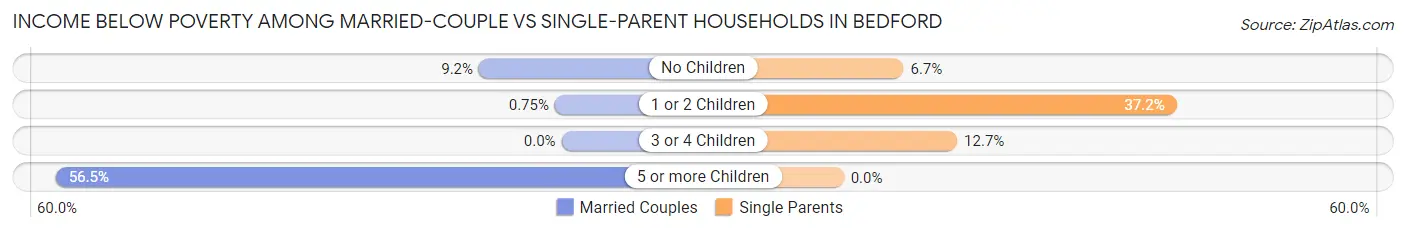
| Children | Married-Couple Families | Single-Parent Households |
| No Children | 141 (9.2%) | 18 (6.7%) |
| 1 or 2 Children | 4 (0.7%) | 202 (37.2%) |
| 3 or 4 Children | 0 (0.0%) | 18 (12.7%) |
| 5 or more Children | 26 (56.5%) | 0 (0.0%) |
| Total | 171 (7.4%) | 238 (24.5%) |
Race in Bedford
The most populous races in Bedford are White / Caucasian (13,067 | 94.7%), Hispanic or Latino (487 | 3.5%), and Two or more Races (450 | 3.3%).
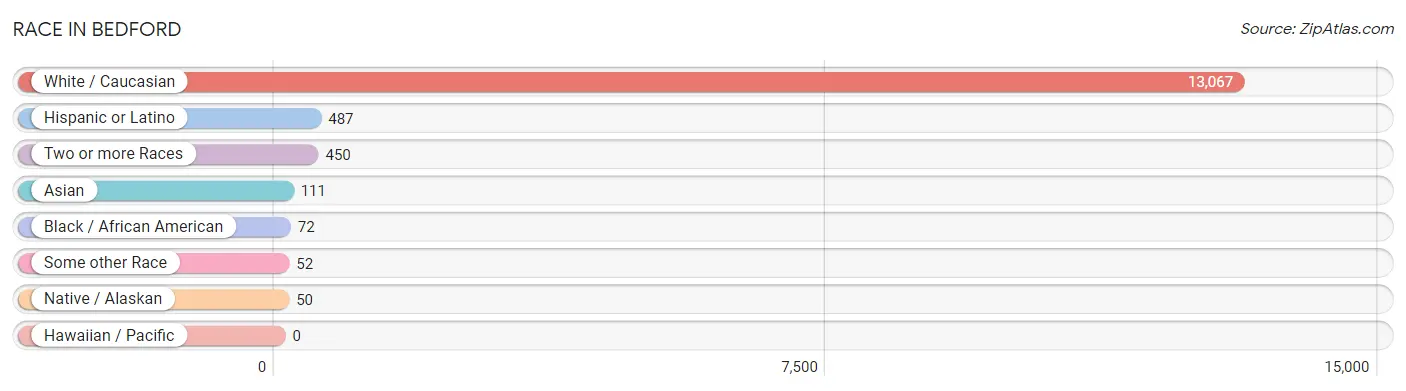
| Race | # Population | % Population |
| Asian | 111 | 0.8% |
| Black / African American | 72 | 0.5% |
| Hawaiian / Pacific | 0 | 0.0% |
| Hispanic or Latino | 487 | 3.5% |
| Native / Alaskan | 50 | 0.4% |
| White / Caucasian | 13,067 | 94.7% |
| Two or more Races | 450 | 3.3% |
| Some other Race | 52 | 0.4% |
| Total | 13,802 | 100.0% |
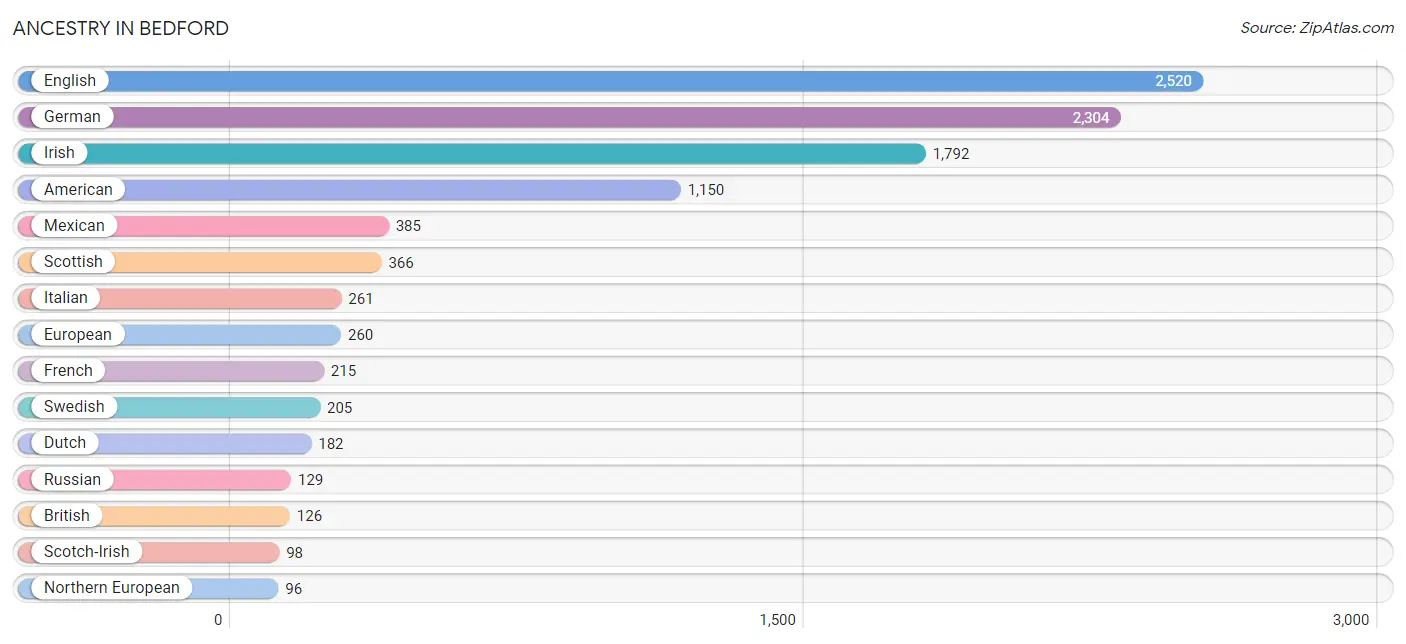
Ancestry in Bedford
The most populous ancestries reported in Bedford are English (2,520 | 18.3%), German (2,304 | 16.7%), Irish (1,792 | 13.0%), American (1,150 | 8.3%), and Mexican (385 | 2.8%), together accounting for 59.1% of all Bedford residents.
| Ancestry | # Population | % Population |
| American | 1,150 | 8.3% |
| Austrian | 11 | 0.1% |
| Belgian | 13 | 0.1% |
| Bhutanese | 4 | 0.0% |
| British | 126 | 0.9% |
| Canadian | 39 | 0.3% |
| Celtic | 10 | 0.1% |
| Cherokee | 73 | 0.5% |
| Choctaw | 12 | 0.1% |
| Colombian | 25 | 0.2% |
| Danish | 25 | 0.2% |
| Dutch | 182 | 1.3% |
| English | 2,520 | 18.3% |
| European | 260 | 1.9% |
| French | 215 | 1.6% |
| French Canadian | 21 | 0.2% |
| German | 2,304 | 16.7% |
| Greek | 25 | 0.2% |
| Hungarian | 26 | 0.2% |
| Icelander | 5 | 0.0% |
| Indian (Asian) | 7 | 0.1% |
| Iranian | 18 | 0.1% |
| Irish | 1,792 | 13.0% |
| Italian | 261 | 1.9% |
| Korean | 30 | 0.2% |
| Macedonian | 8 | 0.1% |
| Mexican | 385 | 2.8% |
| Mexican American Indian | 16 | 0.1% |
| Northern European | 96 | 0.7% |
| Norwegian | 46 | 0.3% |
| Polish | 84 | 0.6% |
| Portuguese | 12 | 0.1% |
| Puerto Rican | 75 | 0.5% |
| Romanian | 36 | 0.3% |
| Russian | 129 | 0.9% |
| Scandinavian | 34 | 0.3% |
| Scotch-Irish | 98 | 0.7% |
| Scottish | 366 | 2.6% |
| Sioux | 67 | 0.5% |
| South American | 25 | 0.2% |
| Sri Lankan | 50 | 0.4% |
| Subsaharan African | 4 | 0.0% |
| Swedish | 205 | 1.5% |
| Thai | 10 | 0.1% |
| Ugandan | 4 | 0.0% |
| Ukrainian | 8 | 0.1% |
| Welsh | 77 | 0.6% | View All 47 Rows |
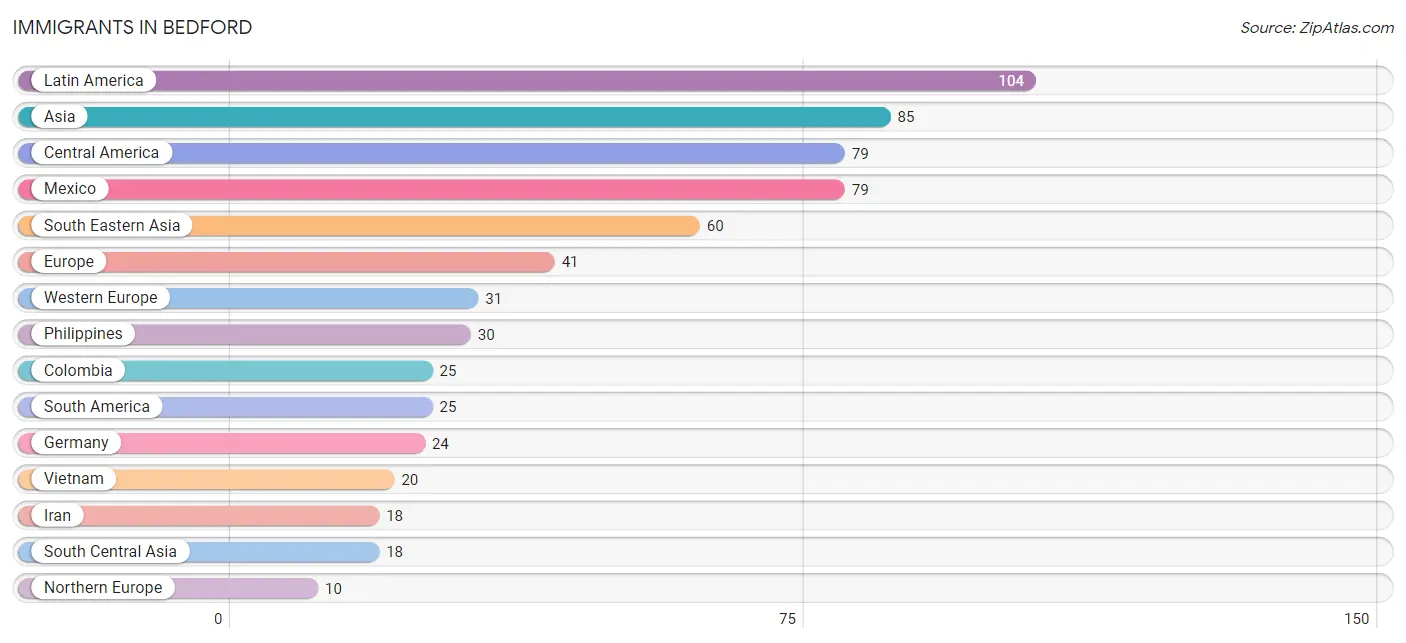
Immigrants in Bedford
The most numerous immigrant groups reported in Bedford came from Latin America (104 | 0.7%), Asia (85 | 0.6%), Central America (79 | 0.6%), Mexico (79 | 0.6%), and South Eastern Asia (60 | 0.4%), together accounting for 2.9% of all Bedford residents.
| Immigration Origin | # Population | % Population |
| Africa | 4 | 0.0% |
| Asia | 85 | 0.6% |
| Central America | 79 | 0.6% |
| China | 7 | 0.1% |
| Colombia | 25 | 0.2% |
| Eastern Africa | 4 | 0.0% |
| Eastern Asia | 7 | 0.1% |
| Europe | 41 | 0.3% |
| Germany | 24 | 0.2% |
| Iran | 18 | 0.1% |
| Latin America | 104 | 0.7% |
| Mexico | 79 | 0.6% |
| Netherlands | 7 | 0.1% |
| Northern Europe | 10 | 0.1% |
| Philippines | 30 | 0.2% |
| Singapore | 10 | 0.1% |
| South America | 25 | 0.2% |
| South Central Asia | 18 | 0.1% |
| South Eastern Asia | 60 | 0.4% |
| Uganda | 4 | 0.0% |
| Vietnam | 20 | 0.1% |
| Western Europe | 31 | 0.2% | View All 22 Rows |
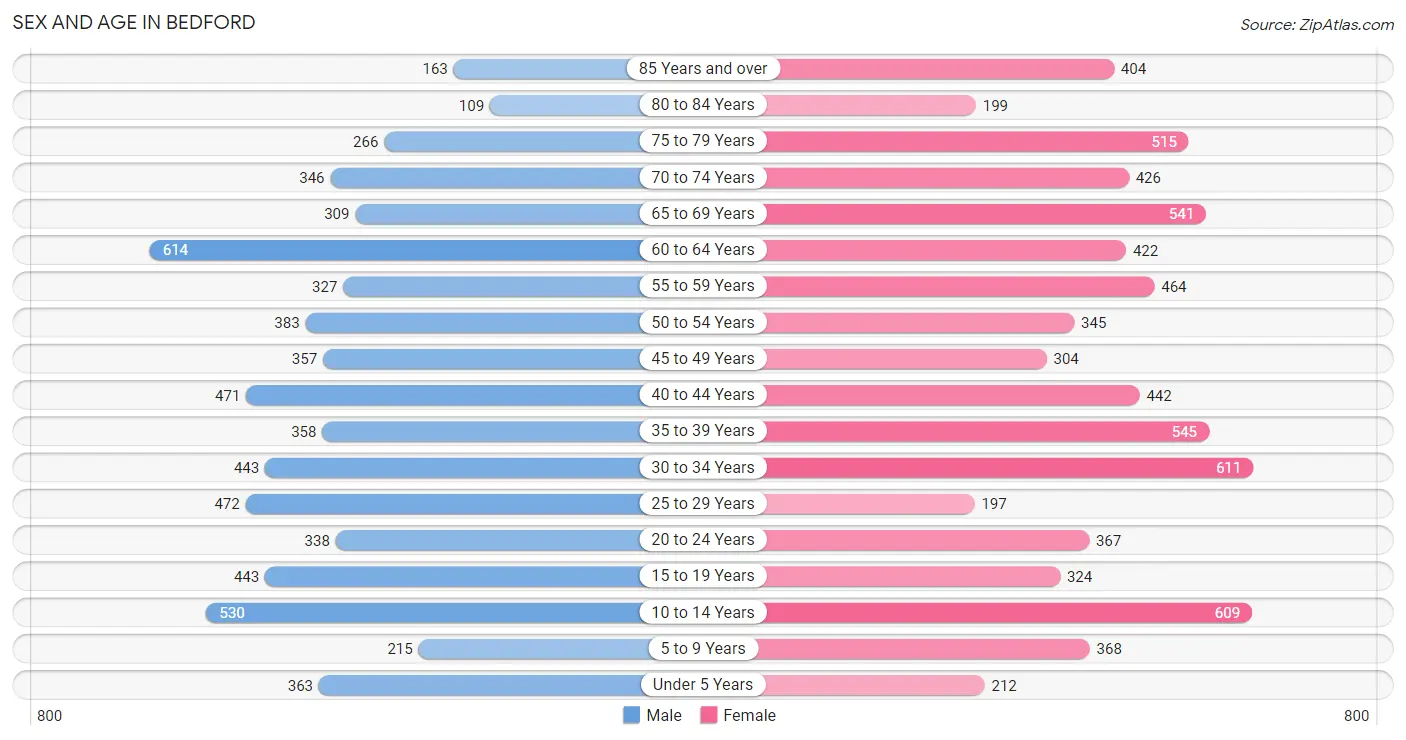
Sex and Age in Bedford
Sex and Age in Bedford
The most populous age groups in Bedford are 60 to 64 Years (614 | 9.4%) for men and 30 to 34 Years (611 | 8.4%) for women.
| Age Bracket | Male | Female |
| Under 5 Years | 363 (5.6%) | 212 (2.9%) |
| 5 to 9 Years | 215 (3.3%) | 368 (5.0%) |
| 10 to 14 Years | 530 (8.2%) | 609 (8.4%) |
| 15 to 19 Years | 443 (6.8%) | 324 (4.4%) |
| 20 to 24 Years | 338 (5.2%) | 367 (5.0%) |
| 25 to 29 Years | 472 (7.2%) | 197 (2.7%) |
| 30 to 34 Years | 443 (6.8%) | 611 (8.4%) |
| 35 to 39 Years | 358 (5.5%) | 545 (7.5%) |
| 40 to 44 Years | 471 (7.2%) | 442 (6.1%) |
| 45 to 49 Years | 357 (5.5%) | 304 (4.2%) |
| 50 to 54 Years | 383 (5.9%) | 345 (4.7%) |
| 55 to 59 Years | 327 (5.0%) | 464 (6.4%) |
| 60 to 64 Years | 614 (9.4%) | 422 (5.8%) |
| 65 to 69 Years | 309 (4.8%) | 541 (7.4%) |
| 70 to 74 Years | 346 (5.3%) | 426 (5.8%) |
| 75 to 79 Years | 266 (4.1%) | 515 (7.1%) |
| 80 to 84 Years | 109 (1.7%) | 199 (2.7%) |
| 85 Years and over | 163 (2.5%) | 404 (5.5%) |
| Total | 6,507 (100.0%) | 7,295 (100.0%) |
Families and Households in Bedford
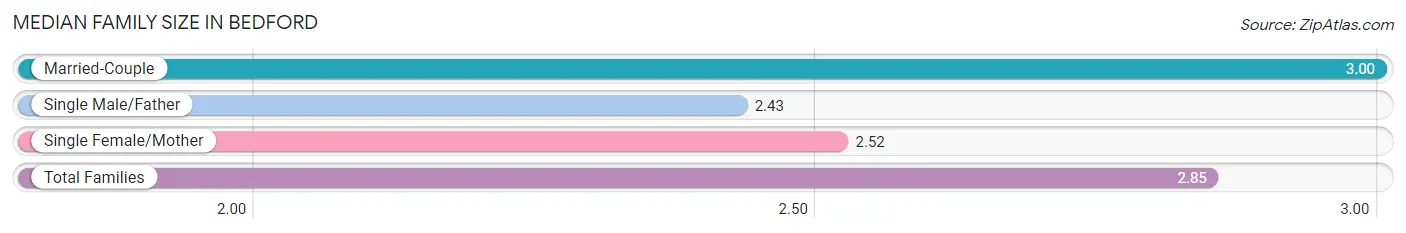
Median Family Size in Bedford
The median family size in Bedford is 2.85 persons per family, with married-couple families (2,295 | 70.3%) accounting for the largest median family size of 3 persons per family. On the other hand, single male/father families (223 | 6.8%) represent the smallest median family size with 2.43 persons per family.
| Family Type | # Families | Family Size |
| Married-Couple | 2,295 (70.3%) | 3.00 |
| Single Male/Father | 223 (6.8%) | 2.43 |
| Single Female/Mother | 749 (22.9%) | 2.52 |
| Total Families | 3,267 (100.0%) | 2.85 |
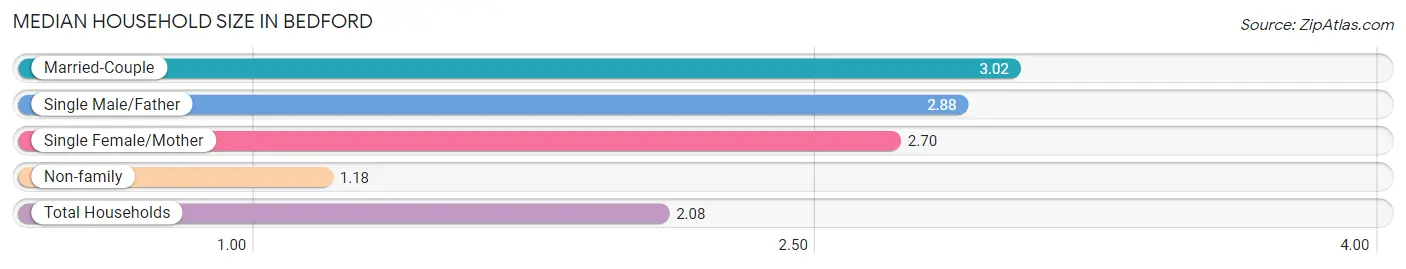
Median Household Size in Bedford
The median household size in Bedford is 2.08 persons per household, with married-couple households (2,295 | 36.0%) accounting for the largest median household size of 3.02 persons per household. non-family households (3,107 | 48.7%) represent the smallest median household size with 1.18 persons per household.
| Household Type | # Households | Household Size |
| Married-Couple | 2,295 (36.0%) | 3.02 |
| Single Male/Father | 223 (3.5%) | 2.88 |
| Single Female/Mother | 749 (11.7%) | 2.70 |
| Non-family | 3,107 (48.7%) | 1.18 |
| Total Households | 6,374 (100.0%) | 2.08 |
Household Size by Marriage Status in Bedford
Out of a total of 6,374 households in Bedford, 3,267 (51.3%) are family households, while 3,107 (48.7%) are nonfamily households. The most numerous type of family households are 2-person households, comprising 1,722, and the most common type of nonfamily households are 1-person households, comprising 2,621.
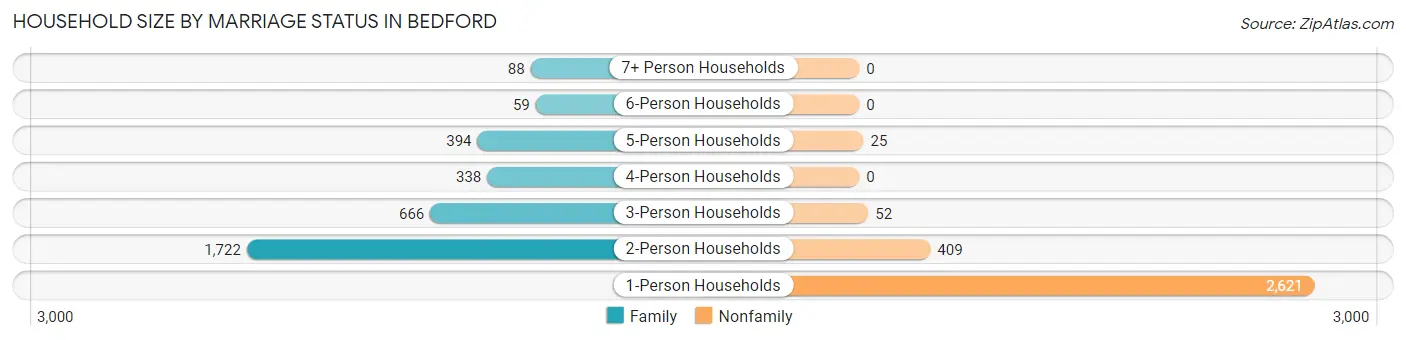
| Household Size | Family Households | Nonfamily Households |
| 1-Person Households | - | 2,621 (41.1%) |
| 2-Person Households | 1,722 (27.0%) | 409 (6.4%) |
| 3-Person Households | 666 (10.4%) | 52 (0.8%) |
| 4-Person Households | 338 (5.3%) | 0 (0.0%) |
| 5-Person Households | 394 (6.2%) | 25 (0.4%) |
| 6-Person Households | 59 (0.9%) | 0 (0.0%) |
| 7+ Person Households | 88 (1.4%) | 0 (0.0%) |
| Total | 3,267 (51.3%) | 3,107 (48.7%) |
Female Fertility in Bedford
Fertility by Age in Bedford
Average fertility rate in Bedford is 55.0 births per 1,000 women. Women in the age bracket of 20 to 34 years have the highest fertility rate with 108.0 births per 1,000 women. Women in the age bracket of 20 to 34 years acount for 80.4% of all women with births.
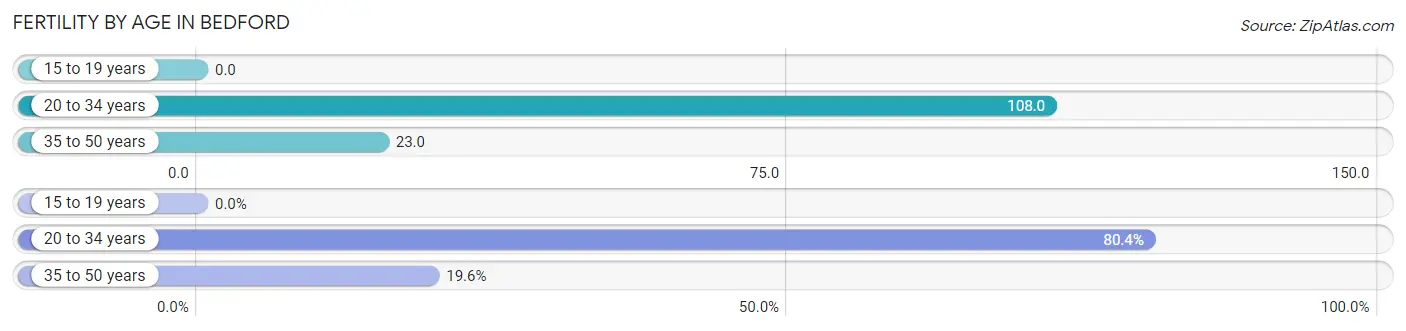
| Age Bracket | Women with Births | Births / 1,000 Women |
| 15 to 19 years | 0 (0.0%) | 0.0 |
| 20 to 34 years | 127 (80.4%) | 108.0 |
| 35 to 50 years | 31 (19.6%) | 23.0 |
| Total | 158 (100.0%) | 55.0 |
Fertility by Age by Marriage Status in Bedford
39.9% of women with births (158) in Bedford are married. The highest percentage of unmarried women with births falls into 35 to 50 years age bracket with 100.0% of them unmarried at the time of birth, while the lowest percentage of unmarried women with births belong to 20 to 34 years age bracket with 50.4% of them unmarried.
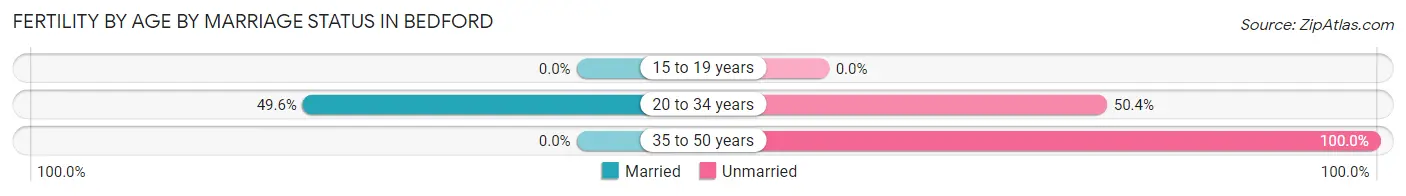
| Age Bracket | Married | Unmarried |
| 15 to 19 years | 0 (0.0%) | 0 (0.0%) |
| 20 to 34 years | 63 (49.6%) | 64 (50.4%) |
| 35 to 50 years | 0 (0.0%) | 31 (100.0%) |
| Total | 63 (39.9%) | 95 (60.1%) |
Fertility by Education in Bedford
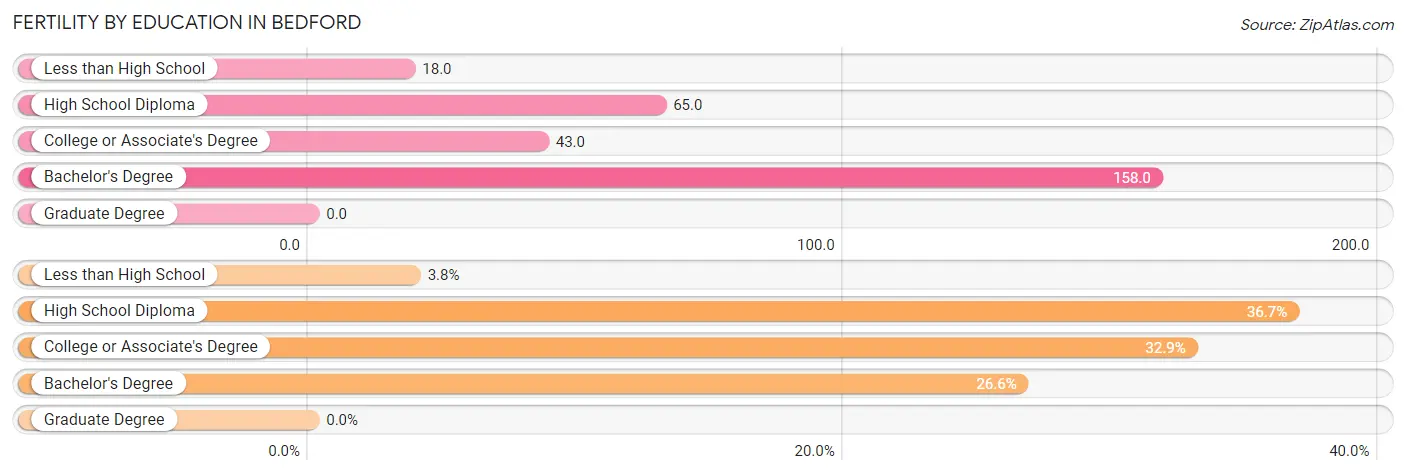
| Educational Attainment | Women with Births | Births / 1,000 Women |
| Less than High School | 6 (3.8%) | 18.0 |
| High School Diploma | 58 (36.7%) | 65.0 |
| College or Associate's Degree | 52 (32.9%) | 43.0 |
| Bachelor's Degree | 42 (26.6%) | 158.0 |
| Graduate Degree | 0 (0.0%) | 0.0 |
| Total | 158 (100.0%) | 55.0 |
Fertility by Education by Marriage Status in Bedford
60.1% of women with births in Bedford are unmarried. Women with the educational attainment of less than high school are most likely to be married with 100.0% of them married at childbirth, while women with the educational attainment of high school diploma are least likely to be married with 89.7% of them unmarried at childbirth.
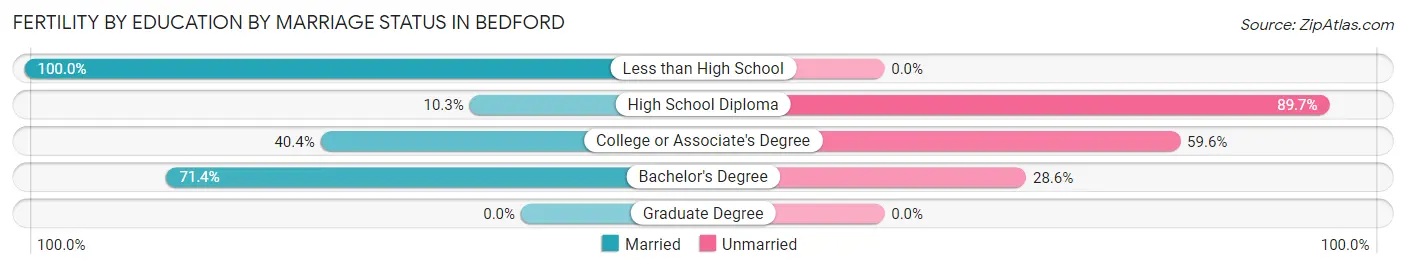
| Educational Attainment | Married | Unmarried |
| Less than High School | 6 (100.0%) | 0 (0.0%) |
| High School Diploma | 6 (10.3%) | 52 (89.7%) |
| College or Associate's Degree | 21 (40.4%) | 31 (59.6%) |
| Bachelor's Degree | 30 (71.4%) | 12 (28.6%) |
| Graduate Degree | 0 (0.0%) | 0 (0.0%) |
| Total | 63 (39.9%) | 95 (60.1%) |
Employment Characteristics in Bedford
Employment by Class of Employer in Bedford
Among the 5,948 employed individuals in Bedford, private company employees (4,525 | 76.1%), not-for-profit organizations (401 | 6.7%), and local government employees (361 | 6.1%) make up the most common classes of employment.
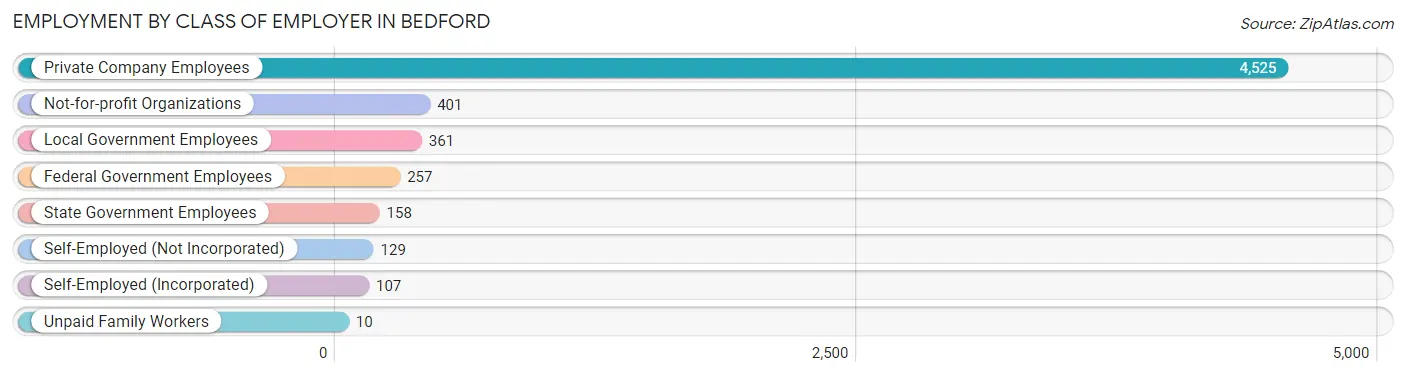
| Employer Class | # Employees | % Employees |
| Private Company Employees | 4,525 | 76.1% |
| Self-Employed (Incorporated) | 107 | 1.8% |
| Self-Employed (Not Incorporated) | 129 | 2.2% |
| Not-for-profit Organizations | 401 | 6.7% |
| Local Government Employees | 361 | 6.1% |
| State Government Employees | 158 | 2.7% |
| Federal Government Employees | 257 | 4.3% |
| Unpaid Family Workers | 10 | 0.2% |
| Total | 5,948 | 100.0% |
Employment Status by Age in Bedford
According to the labor force statistics for Bedford, out of the total population over 16 years of age (11,373), 55.9% or 6,358 individuals are in the labor force, with 3.1% or 197 of them unemployed. The age group with the highest labor force participation rate is 35 to 44 years, with 86.9% or 1,578 individuals in the labor force. Within the labor force, the 16 to 19 years age range has the highest percentage of unemployed individuals, with 6.3% or 23 of them being unemployed.
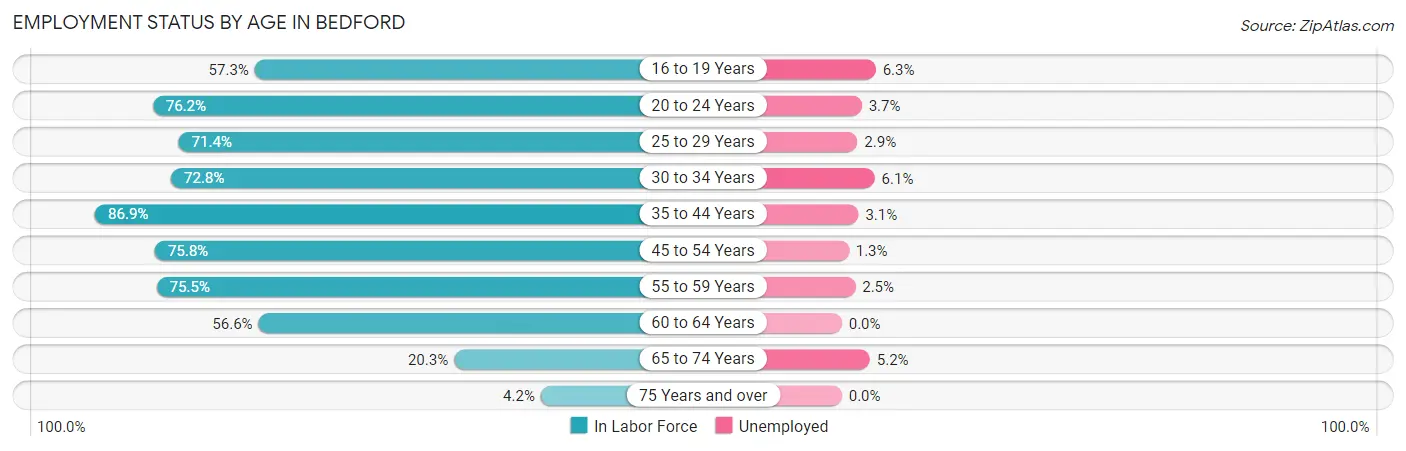
| Age Bracket | In Labor Force | Unemployed |
| 16 to 19 Years | 364 (57.3%) | 23 (6.3%) |
| 20 to 24 Years | 537 (76.2%) | 20 (3.7%) |
| 25 to 29 Years | 478 (71.4%) | 14 (2.9%) |
| 30 to 34 Years | 767 (72.8%) | 47 (6.1%) |
| 35 to 44 Years | 1,578 (86.9%) | 49 (3.1%) |
| 45 to 54 Years | 1,053 (75.8%) | 14 (1.3%) |
| 55 to 59 Years | 597 (75.5%) | 15 (2.5%) |
| 60 to 64 Years | 586 (56.6%) | 0 (0.0%) |
| 65 to 74 Years | 329 (20.3%) | 17 (5.2%) |
| 75 Years and over | 70 (4.2%) | 0 (0.0%) |
| Total | 6,358 (55.9%) | 197 (3.1%) |
Employment Status by Educational Attainment in Bedford
According to labor force statistics for Bedford, 74.9% of individuals (5,059) out of the total population between 25 and 64 years of age (6,755) are in the labor force, with 2.7% or 137 of them being unemployed. The group with the highest labor force participation rate are those with the educational attainment of high school diploma, with 80.3% or 1,794 individuals in the labor force. Within the labor force, individuals with less than high school education have the highest percentage of unemployment, with 4.3% or 11 of them being unemployed.
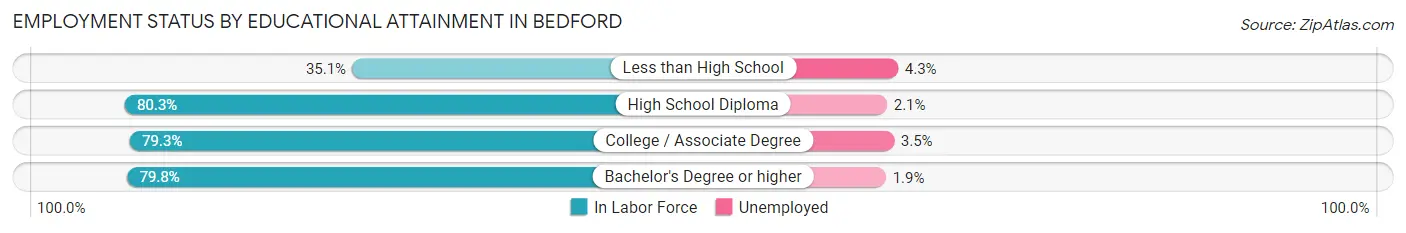
| Educational Attainment | In Labor Force | Unemployed |
| Less than High School | 258 (35.1%) | 32 (4.3%) |
| High School Diploma | 1,794 (80.3%) | 47 (2.1%) |
| College / Associate Degree | 2,043 (79.3%) | 90 (3.5%) |
| Bachelor's Degree or higher | 966 (79.8%) | 23 (1.9%) |
| Total | 5,059 (74.9%) | 182 (2.7%) |
Employment Occupations by Sex in Bedford
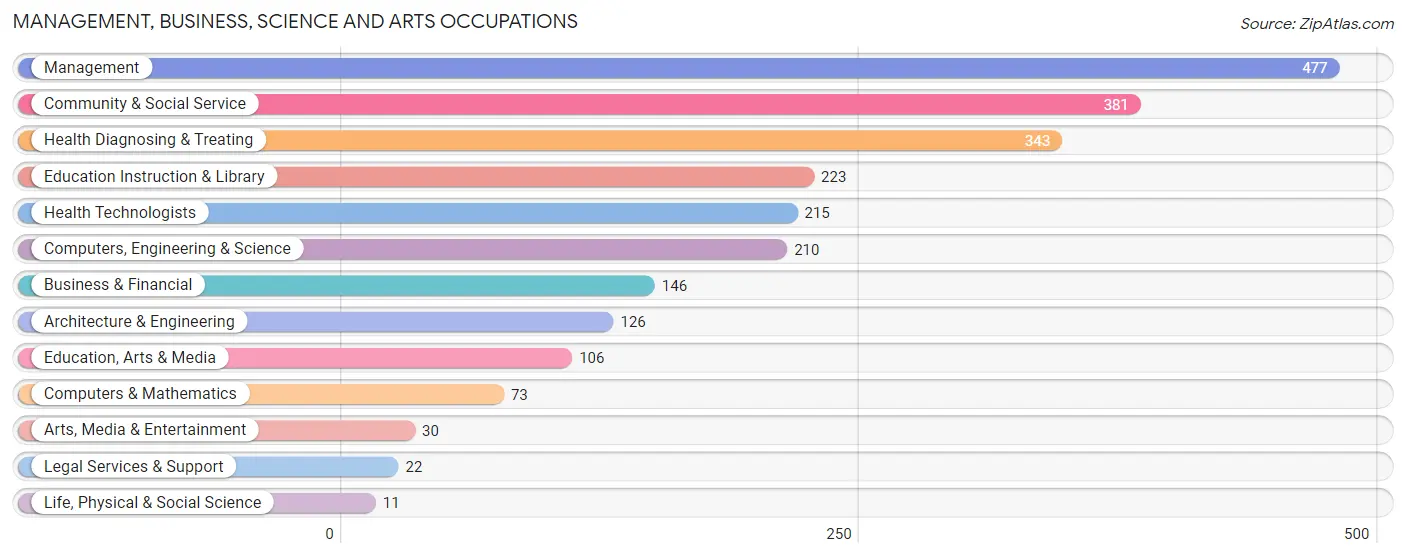
Management, Business, Science and Arts Occupations
The most common Management, Business, Science and Arts occupations in Bedford are Management (477 | 7.7%), Community & Social Service (381 | 6.2%), Health Diagnosing & Treating (343 | 5.6%), Education Instruction & Library (223 | 3.6%), and Health Technologists (215 | 3.5%).
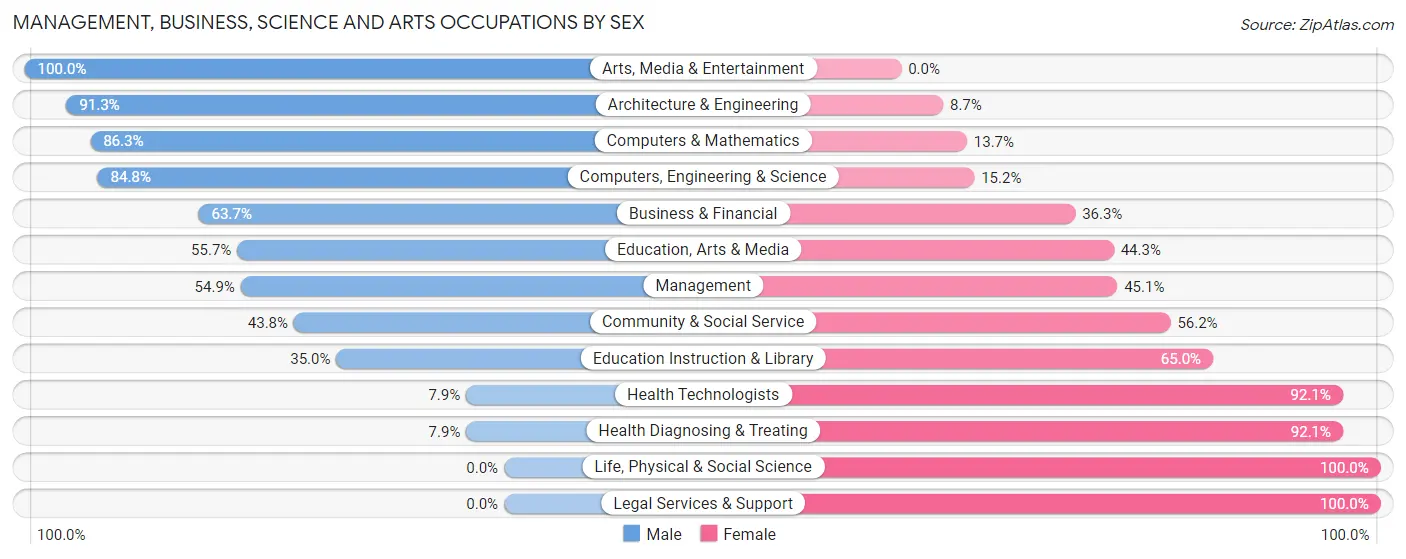
Management, Business, Science and Arts Occupations by Sex
Within the Management, Business, Science and Arts occupations in Bedford, the most male-oriented occupations are Arts, Media & Entertainment (100.0%), Architecture & Engineering (91.3%), and Computers & Mathematics (86.3%), while the most female-oriented occupations are Life, Physical & Social Science (100.0%), Legal Services & Support (100.0%), and Health Diagnosing & Treating (92.1%).
| Occupation | Male | Female |
| Management | 262 (54.9%) | 215 (45.1%) |
| Business & Financial | 93 (63.7%) | 53 (36.3%) |
| Computers, Engineering & Science | 178 (84.8%) | 32 (15.2%) |
| Computers & Mathematics | 63 (86.3%) | 10 (13.7%) |
| Architecture & Engineering | 115 (91.3%) | 11 (8.7%) |
| Life, Physical & Social Science | 0 (0.0%) | 11 (100.0%) |
| Community & Social Service | 167 (43.8%) | 214 (56.2%) |
| Education, Arts & Media | 59 (55.7%) | 47 (44.3%) |
| Legal Services & Support | 0 (0.0%) | 22 (100.0%) |
| Education Instruction & Library | 78 (35.0%) | 145 (65.0%) |
| Arts, Media & Entertainment | 30 (100.0%) | 0 (0.0%) |
| Health Diagnosing & Treating | 27 (7.9%) | 316 (92.1%) |
| Health Technologists | 17 (7.9%) | 198 (92.1%) |
| Total (Category) | 727 (46.7%) | 830 (53.3%) |
| Total (Overall) | 3,072 (49.9%) | 3,088 (50.1%) |
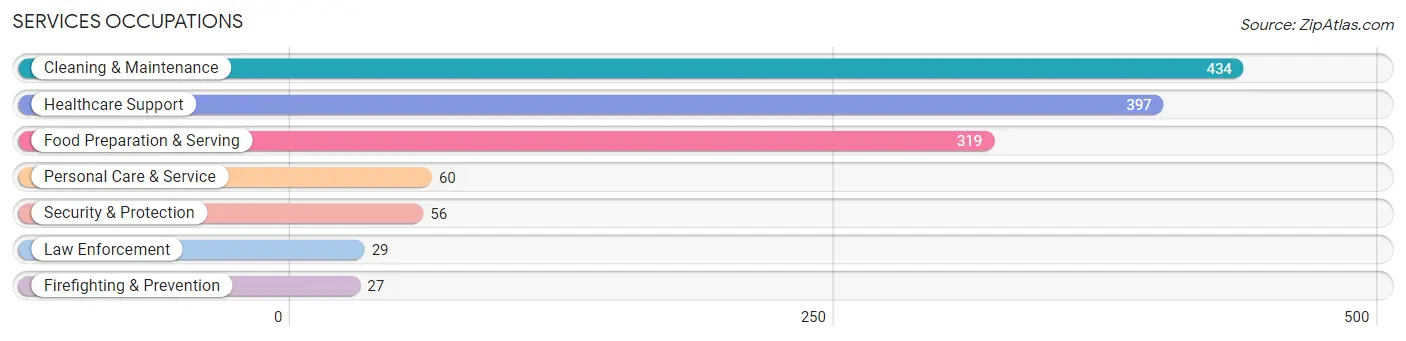
Services Occupations
The most common Services occupations in Bedford are Cleaning & Maintenance (434 | 7.0%), Healthcare Support (397 | 6.4%), Food Preparation & Serving (319 | 5.2%), Personal Care & Service (60 | 1.0%), and Security & Protection (56 | 0.9%).
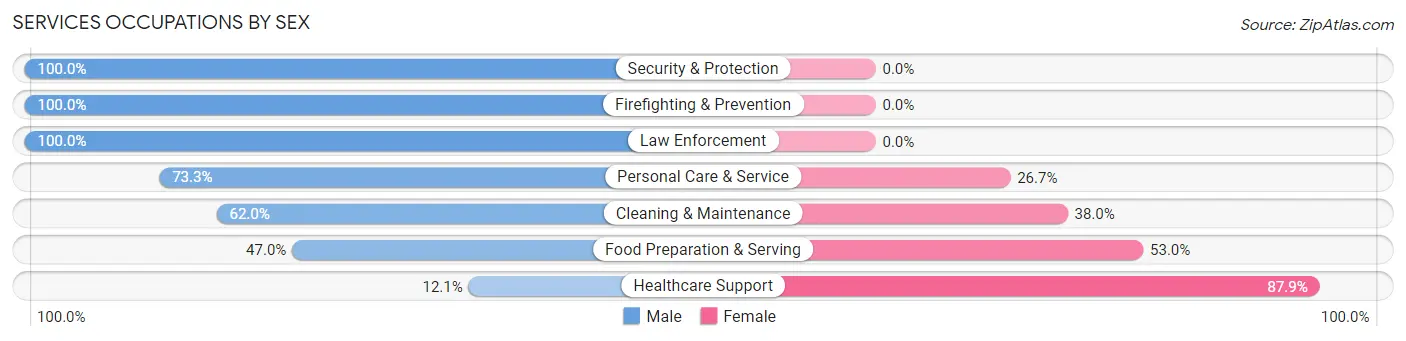
Services Occupations by Sex
Within the Services occupations in Bedford, the most male-oriented occupations are Security & Protection (100.0%), Firefighting & Prevention (100.0%), and Law Enforcement (100.0%), while the most female-oriented occupations are Healthcare Support (87.9%), Food Preparation & Serving (53.0%), and Cleaning & Maintenance (38.0%).
| Occupation | Male | Female |
| Healthcare Support | 48 (12.1%) | 349 (87.9%) |
| Security & Protection | 56 (100.0%) | 0 (0.0%) |
| Firefighting & Prevention | 27 (100.0%) | 0 (0.0%) |
| Law Enforcement | 29 (100.0%) | 0 (0.0%) |
| Food Preparation & Serving | 150 (47.0%) | 169 (53.0%) |
| Cleaning & Maintenance | 269 (62.0%) | 165 (38.0%) |
| Personal Care & Service | 44 (73.3%) | 16 (26.7%) |
| Total (Category) | 567 (44.8%) | 699 (55.2%) |
| Total (Overall) | 3,072 (49.9%) | 3,088 (50.1%) |
Sales and Office Occupations
The most common Sales and Office occupations in Bedford are Office & Administration (721 | 11.7%), and Sales & Related (546 | 8.9%).

Sales and Office Occupations by Sex

| Occupation | Male | Female |
| Sales & Related | 184 (33.7%) | 362 (66.3%) |
| Office & Administration | 66 (9.1%) | 655 (90.8%) |
| Total (Category) | 250 (19.7%) | 1,017 (80.3%) |
| Total (Overall) | 3,072 (49.9%) | 3,088 (50.1%) |
Natural Resources, Construction and Maintenance Occupations
The most common Natural Resources, Construction and Maintenance occupations in Bedford are Installation, Maintenance & Repair (315 | 5.1%), Construction & Extraction (243 | 3.9%), and Farming, Fishing & Forestry (36 | 0.6%).

Natural Resources, Construction and Maintenance Occupations by Sex

| Occupation | Male | Female |
| Farming, Fishing & Forestry | 36 (100.0%) | 0 (0.0%) |
| Construction & Extraction | 242 (99.6%) | 1 (0.4%) |
| Installation, Maintenance & Repair | 315 (100.0%) | 0 (0.0%) |
| Total (Category) | 593 (99.8%) | 1 (0.2%) |
| Total (Overall) | 3,072 (49.9%) | 3,088 (50.1%) |
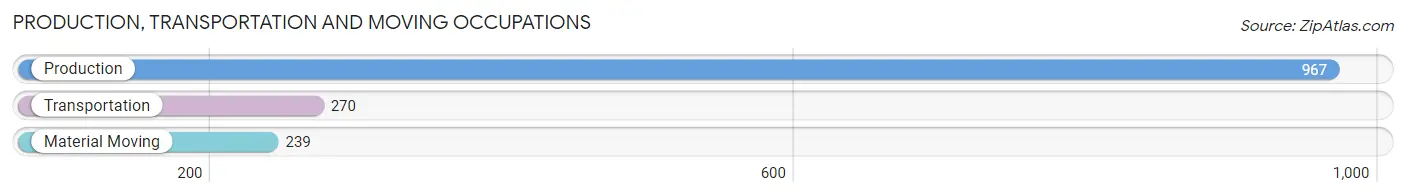
Production, Transportation and Moving Occupations
The most common Production, Transportation and Moving occupations in Bedford are Production (967 | 15.7%), Transportation (270 | 4.4%), and Material Moving (239 | 3.9%).
Production, Transportation and Moving Occupations by Sex
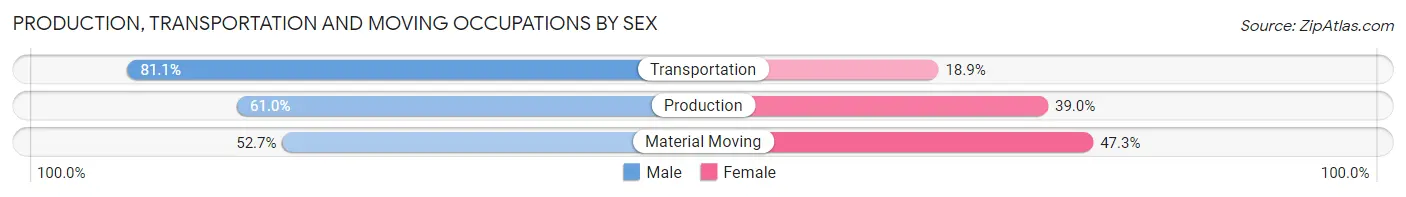
| Occupation | Male | Female |
| Production | 590 (61.0%) | 377 (39.0%) |
| Transportation | 219 (81.1%) | 51 (18.9%) |
| Material Moving | 126 (52.7%) | 113 (47.3%) |
| Total (Category) | 935 (63.3%) | 541 (36.6%) |
| Total (Overall) | 3,072 (49.9%) | 3,088 (50.1%) |
Employment Industries by Sex in Bedford
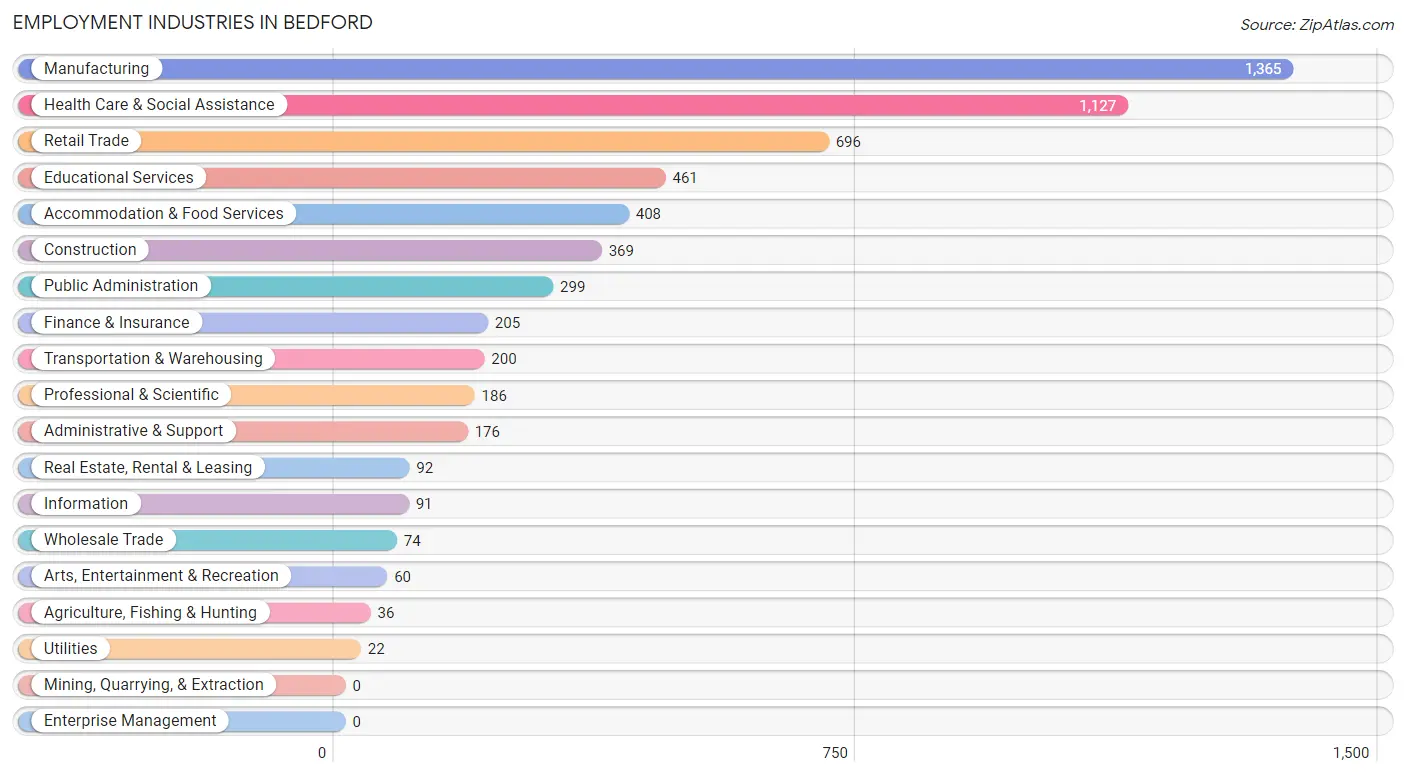
Employment Industries in Bedford
The major employment industries in Bedford include Manufacturing (1,365 | 22.2%), Health Care & Social Assistance (1,127 | 18.3%), Retail Trade (696 | 11.3%), Educational Services (461 | 7.5%), and Accommodation & Food Services (408 | 6.6%).
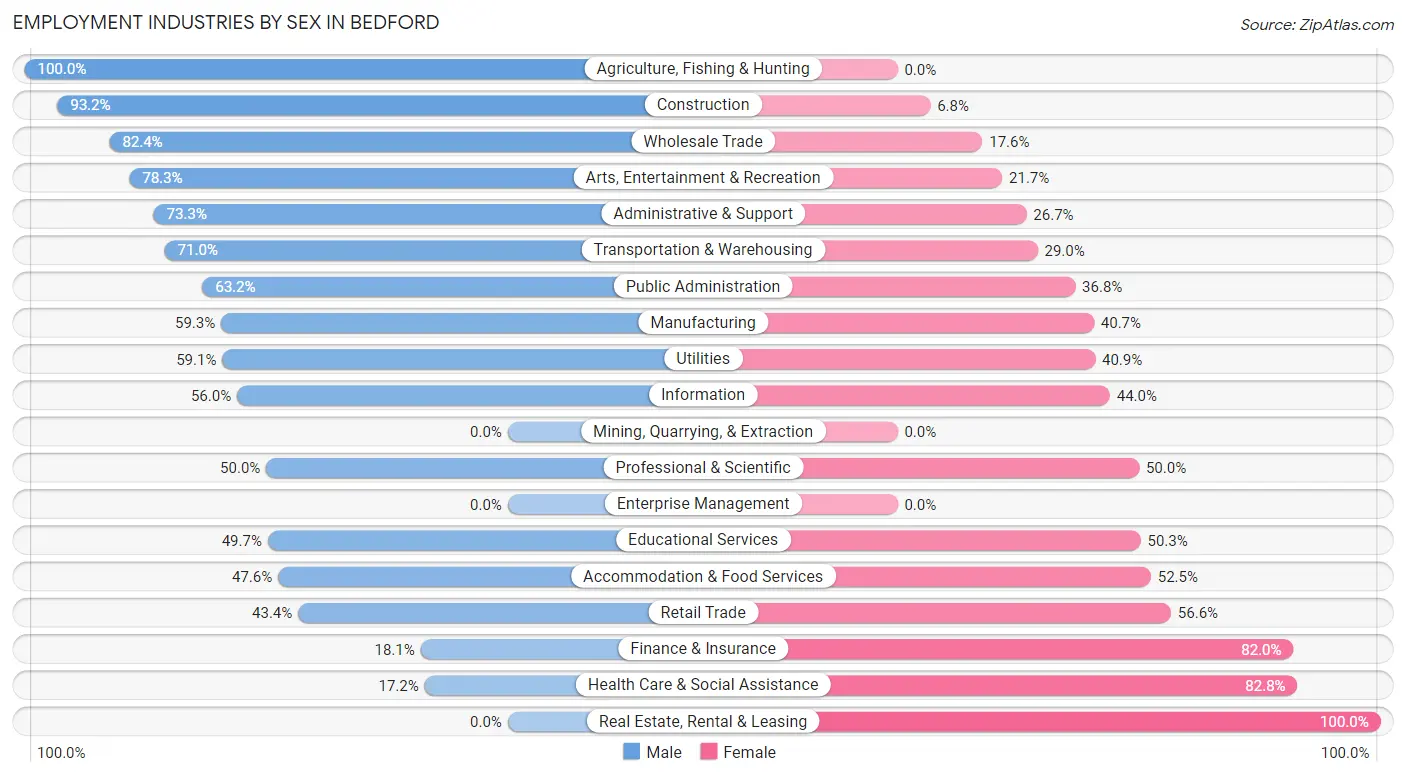
Employment Industries by Sex in Bedford
The Bedford industries that see more men than women are Agriculture, Fishing & Hunting (100.0%), Construction (93.2%), and Wholesale Trade (82.4%), whereas the industries that tend to have a higher number of women are Real Estate, Rental & Leasing (100.0%), Health Care & Social Assistance (82.8%), and Finance & Insurance (82.0%).
| Industry | Male | Female |
| Agriculture, Fishing & Hunting | 36 (100.0%) | 0 (0.0%) |
| Mining, Quarrying, & Extraction | 0 (0.0%) | 0 (0.0%) |
| Construction | 344 (93.2%) | 25 (6.8%) |
| Manufacturing | 810 (59.3%) | 555 (40.7%) |
| Wholesale Trade | 61 (82.4%) | 13 (17.6%) |
| Retail Trade | 302 (43.4%) | 394 (56.6%) |
| Transportation & Warehousing | 142 (71.0%) | 58 (29.0%) |
| Utilities | 13 (59.1%) | 9 (40.9%) |
| Information | 51 (56.0%) | 40 (44.0%) |
| Finance & Insurance | 37 (18.0%) | 168 (82.0%) |
| Real Estate, Rental & Leasing | 0 (0.0%) | 92 (100.0%) |
| Professional & Scientific | 93 (50.0%) | 93 (50.0%) |
| Enterprise Management | 0 (0.0%) | 0 (0.0%) |
| Administrative & Support | 129 (73.3%) | 47 (26.7%) |
| Educational Services | 229 (49.7%) | 232 (50.3%) |
| Health Care & Social Assistance | 194 (17.2%) | 933 (82.8%) |
| Arts, Entertainment & Recreation | 47 (78.3%) | 13 (21.7%) |
| Accommodation & Food Services | 194 (47.5%) | 214 (52.4%) |
| Public Administration | 189 (63.2%) | 110 (36.8%) |
| Total | 3,072 (49.9%) | 3,088 (50.1%) |
Education in Bedford
School Enrollment in Bedford
The most common levels of schooling among the 2,409 students in Bedford are middle school (771 | 32.0%), elementary school (522 | 21.7%), and high school (465 | 19.3%).
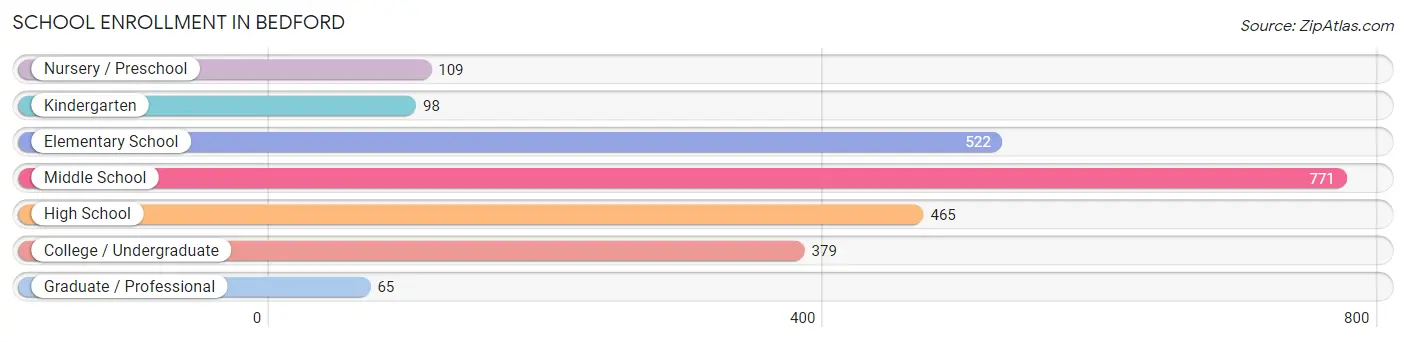
| School Level | # Students | % Students |
| Nursery / Preschool | 109 | 4.5% |
| Kindergarten | 98 | 4.1% |
| Elementary School | 522 | 21.7% |
| Middle School | 771 | 32.0% |
| High School | 465 | 19.3% |
| College / Undergraduate | 379 | 15.7% |
| Graduate / Professional | 65 | 2.7% |
| Total | 2,409 | 100.0% |
School Enrollment by Age by Funding Source in Bedford
Out of a total of 2,409 students who are enrolled in schools in Bedford, 359 (14.9%) attend a private institution, while the remaining 2,050 (85.1%) are enrolled in public schools. The age group of 3 to 4 year olds has the highest likelihood of being enrolled in private schools, with 18 (40.0% in the age bracket) enrolled. Conversely, the age group of 35 years and over has the lowest likelihood of being enrolled in a private school, with 27 (100.0% in the age bracket) attending a public institution.
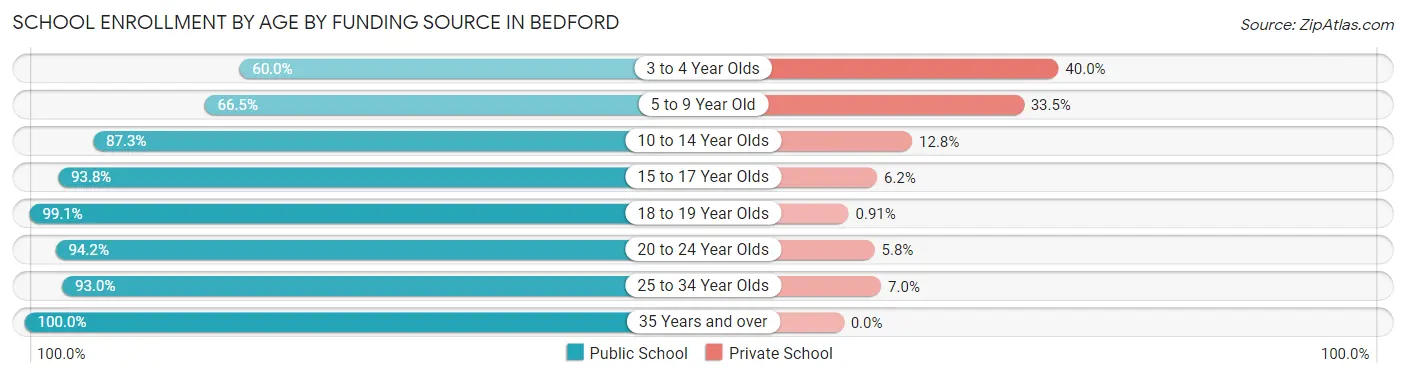
| Age Bracket | Public School | Private School |
| 3 to 4 Year Olds | 27 (60.0%) | 18 (40.0%) |
| 5 to 9 Year Old | 331 (66.5%) | 167 (33.5%) |
| 10 to 14 Year Olds | 869 (87.3%) | 127 (12.8%) |
| 15 to 17 Year Olds | 347 (93.8%) | 23 (6.2%) |
| 18 to 19 Year Olds | 109 (99.1%) | 1 (0.9%) |
| 20 to 24 Year Olds | 180 (94.2%) | 11 (5.8%) |
| 25 to 34 Year Olds | 160 (93.0%) | 12 (7.0%) |
| 35 Years and over | 27 (100.0%) | 0 (0.0%) |
| Total | 2,050 (85.1%) | 359 (14.9%) |
Educational Attainment by Field of Study in Bedford
Business (369 | 20.4%), education (281 | 15.6%), science & technology (240 | 13.3%), engineering (186 | 10.3%), and arts & humanities (140 | 7.8%) are the most common fields of study among 1,804 individuals in Bedford who have obtained a bachelor's degree or higher.
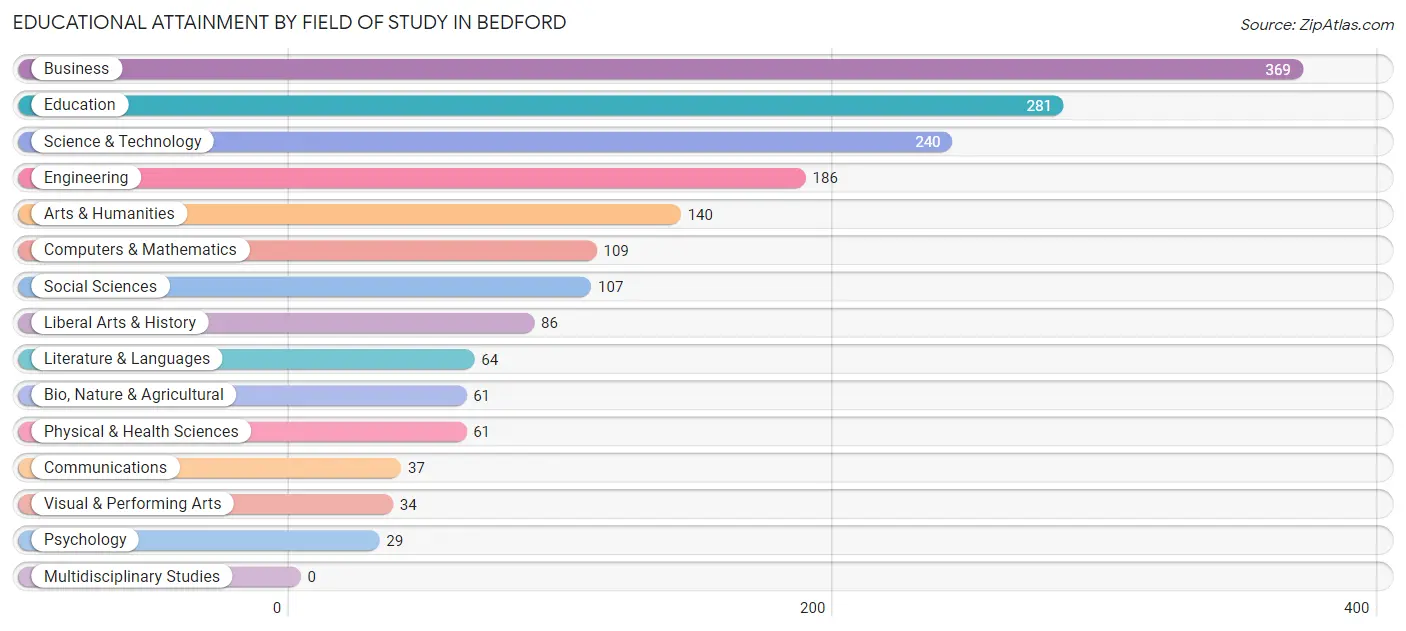
| Field of Study | # Graduates | % Graduates |
| Computers & Mathematics | 109 | 6.0% |
| Bio, Nature & Agricultural | 61 | 3.4% |
| Physical & Health Sciences | 61 | 3.4% |
| Psychology | 29 | 1.6% |
| Social Sciences | 107 | 5.9% |
| Engineering | 186 | 10.3% |
| Multidisciplinary Studies | 0 | 0.0% |
| Science & Technology | 240 | 13.3% |
| Business | 369 | 20.4% |
| Education | 281 | 15.6% |
| Literature & Languages | 64 | 3.5% |
| Liberal Arts & History | 86 | 4.8% |
| Visual & Performing Arts | 34 | 1.9% |
| Communications | 37 | 2.1% |
| Arts & Humanities | 140 | 7.8% |
| Total | 1,804 | 100.0% |
Transportation & Commute in Bedford
Vehicle Availability by Sex in Bedford
The most prevalent vehicle ownership categories in Bedford are males with 2 vehicles (1,452, accounting for 48.6%) and females with 2 vehicles (1,217, making up 49.2%).
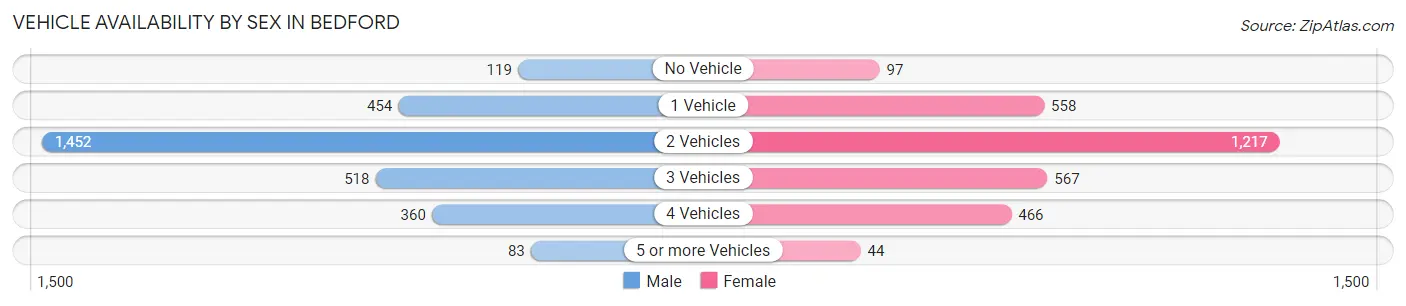
| Vehicles Available | Male | Female |
| No Vehicle | 119 (4.0%) | 97 (3.3%) |
| 1 Vehicle | 454 (15.2%) | 558 (18.9%) |
| 2 Vehicles | 1,452 (48.6%) | 1,217 (41.3%) |
| 3 Vehicles | 518 (17.3%) | 567 (19.2%) |
| 4 Vehicles | 360 (12.1%) | 466 (15.8%) |
| 5 or more Vehicles | 83 (2.8%) | 44 (1.5%) |
| Total | 2,986 (100.0%) | 2,949 (100.0%) |
Commute Time in Bedford
The most frequently occuring commute durations in Bedford are 5 to 9 minutes (1,268 commuters, 22.3%), 10 to 14 minutes (1,092 commuters, 19.2%), and 30 to 34 minutes (678 commuters, 11.9%).
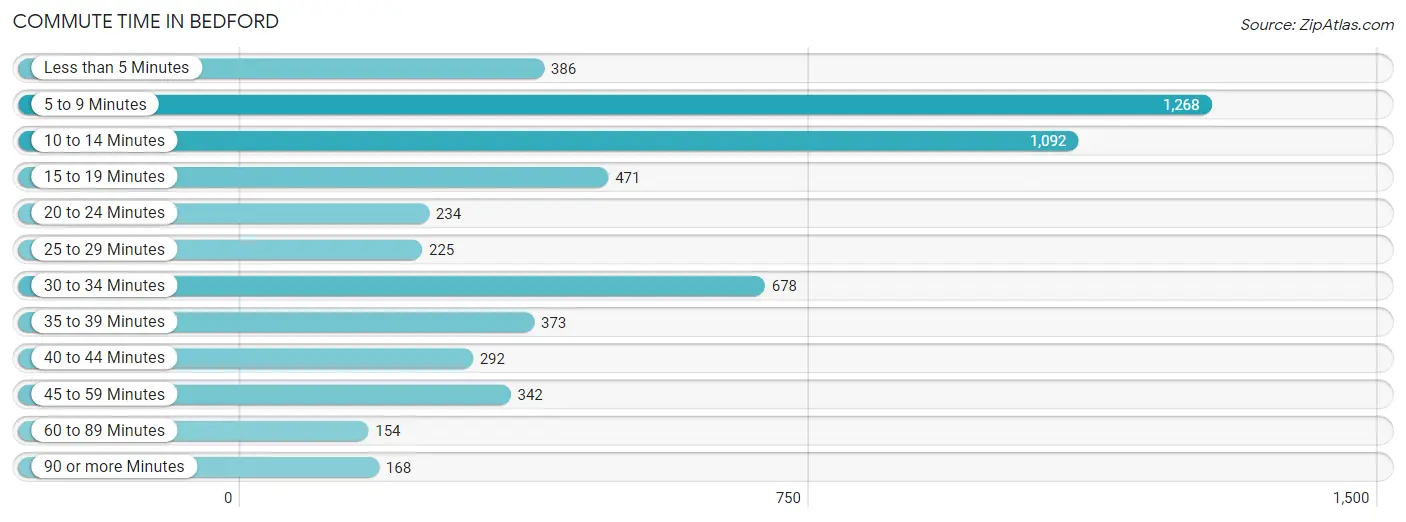
| Commute Time | # Commuters | % Commuters |
| Less than 5 Minutes | 386 | 6.8% |
| 5 to 9 Minutes | 1,268 | 22.3% |
| 10 to 14 Minutes | 1,092 | 19.2% |
| 15 to 19 Minutes | 471 | 8.3% |
| 20 to 24 Minutes | 234 | 4.1% |
| 25 to 29 Minutes | 225 | 4.0% |
| 30 to 34 Minutes | 678 | 11.9% |
| 35 to 39 Minutes | 373 | 6.6% |
| 40 to 44 Minutes | 292 | 5.1% |
| 45 to 59 Minutes | 342 | 6.0% |
| 60 to 89 Minutes | 154 | 2.7% |
| 90 or more Minutes | 168 | 3.0% |
Commute Time by Sex in Bedford
The most common commute times in Bedford are 5 to 9 minutes (580 commuters, 20.2%) for males and 5 to 9 minutes (688 commuters, 24.5%) for females.
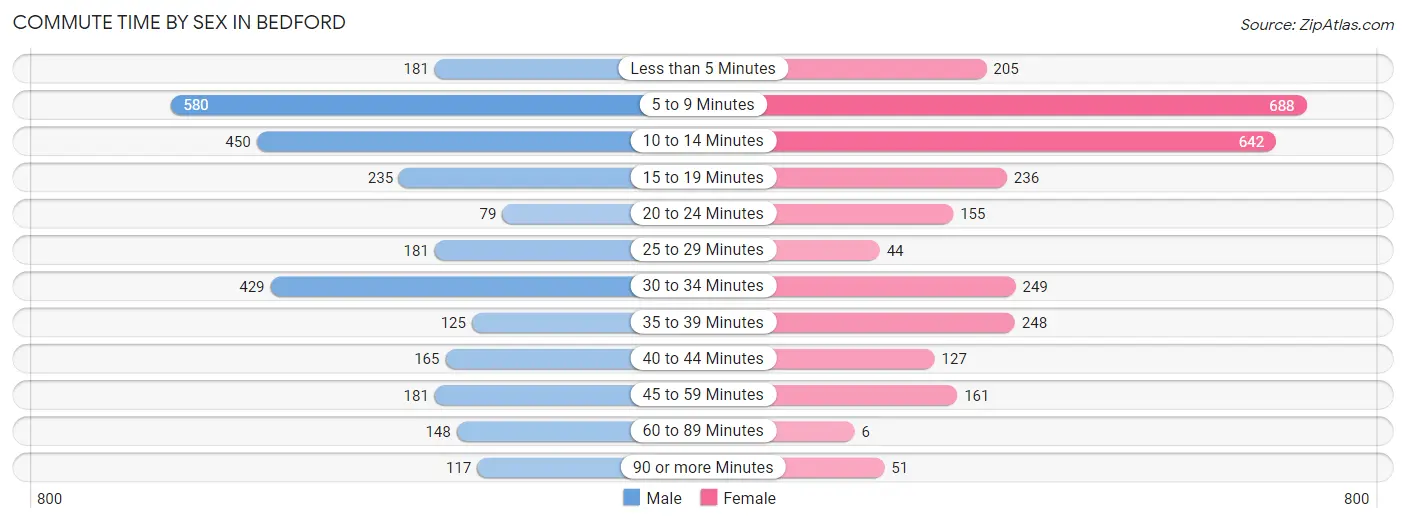
| Commute Time | Male | Female |
| Less than 5 Minutes | 181 (6.3%) | 205 (7.3%) |
| 5 to 9 Minutes | 580 (20.2%) | 688 (24.5%) |
| 10 to 14 Minutes | 450 (15.7%) | 642 (22.8%) |
| 15 to 19 Minutes | 235 (8.2%) | 236 (8.4%) |
| 20 to 24 Minutes | 79 (2.8%) | 155 (5.5%) |
| 25 to 29 Minutes | 181 (6.3%) | 44 (1.6%) |
| 30 to 34 Minutes | 429 (14.9%) | 249 (8.8%) |
| 35 to 39 Minutes | 125 (4.3%) | 248 (8.8%) |
| 40 to 44 Minutes | 165 (5.8%) | 127 (4.5%) |
| 45 to 59 Minutes | 181 (6.3%) | 161 (5.7%) |
| 60 to 89 Minutes | 148 (5.1%) | 6 (0.2%) |
| 90 or more Minutes | 117 (4.1%) | 51 (1.8%) |
Time of Departure to Work by Sex in Bedford
The most frequent times of departure to work in Bedford are 6:30 AM to 6:59 AM (401, 14.0%) for males and 4:00 PM to 11:59 PM (386, 13.7%) for females.
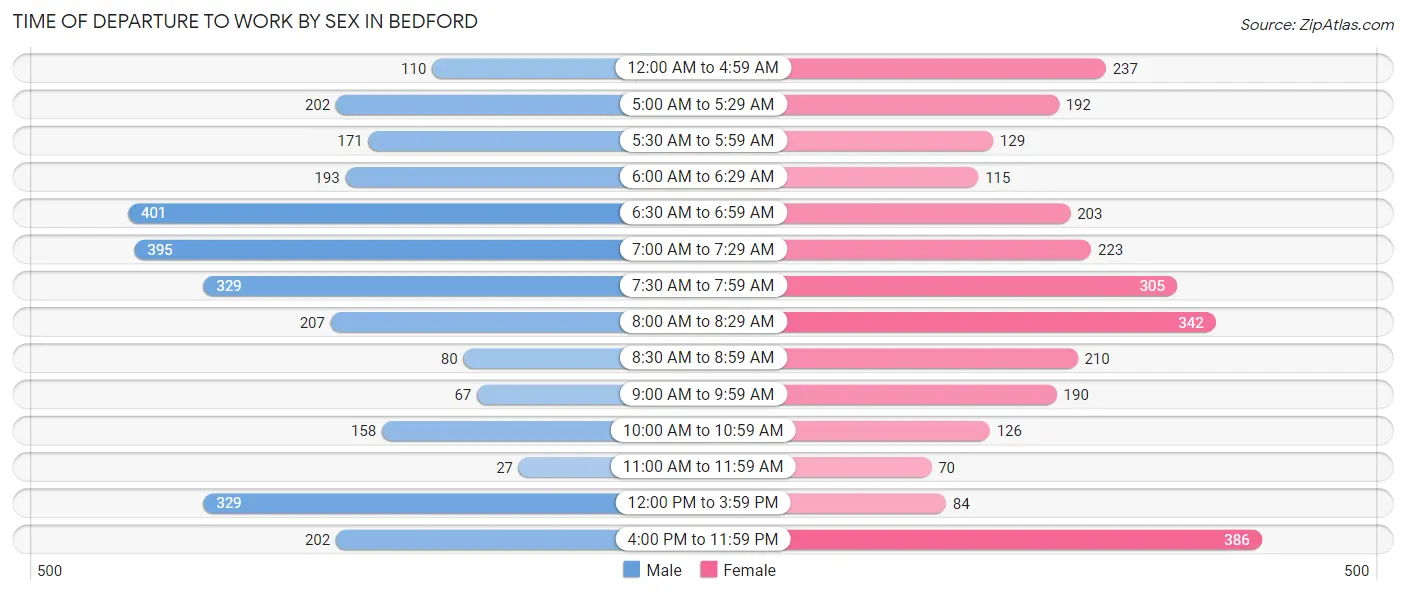
| Time of Departure | Male | Female |
| 12:00 AM to 4:59 AM | 110 (3.8%) | 237 (8.4%) |
| 5:00 AM to 5:29 AM | 202 (7.0%) | 192 (6.8%) |
| 5:30 AM to 5:59 AM | 171 (6.0%) | 129 (4.6%) |
| 6:00 AM to 6:29 AM | 193 (6.7%) | 115 (4.1%) |
| 6:30 AM to 6:59 AM | 401 (14.0%) | 203 (7.2%) |
| 7:00 AM to 7:29 AM | 395 (13.8%) | 223 (7.9%) |
| 7:30 AM to 7:59 AM | 329 (11.5%) | 305 (10.8%) |
| 8:00 AM to 8:29 AM | 207 (7.2%) | 342 (12.2%) |
| 8:30 AM to 8:59 AM | 80 (2.8%) | 210 (7.5%) |
| 9:00 AM to 9:59 AM | 67 (2.3%) | 190 (6.8%) |
| 10:00 AM to 10:59 AM | 158 (5.5%) | 126 (4.5%) |
| 11:00 AM to 11:59 AM | 27 (0.9%) | 70 (2.5%) |
| 12:00 PM to 3:59 PM | 329 (11.5%) | 84 (3.0%) |
| 4:00 PM to 11:59 PM | 202 (7.0%) | 386 (13.7%) |
| Total | 2,871 (100.0%) | 2,812 (100.0%) |
Housing Occupancy in Bedford
Occupancy by Ownership in Bedford
Of the total 6,374 dwellings in Bedford, owner-occupied units account for 4,140 (64.9%), while renter-occupied units make up 2,234 (35.0%).
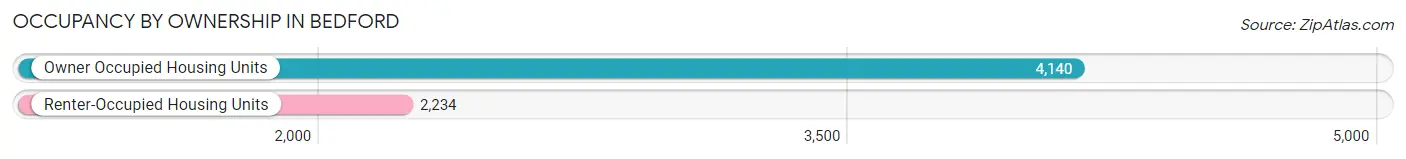
| Occupancy | # Housing Units | % Housing Units |
| Owner Occupied Housing Units | 4,140 | 64.9% |
| Renter-Occupied Housing Units | 2,234 | 35.0% |
| Total Occupied Housing Units | 6,374 | 100.0% |
Occupancy by Household Size in Bedford
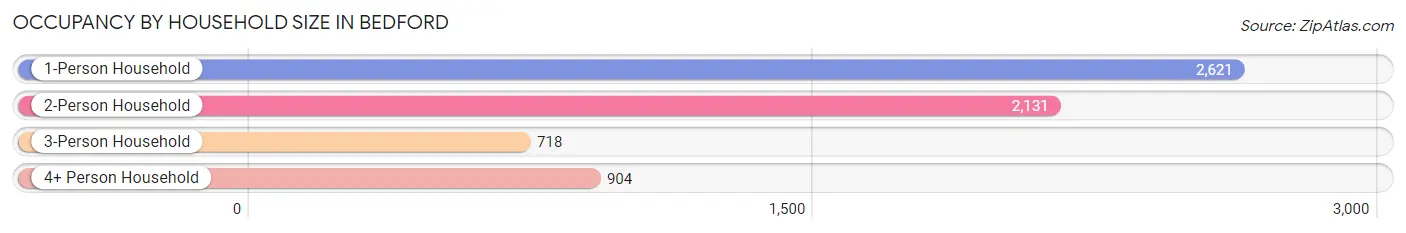
| Household Size | # Housing Units | % Housing Units |
| 1-Person Household | 2,621 | 41.1% |
| 2-Person Household | 2,131 | 33.4% |
| 3-Person Household | 718 | 11.3% |
| 4+ Person Household | 904 | 14.2% |
| Total Housing Units | 6,374 | 100.0% |
Occupancy by Ownership by Household Size in Bedford
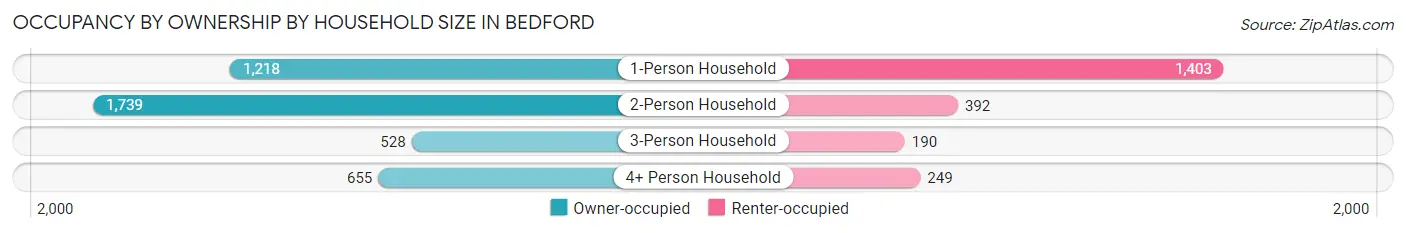
| Household Size | Owner-occupied | Renter-occupied |
| 1-Person Household | 1,218 (46.5%) | 1,403 (53.5%) |
| 2-Person Household | 1,739 (81.6%) | 392 (18.4%) |
| 3-Person Household | 528 (73.5%) | 190 (26.5%) |
| 4+ Person Household | 655 (72.5%) | 249 (27.5%) |
| Total Housing Units | 4,140 (64.9%) | 2,234 (35.0%) |
Occupancy by Educational Attainment in Bedford
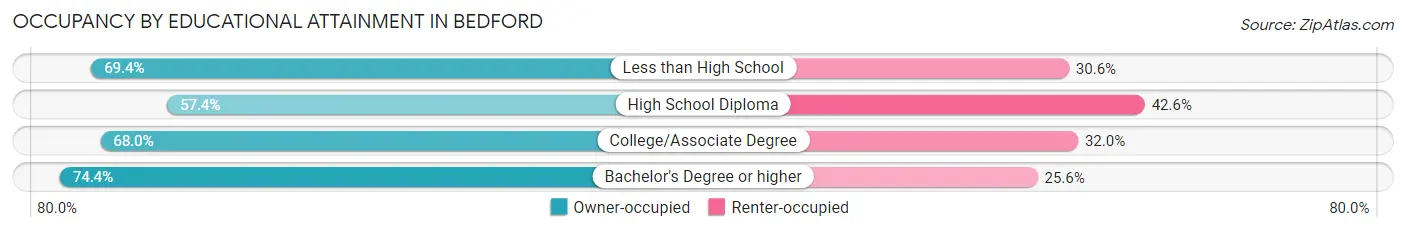
| Household Size | Owner-occupied | Renter-occupied |
| Less than High School | 393 (69.4%) | 173 (30.6%) |
| High School Diploma | 1,470 (57.4%) | 1,091 (42.6%) |
| College/Associate Degree | 1,472 (68.0%) | 693 (32.0%) |
| Bachelor's Degree or higher | 805 (74.4%) | 277 (25.6%) |
Occupancy by Age of Householder in Bedford
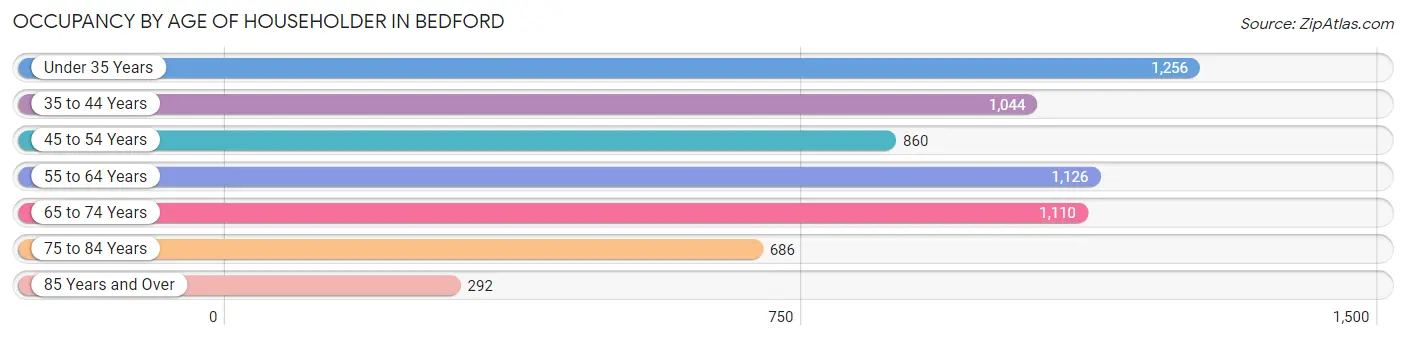
| Age Bracket | # Households | % Households |
| Under 35 Years | 1,256 | 19.7% |
| 35 to 44 Years | 1,044 | 16.4% |
| 45 to 54 Years | 860 | 13.5% |
| 55 to 64 Years | 1,126 | 17.7% |
| 65 to 74 Years | 1,110 | 17.4% |
| 75 to 84 Years | 686 | 10.8% |
| 85 Years and Over | 292 | 4.6% |
| Total | 6,374 | 100.0% |
Housing Finances in Bedford
Median Income by Occupancy in Bedford
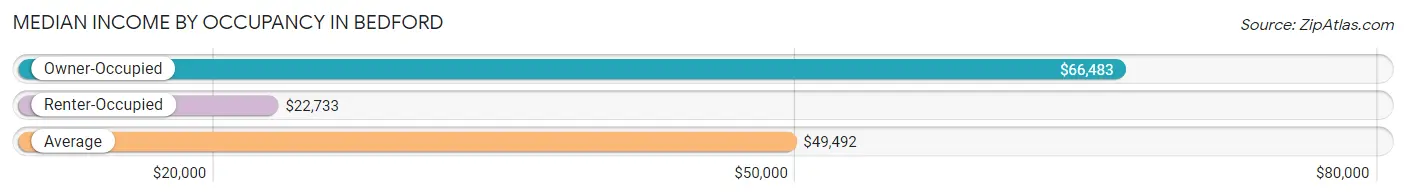
| Occupancy Type | # Households | Median Income |
| Owner-Occupied | 4,140 (64.9%) | $66,483 |
| Renter-Occupied | 2,234 (35.0%) | $22,733 |
| Average | 6,374 (100.0%) | $49,492 |
Occupancy by Householder Income Bracket in Bedford
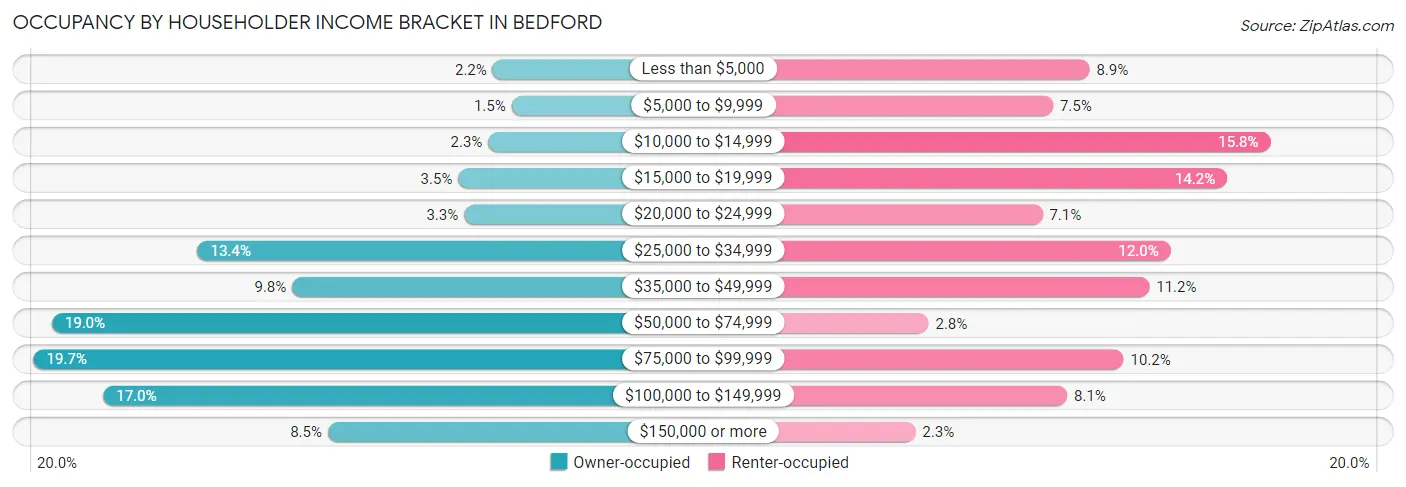
| Income Bracket | Owner-occupied | Renter-occupied |
| Less than $5,000 | 90 (2.2%) | 199 (8.9%) |
| $5,000 to $9,999 | 60 (1.5%) | 168 (7.5%) |
| $10,000 to $14,999 | 97 (2.3%) | 353 (15.8%) |
| $15,000 to $19,999 | 144 (3.5%) | 316 (14.1%) |
| $20,000 to $24,999 | 135 (3.3%) | 159 (7.1%) |
| $25,000 to $34,999 | 555 (13.4%) | 268 (12.0%) |
| $35,000 to $49,999 | 406 (9.8%) | 250 (11.2%) |
| $50,000 to $74,999 | 785 (19.0%) | 62 (2.8%) |
| $75,000 to $99,999 | 814 (19.7%) | 228 (10.2%) |
| $100,000 to $149,999 | 704 (17.0%) | 180 (8.1%) |
| $150,000 or more | 350 (8.5%) | 51 (2.3%) |
| Total | 4,140 (100.0%) | 2,234 (100.0%) |
Monthly Housing Cost Tiers in Bedford
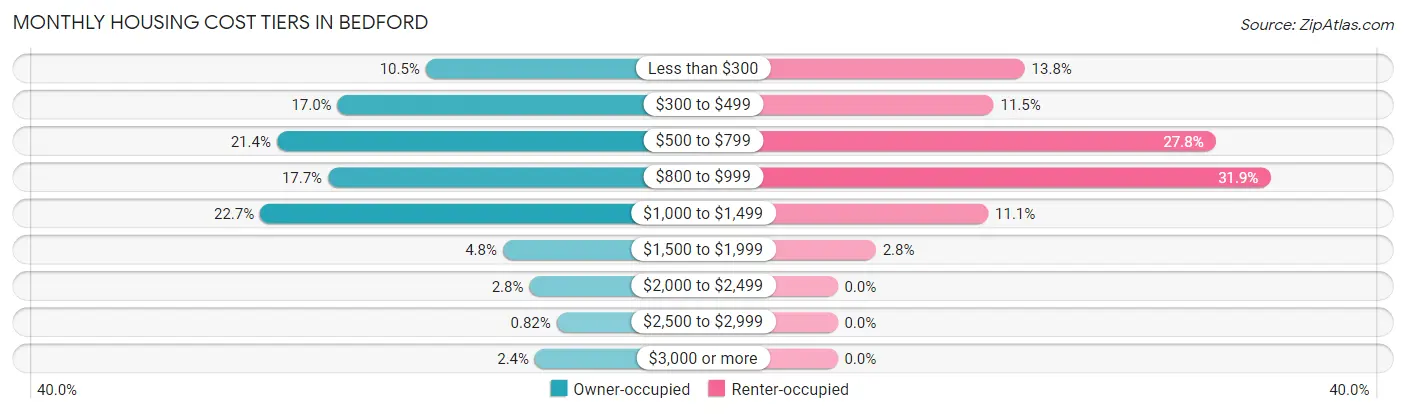
| Monthly Cost | Owner-occupied | Renter-occupied |
| Less than $300 | 433 (10.5%) | 308 (13.8%) |
| $300 to $499 | 702 (17.0%) | 257 (11.5%) |
| $500 to $799 | 887 (21.4%) | 622 (27.8%) |
| $800 to $999 | 731 (17.7%) | 712 (31.9%) |
| $1,000 to $1,499 | 938 (22.7%) | 248 (11.1%) |
| $1,500 to $1,999 | 198 (4.8%) | 63 (2.8%) |
| $2,000 to $2,499 | 117 (2.8%) | 0 (0.0%) |
| $2,500 to $2,999 | 34 (0.8%) | 0 (0.0%) |
| $3,000 or more | 100 (2.4%) | 0 (0.0%) |
| Total | 4,140 (100.0%) | 2,234 (100.0%) |
Physical Housing Characteristics in Bedford
Housing Structures in Bedford
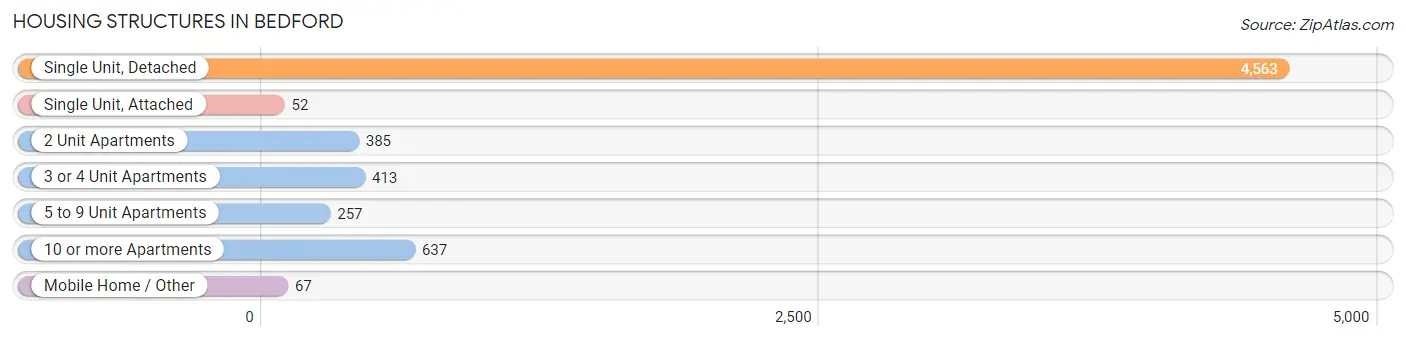
| Structure Type | # Housing Units | % Housing Units |
| Single Unit, Detached | 4,563 | 71.6% |
| Single Unit, Attached | 52 | 0.8% |
| 2 Unit Apartments | 385 | 6.0% |
| 3 or 4 Unit Apartments | 413 | 6.5% |
| 5 to 9 Unit Apartments | 257 | 4.0% |
| 10 or more Apartments | 637 | 10.0% |
| Mobile Home / Other | 67 | 1.1% |
| Total | 6,374 | 100.0% |
Housing Structures by Occupancy in Bedford
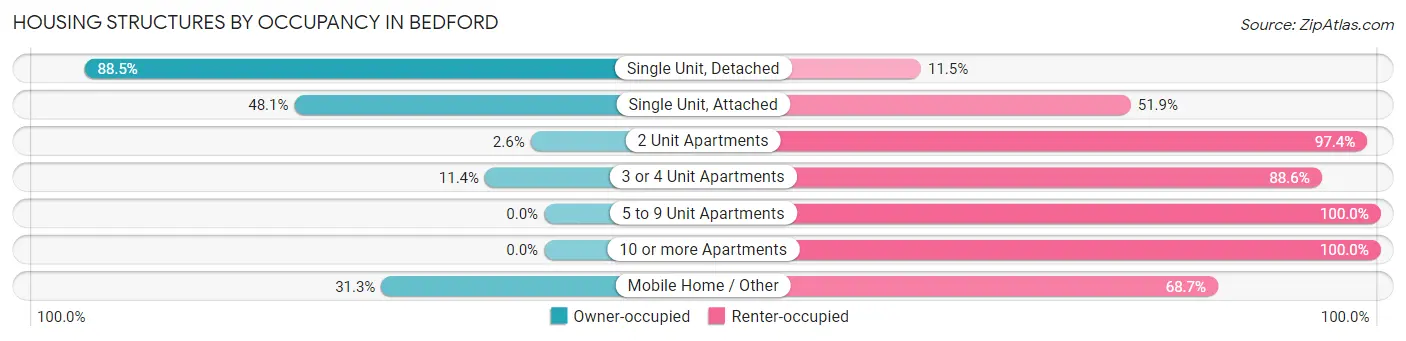
| Structure Type | Owner-occupied | Renter-occupied |
| Single Unit, Detached | 4,037 (88.5%) | 526 (11.5%) |
| Single Unit, Attached | 25 (48.1%) | 27 (51.9%) |
| 2 Unit Apartments | 10 (2.6%) | 375 (97.4%) |
| 3 or 4 Unit Apartments | 47 (11.4%) | 366 (88.6%) |
| 5 to 9 Unit Apartments | 0 (0.0%) | 257 (100.0%) |
| 10 or more Apartments | 0 (0.0%) | 637 (100.0%) |
| Mobile Home / Other | 21 (31.3%) | 46 (68.7%) |
| Total | 4,140 (64.9%) | 2,234 (35.0%) |
Housing Structures by Number of Rooms in Bedford
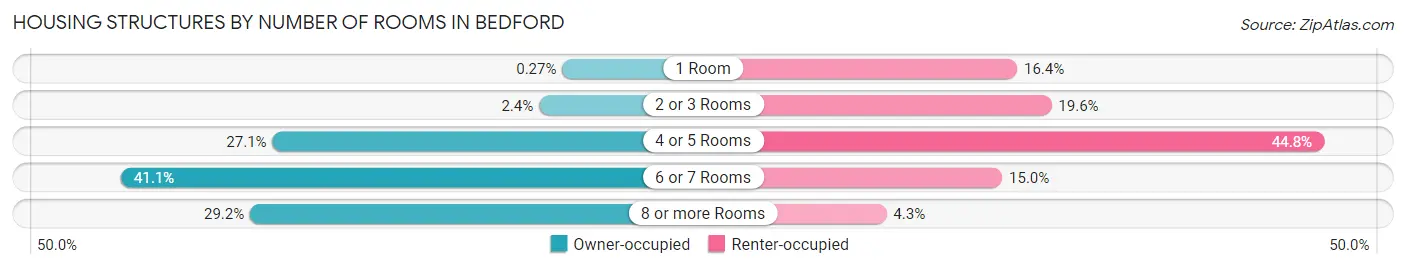
| Number of Rooms | Owner-occupied | Renter-occupied |
| 1 Room | 11 (0.3%) | 366 (16.4%) |
| 2 or 3 Rooms | 100 (2.4%) | 437 (19.6%) |
| 4 or 5 Rooms | 1,121 (27.1%) | 1,000 (44.8%) |
| 6 or 7 Rooms | 1,701 (41.1%) | 335 (15.0%) |
| 8 or more Rooms | 1,207 (29.1%) | 96 (4.3%) |
| Total | 4,140 (100.0%) | 2,234 (100.0%) |
Housing Structure by Heating Type in Bedford
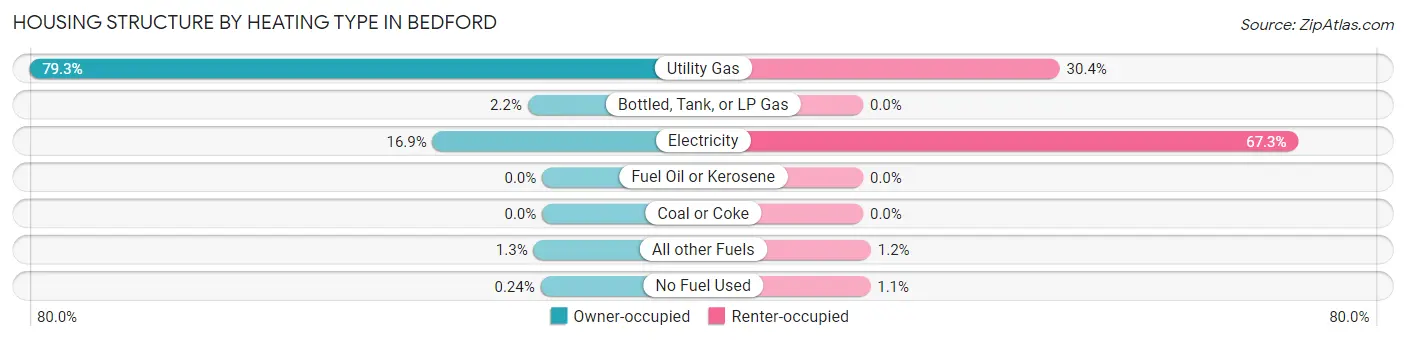
| Heating Type | Owner-occupied | Renter-occupied |
| Utility Gas | 3,282 (79.3%) | 679 (30.4%) |
| Bottled, Tank, or LP Gas | 92 (2.2%) | 0 (0.0%) |
| Electricity | 701 (16.9%) | 1,503 (67.3%) |
| Fuel Oil or Kerosene | 0 (0.0%) | 0 (0.0%) |
| Coal or Coke | 0 (0.0%) | 0 (0.0%) |
| All other Fuels | 55 (1.3%) | 27 (1.2%) |
| No Fuel Used | 10 (0.2%) | 25 (1.1%) |
| Total | 4,140 (100.0%) | 2,234 (100.0%) |
Household Vehicle Usage in Bedford
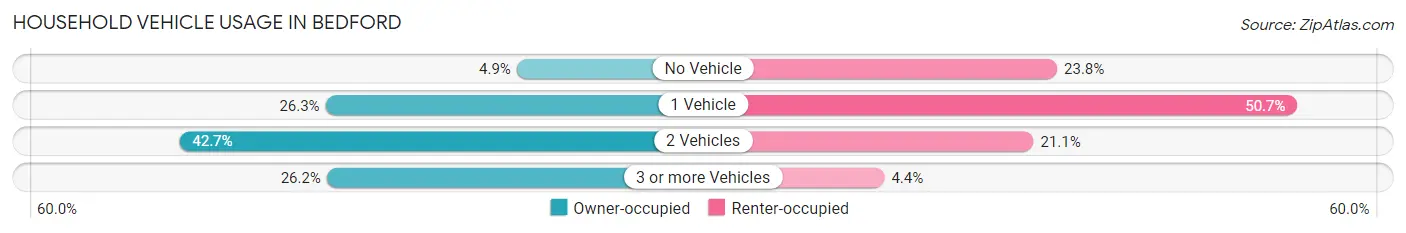
| Vehicles per Household | Owner-occupied | Renter-occupied |
| No Vehicle | 202 (4.9%) | 531 (23.8%) |
| 1 Vehicle | 1,089 (26.3%) | 1,132 (50.7%) |
| 2 Vehicles | 1,766 (42.7%) | 472 (21.1%) |
| 3 or more Vehicles | 1,083 (26.2%) | 99 (4.4%) |
| Total | 4,140 (100.0%) | 2,234 (100.0%) |
Real Estate & Mortgages in Bedford
Real Estate and Mortgage Overview in Bedford
| Characteristic | Without Mortgage | With Mortgage |
| Housing Units | 1,544 | 2,596 |
| Median Property Value | $120,100 | $124,100 |
| Median Household Income | $54,569 | $282 |
| Monthly Housing Costs | $397 | $100 |
| Real Estate Taxes | $947 | $117 |
Property Value by Mortgage Status in Bedford
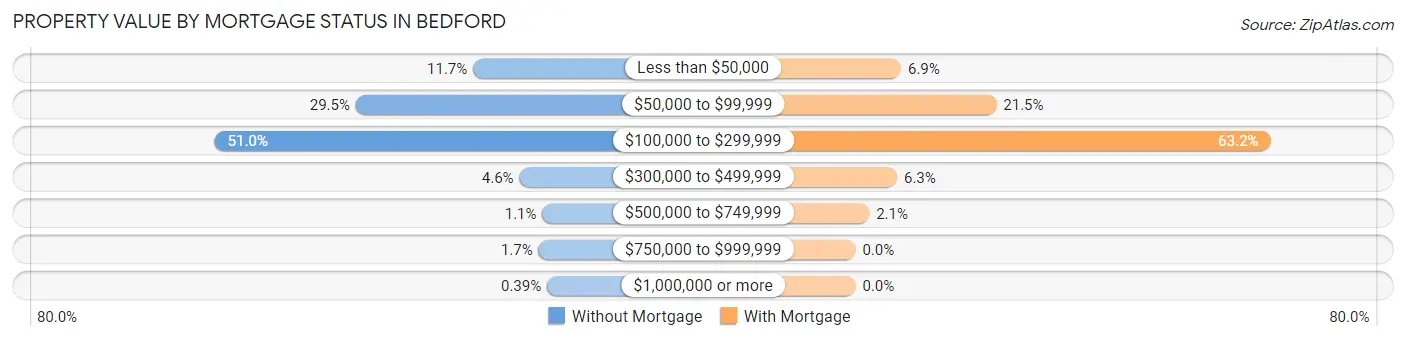
| Property Value | Without Mortgage | With Mortgage |
| Less than $50,000 | 180 (11.7%) | 180 (6.9%) |
| $50,000 to $99,999 | 456 (29.5%) | 557 (21.5%) |
| $100,000 to $299,999 | 788 (51.0%) | 1,641 (63.2%) |
| $300,000 to $499,999 | 71 (4.6%) | 164 (6.3%) |
| $500,000 to $749,999 | 17 (1.1%) | 54 (2.1%) |
| $750,000 to $999,999 | 26 (1.7%) | 0 (0.0%) |
| $1,000,000 or more | 6 (0.4%) | 0 (0.0%) |
| Total | 1,544 (100.0%) | 2,596 (100.0%) |
Household Income by Mortgage Status in Bedford
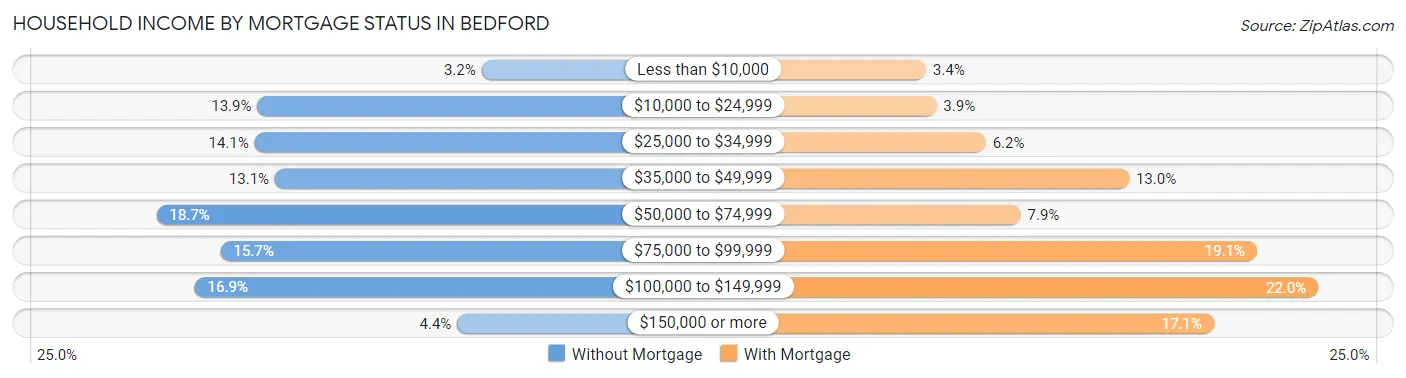
| Household Income | Without Mortgage | With Mortgage |
| Less than $10,000 | 50 (3.2%) | 87 (3.4%) |
| $10,000 to $24,999 | 215 (13.9%) | 100 (3.8%) |
| $25,000 to $34,999 | 217 (14.1%) | 161 (6.2%) |
| $35,000 to $49,999 | 202 (13.1%) | 338 (13.0%) |
| $50,000 to $74,999 | 289 (18.7%) | 204 (7.9%) |
| $75,000 to $99,999 | 242 (15.7%) | 496 (19.1%) |
| $100,000 to $149,999 | 261 (16.9%) | 572 (22.0%) |
| $150,000 or more | 68 (4.4%) | 443 (17.1%) |
| Total | 1,544 (100.0%) | 2,596 (100.0%) |
Property Value to Household Income Ratio in Bedford
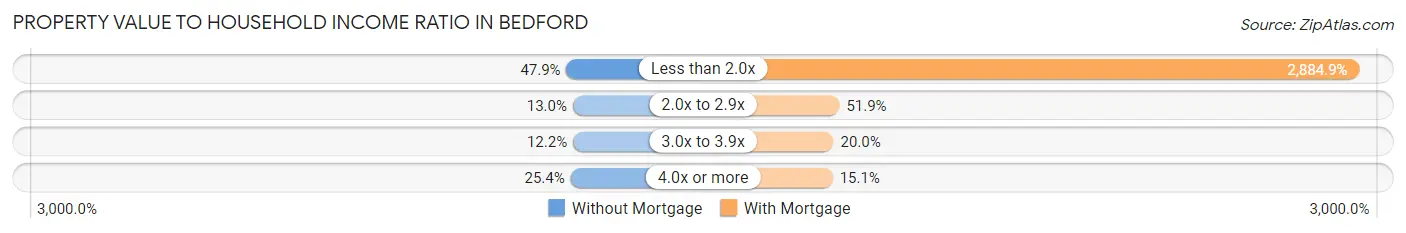
| Value-to-Income Ratio | Without Mortgage | With Mortgage |
| Less than 2.0x | 739 (47.9%) | 74,891 (2,884.9%) |
| 2.0x to 2.9x | 201 (13.0%) | 1,346 (51.8%) |
| 3.0x to 3.9x | 189 (12.2%) | 519 (20.0%) |
| 4.0x or more | 392 (25.4%) | 393 (15.1%) |
| Total | 1,544 (100.0%) | 2,596 (100.0%) |
Real Estate Taxes by Mortgage Status in Bedford
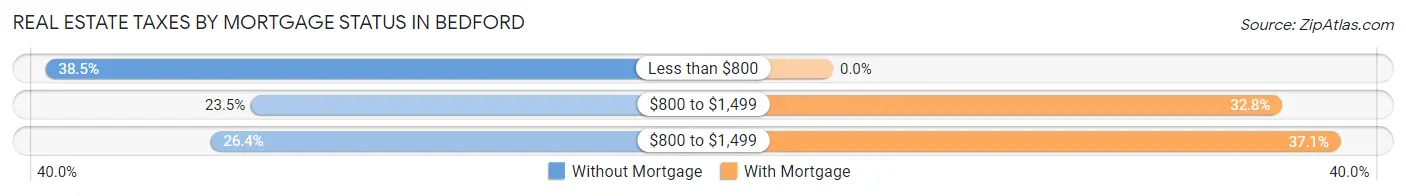
| Property Taxes | Without Mortgage | With Mortgage |
| Less than $800 | 594 (38.5%) | 0 (0.0%) |
| $800 to $1,499 | 362 (23.4%) | 852 (32.8%) |
| $800 to $1,499 | 408 (26.4%) | 963 (37.1%) |
| Total | 1,544 (100.0%) | 2,596 (100.0%) |
Health & Disability in Bedford
Health Insurance Coverage by Age in Bedford
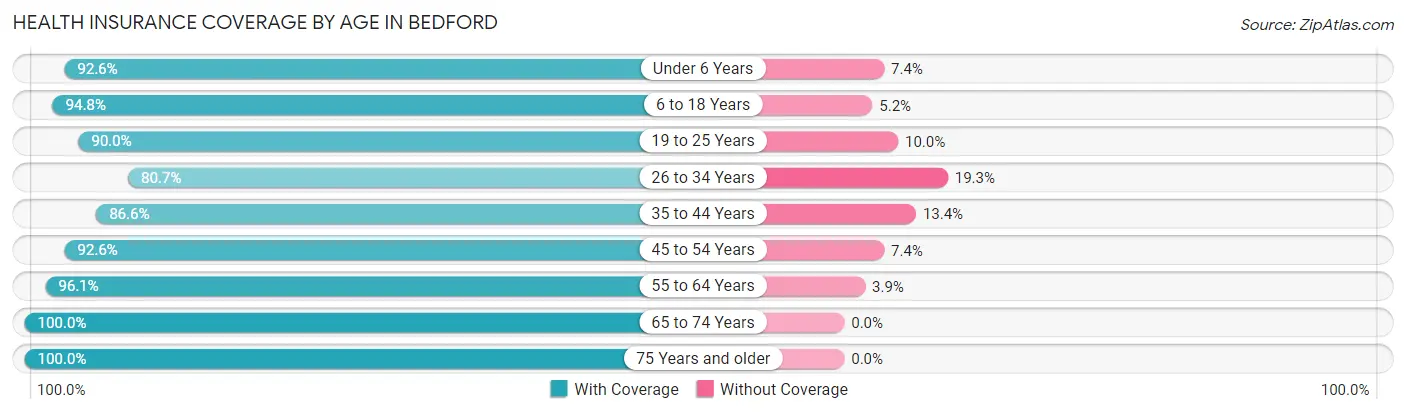
| Age Bracket | With Coverage | Without Coverage |
| Under 6 Years | 636 (92.6%) | 51 (7.4%) |
| 6 to 18 Years | 2,119 (94.8%) | 117 (5.2%) |
| 19 to 25 Years | 862 (90.0%) | 96 (10.0%) |
| 26 to 34 Years | 1,246 (80.7%) | 298 (19.3%) |
| 35 to 44 Years | 1,556 (86.6%) | 240 (13.4%) |
| 45 to 54 Years | 1,284 (92.6%) | 103 (7.4%) |
| 55 to 64 Years | 1,733 (96.1%) | 70 (3.9%) |
| 65 to 74 Years | 1,559 (100.0%) | 0 (0.0%) |
| 75 Years and older | 1,326 (100.0%) | 0 (0.0%) |
| Total | 12,321 (92.7%) | 975 (7.3%) |
Health Insurance Coverage by Citizenship Status in Bedford

| Citizenship Status | With Coverage | Without Coverage |
| Native Born | 636 (92.6%) | 51 (7.4%) |
| Foreign Born, Citizen | 2,119 (94.8%) | 117 (5.2%) |
| Foreign Born, not a Citizen | 862 (90.0%) | 96 (10.0%) |
Health Insurance Coverage by Household Income in Bedford
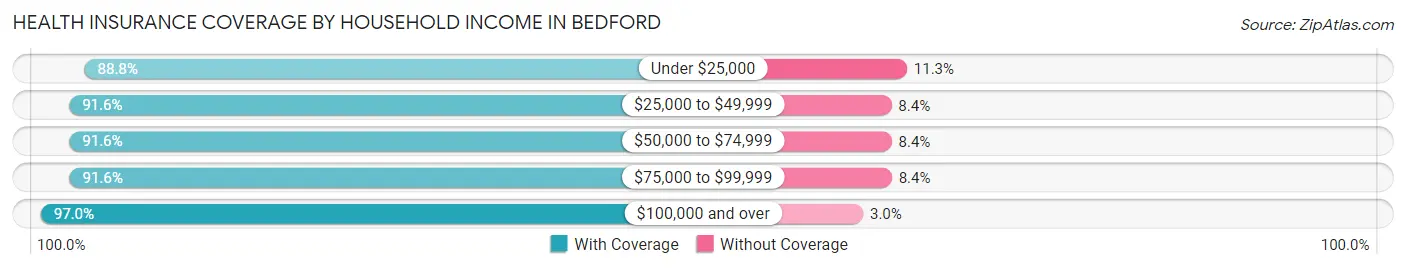
| Household Income | With Coverage | Without Coverage |
| Under $25,000 | 1,957 (88.7%) | 248 (11.3%) |
| $25,000 to $49,999 | 2,424 (91.6%) | 221 (8.4%) |
| $50,000 to $74,999 | 1,736 (91.6%) | 159 (8.4%) |
| $75,000 to $99,999 | 2,545 (91.6%) | 234 (8.4%) |
| $100,000 and over | 3,609 (97.0%) | 113 (3.0%) |
Public vs Private Health Insurance Coverage by Age in Bedford
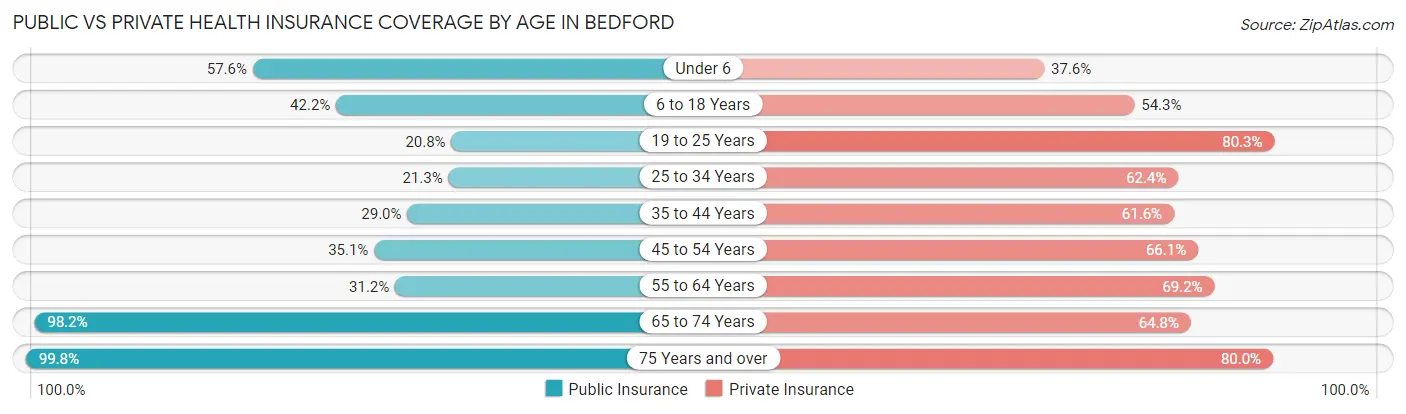
| Age Bracket | Public Insurance | Private Insurance |
| Under 6 | 396 (57.6%) | 258 (37.6%) |
| 6 to 18 Years | 943 (42.2%) | 1,214 (54.3%) |
| 19 to 25 Years | 199 (20.8%) | 769 (80.3%) |
| 25 to 34 Years | 329 (21.3%) | 964 (62.4%) |
| 35 to 44 Years | 520 (28.9%) | 1,107 (61.6%) |
| 45 to 54 Years | 487 (35.1%) | 917 (66.1%) |
| 55 to 64 Years | 563 (31.2%) | 1,247 (69.2%) |
| 65 to 74 Years | 1,531 (98.2%) | 1,010 (64.8%) |
| 75 Years and over | 1,323 (99.8%) | 1,061 (80.0%) |
| Total | 6,291 (47.3%) | 8,547 (64.3%) |
Disability Status by Sex by Age in Bedford
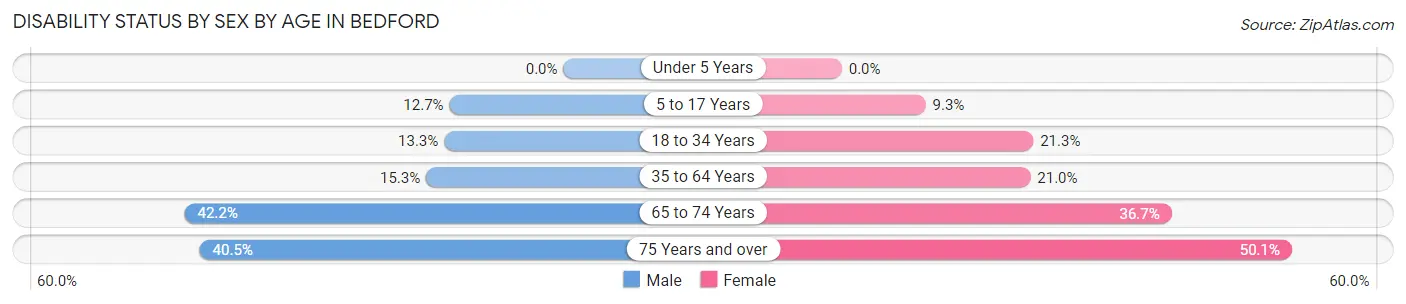
| Age Bracket | Male | Female |
| Under 5 Years | 0 (0.0%) | 0 (0.0%) |
| 5 to 17 Years | 140 (12.7%) | 106 (9.3%) |
| 18 to 34 Years | 171 (13.3%) | 282 (21.3%) |
| 35 to 64 Years | 380 (15.3%) | 525 (21.0%) |
| 65 to 74 Years | 267 (42.2%) | 340 (36.7%) |
| 75 Years and over | 179 (40.5%) | 443 (50.1%) |
Disability Class by Sex by Age in Bedford
Disability Class: Hearing Difficulty
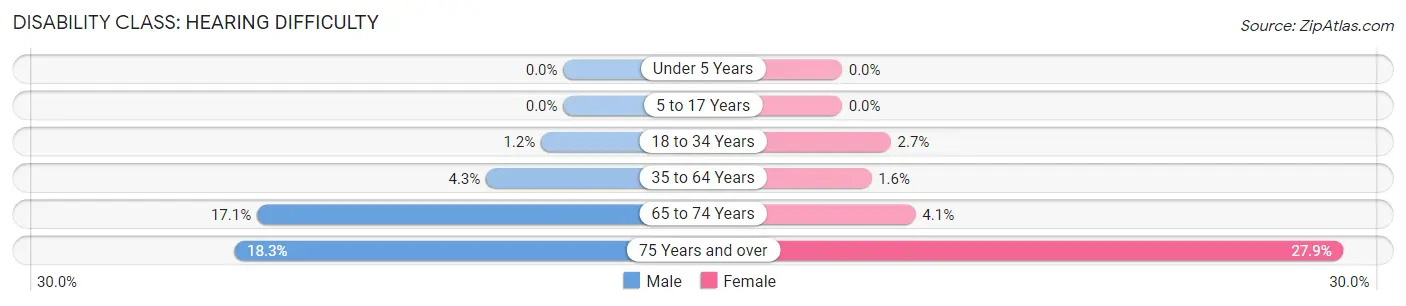
| Age Bracket | Male | Female |
| Under 5 Years | 0 (0.0%) | 0 (0.0%) |
| 5 to 17 Years | 0 (0.0%) | 0 (0.0%) |
| 18 to 34 Years | 16 (1.2%) | 36 (2.7%) |
| 35 to 64 Years | 107 (4.3%) | 41 (1.6%) |
| 65 to 74 Years | 108 (17.1%) | 38 (4.1%) |
| 75 Years and over | 81 (18.3%) | 247 (27.9%) |
Disability Class: Vision Difficulty
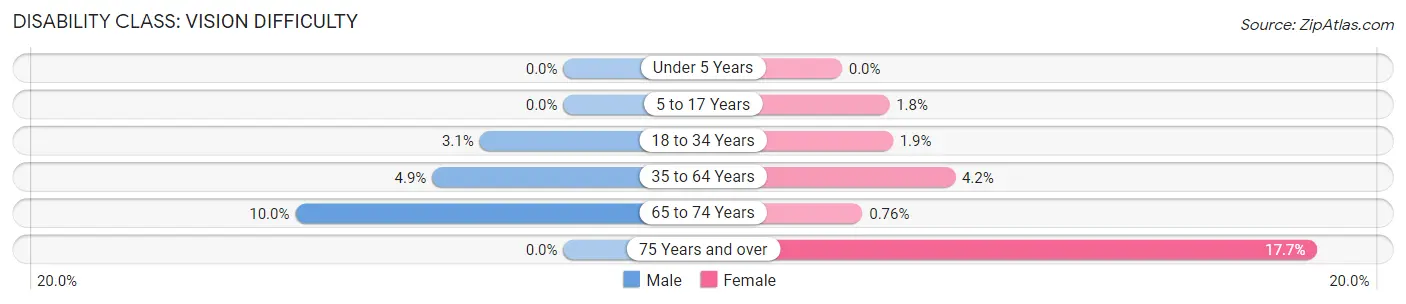
| Age Bracket | Male | Female |
| Under 5 Years | 0 (0.0%) | 0 (0.0%) |
| 5 to 17 Years | 0 (0.0%) | 20 (1.8%) |
| 18 to 34 Years | 40 (3.1%) | 25 (1.9%) |
| 35 to 64 Years | 121 (4.9%) | 105 (4.2%) |
| 65 to 74 Years | 63 (10.0%) | 7 (0.8%) |
| 75 Years and over | 0 (0.0%) | 156 (17.6%) |
Disability Class: Cognitive Difficulty
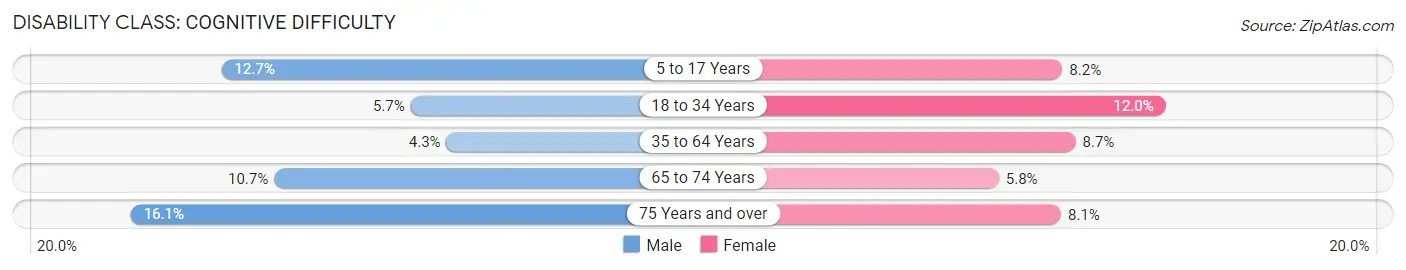
| Age Bracket | Male | Female |
| 5 to 17 Years | 140 (12.7%) | 93 (8.2%) |
| 18 to 34 Years | 73 (5.7%) | 159 (12.0%) |
| 35 to 64 Years | 108 (4.3%) | 217 (8.7%) |
| 65 to 74 Years | 68 (10.7%) | 54 (5.8%) |
| 75 Years and over | 71 (16.1%) | 72 (8.1%) |
Disability Class: Ambulatory Difficulty
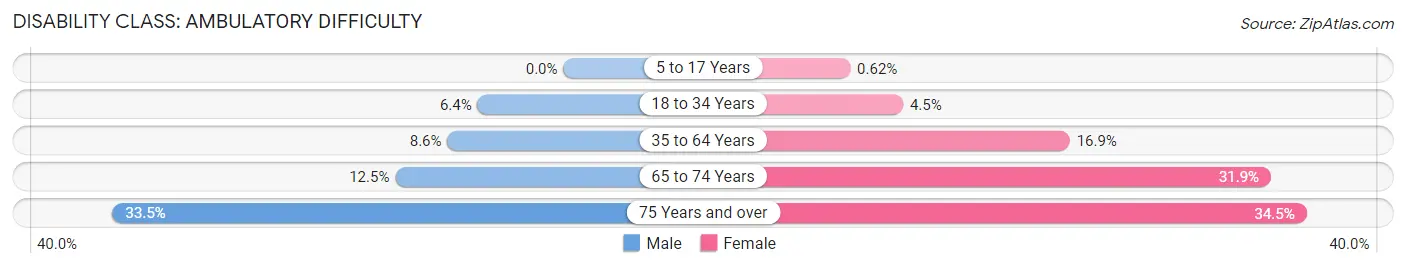
| Age Bracket | Male | Female |
| 5 to 17 Years | 0 (0.0%) | 7 (0.6%) |
| 18 to 34 Years | 82 (6.4%) | 60 (4.5%) |
| 35 to 64 Years | 214 (8.6%) | 423 (16.9%) |
| 65 to 74 Years | 79 (12.5%) | 295 (31.9%) |
| 75 Years and over | 148 (33.5%) | 305 (34.5%) |
Disability Class: Self-Care Difficulty
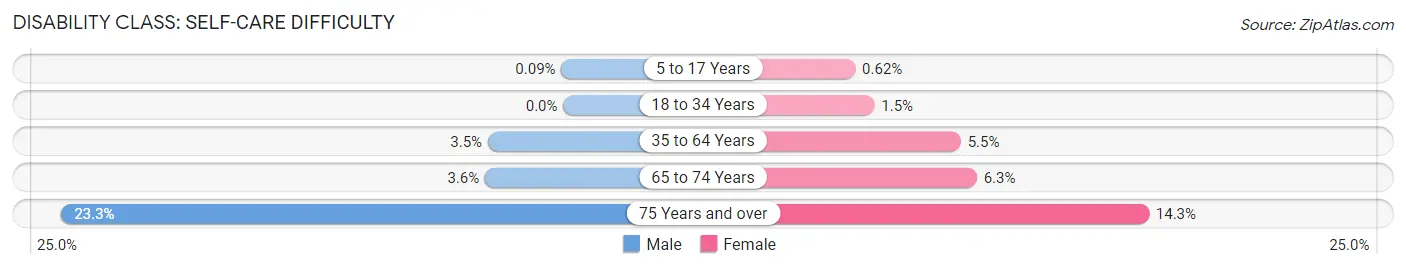
| Age Bracket | Male | Female |
| 5 to 17 Years | 1 (0.1%) | 7 (0.6%) |
| 18 to 34 Years | 0 (0.0%) | 20 (1.5%) |
| 35 to 64 Years | 87 (3.5%) | 138 (5.5%) |
| 65 to 74 Years | 23 (3.6%) | 58 (6.3%) |
| 75 Years and over | 103 (23.3%) | 126 (14.2%) |
Technology Access in Bedford
Computing Device Access in Bedford
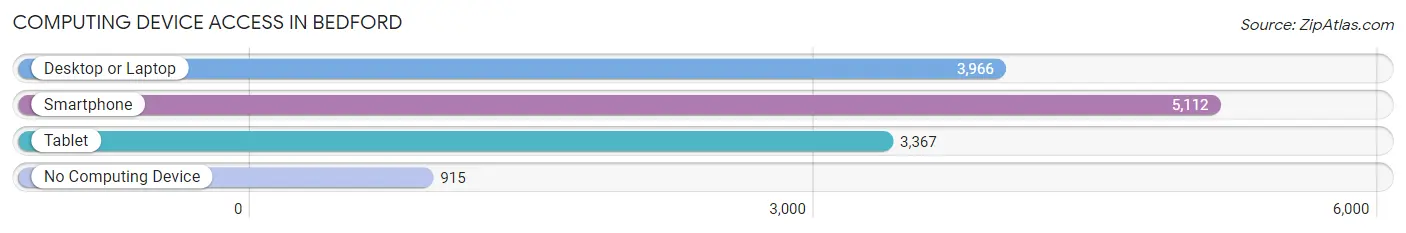
| Device Type | # Households | % Households |
| Desktop or Laptop | 3,966 | 62.2% |
| Smartphone | 5,112 | 80.2% |
| Tablet | 3,367 | 52.8% |
| No Computing Device | 915 | 14.4% |
| Total | 6,374 | 100.0% |
Internet Access in Bedford
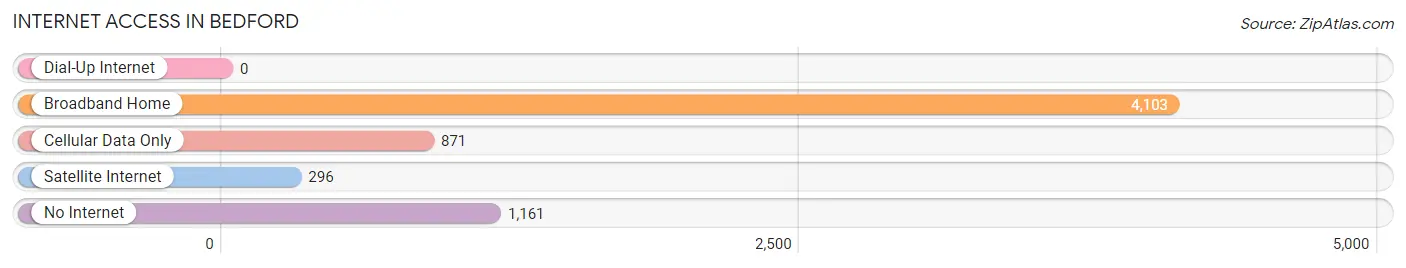
| Internet Type | # Households | % Households |
| Dial-Up Internet | 0 | 0.0% |
| Broadband Home | 4,103 | 64.4% |
| Cellular Data Only | 871 | 13.7% |
| Satellite Internet | 296 | 4.6% |
| No Internet | 1,161 | 18.2% |
| Total | 6,374 | 100.0% |
Bedford Summary
Bedford, Indiana is a small city located in the south-central part of the state, in Lawrence County. It is the county seat and the largest city in the county. The city is situated in a valley between the White River and the Wabash River, and is surrounded by rolling hills and wooded areas. The city has a population of 13,413, according to the 2010 census.
History
Bedford was founded in 1825 by William Marshall, a settler from North Carolina. He named the town after his hometown of Bedford, North Carolina. The town was incorporated in 1864.
In the late 19th century, Bedford was a major center for the limestone industry. The city was home to several quarries, and the limestone was used to build many of the buildings in the city, including the courthouse.
The city was also home to a large number of coal mines, which provided employment for many of the city's residents. The coal industry declined in the early 20th century, and the city's economy shifted to manufacturing.
Geography
Bedford is located in the south-central part of Indiana, in Lawrence County. The city is situated in a valley between the White River and the Wabash River. The city is surrounded by rolling hills and wooded areas.
The city has a total area of 8.3 square miles, of which 8.2 square miles is land and 0.1 square miles is water.
Economy
Bedford's economy is largely based on manufacturing. The city is home to several factories, including a General Motors plant, a steel mill, and a paper mill. The city is also home to several retail stores, restaurants, and other businesses.
The city is also home to a number of educational institutions, including Indiana University-Bloomington, Ivy Tech Community College, and the Bedford North Lawrence High School.
Demographics
According to the 2010 census, Bedford has a population of 13,413. The racial makeup of the city is 87.3% White, 8.2% African American, 0.4% Native American, 0.7% Asian, 0.1% Pacific Islander, 1.2% from other races, and 2.1% from two or more races. Hispanic or Latino of any race were 3.2% of the population.
The median income for a household in the city was $35,945, and the median income for a family was $45,945. The per capita income for the city was $19,945. About 11.3% of families and 14.2% of the population were below the poverty line, including 19.2% of those under age 18 and 8.2% of those age 65 or over.
Common Questions
What is Per Capita Income in Bedford?
Per Capita income in Bedford is $30,190.
What is the Median Family Income in Bedford?
Median Family Income in Bedford is $73,365.
What is the Median Household income in Bedford?
Median Household Income in Bedford is $49,492.
What is Income or Wage Gap in Bedford?
Income or Wage Gap in Bedford is 37.1%.
Women in Bedford earn 62.9 cents for every dollar earned by a man.
What is Inequality or Gini Index in Bedford?
Inequality or Gini Index in Bedford is 0.45.
What is the Total Population of Bedford?
Total Population of Bedford is 13,802.
What is the Total Male Population of Bedford?
Total Male Population of Bedford is 6,507.
What is the Total Female Population of Bedford?
Total Female Population of Bedford is 7,295.
What is the Ratio of Males per 100 Females in Bedford?
There are 89.20 Males per 100 Females in Bedford.
What is the Ratio of Females per 100 Males in Bedford?
There are 112.11 Females per 100 Males in Bedford.
What is the Median Population Age in Bedford?
Median Population Age in Bedford is 42.5 Years.
What is the Average Family Size in Bedford
Average Family Size in Bedford is 2.9 People.
What is the Average Household Size in Bedford
Average Household Size in Bedford is 2.1 People.
How Large is the Labor Force in Bedford?
There are 6,358 People in the Labor Forcein in Bedford.
What is the Percentage of People in the Labor Force in Bedford?
55.9% of People are in the Labor Force in Bedford.
What is the Unemployment Rate in Bedford?
Unemployment Rate in Bedford is 3.1%.