Austin, IN Map & Demographics
Austin Map
Austin Overview
$20,683
PER CAPITA INCOME
$50,000
AVG FAMILY INCOME
$29,880
AVG HOUSEHOLD INCOME
32.1%
WAGE / INCOME GAP [ % ]
67.9¢/ $1
WAGE / INCOME GAP [ $ ]
0.40
INEQUALITY / GINI INDEX
3,596
TOTAL POPULATION
1,692
MALE POPULATION
1,904
FEMALE POPULATION
88.87
MALES / 100 FEMALES
112.53
FEMALES / 100 MALES
43.1
MEDIAN AGE
2.8
AVG FAMILY SIZE
2.2
AVG HOUSEHOLD SIZE
1,772
LABOR FORCE [ PEOPLE ]
60.2%
PERCENT IN LABOR FORCE
3.8%
UNEMPLOYMENT RATE
Austin Zip Codes
Austin Area Codes
Income in Austin
Income Overview in Austin
Per Capita Income in Austin is $20,683, while median incomes of families and households are $50,000 and $29,880 respectively.
| Characteristic | Number | Measure |
| Per Capita Income | 3,596 | $20,683 |
| Median Family Income | 964 | $50,000 |
| Mean Family Income | 964 | $58,860 |
| Median Household Income | 1,651 | $29,880 |
| Mean Household Income | 1,651 | $44,276 |
| Income Deficit | 964 | $0 |
| Wage / Income Gap (%) | 3,596 | 32.07% |
| Wage / Income Gap ($) | 3,596 | 67.93¢ per $1 |
| Gini / Inequality Index | 3,596 | 0.40 |
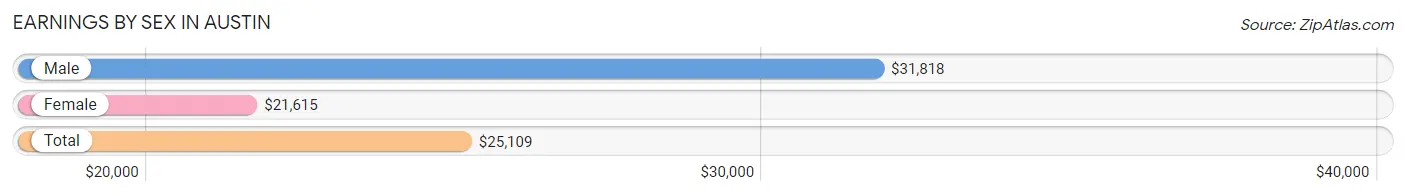
Earnings by Sex in Austin
Average Earnings in Austin are $25,109, $31,818 for men and $21,615 for women, a difference of 32.1%.
| Sex | Number | Average Earnings |
| Male | 862 (48.2%) | $31,818 |
| Female | 926 (51.8%) | $21,615 |
| Total | 1,788 (100.0%) | $25,109 |
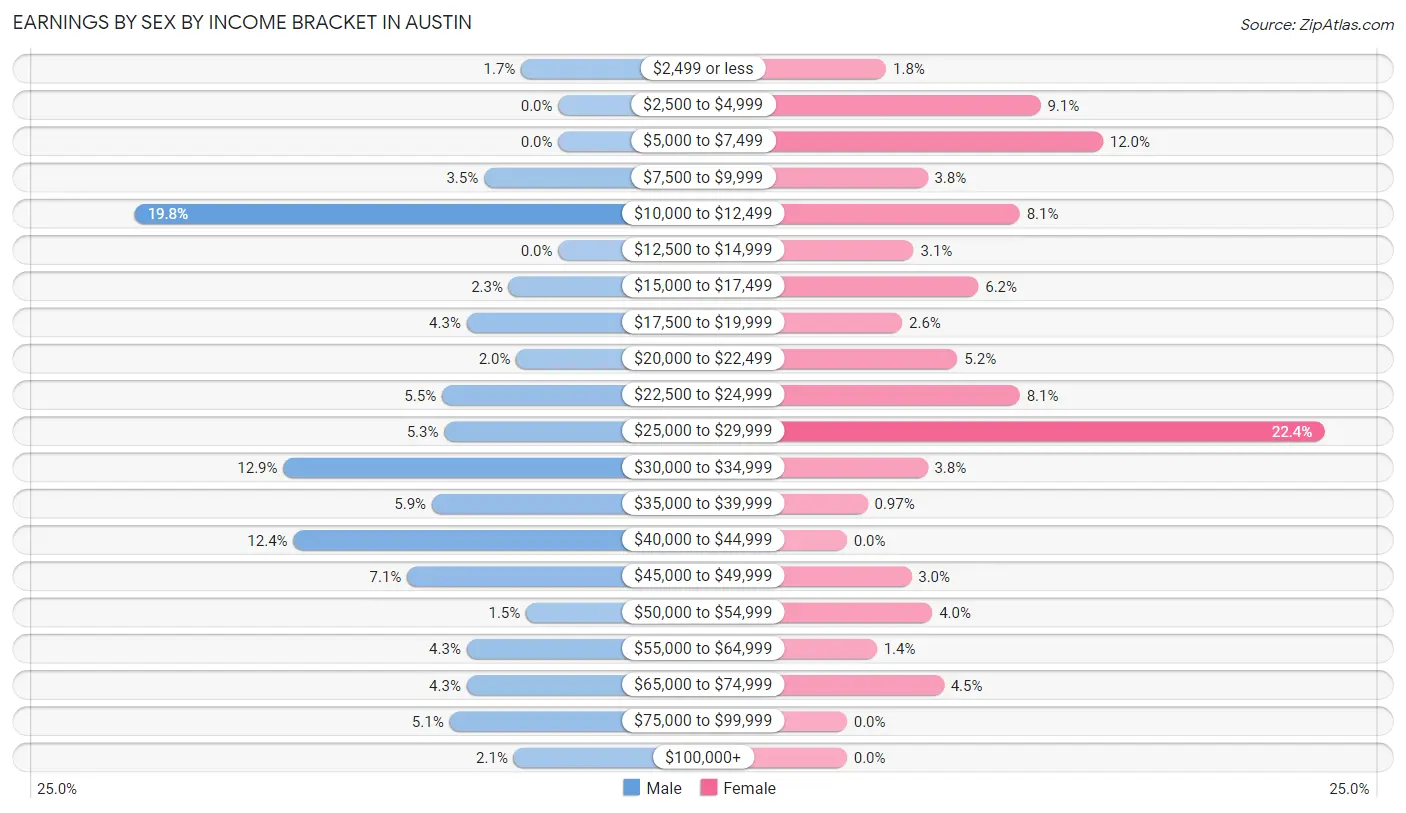
Earnings by Sex by Income Bracket in Austin
The most common earnings brackets in Austin are $10,000 to $12,499 for men (171 | 19.8%) and $25,000 to $29,999 for women (207 | 22.4%).
| Income | Male | Female |
| $2,499 or less | 15 (1.7%) | 17 (1.8%) |
| $2,500 to $4,999 | 0 (0.0%) | 84 (9.1%) |
| $5,000 to $7,499 | 0 (0.0%) | 111 (12.0%) |
| $7,500 to $9,999 | 30 (3.5%) | 35 (3.8%) |
| $10,000 to $12,499 | 171 (19.8%) | 75 (8.1%) |
| $12,500 to $14,999 | 0 (0.0%) | 29 (3.1%) |
| $15,000 to $17,499 | 20 (2.3%) | 57 (6.2%) |
| $17,500 to $19,999 | 37 (4.3%) | 24 (2.6%) |
| $20,000 to $22,499 | 17 (2.0%) | 48 (5.2%) |
| $22,500 to $24,999 | 47 (5.4%) | 75 (8.1%) |
| $25,000 to $29,999 | 46 (5.3%) | 207 (22.4%) |
| $30,000 to $34,999 | 111 (12.9%) | 35 (3.8%) |
| $35,000 to $39,999 | 51 (5.9%) | 9 (1.0%) |
| $40,000 to $44,999 | 107 (12.4%) | 0 (0.0%) |
| $45,000 to $49,999 | 61 (7.1%) | 28 (3.0%) |
| $50,000 to $54,999 | 13 (1.5%) | 37 (4.0%) |
| $55,000 to $64,999 | 37 (4.3%) | 13 (1.4%) |
| $65,000 to $74,999 | 37 (4.3%) | 42 (4.5%) |
| $75,000 to $99,999 | 44 (5.1%) | 0 (0.0%) |
| $100,000+ | 18 (2.1%) | 0 (0.0%) |
| Total | 862 (100.0%) | 926 (100.0%) |
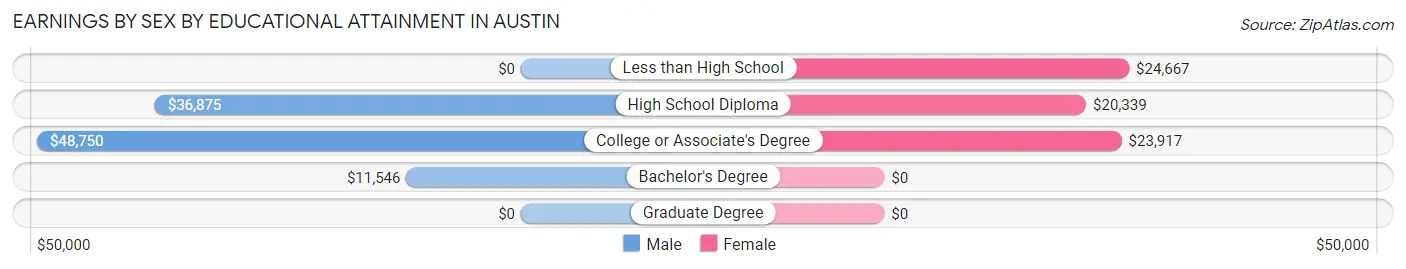
Earnings by Sex by Educational Attainment in Austin
Average earnings in Austin are $32,292 for men and $22,667 for women, a difference of 29.8%. Men with an educational attainment of college or associate's degree enjoy the highest average annual earnings of $48,750, while those with bachelor's degree education earn the least with $11,546. Women with an educational attainment of less than high school earn the most with the average annual earnings of $24,667, while those with high school diploma education have the smallest earnings of $20,339.
| Educational Attainment | Male Income | Female Income |
| Less than High School | - | - |
| High School Diploma | $36,875 | $20,339 |
| College or Associate's Degree | $48,750 | $23,917 |
| Bachelor's Degree | $11,546 | $0 |
| Graduate Degree | - | - |
| Total | $32,292 | $22,667 |
Family Income in Austin
Family Income Brackets in Austin
According to the Austin family income data, there are 277 families falling into the $50,000 to $74,999 income range, which is the most common income bracket and makes up 28.7% of all families. Conversely, the $200,000+ income bracket is the least frequent group with only 10 families (1.0%) belonging to this category.
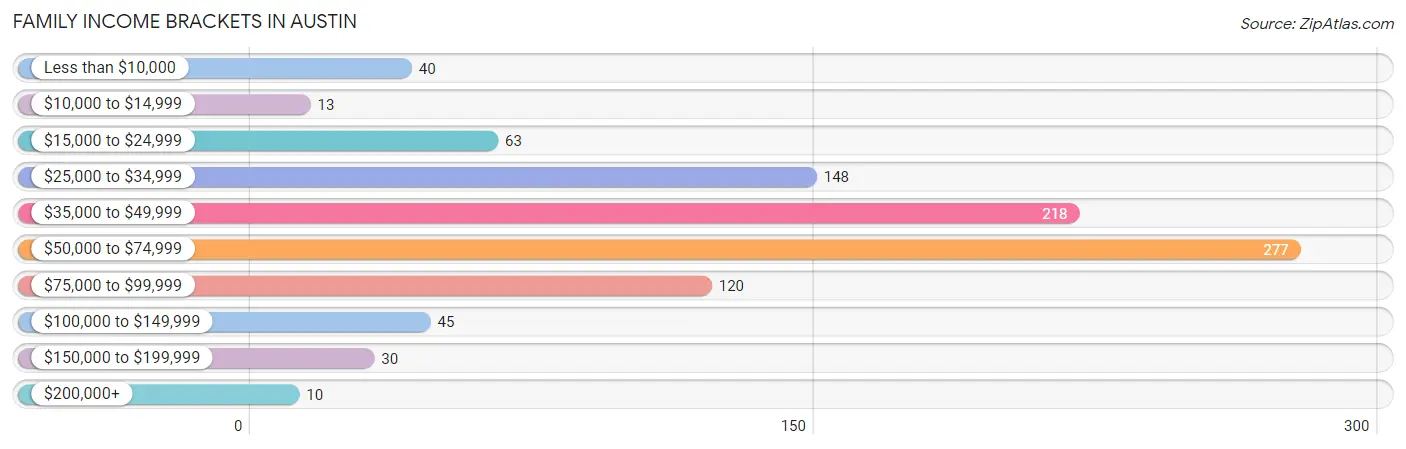
| Income Bracket | # Families | % Families |
| Less than $10,000 | 40 | 4.1% |
| $10,000 to $14,999 | 13 | 1.3% |
| $15,000 to $24,999 | 63 | 6.5% |
| $25,000 to $34,999 | 148 | 15.4% |
| $35,000 to $49,999 | 218 | 22.6% |
| $50,000 to $74,999 | 277 | 28.7% |
| $75,000 to $99,999 | 120 | 12.4% |
| $100,000 to $149,999 | 45 | 4.7% |
| $150,000 to $199,999 | 30 | 3.1% |
| $200,000+ | 10 | 1.0% |
Family Income by Famaliy Size in Austin
4-person families (127 | 13.2%) account for the highest median family income in Austin with $72,163 per family, while 2-person families (704 | 73.0%) have the highest median income of $24,129 per family member.
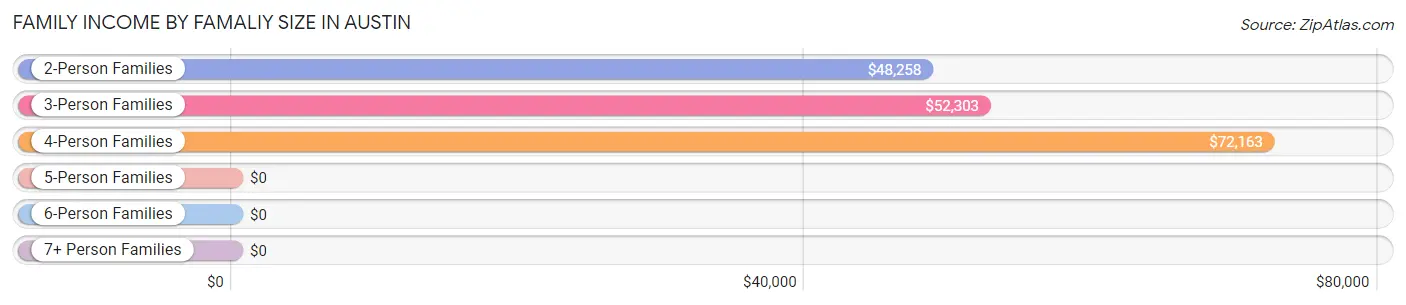
| Income Bracket | # Families | Median Income |
| 2-Person Families | 704 (73.0%) | $48,258 |
| 3-Person Families | 65 (6.7%) | $52,303 |
| 4-Person Families | 127 (13.2%) | $72,163 |
| 5-Person Families | 56 (5.8%) | $0 |
| 6-Person Families | 0 (0.0%) | $0 |
| 7+ Person Families | 12 (1.2%) | $0 |
| Total | 964 (100.0%) | $50,000 |
Family Income by Number of Earners in Austin
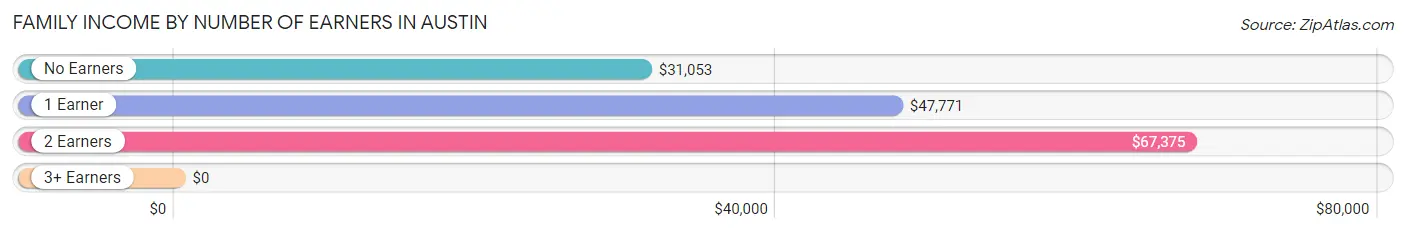
| Number of Earners | # Families | Median Income |
| No Earners | 156 (16.2%) | $31,053 |
| 1 Earner | 361 (37.4%) | $47,771 |
| 2 Earners | 429 (44.5%) | $67,375 |
| 3+ Earners | 18 (1.9%) | $0 |
| Total | 964 (100.0%) | $50,000 |
Household Income in Austin
Household Income Brackets in Austin
With 398 households falling in the category, the $15,000 to $24,999 income range is the most frequent in Austin, accounting for 24.1% of all households. In contrast, only 10 households (0.6%) fall into the $200,000+ income bracket, making it the least populous group.
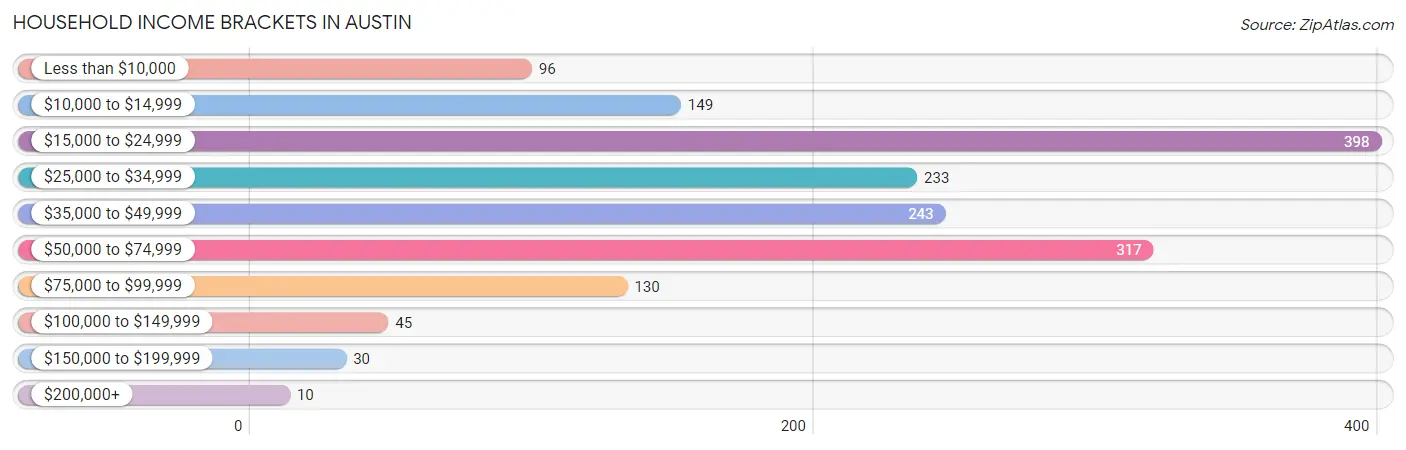
| Income Bracket | # Households | % Households |
| Less than $10,000 | 96 | 5.8% |
| $10,000 to $14,999 | 149 | 9.0% |
| $15,000 to $24,999 | 398 | 24.1% |
| $25,000 to $34,999 | 233 | 14.1% |
| $35,000 to $49,999 | 243 | 14.7% |
| $50,000 to $74,999 | 317 | 19.2% |
| $75,000 to $99,999 | 130 | 7.9% |
| $100,000 to $149,999 | 45 | 2.7% |
| $150,000 to $199,999 | 30 | 1.8% |
| $200,000+ | 10 | 0.6% |
Household Income by Householder Age in Austin
The median household income in Austin is $29,880, with the highest median household income of $47,821 found in the 25 to 44 years age bracket for the primary householder. A total of 508 households (30.8%) fall into this category. Meanwhile, the 15 to 24 years age bracket for the primary householder has the lowest median household income of $0, with 48 households (2.9%) in this group.
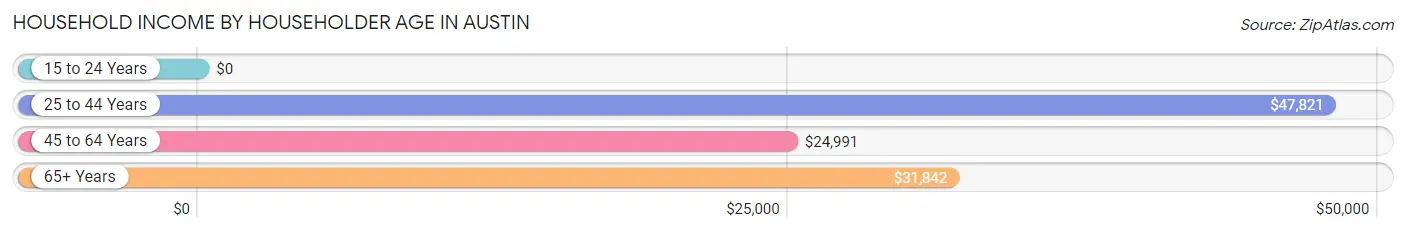
| Income Bracket | # Households | Median Income |
| 15 to 24 Years | 48 (2.9%) | $0 |
| 25 to 44 Years | 508 (30.8%) | $47,821 |
| 45 to 64 Years | 661 (40.0%) | $24,991 |
| 65+ Years | 434 (26.3%) | $31,842 |
| Total | 1,651 (100.0%) | $29,880 |
Poverty in Austin
Income Below Poverty by Sex and Age in Austin
With 9.7% poverty level for males and 23.6% for females among the residents of Austin, 25 to 34 year old males and under 5 year old females are the most vulnerable to poverty, with 74 males (46.8%) and 75 females (74.3%) in their respective age groups living below the poverty level.
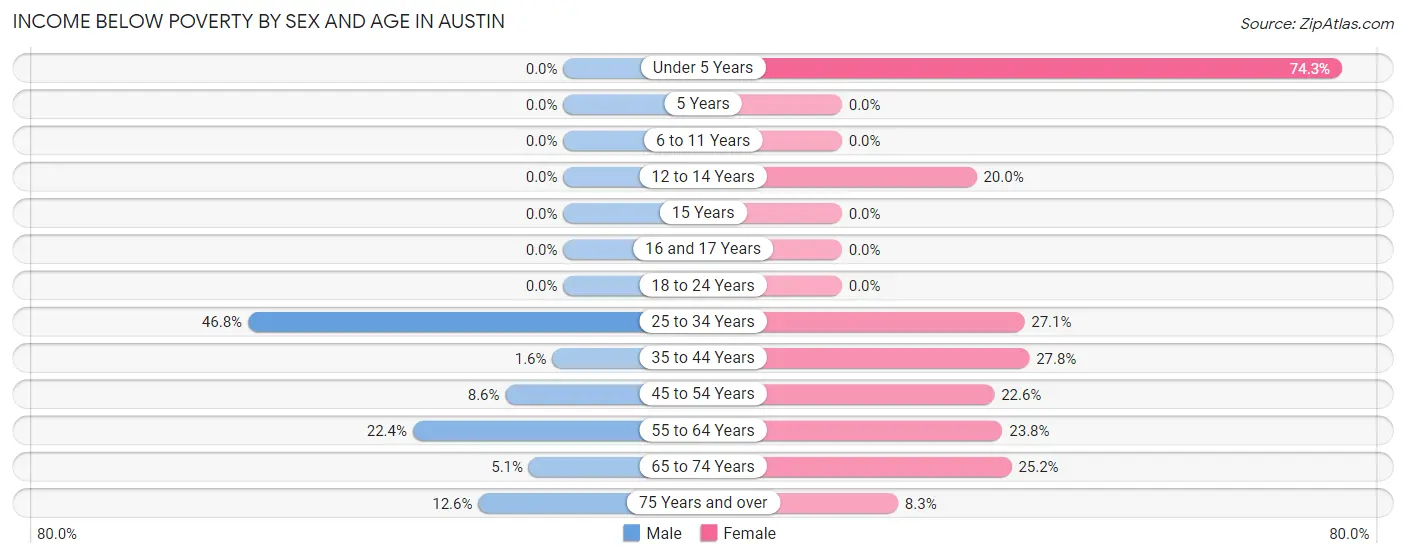
| Age Bracket | Male | Female |
| Under 5 Years | 0 (0.0%) | 75 (74.3%) |
| 5 Years | 0 (0.0%) | 0 (0.0%) |
| 6 to 11 Years | 0 (0.0%) | 0 (0.0%) |
| 12 to 14 Years | 0 (0.0%) | 9 (20.0%) |
| 15 Years | 0 (0.0%) | 0 (0.0%) |
| 16 and 17 Years | 0 (0.0%) | 0 (0.0%) |
| 18 to 24 Years | 0 (0.0%) | 0 (0.0%) |
| 25 to 34 Years | 74 (46.8%) | 100 (27.1%) |
| 35 to 44 Years | 3 (1.6%) | 59 (27.8%) |
| 45 to 54 Years | 26 (8.6%) | 43 (22.6%) |
| 55 to 64 Years | 36 (22.4%) | 82 (23.8%) |
| 65 to 74 Years | 11 (5.1%) | 66 (25.2%) |
| 75 Years and over | 12 (12.6%) | 7 (8.3%) |
| Total | 162 (9.7%) | 441 (23.6%) |
Income Above Poverty by Sex and Age in Austin
According to the poverty statistics in Austin, males aged under 5 years and females aged 5 years are the age groups that are most secure financially, with 100.0% of males and 100.0% of females in these age groups living above the poverty line.
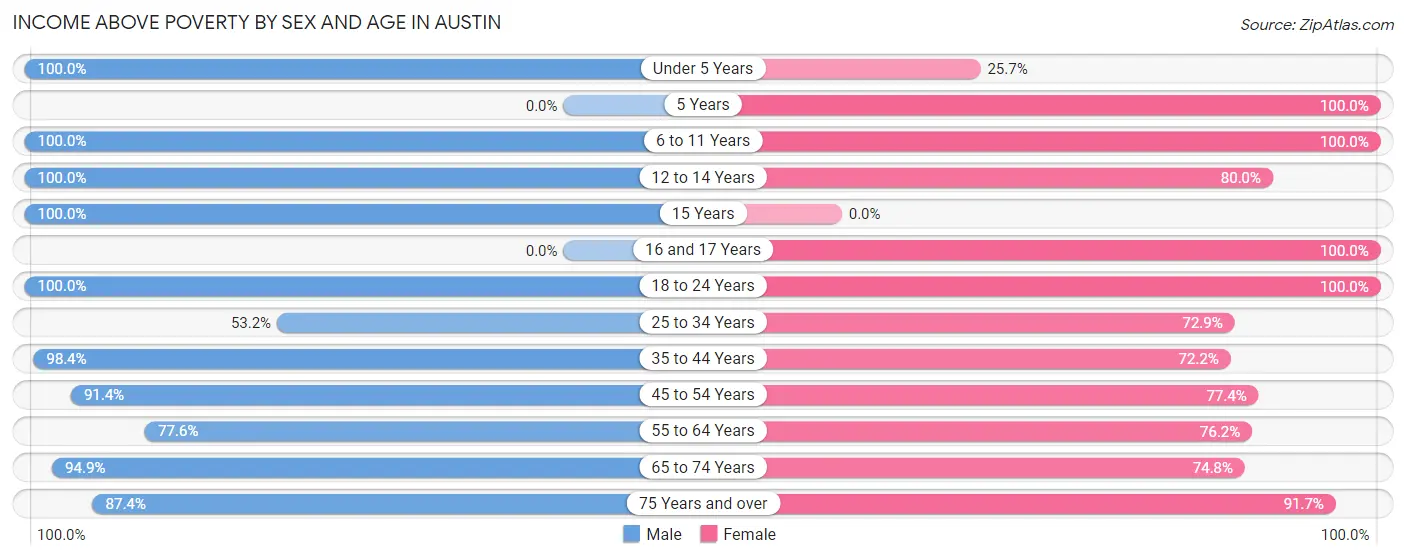
| Age Bracket | Male | Female |
| Under 5 Years | 118 (100.0%) | 26 (25.7%) |
| 5 Years | 0 (0.0%) | 34 (100.0%) |
| 6 to 11 Years | 145 (100.0%) | 19 (100.0%) |
| 12 to 14 Years | 92 (100.0%) | 36 (80.0%) |
| 15 Years | 45 (100.0%) | 0 (0.0%) |
| 16 and 17 Years | 0 (0.0%) | 14 (100.0%) |
| 18 to 24 Years | 158 (100.0%) | 196 (100.0%) |
| 25 to 34 Years | 84 (53.2%) | 269 (72.9%) |
| 35 to 44 Years | 181 (98.4%) | 153 (72.2%) |
| 45 to 54 Years | 276 (91.4%) | 147 (77.4%) |
| 55 to 64 Years | 125 (77.6%) | 262 (76.2%) |
| 65 to 74 Years | 204 (94.9%) | 196 (74.8%) |
| 75 Years and over | 83 (87.4%) | 77 (91.7%) |
| Total | 1,511 (90.3%) | 1,429 (76.4%) |
Income Below Poverty Among Married-Couple Families in Austin
The poverty statistics for married-couple families in Austin show that 5.9% or 37 of the total 632 families live below the poverty line. Families with no children have the highest poverty rate of 7.1%, comprising of 37 families. On the other hand, families with 1 or 2 children have the lowest poverty rate of 0.0%, which includes 0 families.
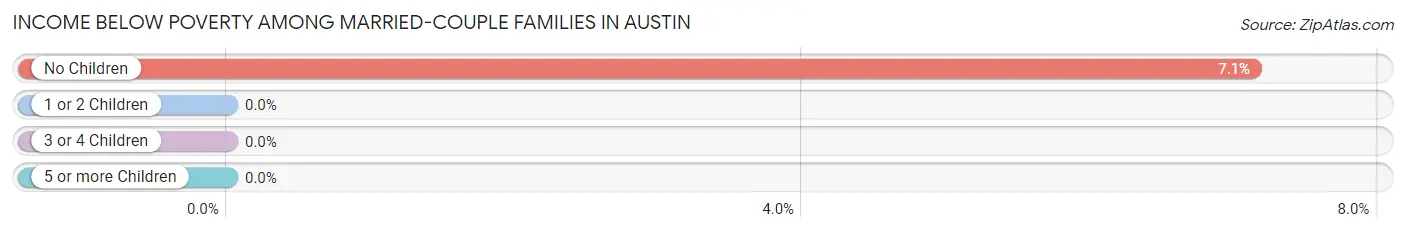
| Children | Above Poverty | Below Poverty |
| No Children | 482 (92.9%) | 37 (7.1%) |
| 1 or 2 Children | 91 (100.0%) | 0 (0.0%) |
| 3 or 4 Children | 10 (100.0%) | 0 (0.0%) |
| 5 or more Children | 12 (100.0%) | 0 (0.0%) |
| Total | 595 (94.2%) | 37 (5.9%) |
Income Below Poverty Among Single-Parent Households in Austin
According to the poverty data in Austin, 15.4% or 10 single-father households and 17.2% or 46 single-mother households are living below the poverty line. Among single-father households, those with 1 or 2 children have the highest poverty rate, with 10 households (19.2%) experiencing poverty. Likewise, among single-mother households, those with 1 or 2 children have the highest poverty rate, with 39 households (18.3%) falling below the poverty line.
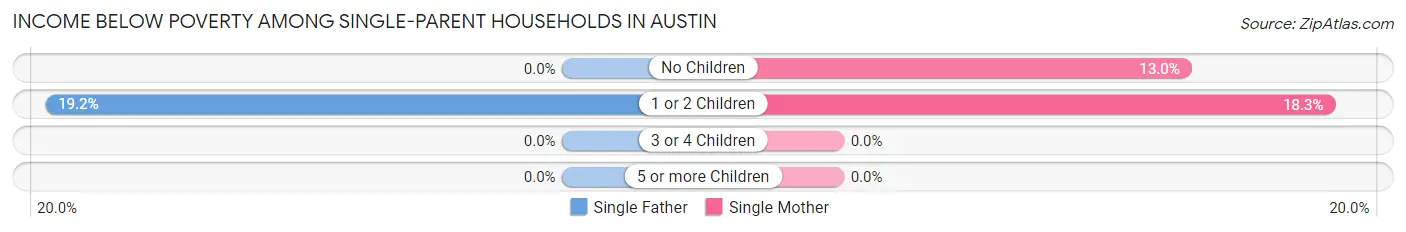
| Children | Single Father | Single Mother |
| No Children | 0 (0.0%) | 7 (13.0%) |
| 1 or 2 Children | 10 (19.2%) | 39 (18.3%) |
| 3 or 4 Children | 0 (0.0%) | 0 (0.0%) |
| 5 or more Children | 0 (0.0%) | 0 (0.0%) |
| Total | 10 (15.4%) | 46 (17.2%) |
Income Below Poverty Among Married-Couple vs Single-Parent Households in Austin
The poverty data for Austin shows that 37 of the married-couple family households (5.9%) and 56 of the single-parent households (16.9%) are living below the poverty level. Within the married-couple family households, those with no children have the highest poverty rate, with 37 households (7.1%) falling below the poverty line. Among the single-parent households, those with 1 or 2 children have the highest poverty rate, with 49 household (18.5%) living below poverty.
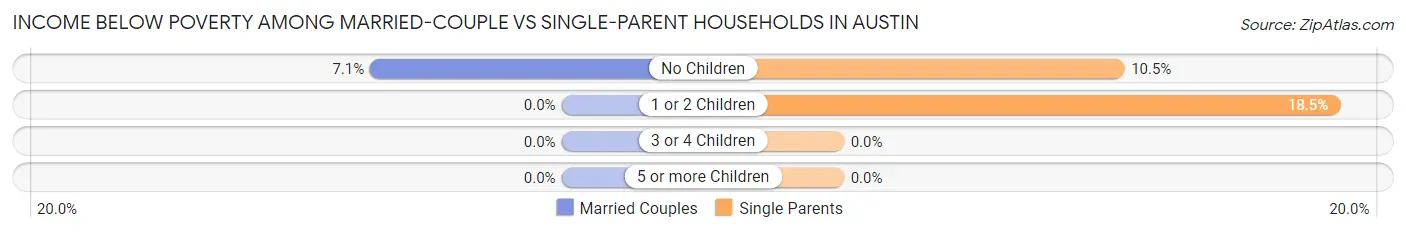
| Children | Married-Couple Families | Single-Parent Households |
| No Children | 37 (7.1%) | 7 (10.4%) |
| 1 or 2 Children | 0 (0.0%) | 49 (18.5%) |
| 3 or 4 Children | 0 (0.0%) | 0 (0.0%) |
| 5 or more Children | 0 (0.0%) | 0 (0.0%) |
| Total | 37 (5.9%) | 56 (16.9%) |
Race in Austin
The most populous races in Austin are White / Caucasian (3,315 | 92.2%), Two or more Races (247 | 6.9%), and Hispanic or Latino (194 | 5.4%).
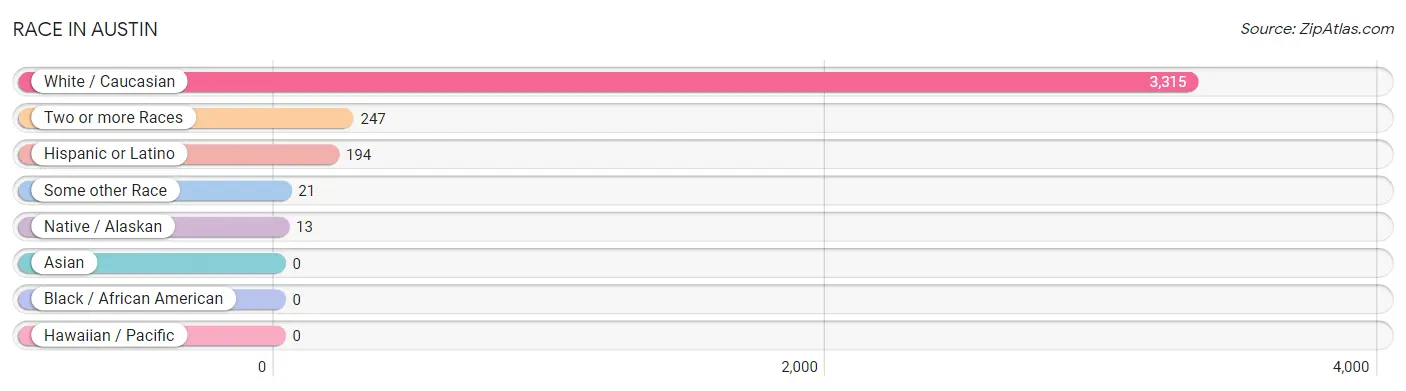
| Race | # Population | % Population |
| Asian | 0 | 0.0% |
| Black / African American | 0 | 0.0% |
| Hawaiian / Pacific | 0 | 0.0% |
| Hispanic or Latino | 194 | 5.4% |
| Native / Alaskan | 13 | 0.4% |
| White / Caucasian | 3,315 | 92.2% |
| Two or more Races | 247 | 6.9% |
| Some other Race | 21 | 0.6% |
| Total | 3,596 | 100.0% |
Ancestry in Austin
The most populous ancestries reported in Austin are Irish (415 | 11.5%), American (392 | 10.9%), German (338 | 9.4%), English (309 | 8.6%), and Scottish (154 | 4.3%), together accounting for 44.7% of all Austin residents.
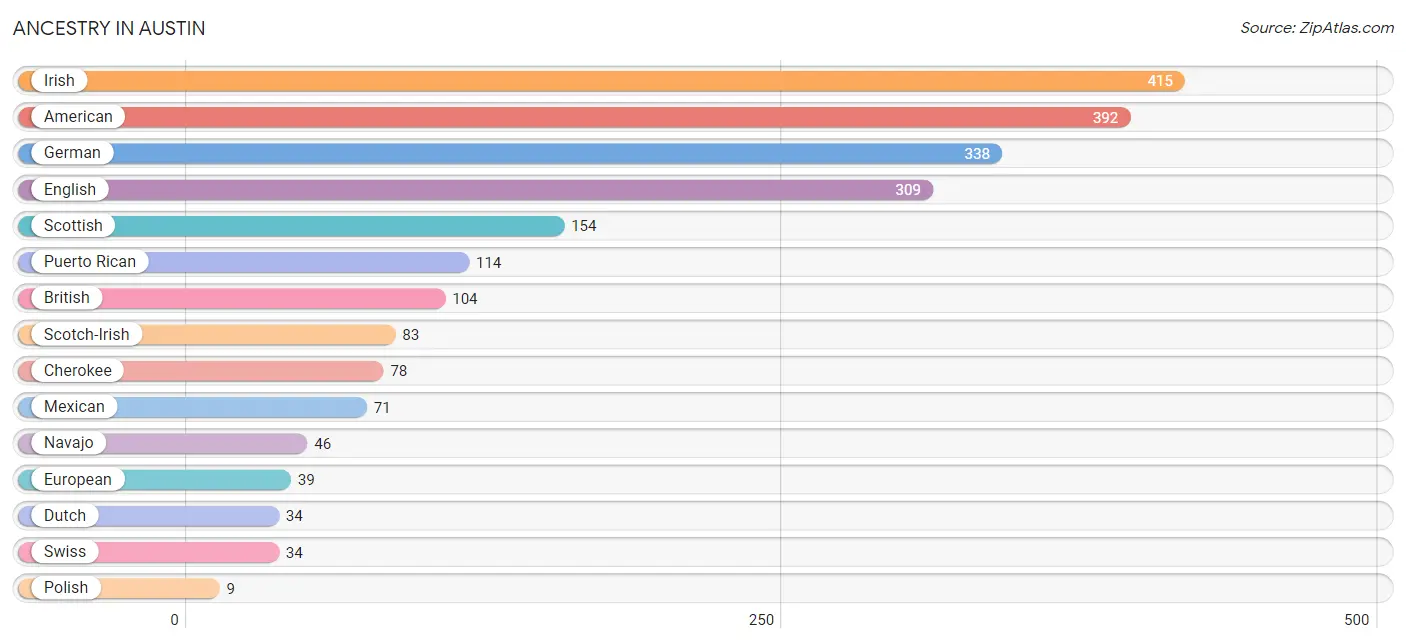
| Ancestry | # Population | % Population |
| American | 392 | 10.9% |
| British | 104 | 2.9% |
| Cherokee | 78 | 2.2% |
| Dutch | 34 | 0.9% |
| English | 309 | 8.6% |
| European | 39 | 1.1% |
| German | 338 | 9.4% |
| Greek | 7 | 0.2% |
| Irish | 415 | 11.5% |
| Mexican | 71 | 2.0% |
| Navajo | 46 | 1.3% |
| Polish | 9 | 0.3% |
| Puerto Rican | 114 | 3.2% |
| Scotch-Irish | 83 | 2.3% |
| Scottish | 154 | 4.3% |
| Swiss | 34 | 0.9% | View All 16 Rows |
Immigrants in Austin
The most numerous immigrant groups reported in Austin came from Central America (12 | 0.3%), Latin America (12 | 0.3%), Mexico (12 | 0.3%), and Canada (10 | 0.3%), together accounting for 1.3% of all Austin residents.
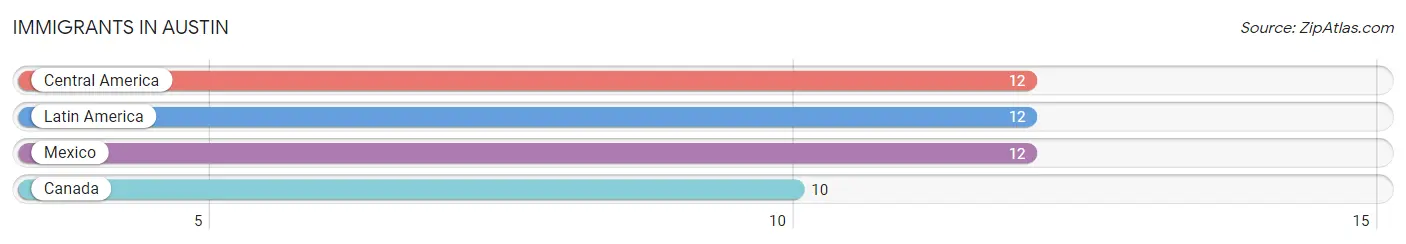
| Immigration Origin | # Population | % Population |
| Canada | 10 | 0.3% |
| Central America | 12 | 0.3% |
| Latin America | 12 | 0.3% |
| Mexico | 12 | 0.3% | View All 4 Rows |
Sex and Age in Austin
Sex and Age in Austin
The most populous age groups in Austin are 50 to 54 Years (225 | 13.3%) for men and 60 to 64 Years (232 | 12.2%) for women.
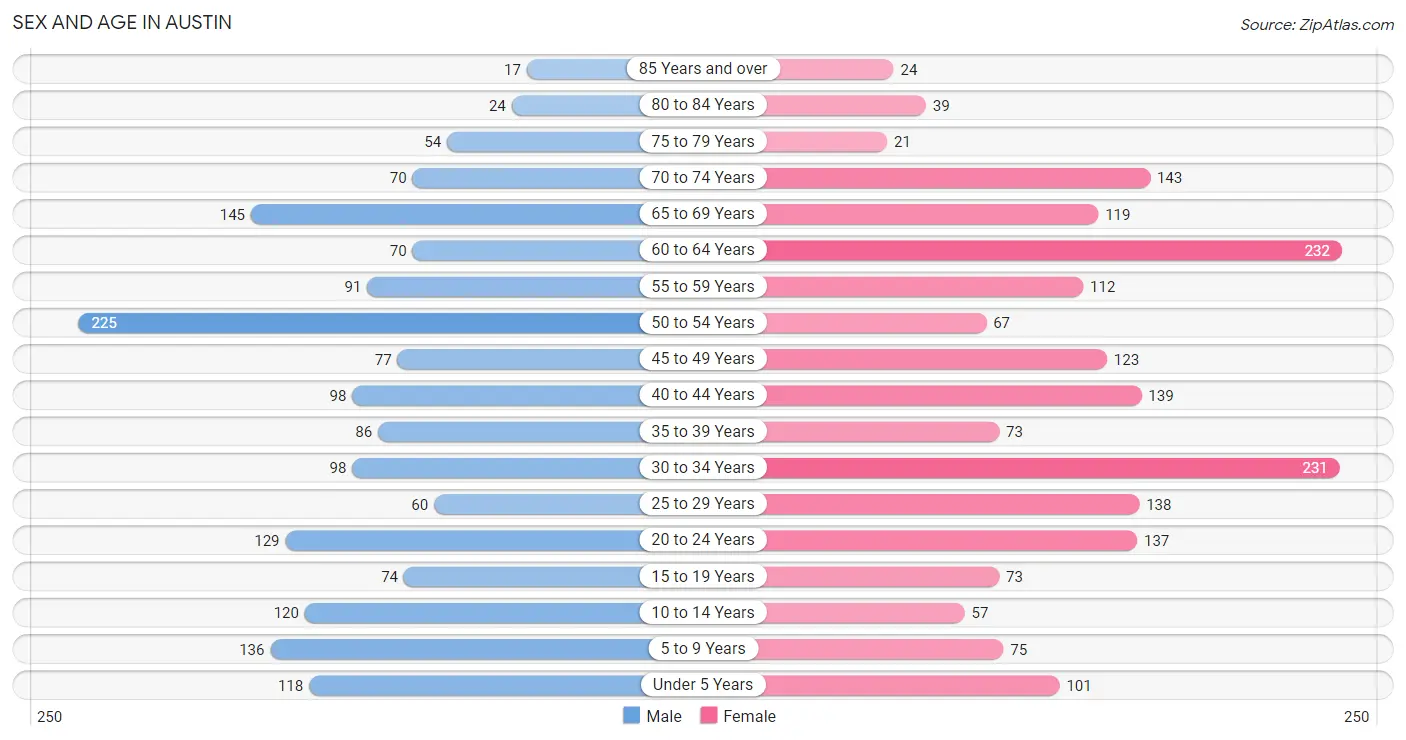
| Age Bracket | Male | Female |
| Under 5 Years | 118 (7.0%) | 101 (5.3%) |
| 5 to 9 Years | 136 (8.0%) | 75 (3.9%) |
| 10 to 14 Years | 120 (7.1%) | 57 (3.0%) |
| 15 to 19 Years | 74 (4.4%) | 73 (3.8%) |
| 20 to 24 Years | 129 (7.6%) | 137 (7.2%) |
| 25 to 29 Years | 60 (3.5%) | 138 (7.2%) |
| 30 to 34 Years | 98 (5.8%) | 231 (12.1%) |
| 35 to 39 Years | 86 (5.1%) | 73 (3.8%) |
| 40 to 44 Years | 98 (5.8%) | 139 (7.3%) |
| 45 to 49 Years | 77 (4.5%) | 123 (6.5%) |
| 50 to 54 Years | 225 (13.3%) | 67 (3.5%) |
| 55 to 59 Years | 91 (5.4%) | 112 (5.9%) |
| 60 to 64 Years | 70 (4.1%) | 232 (12.2%) |
| 65 to 69 Years | 145 (8.6%) | 119 (6.2%) |
| 70 to 74 Years | 70 (4.1%) | 143 (7.5%) |
| 75 to 79 Years | 54 (3.2%) | 21 (1.1%) |
| 80 to 84 Years | 24 (1.4%) | 39 (2.1%) |
| 85 Years and over | 17 (1.0%) | 24 (1.3%) |
| Total | 1,692 (100.0%) | 1,904 (100.0%) |
Families and Households in Austin
Median Family Size in Austin
The median family size in Austin is 2.79 persons per family, with single female/mother families (267 | 27.7%) accounting for the largest median family size of 3.19 persons per family. On the other hand, single male/father families (65 | 6.7%) represent the smallest median family size with 2.09 persons per family.
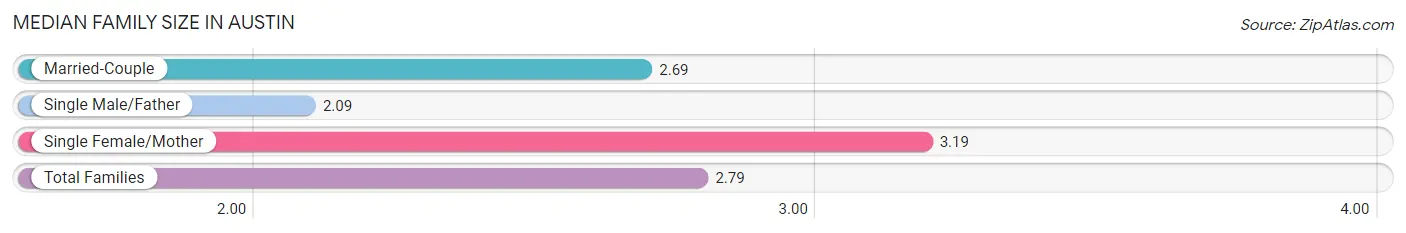
| Family Type | # Families | Family Size |
| Married-Couple | 632 (65.6%) | 2.69 |
| Single Male/Father | 65 (6.7%) | 2.09 |
| Single Female/Mother | 267 (27.7%) | 3.19 |
| Total Families | 964 (100.0%) | 2.79 |
Median Household Size in Austin
The median household size in Austin is 2.18 persons per household, with single female/mother households (267 | 16.2%) accounting for the largest median household size of 3.75 persons per household. non-family households (687 | 41.6%) represent the smallest median household size with 1.08 persons per household.
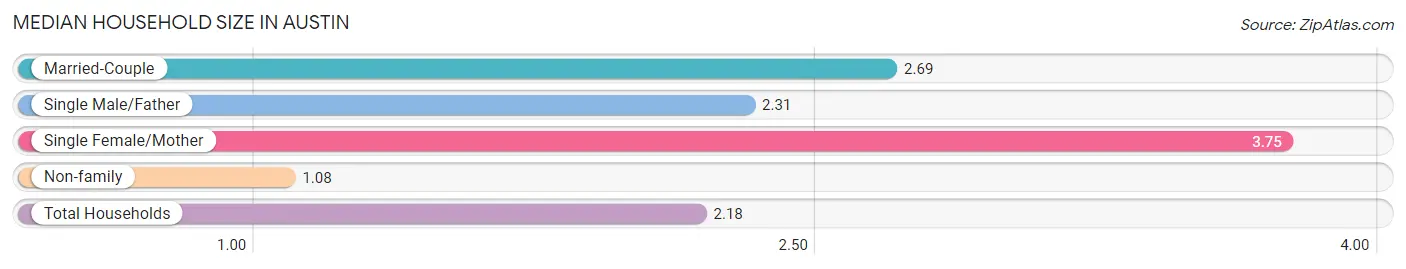
| Household Type | # Households | Household Size |
| Married-Couple | 632 (38.3%) | 2.69 |
| Single Male/Father | 65 (3.9%) | 2.31 |
| Single Female/Mother | 267 (16.2%) | 3.75 |
| Non-family | 687 (41.6%) | 1.08 |
| Total Households | 1,651 (100.0%) | 2.18 |
Household Size by Marriage Status in Austin
Out of a total of 1,651 households in Austin, 964 (58.4%) are family households, while 687 (41.6%) are nonfamily households. The most numerous type of family households are 2-person households, comprising 659, and the most common type of nonfamily households are 1-person households, comprising 636.
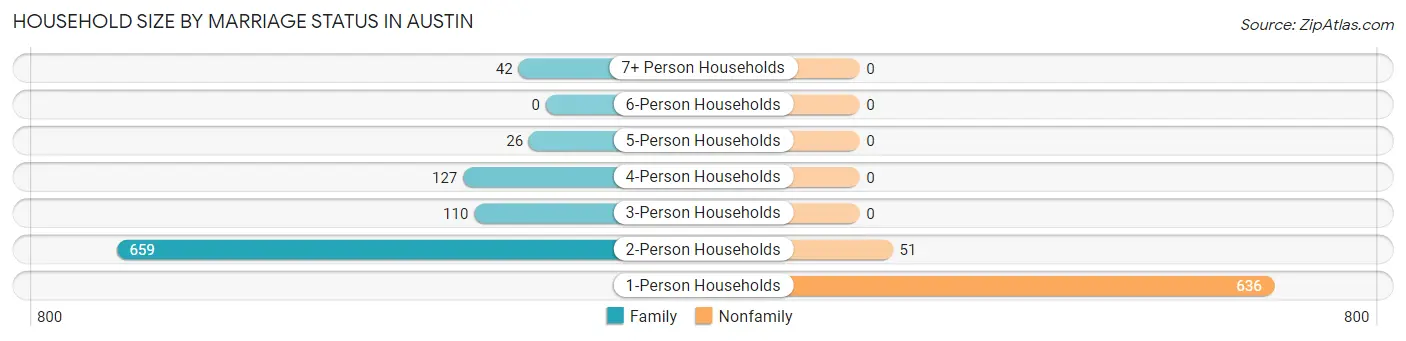
| Household Size | Family Households | Nonfamily Households |
| 1-Person Households | - | 636 (38.5%) |
| 2-Person Households | 659 (39.9%) | 51 (3.1%) |
| 3-Person Households | 110 (6.7%) | 0 (0.0%) |
| 4-Person Households | 127 (7.7%) | 0 (0.0%) |
| 5-Person Households | 26 (1.6%) | 0 (0.0%) |
| 6-Person Households | 0 (0.0%) | 0 (0.0%) |
| 7+ Person Households | 42 (2.5%) | 0 (0.0%) |
| Total | 964 (58.4%) | 687 (41.6%) |
Female Fertility in Austin
Fertility by Age in Austin
Average fertility rate in Austin is 36.0 births per 1,000 women. Women in the age bracket of 35 to 50 years have the highest fertility rate with 40.0 births per 1,000 women. Women in the age bracket of 20 to 34 years acount for 57.6% of all women with births.
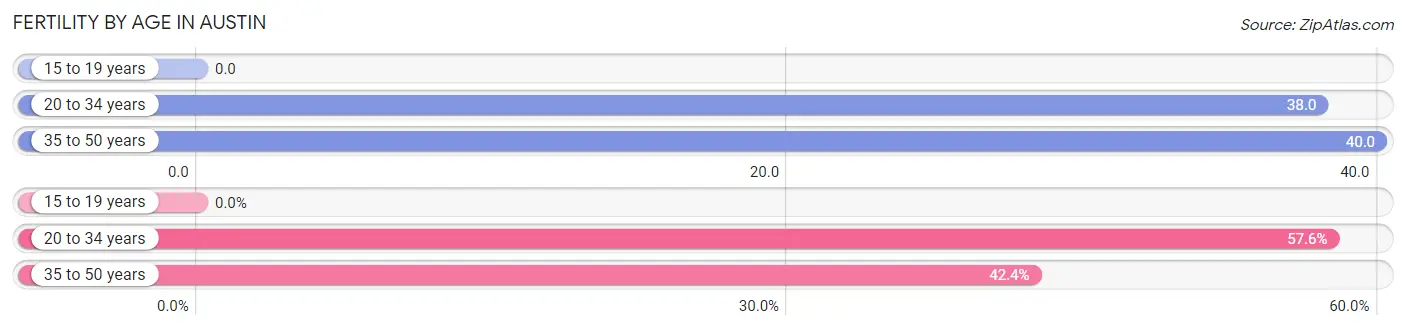
| Age Bracket | Women with Births | Births / 1,000 Women |
| 15 to 19 years | 0 (0.0%) | 0.0 |
| 20 to 34 years | 19 (57.6%) | 38.0 |
| 35 to 50 years | 14 (42.4%) | 40.0 |
| Total | 33 (100.0%) | 36.0 |
Fertility by Age by Marriage Status in Austin
57.6% of women with births (33) in Austin are married. The highest percentage of unmarried women with births falls into 35 to 50 years age bracket with 100.0% of them unmarried at the time of birth, while the lowest percentage of unmarried women with births belong to 20 to 34 years age bracket with 0.0% of them unmarried.
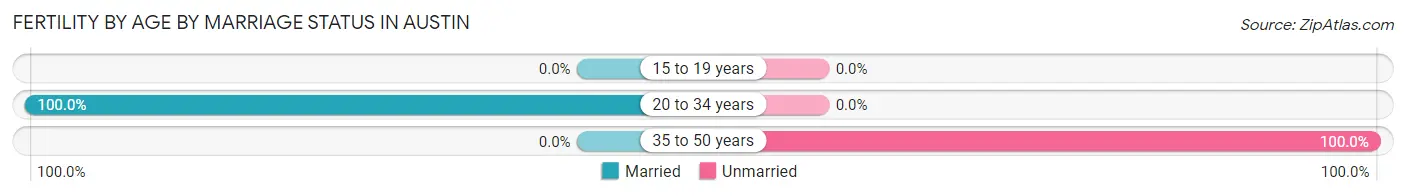
| Age Bracket | Married | Unmarried |
| 15 to 19 years | 0 (0.0%) | 0 (0.0%) |
| 20 to 34 years | 19 (100.0%) | 0 (0.0%) |
| 35 to 50 years | 0 (0.0%) | 14 (100.0%) |
| Total | 19 (57.6%) | 14 (42.4%) |
Fertility by Education in Austin
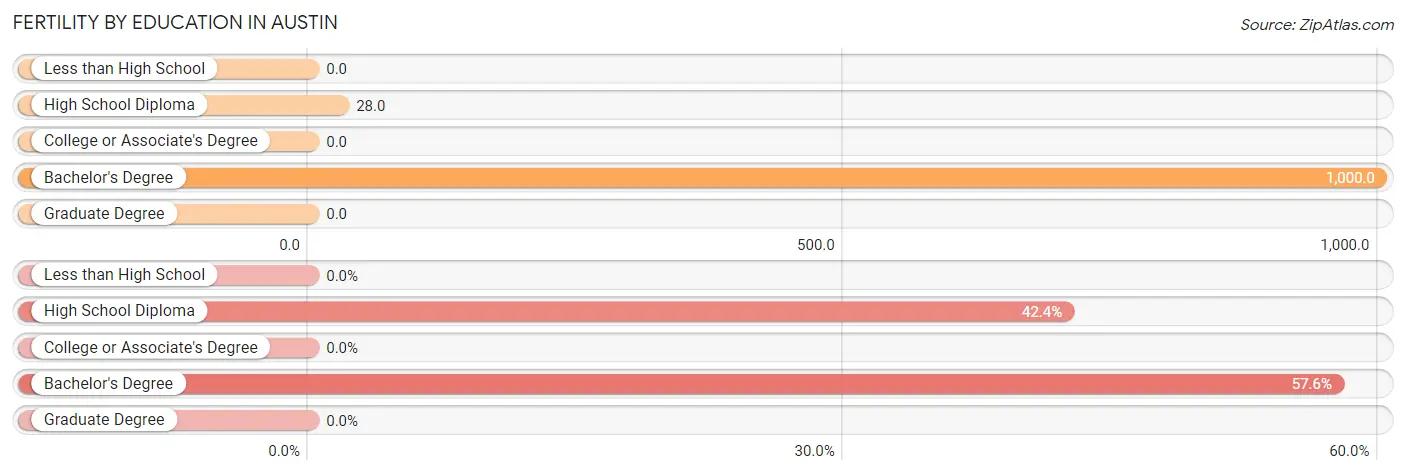
| Educational Attainment | Women with Births | Births / 1,000 Women |
| Less than High School | 0 (0.0%) | 0.0 |
| High School Diploma | 14 (42.4%) | 28.0 |
| College or Associate's Degree | 0 (0.0%) | 0.0 |
| Bachelor's Degree | 19 (57.6%) | 1,000.0 |
| Graduate Degree | 0 (0.0%) | 0.0 |
| Total | 33 (100.0%) | 36.0 |
Fertility by Education by Marriage Status in Austin
42.4% of women with births in Austin are unmarried. Women with the educational attainment of bachelor's degree are most likely to be married with 100.0% of them married at childbirth, while women with the educational attainment of high school diploma are least likely to be married with 100.0% of them unmarried at childbirth.
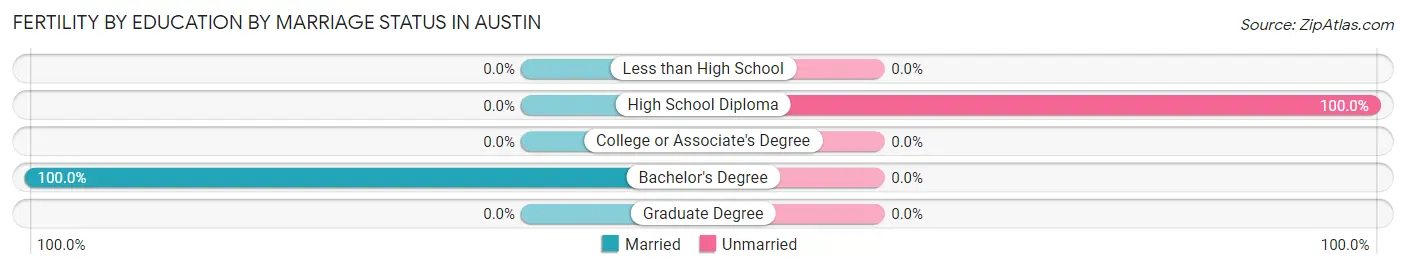
| Educational Attainment | Married | Unmarried |
| Less than High School | 0 (0.0%) | 0 (0.0%) |
| High School Diploma | 0 (0.0%) | 14 (100.0%) |
| College or Associate's Degree | 0 (0.0%) | 0 (0.0%) |
| Bachelor's Degree | 19 (100.0%) | 0 (0.0%) |
| Graduate Degree | 0 (0.0%) | 0 (0.0%) |
| Total | 19 (57.6%) | 14 (42.4%) |
Employment Characteristics in Austin
Employment by Class of Employer in Austin
Among the 1,688 employed individuals in Austin, private company employees (1,173 | 69.5%), not-for-profit organizations (301 | 17.8%), and self-employed (incorporated) (102 | 6.0%) make up the most common classes of employment.
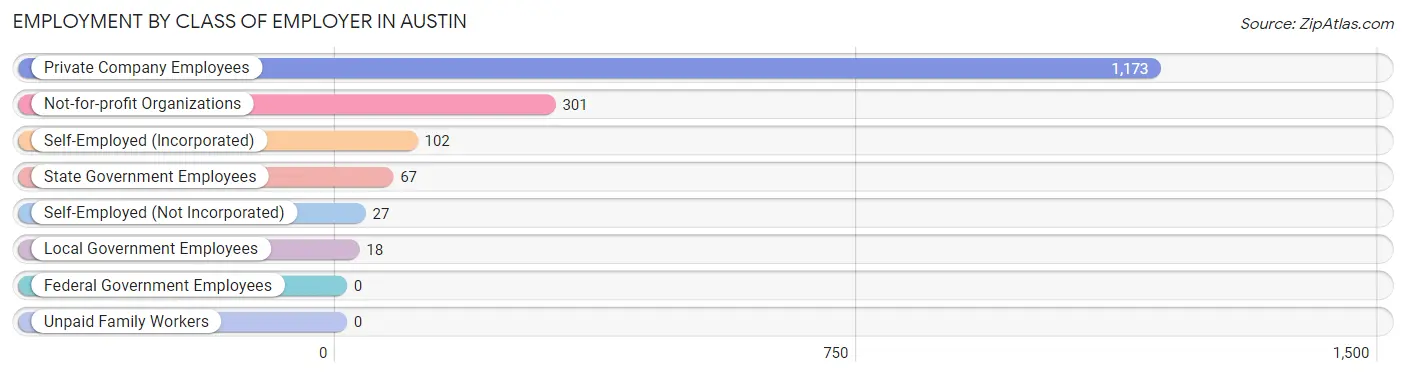
| Employer Class | # Employees | % Employees |
| Private Company Employees | 1,173 | 69.5% |
| Self-Employed (Incorporated) | 102 | 6.0% |
| Self-Employed (Not Incorporated) | 27 | 1.6% |
| Not-for-profit Organizations | 301 | 17.8% |
| Local Government Employees | 18 | 1.1% |
| State Government Employees | 67 | 4.0% |
| Federal Government Employees | 0 | 0.0% |
| Unpaid Family Workers | 0 | 0.0% |
| Total | 1,688 | 100.0% |
Employment Status by Age in Austin
According to the labor force statistics for Austin, out of the total population over 16 years of age (2,944), 60.2% or 1,772 individuals are in the labor force, with 3.8% or 67 of them unemployed. The age group with the highest labor force participation rate is 20 to 24 years, with 100.0% or 266 individuals in the labor force. Within the labor force, the 75 years and over age range has the highest percentage of unemployed individuals, with 50.0% or 17 of them being unemployed.
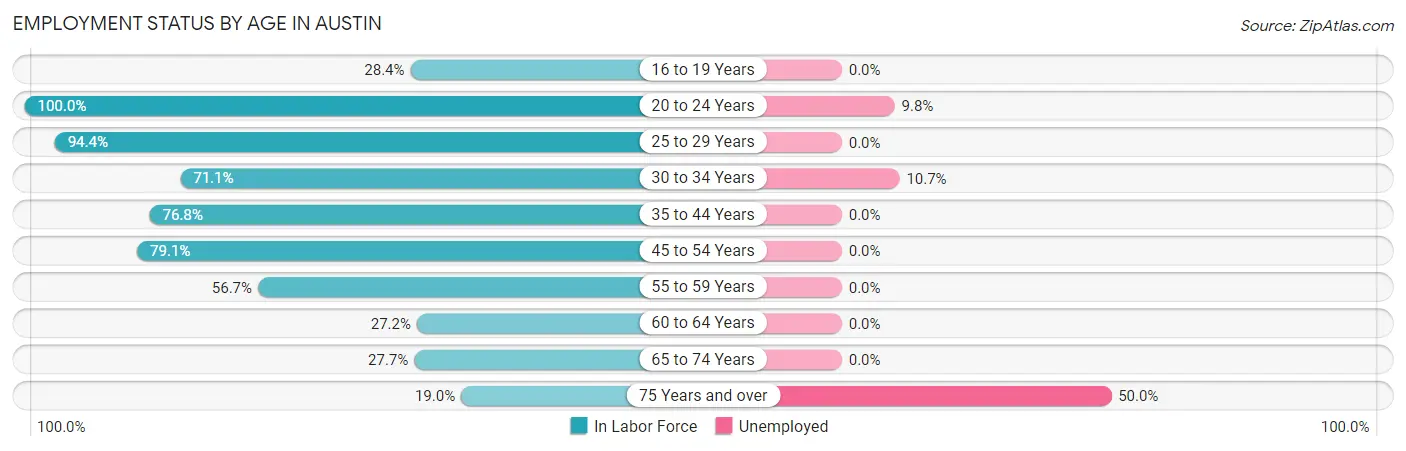
| Age Bracket | In Labor Force | Unemployed |
| 16 to 19 Years | 29 (28.4%) | 0 (0.0%) |
| 20 to 24 Years | 266 (100.0%) | 26 (9.8%) |
| 25 to 29 Years | 187 (94.4%) | 0 (0.0%) |
| 30 to 34 Years | 234 (71.1%) | 25 (10.7%) |
| 35 to 44 Years | 304 (76.8%) | 0 (0.0%) |
| 45 to 54 Years | 389 (79.1%) | 0 (0.0%) |
| 55 to 59 Years | 115 (56.7%) | 0 (0.0%) |
| 60 to 64 Years | 82 (27.2%) | 0 (0.0%) |
| 65 to 74 Years | 132 (27.7%) | 0 (0.0%) |
| 75 Years and over | 34 (19.0%) | 17 (50.0%) |
| Total | 1,772 (60.2%) | 67 (3.8%) |
Employment Status by Educational Attainment in Austin
According to labor force statistics for Austin, 68.3% of individuals (1,311) out of the total population between 25 and 64 years of age (1,920) are in the labor force, with 1.9% or 25 of them being unemployed. The group with the highest labor force participation rate are those with the educational attainment of bachelor's degree or higher, with 91.5% or 216 individuals in the labor force. Within the labor force, individuals with high school diploma education have the highest percentage of unemployment, with 3.5% or 25 of them being unemployed.
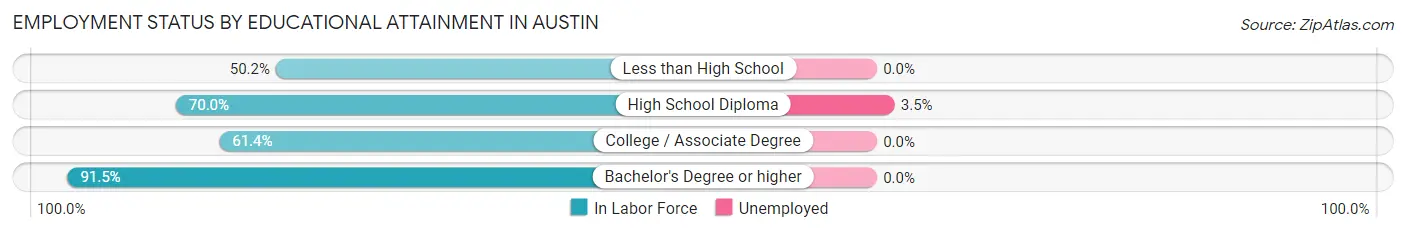
| Educational Attainment | In Labor Force | Unemployed |
| Less than High School | 116 (50.2%) | 0 (0.0%) |
| High School Diploma | 709 (70.0%) | 35 (3.5%) |
| College / Associate Degree | 270 (61.4%) | 0 (0.0%) |
| Bachelor's Degree or higher | 216 (91.5%) | 0 (0.0%) |
| Total | 1,311 (68.3%) | 36 (1.9%) |
Employment Occupations by Sex in Austin
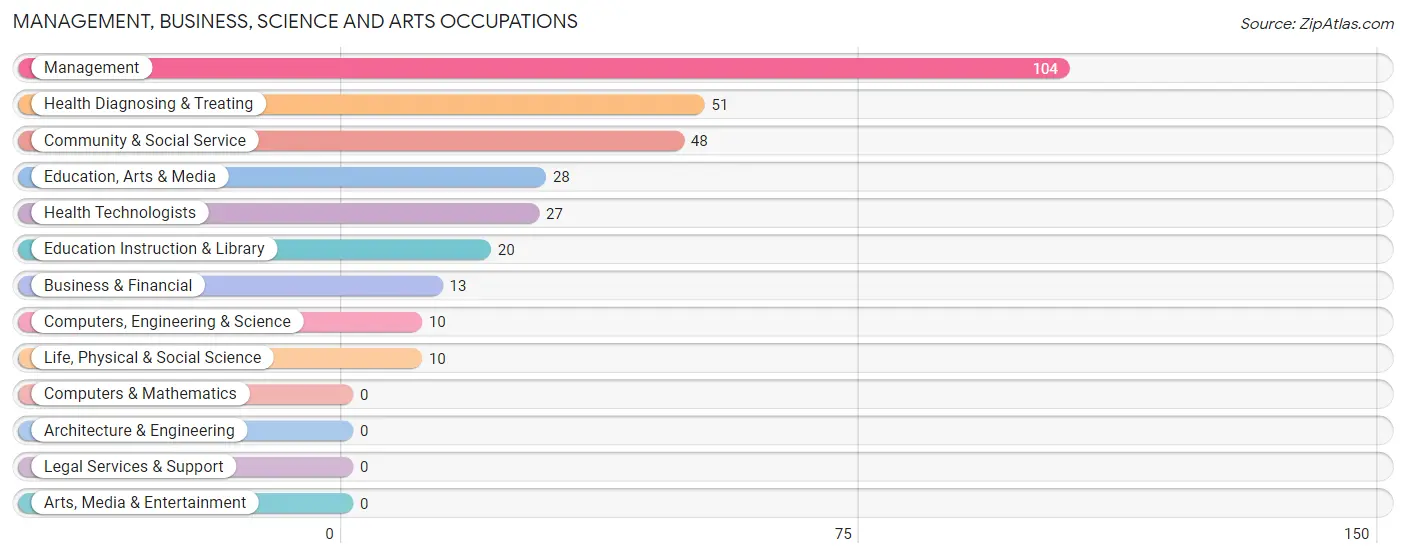
Management, Business, Science and Arts Occupations
The most common Management, Business, Science and Arts occupations in Austin are Management (104 | 6.1%), Health Diagnosing & Treating (51 | 3.0%), Community & Social Service (48 | 2.8%), Education, Arts & Media (28 | 1.6%), and Health Technologists (27 | 1.6%).
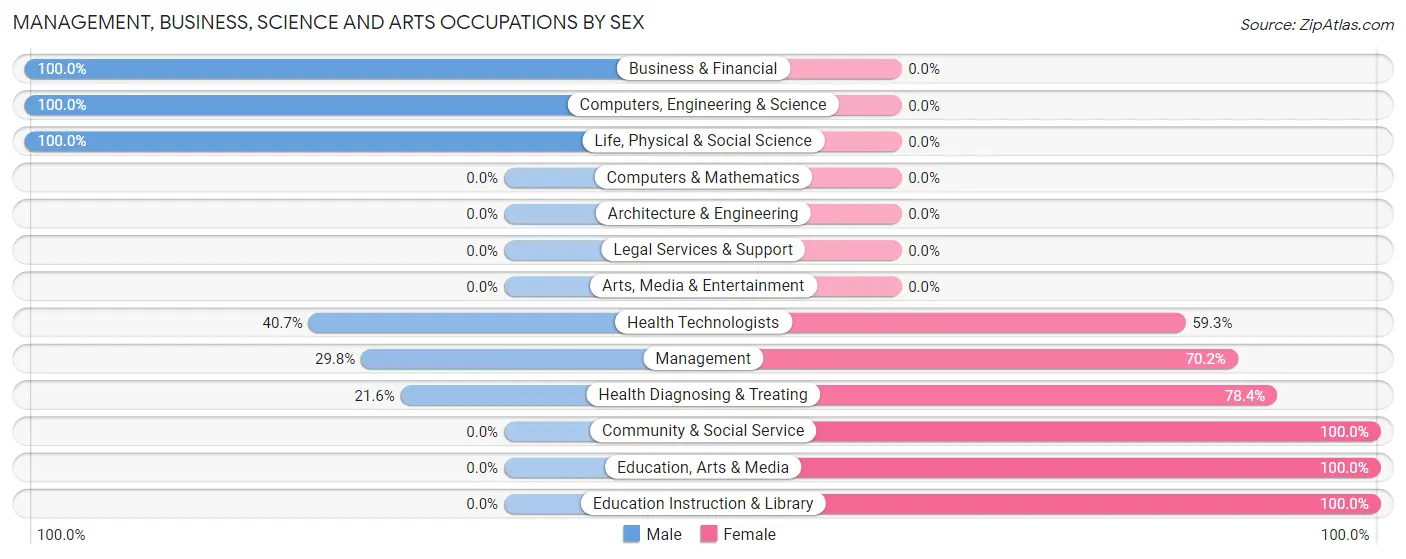
Management, Business, Science and Arts Occupations by Sex
Within the Management, Business, Science and Arts occupations in Austin, the most male-oriented occupations are Business & Financial (100.0%), Computers, Engineering & Science (100.0%), and Life, Physical & Social Science (100.0%), while the most female-oriented occupations are Community & Social Service (100.0%), Education, Arts & Media (100.0%), and Education Instruction & Library (100.0%).
| Occupation | Male | Female |
| Management | 31 (29.8%) | 73 (70.2%) |
| Business & Financial | 13 (100.0%) | 0 (0.0%) |
| Computers, Engineering & Science | 10 (100.0%) | 0 (0.0%) |
| Computers & Mathematics | 0 (0.0%) | 0 (0.0%) |
| Architecture & Engineering | 0 (0.0%) | 0 (0.0%) |
| Life, Physical & Social Science | 10 (100.0%) | 0 (0.0%) |
| Community & Social Service | 0 (0.0%) | 48 (100.0%) |
| Education, Arts & Media | 0 (0.0%) | 28 (100.0%) |
| Legal Services & Support | 0 (0.0%) | 0 (0.0%) |
| Education Instruction & Library | 0 (0.0%) | 20 (100.0%) |
| Arts, Media & Entertainment | 0 (0.0%) | 0 (0.0%) |
| Health Diagnosing & Treating | 11 (21.6%) | 40 (78.4%) |
| Health Technologists | 11 (40.7%) | 16 (59.3%) |
| Total (Category) | 65 (28.8%) | 161 (71.2%) |
| Total (Overall) | 830 (48.7%) | 874 (51.3%) |
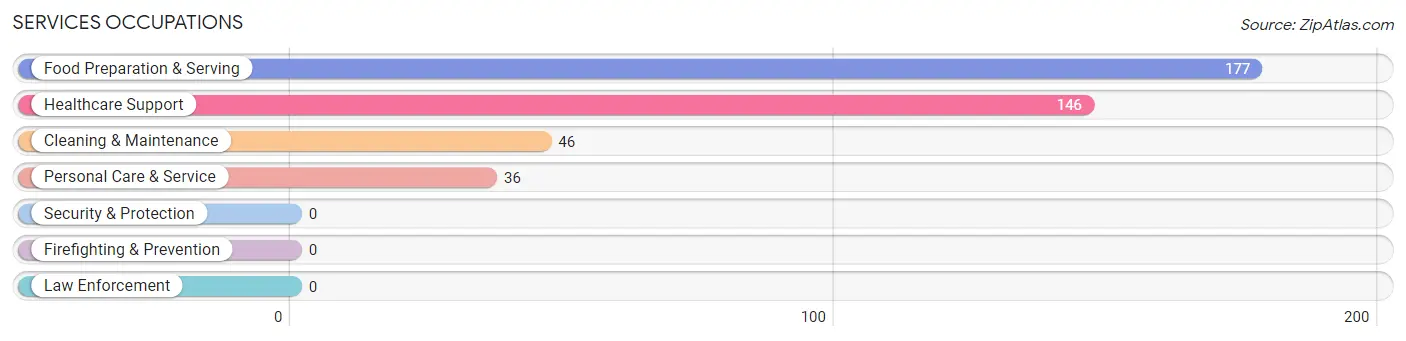
Services Occupations
The most common Services occupations in Austin are Food Preparation & Serving (177 | 10.4%), Healthcare Support (146 | 8.6%), Cleaning & Maintenance (46 | 2.7%), and Personal Care & Service (36 | 2.1%).
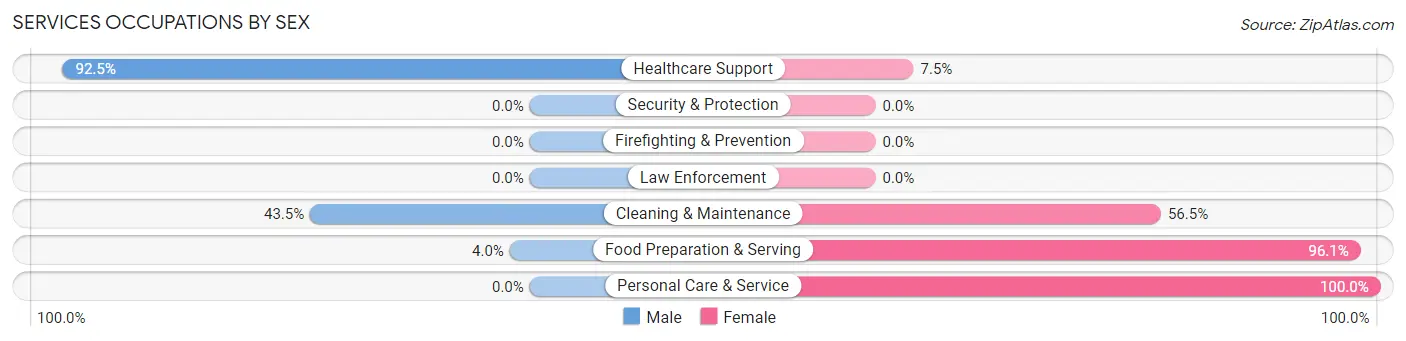
Services Occupations by Sex
Within the Services occupations in Austin, the most male-oriented occupations are Healthcare Support (92.5%), Cleaning & Maintenance (43.5%), and Food Preparation & Serving (4.0%), while the most female-oriented occupations are Personal Care & Service (100.0%), Food Preparation & Serving (96.1%), and Cleaning & Maintenance (56.5%).
| Occupation | Male | Female |
| Healthcare Support | 135 (92.5%) | 11 (7.5%) |
| Security & Protection | 0 (0.0%) | 0 (0.0%) |
| Firefighting & Prevention | 0 (0.0%) | 0 (0.0%) |
| Law Enforcement | 0 (0.0%) | 0 (0.0%) |
| Food Preparation & Serving | 7 (4.0%) | 170 (96.1%) |
| Cleaning & Maintenance | 20 (43.5%) | 26 (56.5%) |
| Personal Care & Service | 0 (0.0%) | 36 (100.0%) |
| Total (Category) | 162 (40.0%) | 243 (60.0%) |
| Total (Overall) | 830 (48.7%) | 874 (51.3%) |
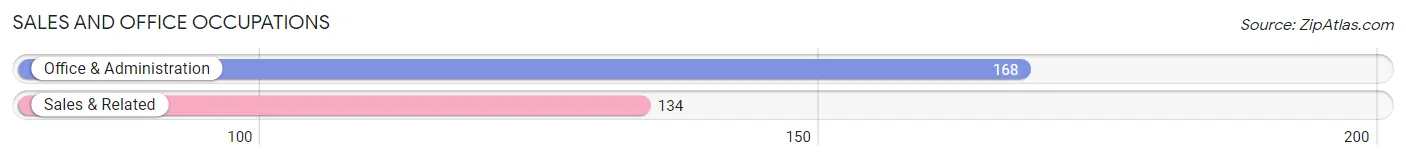
Sales and Office Occupations
The most common Sales and Office occupations in Austin are Office & Administration (168 | 9.9%), and Sales & Related (134 | 7.9%).
Sales and Office Occupations by Sex
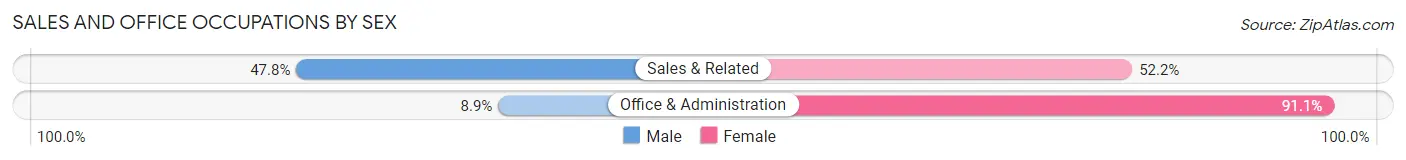
| Occupation | Male | Female |
| Sales & Related | 64 (47.8%) | 70 (52.2%) |
| Office & Administration | 15 (8.9%) | 153 (91.1%) |
| Total (Category) | 79 (26.2%) | 223 (73.8%) |
| Total (Overall) | 830 (48.7%) | 874 (51.3%) |
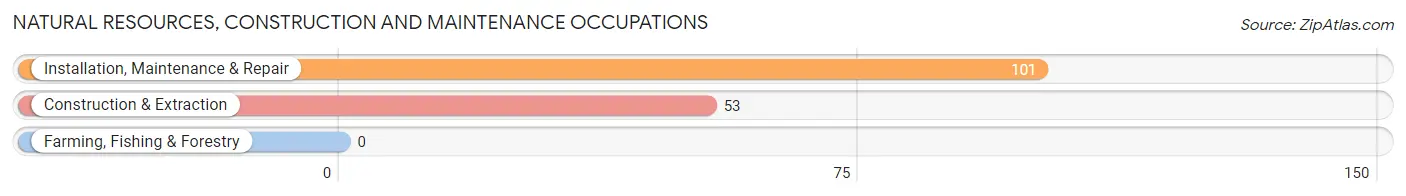
Natural Resources, Construction and Maintenance Occupations
The most common Natural Resources, Construction and Maintenance occupations in Austin are Installation, Maintenance & Repair (101 | 5.9%), and Construction & Extraction (53 | 3.1%).
Natural Resources, Construction and Maintenance Occupations by Sex
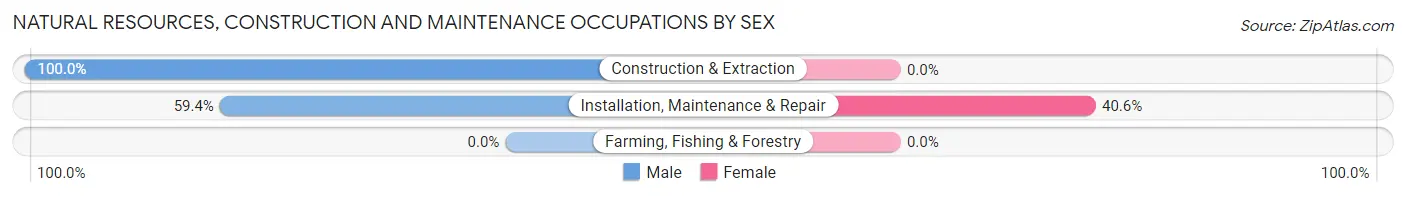
| Occupation | Male | Female |
| Farming, Fishing & Forestry | 0 (0.0%) | 0 (0.0%) |
| Construction & Extraction | 53 (100.0%) | 0 (0.0%) |
| Installation, Maintenance & Repair | 60 (59.4%) | 41 (40.6%) |
| Total (Category) | 113 (73.4%) | 41 (26.6%) |
| Total (Overall) | 830 (48.7%) | 874 (51.3%) |
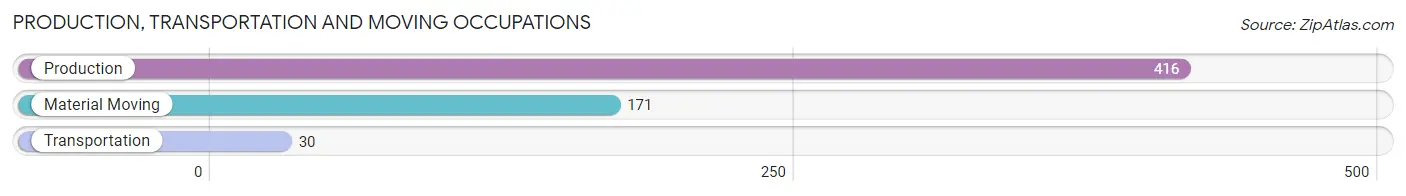
Production, Transportation and Moving Occupations
The most common Production, Transportation and Moving occupations in Austin are Production (416 | 24.4%), Material Moving (171 | 10.0%), and Transportation (30 | 1.8%).
Production, Transportation and Moving Occupations by Sex
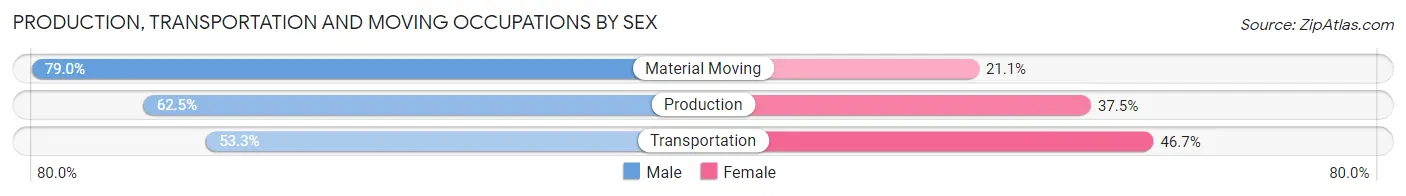
| Occupation | Male | Female |
| Production | 260 (62.5%) | 156 (37.5%) |
| Transportation | 16 (53.3%) | 14 (46.7%) |
| Material Moving | 135 (78.9%) | 36 (21.0%) |
| Total (Category) | 411 (66.6%) | 206 (33.4%) |
| Total (Overall) | 830 (48.7%) | 874 (51.3%) |
Employment Industries by Sex in Austin
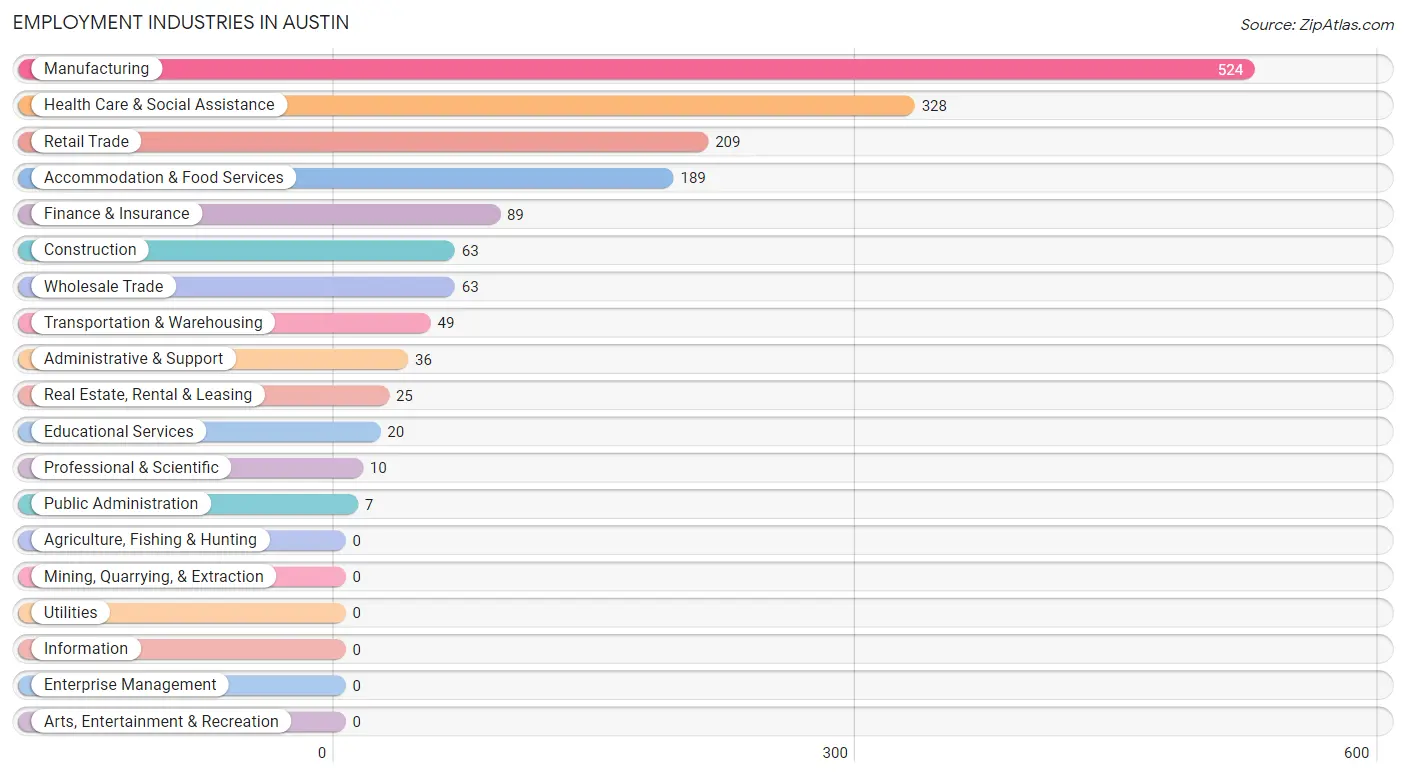
Employment Industries in Austin
The major employment industries in Austin include Manufacturing (524 | 30.7%), Health Care & Social Assistance (328 | 19.3%), Retail Trade (209 | 12.3%), Accommodation & Food Services (189 | 11.1%), and Finance & Insurance (89 | 5.2%).
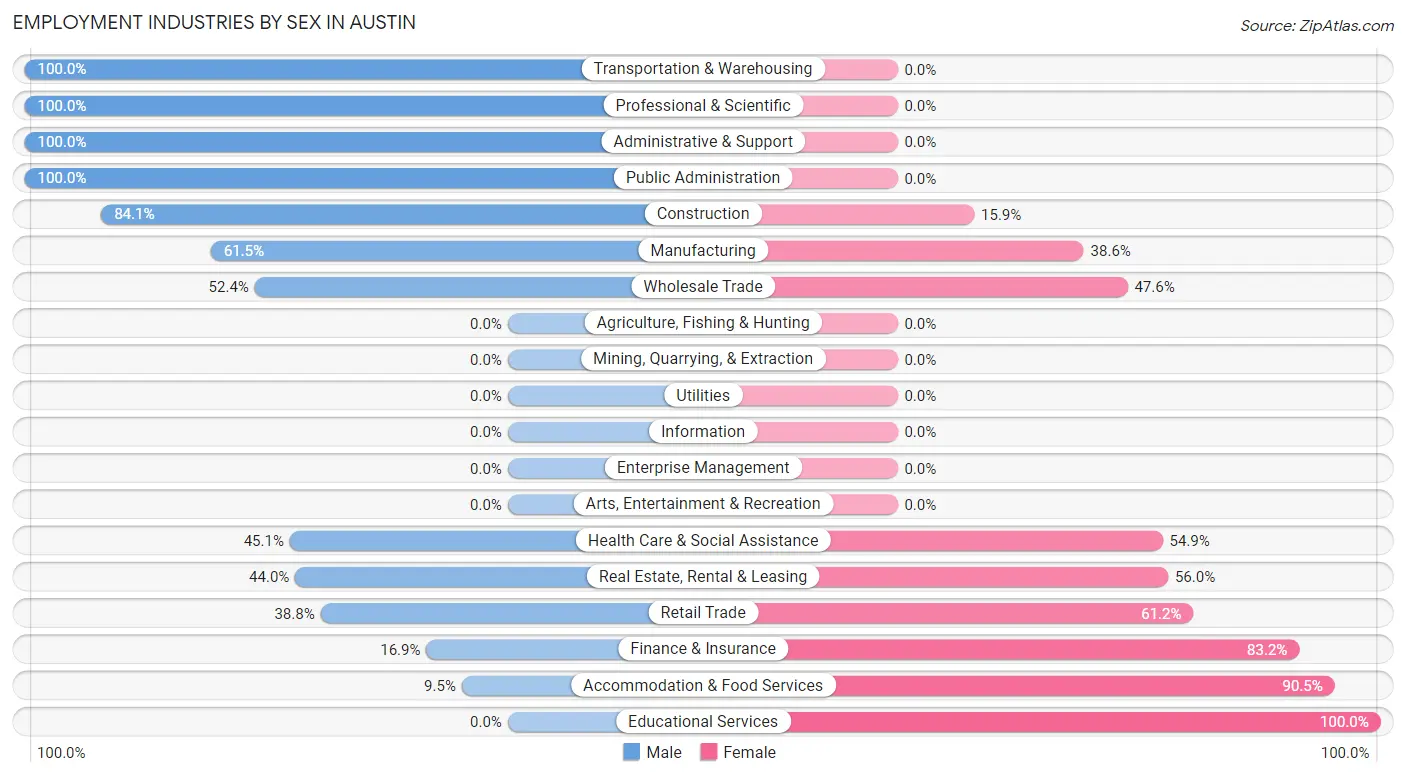
Employment Industries by Sex in Austin
The Austin industries that see more men than women are Transportation & Warehousing (100.0%), Professional & Scientific (100.0%), and Administrative & Support (100.0%), whereas the industries that tend to have a higher number of women are Educational Services (100.0%), Accommodation & Food Services (90.5%), and Finance & Insurance (83.2%).
| Industry | Male | Female |
| Agriculture, Fishing & Hunting | 0 (0.0%) | 0 (0.0%) |
| Mining, Quarrying, & Extraction | 0 (0.0%) | 0 (0.0%) |
| Construction | 53 (84.1%) | 10 (15.9%) |
| Manufacturing | 322 (61.5%) | 202 (38.6%) |
| Wholesale Trade | 33 (52.4%) | 30 (47.6%) |
| Retail Trade | 81 (38.8%) | 128 (61.2%) |
| Transportation & Warehousing | 49 (100.0%) | 0 (0.0%) |
| Utilities | 0 (0.0%) | 0 (0.0%) |
| Information | 0 (0.0%) | 0 (0.0%) |
| Finance & Insurance | 15 (16.9%) | 74 (83.2%) |
| Real Estate, Rental & Leasing | 11 (44.0%) | 14 (56.0%) |
| Professional & Scientific | 10 (100.0%) | 0 (0.0%) |
| Enterprise Management | 0 (0.0%) | 0 (0.0%) |
| Administrative & Support | 36 (100.0%) | 0 (0.0%) |
| Educational Services | 0 (0.0%) | 20 (100.0%) |
| Health Care & Social Assistance | 148 (45.1%) | 180 (54.9%) |
| Arts, Entertainment & Recreation | 0 (0.0%) | 0 (0.0%) |
| Accommodation & Food Services | 18 (9.5%) | 171 (90.5%) |
| Public Administration | 7 (100.0%) | 0 (0.0%) |
| Total | 830 (48.7%) | 874 (51.3%) |
Education in Austin
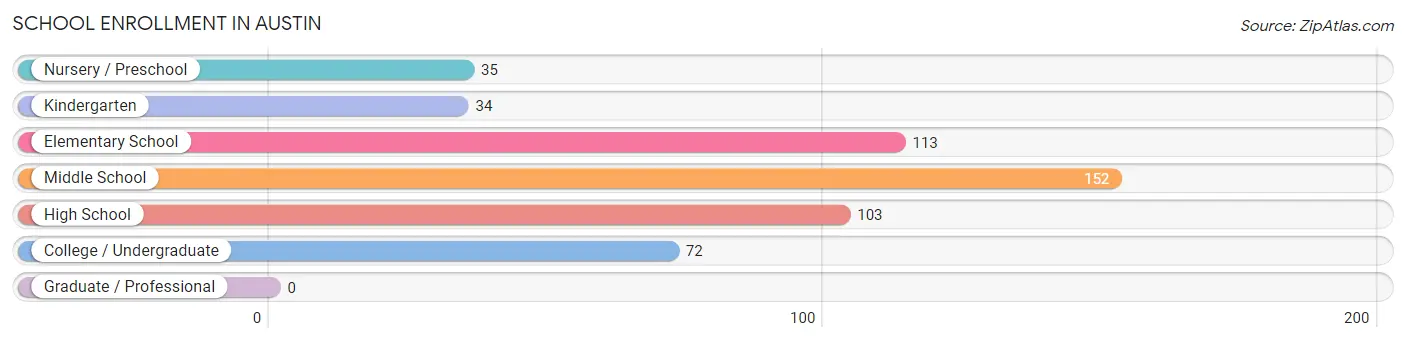
School Enrollment in Austin
The most common levels of schooling among the 509 students in Austin are middle school (152 | 29.9%), elementary school (113 | 22.2%), and high school (103 | 20.2%).
| School Level | # Students | % Students |
| Nursery / Preschool | 35 | 6.9% |
| Kindergarten | 34 | 6.7% |
| Elementary School | 113 | 22.2% |
| Middle School | 152 | 29.9% |
| High School | 103 | 20.2% |
| College / Undergraduate | 72 | 14.1% |
| Graduate / Professional | 0 | 0.0% |
| Total | 509 | 100.0% |
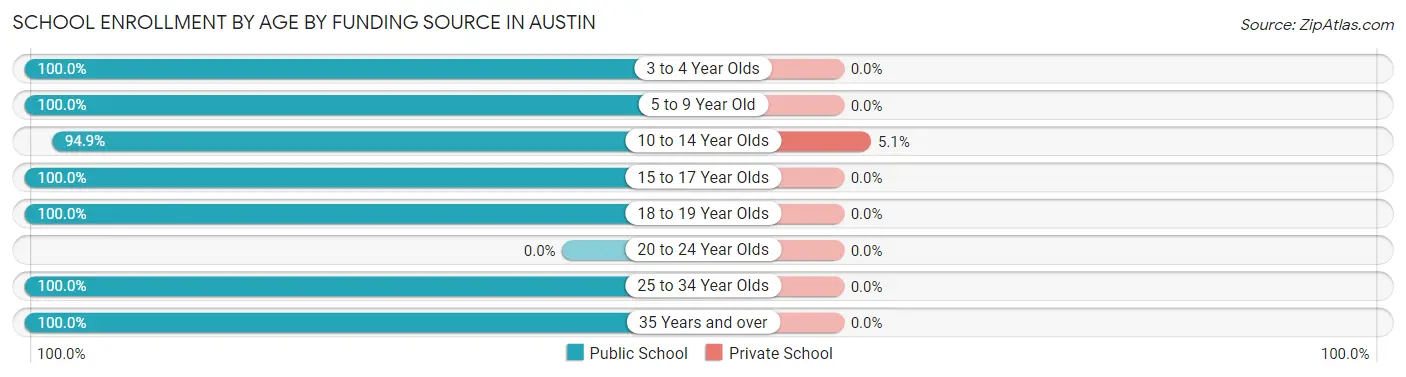
School Enrollment by Age by Funding Source in Austin
Out of a total of 509 students who are enrolled in schools in Austin, 9 (1.8%) attend a private institution, while the remaining 500 (98.2%) are enrolled in public schools. The age group of 10 to 14 year olds has the highest likelihood of being enrolled in private schools, with 9 (5.1% in the age bracket) enrolled. Conversely, the age group of 3 to 4 year olds has the lowest likelihood of being enrolled in a private school, with 35 (100.0% in the age bracket) attending a public institution.
| Age Bracket | Public School | Private School |
| 3 to 4 Year Olds | 35 (100.0%) | 0 (0.0%) |
| 5 to 9 Year Old | 122 (100.0%) | 0 (0.0%) |
| 10 to 14 Year Olds | 168 (94.9%) | 9 (5.1%) |
| 15 to 17 Year Olds | 59 (100.0%) | 0 (0.0%) |
| 18 to 19 Year Olds | 44 (100.0%) | 0 (0.0%) |
| 20 to 24 Year Olds | 0 (0.0%) | 0 (0.0%) |
| 25 to 34 Year Olds | 59 (100.0%) | 0 (0.0%) |
| 35 Years and over | 13 (100.0%) | 0 (0.0%) |
| Total | 500 (98.2%) | 9 (1.8%) |
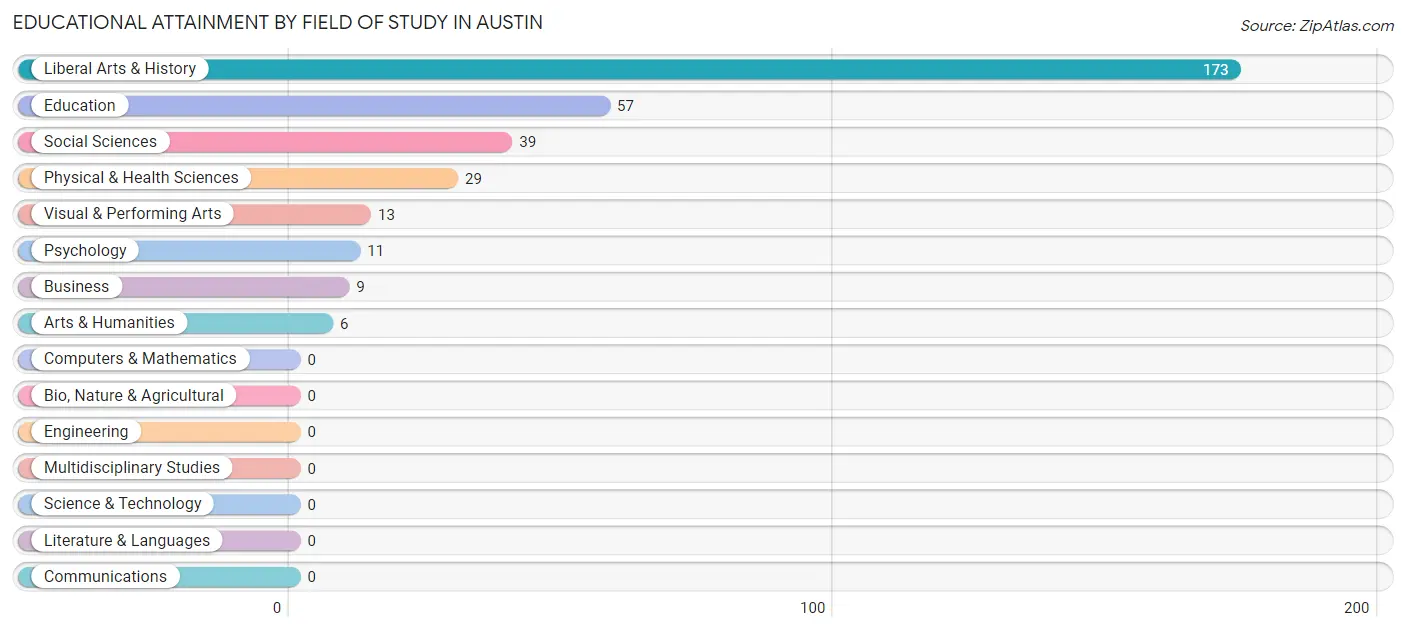
Educational Attainment by Field of Study in Austin
Liberal arts & history (173 | 51.3%), education (57 | 16.9%), social sciences (39 | 11.6%), physical & health sciences (29 | 8.6%), and visual & performing arts (13 | 3.9%) are the most common fields of study among 337 individuals in Austin who have obtained a bachelor's degree or higher.
| Field of Study | # Graduates | % Graduates |
| Computers & Mathematics | 0 | 0.0% |
| Bio, Nature & Agricultural | 0 | 0.0% |
| Physical & Health Sciences | 29 | 8.6% |
| Psychology | 11 | 3.3% |
| Social Sciences | 39 | 11.6% |
| Engineering | 0 | 0.0% |
| Multidisciplinary Studies | 0 | 0.0% |
| Science & Technology | 0 | 0.0% |
| Business | 9 | 2.7% |
| Education | 57 | 16.9% |
| Literature & Languages | 0 | 0.0% |
| Liberal Arts & History | 173 | 51.3% |
| Visual & Performing Arts | 13 | 3.9% |
| Communications | 0 | 0.0% |
| Arts & Humanities | 6 | 1.8% |
| Total | 337 | 100.0% |
Transportation & Commute in Austin
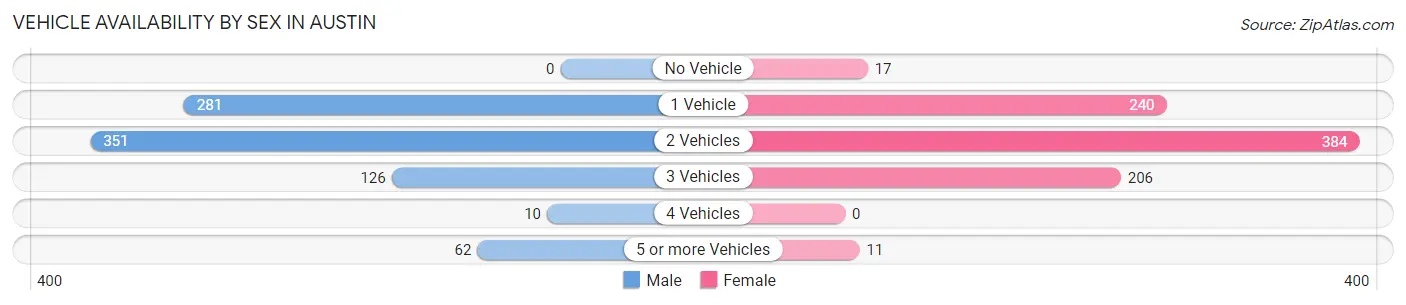
Vehicle Availability by Sex in Austin
The most prevalent vehicle ownership categories in Austin are males with 2 vehicles (351, accounting for 42.3%) and females with 2 vehicles (384, making up 40.9%).
| Vehicles Available | Male | Female |
| No Vehicle | 0 (0.0%) | 17 (2.0%) |
| 1 Vehicle | 281 (33.9%) | 240 (28.0%) |
| 2 Vehicles | 351 (42.3%) | 384 (44.8%) |
| 3 Vehicles | 126 (15.2%) | 206 (24.0%) |
| 4 Vehicles | 10 (1.2%) | 0 (0.0%) |
| 5 or more Vehicles | 62 (7.5%) | 11 (1.3%) |
| Total | 830 (100.0%) | 858 (100.0%) |
Commute Time in Austin
The most frequently occuring commute durations in Austin are 5 to 9 minutes (335 commuters, 20.6%), 45 to 59 minutes (229 commuters, 14.1%), and 15 to 19 minutes (216 commuters, 13.3%).
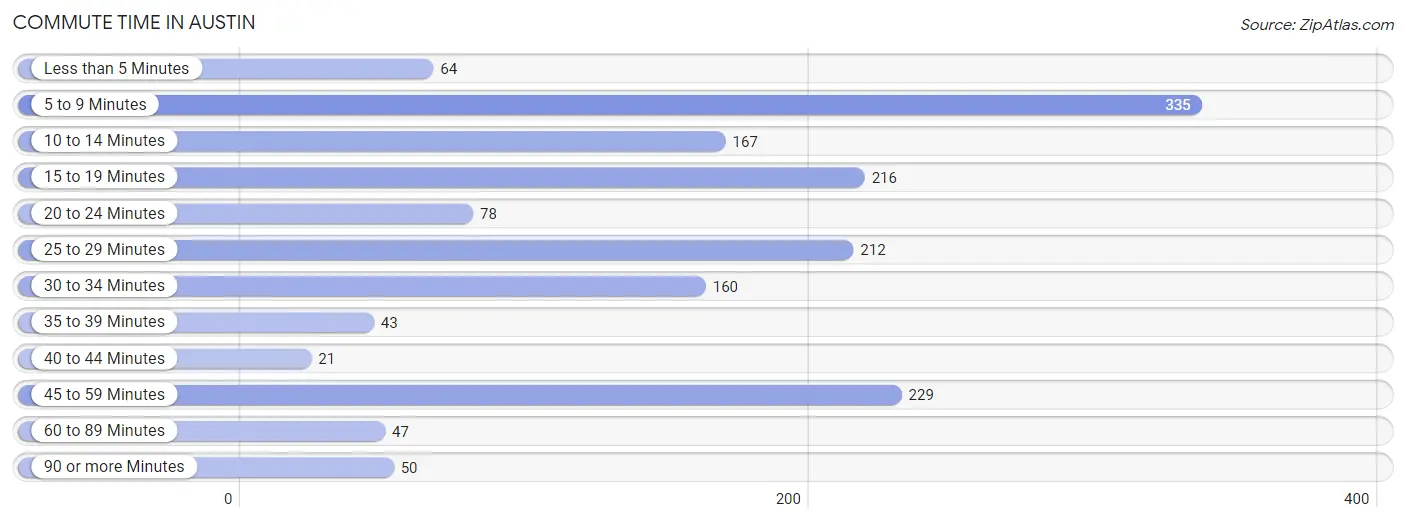
| Commute Time | # Commuters | % Commuters |
| Less than 5 Minutes | 64 | 4.0% |
| 5 to 9 Minutes | 335 | 20.6% |
| 10 to 14 Minutes | 167 | 10.3% |
| 15 to 19 Minutes | 216 | 13.3% |
| 20 to 24 Minutes | 78 | 4.8% |
| 25 to 29 Minutes | 212 | 13.1% |
| 30 to 34 Minutes | 160 | 9.9% |
| 35 to 39 Minutes | 43 | 2.6% |
| 40 to 44 Minutes | 21 | 1.3% |
| 45 to 59 Minutes | 229 | 14.1% |
| 60 to 89 Minutes | 47 | 2.9% |
| 90 or more Minutes | 50 | 3.1% |
Commute Time by Sex in Austin
The most common commute times in Austin are 5 to 9 minutes (204 commuters, 25.5%) for males and 45 to 59 minutes (133 commuters, 16.2%) for females.
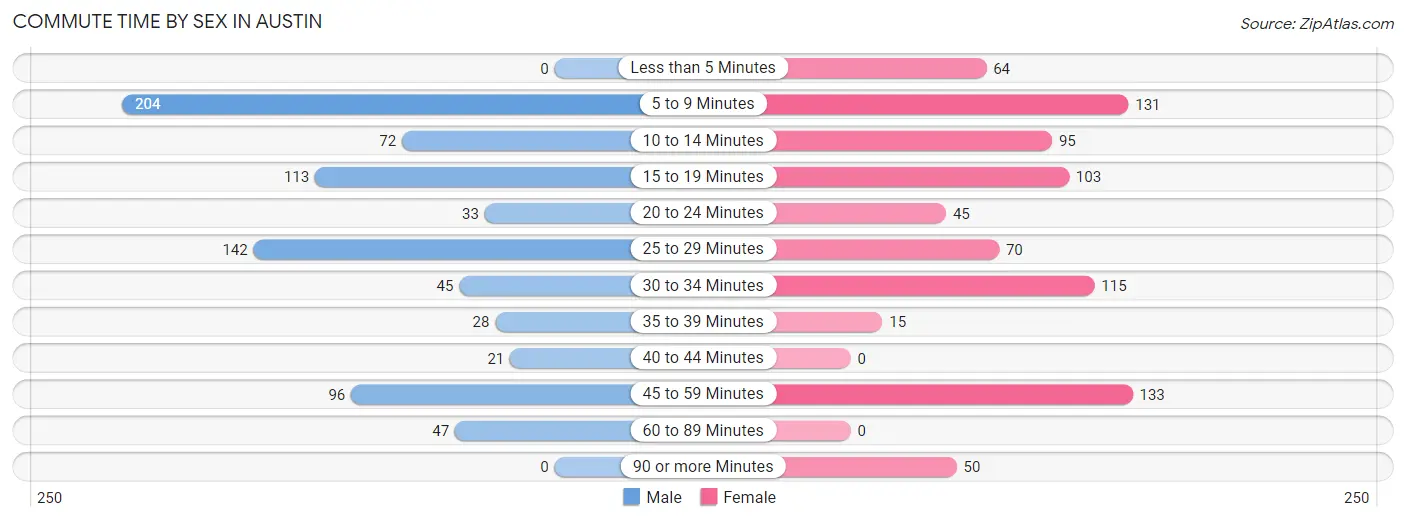
| Commute Time | Male | Female |
| Less than 5 Minutes | 0 (0.0%) | 64 (7.8%) |
| 5 to 9 Minutes | 204 (25.5%) | 131 (16.0%) |
| 10 to 14 Minutes | 72 (9.0%) | 95 (11.6%) |
| 15 to 19 Minutes | 113 (14.1%) | 103 (12.6%) |
| 20 to 24 Minutes | 33 (4.1%) | 45 (5.5%) |
| 25 to 29 Minutes | 142 (17.7%) | 70 (8.5%) |
| 30 to 34 Minutes | 45 (5.6%) | 115 (14.0%) |
| 35 to 39 Minutes | 28 (3.5%) | 15 (1.8%) |
| 40 to 44 Minutes | 21 (2.6%) | 0 (0.0%) |
| 45 to 59 Minutes | 96 (12.0%) | 133 (16.2%) |
| 60 to 89 Minutes | 47 (5.9%) | 0 (0.0%) |
| 90 or more Minutes | 0 (0.0%) | 50 (6.1%) |
Time of Departure to Work by Sex in Austin
The most frequent times of departure to work in Austin are 6:00 AM to 6:29 AM (140, 17.5%) for males and 4:00 PM to 11:59 PM (175, 21.3%) for females.
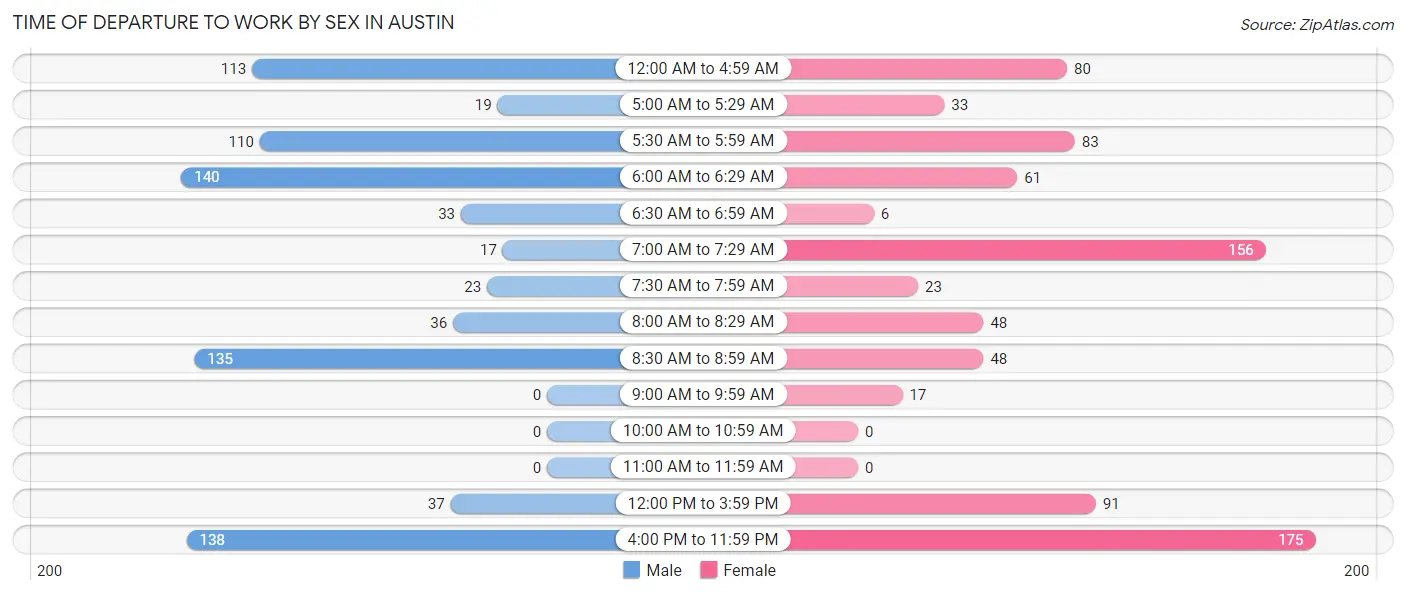
| Time of Departure | Male | Female |
| 12:00 AM to 4:59 AM | 113 (14.1%) | 80 (9.7%) |
| 5:00 AM to 5:29 AM | 19 (2.4%) | 33 (4.0%) |
| 5:30 AM to 5:59 AM | 110 (13.7%) | 83 (10.1%) |
| 6:00 AM to 6:29 AM | 140 (17.5%) | 61 (7.4%) |
| 6:30 AM to 6:59 AM | 33 (4.1%) | 6 (0.7%) |
| 7:00 AM to 7:29 AM | 17 (2.1%) | 156 (19.0%) |
| 7:30 AM to 7:59 AM | 23 (2.9%) | 23 (2.8%) |
| 8:00 AM to 8:29 AM | 36 (4.5%) | 48 (5.9%) |
| 8:30 AM to 8:59 AM | 135 (16.9%) | 48 (5.9%) |
| 9:00 AM to 9:59 AM | 0 (0.0%) | 17 (2.1%) |
| 10:00 AM to 10:59 AM | 0 (0.0%) | 0 (0.0%) |
| 11:00 AM to 11:59 AM | 0 (0.0%) | 0 (0.0%) |
| 12:00 PM to 3:59 PM | 37 (4.6%) | 91 (11.1%) |
| 4:00 PM to 11:59 PM | 138 (17.2%) | 175 (21.3%) |
| Total | 801 (100.0%) | 821 (100.0%) |
Housing Occupancy in Austin
Occupancy by Ownership in Austin
Of the total 1,651 dwellings in Austin, owner-occupied units account for 966 (58.5%), while renter-occupied units make up 685 (41.5%).
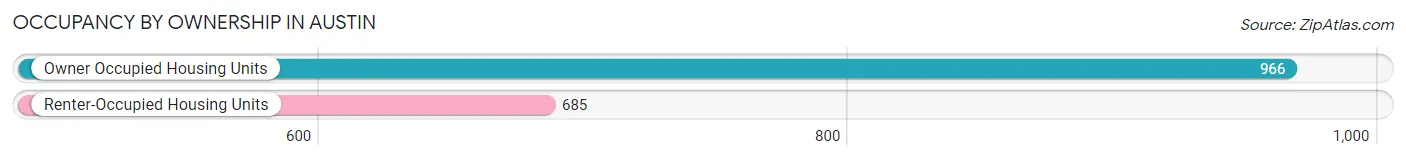
| Occupancy | # Housing Units | % Housing Units |
| Owner Occupied Housing Units | 966 | 58.5% |
| Renter-Occupied Housing Units | 685 | 41.5% |
| Total Occupied Housing Units | 1,651 | 100.0% |
Occupancy by Household Size in Austin
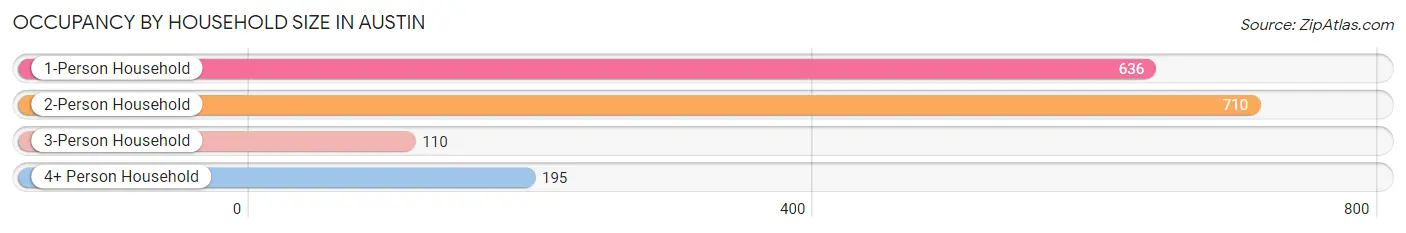
| Household Size | # Housing Units | % Housing Units |
| 1-Person Household | 636 | 38.5% |
| 2-Person Household | 710 | 43.0% |
| 3-Person Household | 110 | 6.7% |
| 4+ Person Household | 195 | 11.8% |
| Total Housing Units | 1,651 | 100.0% |
Occupancy by Ownership by Household Size in Austin
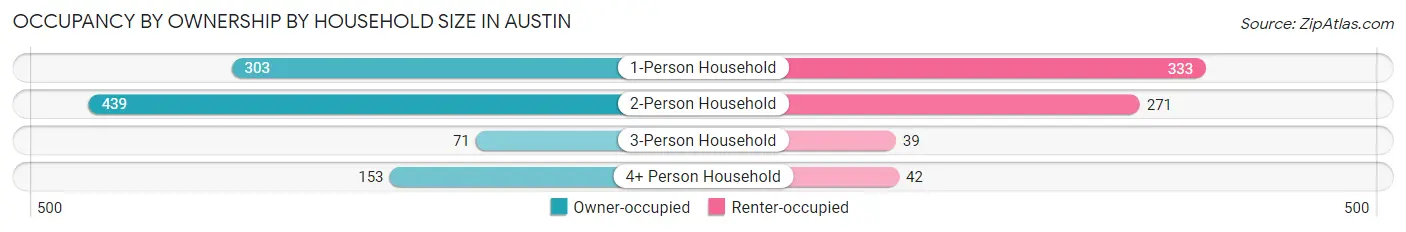
| Household Size | Owner-occupied | Renter-occupied |
| 1-Person Household | 303 (47.6%) | 333 (52.4%) |
| 2-Person Household | 439 (61.8%) | 271 (38.2%) |
| 3-Person Household | 71 (64.5%) | 39 (35.4%) |
| 4+ Person Household | 153 (78.5%) | 42 (21.5%) |
| Total Housing Units | 966 (58.5%) | 685 (41.5%) |
Occupancy by Educational Attainment in Austin
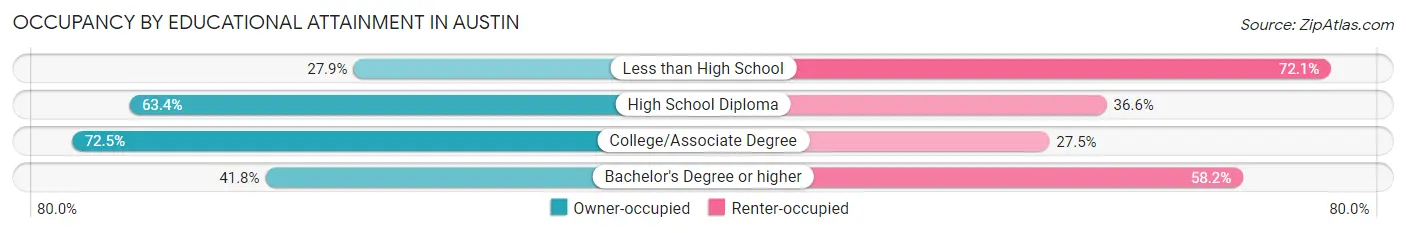
| Household Size | Owner-occupied | Renter-occupied |
| Less than High School | 56 (27.9%) | 145 (72.1%) |
| High School Diploma | 491 (63.4%) | 283 (36.6%) |
| College/Associate Degree | 322 (72.5%) | 122 (27.5%) |
| Bachelor's Degree or higher | 97 (41.8%) | 135 (58.2%) |
Occupancy by Age of Householder in Austin
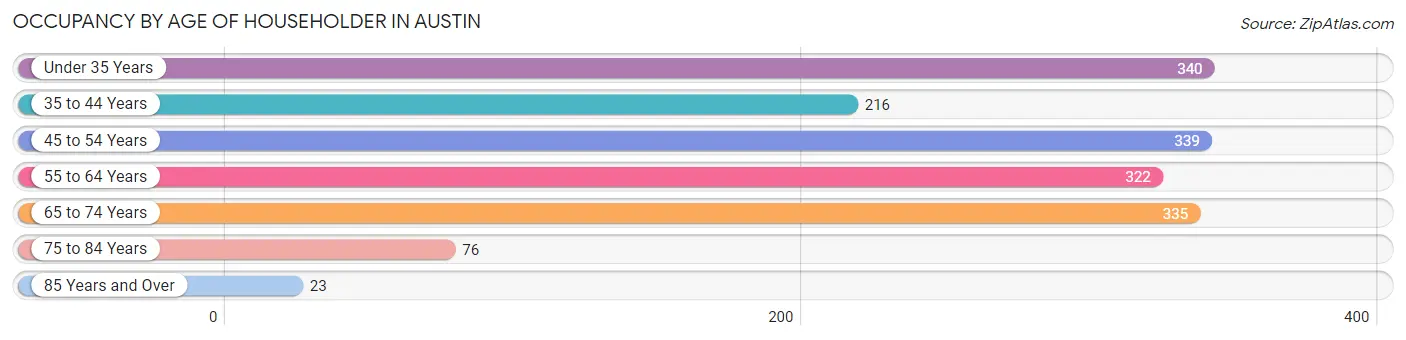
| Age Bracket | # Households | % Households |
| Under 35 Years | 340 | 20.6% |
| 35 to 44 Years | 216 | 13.1% |
| 45 to 54 Years | 339 | 20.5% |
| 55 to 64 Years | 322 | 19.5% |
| 65 to 74 Years | 335 | 20.3% |
| 75 to 84 Years | 76 | 4.6% |
| 85 Years and Over | 23 | 1.4% |
| Total | 1,651 | 100.0% |
Housing Finances in Austin
Median Income by Occupancy in Austin
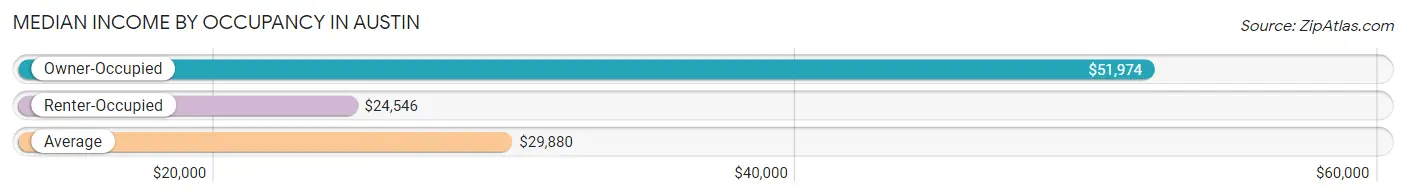
| Occupancy Type | # Households | Median Income |
| Owner-Occupied | 966 (58.5%) | $51,974 |
| Renter-Occupied | 685 (41.5%) | $24,546 |
| Average | 1,651 (100.0%) | $29,880 |
Occupancy by Householder Income Bracket in Austin
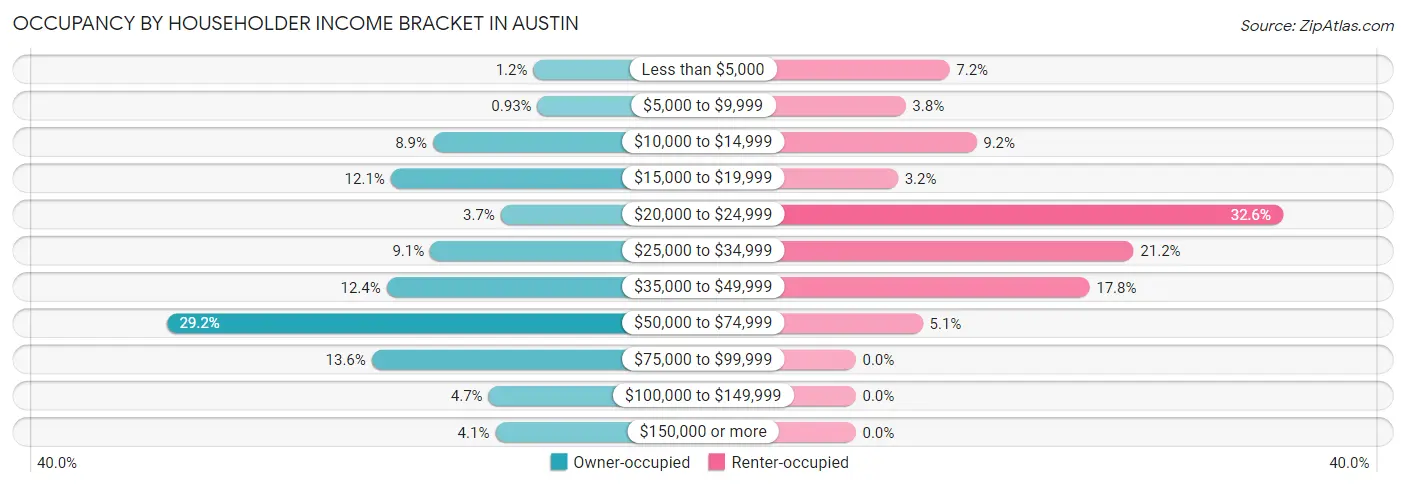
| Income Bracket | Owner-occupied | Renter-occupied |
| Less than $5,000 | 12 (1.2%) | 49 (7.1%) |
| $5,000 to $9,999 | 9 (0.9%) | 26 (3.8%) |
| $10,000 to $14,999 | 86 (8.9%) | 63 (9.2%) |
| $15,000 to $19,999 | 117 (12.1%) | 22 (3.2%) |
| $20,000 to $24,999 | 36 (3.7%) | 223 (32.6%) |
| $25,000 to $34,999 | 88 (9.1%) | 145 (21.2%) |
| $35,000 to $49,999 | 120 (12.4%) | 122 (17.8%) |
| $50,000 to $74,999 | 282 (29.2%) | 35 (5.1%) |
| $75,000 to $99,999 | 131 (13.6%) | 0 (0.0%) |
| $100,000 to $149,999 | 45 (4.7%) | 0 (0.0%) |
| $150,000 or more | 40 (4.1%) | 0 (0.0%) |
| Total | 966 (100.0%) | 685 (100.0%) |
Monthly Housing Cost Tiers in Austin
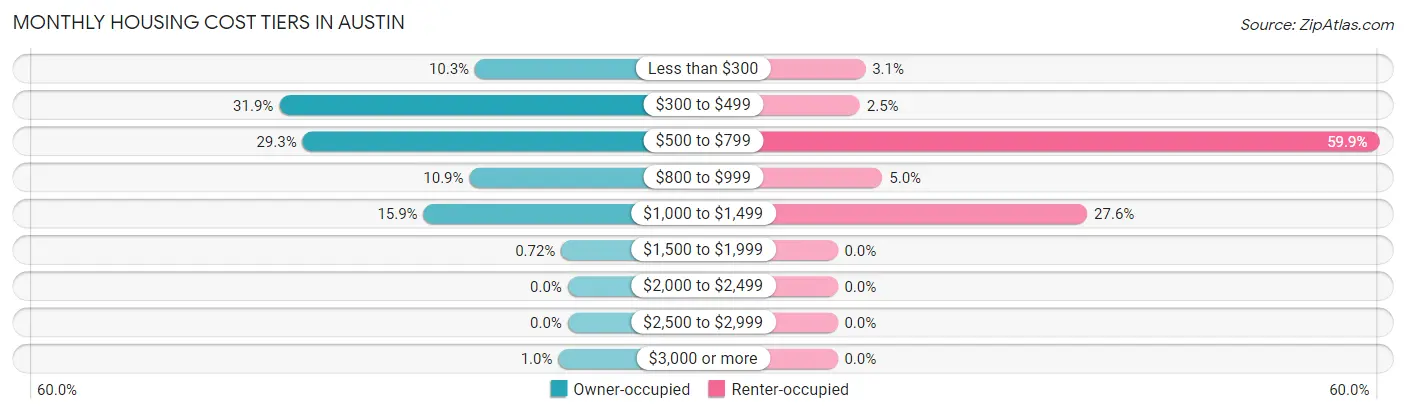
| Monthly Cost | Owner-occupied | Renter-occupied |
| Less than $300 | 99 (10.2%) | 21 (3.1%) |
| $300 to $499 | 308 (31.9%) | 17 (2.5%) |
| $500 to $799 | 283 (29.3%) | 410 (59.9%) |
| $800 to $999 | 105 (10.9%) | 34 (5.0%) |
| $1,000 to $1,499 | 154 (15.9%) | 189 (27.6%) |
| $1,500 to $1,999 | 7 (0.7%) | 0 (0.0%) |
| $2,000 to $2,499 | 0 (0.0%) | 0 (0.0%) |
| $2,500 to $2,999 | 0 (0.0%) | 0 (0.0%) |
| $3,000 or more | 10 (1.0%) | 0 (0.0%) |
| Total | 966 (100.0%) | 685 (100.0%) |
Physical Housing Characteristics in Austin
Housing Structures in Austin
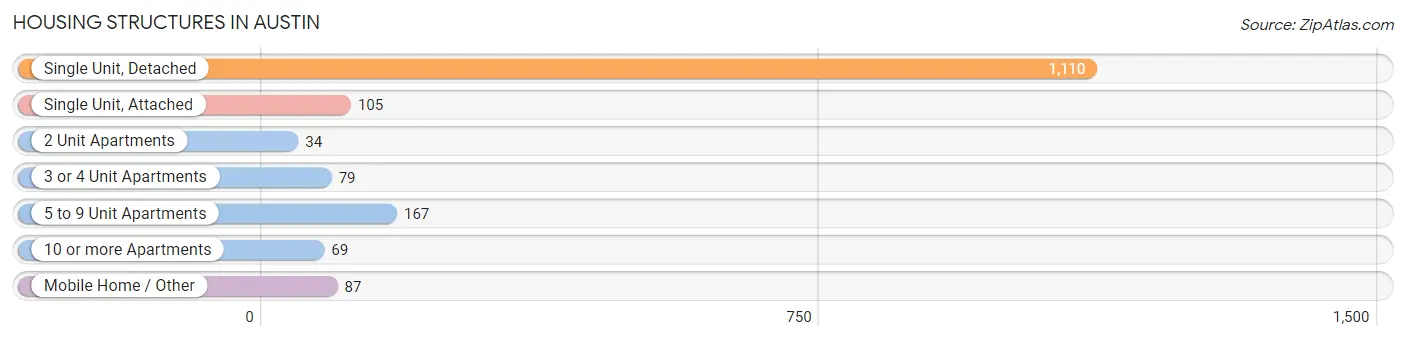
| Structure Type | # Housing Units | % Housing Units |
| Single Unit, Detached | 1,110 | 67.2% |
| Single Unit, Attached | 105 | 6.4% |
| 2 Unit Apartments | 34 | 2.1% |
| 3 or 4 Unit Apartments | 79 | 4.8% |
| 5 to 9 Unit Apartments | 167 | 10.1% |
| 10 or more Apartments | 69 | 4.2% |
| Mobile Home / Other | 87 | 5.3% |
| Total | 1,651 | 100.0% |
Housing Structures by Occupancy in Austin
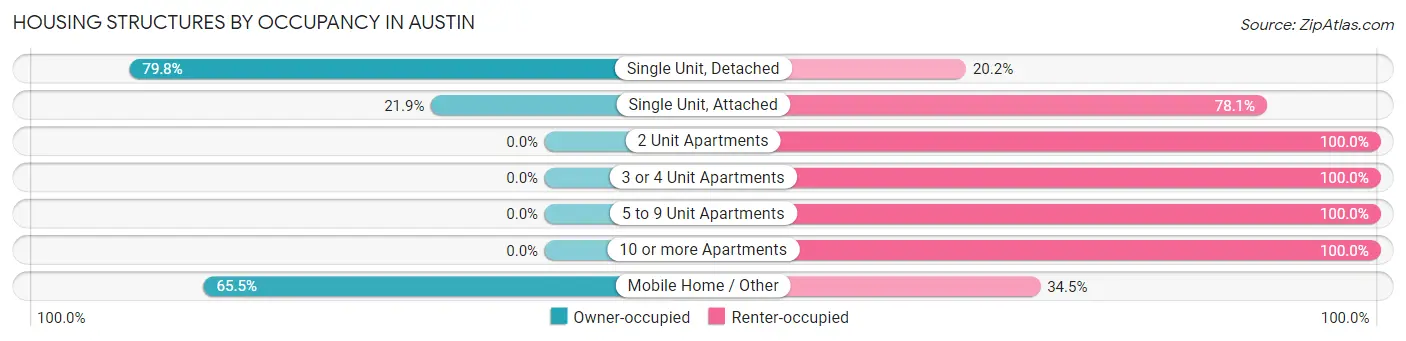
| Structure Type | Owner-occupied | Renter-occupied |
| Single Unit, Detached | 886 (79.8%) | 224 (20.2%) |
| Single Unit, Attached | 23 (21.9%) | 82 (78.1%) |
| 2 Unit Apartments | 0 (0.0%) | 34 (100.0%) |
| 3 or 4 Unit Apartments | 0 (0.0%) | 79 (100.0%) |
| 5 to 9 Unit Apartments | 0 (0.0%) | 167 (100.0%) |
| 10 or more Apartments | 0 (0.0%) | 69 (100.0%) |
| Mobile Home / Other | 57 (65.5%) | 30 (34.5%) |
| Total | 966 (58.5%) | 685 (41.5%) |
Housing Structures by Number of Rooms in Austin
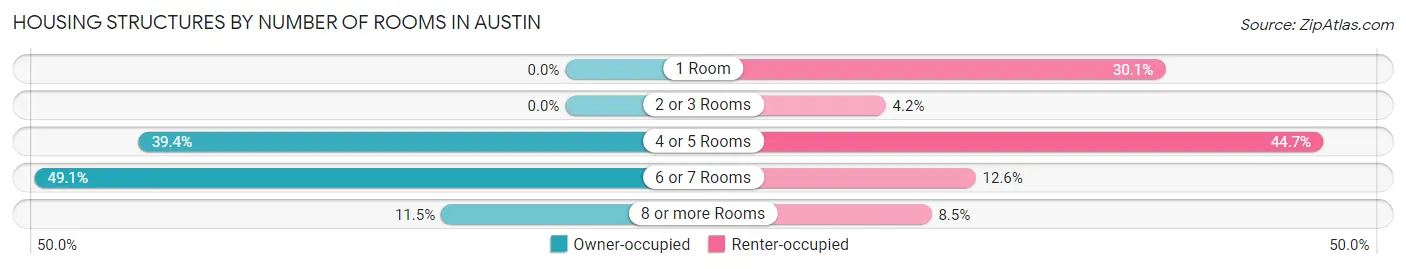
| Number of Rooms | Owner-occupied | Renter-occupied |
| 1 Room | 0 (0.0%) | 206 (30.1%) |
| 2 or 3 Rooms | 0 (0.0%) | 29 (4.2%) |
| 4 or 5 Rooms | 381 (39.4%) | 306 (44.7%) |
| 6 or 7 Rooms | 474 (49.1%) | 86 (12.6%) |
| 8 or more Rooms | 111 (11.5%) | 58 (8.5%) |
| Total | 966 (100.0%) | 685 (100.0%) |
Housing Structure by Heating Type in Austin
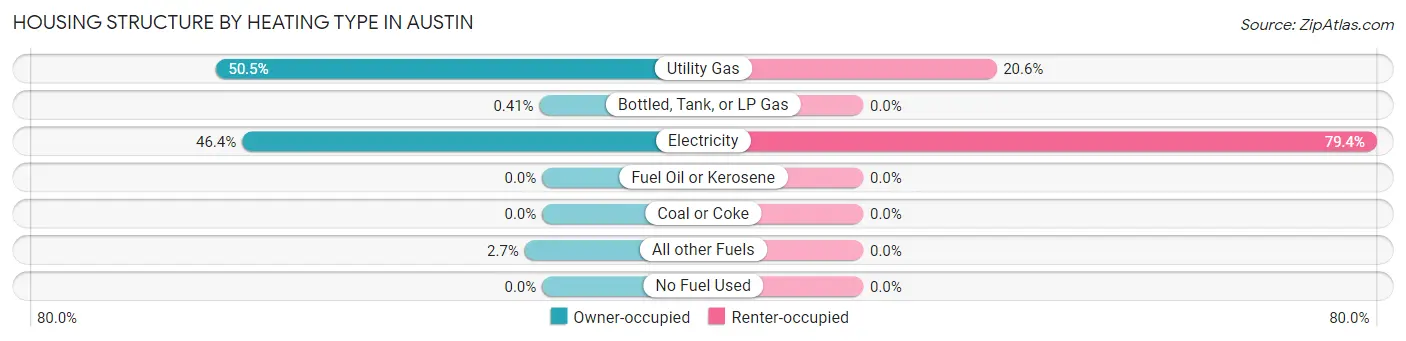
| Heating Type | Owner-occupied | Renter-occupied |
| Utility Gas | 488 (50.5%) | 141 (20.6%) |
| Bottled, Tank, or LP Gas | 4 (0.4%) | 0 (0.0%) |
| Electricity | 448 (46.4%) | 544 (79.4%) |
| Fuel Oil or Kerosene | 0 (0.0%) | 0 (0.0%) |
| Coal or Coke | 0 (0.0%) | 0 (0.0%) |
| All other Fuels | 26 (2.7%) | 0 (0.0%) |
| No Fuel Used | 0 (0.0%) | 0 (0.0%) |
| Total | 966 (100.0%) | 685 (100.0%) |
Household Vehicle Usage in Austin
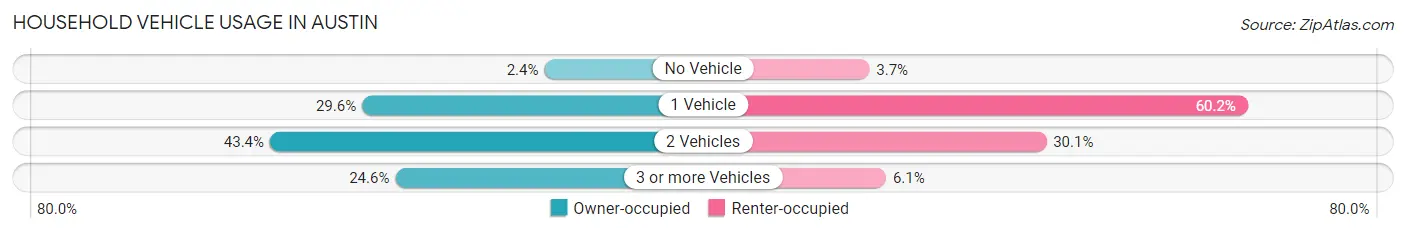
| Vehicles per Household | Owner-occupied | Renter-occupied |
| No Vehicle | 23 (2.4%) | 25 (3.6%) |
| 1 Vehicle | 286 (29.6%) | 412 (60.2%) |
| 2 Vehicles | 419 (43.4%) | 206 (30.1%) |
| 3 or more Vehicles | 238 (24.6%) | 42 (6.1%) |
| Total | 966 (100.0%) | 685 (100.0%) |
Real Estate & Mortgages in Austin
Real Estate and Mortgage Overview in Austin
| Characteristic | Without Mortgage | With Mortgage |
| Housing Units | 437 | 529 |
| Median Property Value | $74,300 | $99,100 |
| Median Household Income | $49,523 | $40 |
| Monthly Housing Costs | $349 | $10 |
| Real Estate Taxes | $428 | $16 |
Property Value by Mortgage Status in Austin
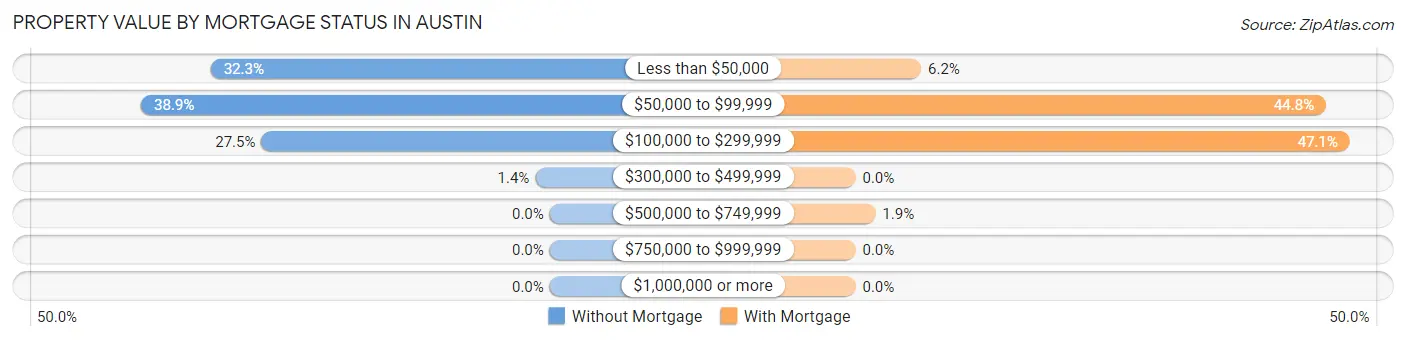
| Property Value | Without Mortgage | With Mortgage |
| Less than $50,000 | 141 (32.3%) | 33 (6.2%) |
| $50,000 to $99,999 | 170 (38.9%) | 237 (44.8%) |
| $100,000 to $299,999 | 120 (27.5%) | 249 (47.1%) |
| $300,000 to $499,999 | 6 (1.4%) | 0 (0.0%) |
| $500,000 to $749,999 | 0 (0.0%) | 10 (1.9%) |
| $750,000 to $999,999 | 0 (0.0%) | 0 (0.0%) |
| $1,000,000 or more | 0 (0.0%) | 0 (0.0%) |
| Total | 437 (100.0%) | 529 (100.0%) |
Household Income by Mortgage Status in Austin
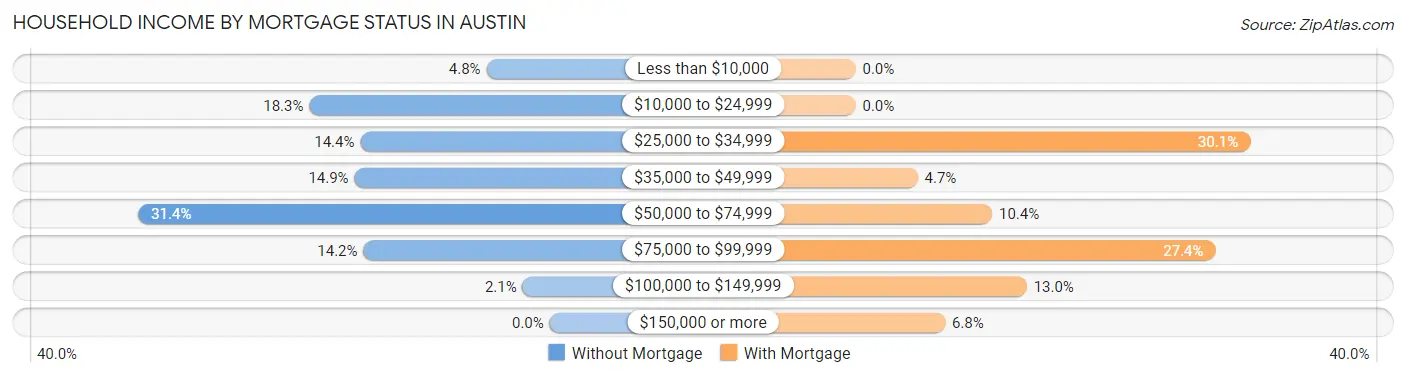
| Household Income | Without Mortgage | With Mortgage |
| Less than $10,000 | 21 (4.8%) | 0 (0.0%) |
| $10,000 to $24,999 | 80 (18.3%) | 0 (0.0%) |
| $25,000 to $34,999 | 63 (14.4%) | 159 (30.1%) |
| $35,000 to $49,999 | 65 (14.9%) | 25 (4.7%) |
| $50,000 to $74,999 | 137 (31.4%) | 55 (10.4%) |
| $75,000 to $99,999 | 62 (14.2%) | 145 (27.4%) |
| $100,000 to $149,999 | 9 (2.1%) | 69 (13.0%) |
| $150,000 or more | 0 (0.0%) | 36 (6.8%) |
| Total | 437 (100.0%) | 529 (100.0%) |
Property Value to Household Income Ratio in Austin
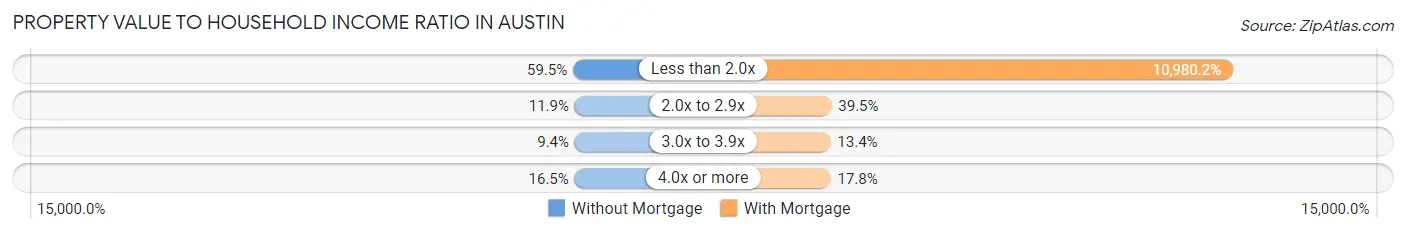
| Value-to-Income Ratio | Without Mortgage | With Mortgage |
| Less than 2.0x | 260 (59.5%) | 58,085 (10,980.2%) |
| 2.0x to 2.9x | 52 (11.9%) | 209 (39.5%) |
| 3.0x to 3.9x | 41 (9.4%) | 71 (13.4%) |
| 4.0x or more | 72 (16.5%) | 94 (17.8%) |
| Total | 437 (100.0%) | 529 (100.0%) |
Real Estate Taxes by Mortgage Status in Austin
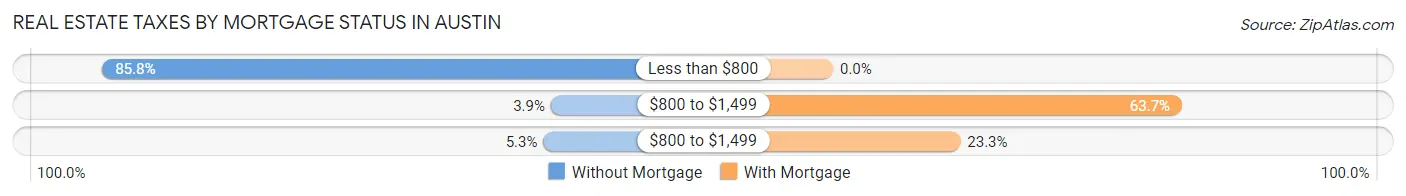
| Property Taxes | Without Mortgage | With Mortgage |
| Less than $800 | 375 (85.8%) | 0 (0.0%) |
| $800 to $1,499 | 17 (3.9%) | 337 (63.7%) |
| $800 to $1,499 | 23 (5.3%) | 123 (23.3%) |
| Total | 437 (100.0%) | 529 (100.0%) |
Health & Disability in Austin
Health Insurance Coverage by Age in Austin
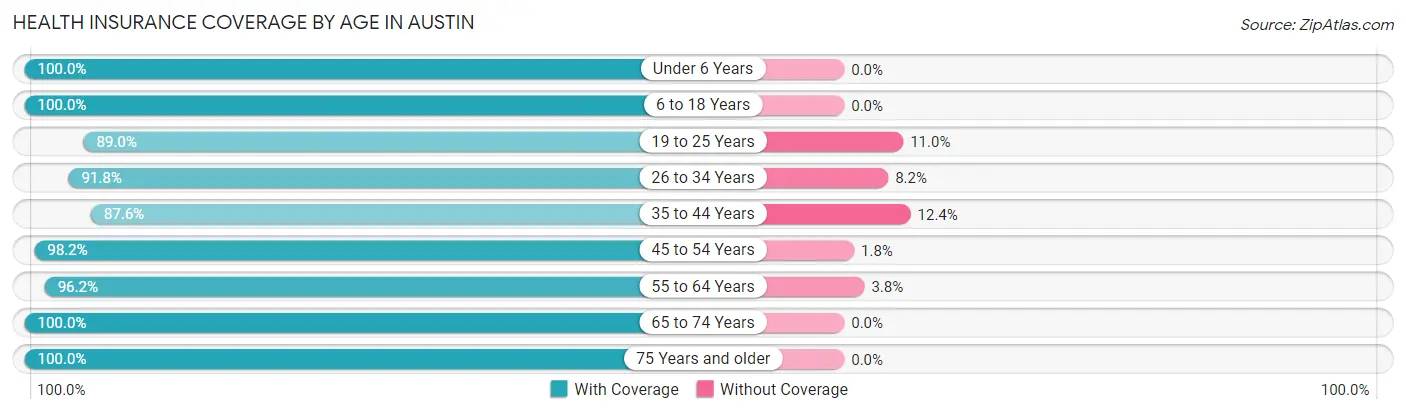
| Age Bracket | With Coverage | Without Coverage |
| Under 6 Years | 272 (100.0%) | 0 (0.0%) |
| 6 to 18 Years | 438 (100.0%) | 0 (0.0%) |
| 19 to 25 Years | 332 (89.0%) | 41 (11.0%) |
| 26 to 34 Years | 426 (91.8%) | 38 (8.2%) |
| 35 to 44 Years | 347 (87.6%) | 49 (12.4%) |
| 45 to 54 Years | 483 (98.2%) | 9 (1.8%) |
| 55 to 64 Years | 486 (96.2%) | 19 (3.8%) |
| 65 to 74 Years | 477 (100.0%) | 0 (0.0%) |
| 75 Years and older | 179 (100.0%) | 0 (0.0%) |
| Total | 3,440 (95.7%) | 156 (4.3%) |
Health Insurance Coverage by Citizenship Status in Austin
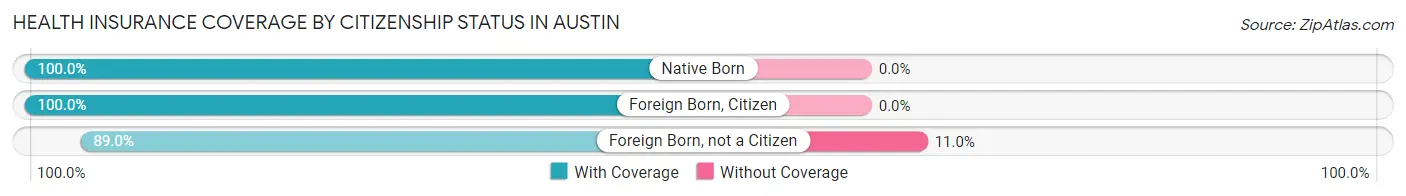
| Citizenship Status | With Coverage | Without Coverage |
| Native Born | 272 (100.0%) | 0 (0.0%) |
| Foreign Born, Citizen | 438 (100.0%) | 0 (0.0%) |
| Foreign Born, not a Citizen | 332 (89.0%) | 41 (11.0%) |
Health Insurance Coverage by Household Income in Austin
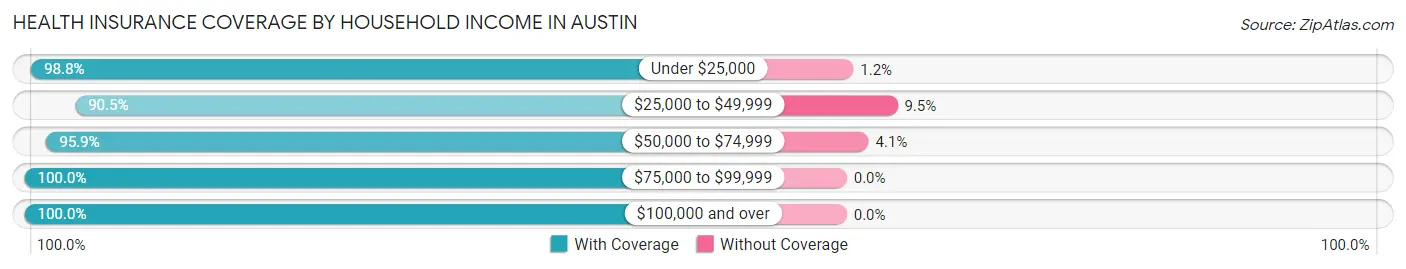
| Household Income | With Coverage | Without Coverage |
| Under $25,000 | 801 (98.8%) | 10 (1.2%) |
| $25,000 to $49,999 | 954 (90.5%) | 100 (9.5%) |
| $50,000 to $74,999 | 1,082 (95.9%) | 46 (4.1%) |
| $75,000 to $99,999 | 358 (100.0%) | 0 (0.0%) |
| $100,000 and over | 242 (100.0%) | 0 (0.0%) |
Public vs Private Health Insurance Coverage by Age in Austin
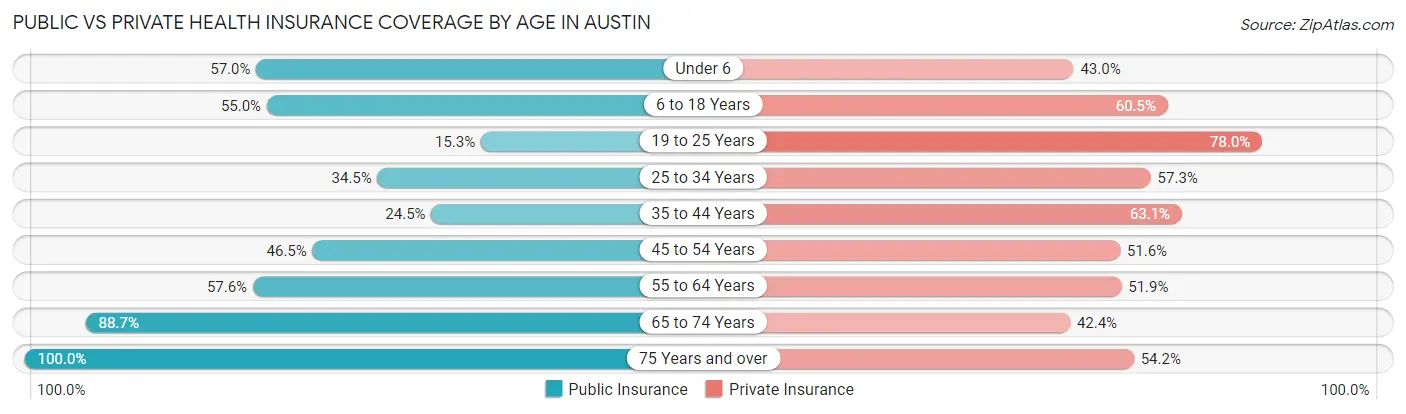
| Age Bracket | Public Insurance | Private Insurance |
| Under 6 | 155 (57.0%) | 117 (43.0%) |
| 6 to 18 Years | 241 (55.0%) | 265 (60.5%) |
| 19 to 25 Years | 57 (15.3%) | 291 (78.0%) |
| 25 to 34 Years | 160 (34.5%) | 266 (57.3%) |
| 35 to 44 Years | 97 (24.5%) | 250 (63.1%) |
| 45 to 54 Years | 229 (46.5%) | 254 (51.6%) |
| 55 to 64 Years | 291 (57.6%) | 262 (51.9%) |
| 65 to 74 Years | 423 (88.7%) | 202 (42.3%) |
| 75 Years and over | 179 (100.0%) | 97 (54.2%) |
| Total | 1,832 (50.9%) | 2,004 (55.7%) |
Disability Status by Sex by Age in Austin
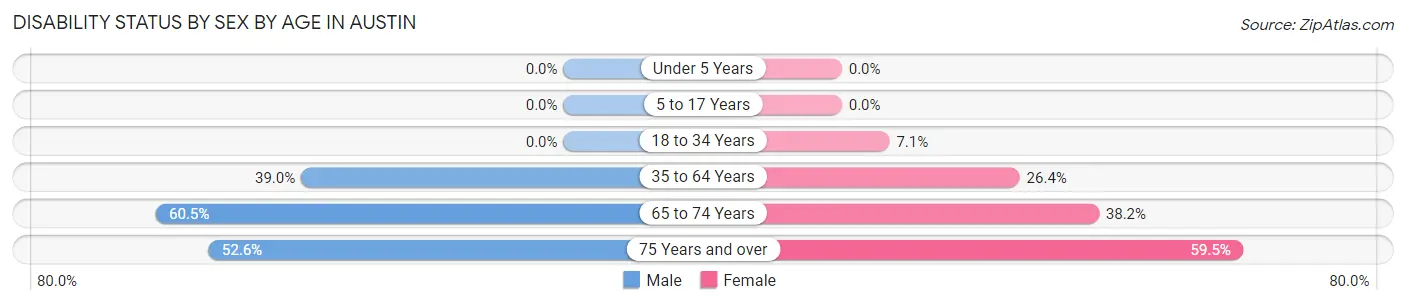
| Age Bracket | Male | Female |
| Under 5 Years | 0 (0.0%) | 0 (0.0%) |
| 5 to 17 Years | 0 (0.0%) | 0 (0.0%) |
| 18 to 34 Years | 0 (0.0%) | 40 (7.1%) |
| 35 to 64 Years | 252 (39.0%) | 197 (26.4%) |
| 65 to 74 Years | 130 (60.5%) | 100 (38.2%) |
| 75 Years and over | 50 (52.6%) | 50 (59.5%) |
Disability Class by Sex by Age in Austin
Disability Class: Hearing Difficulty
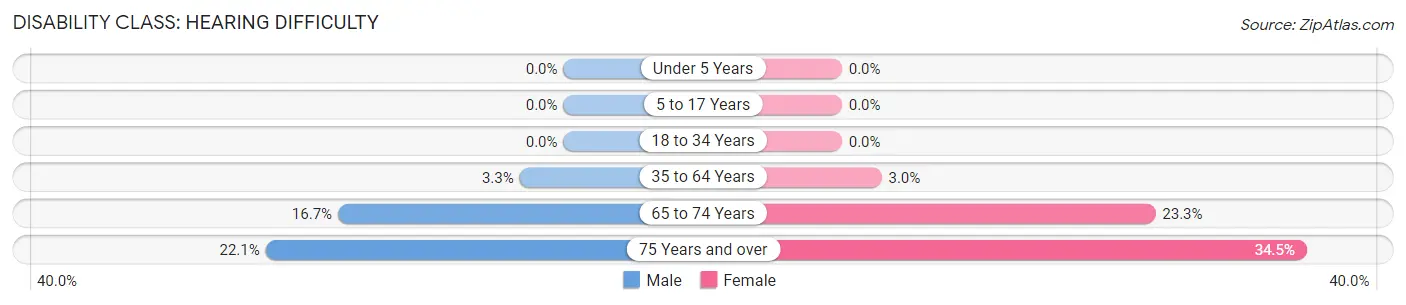
| Age Bracket | Male | Female |
| Under 5 Years | 0 (0.0%) | 0 (0.0%) |
| 5 to 17 Years | 0 (0.0%) | 0 (0.0%) |
| 18 to 34 Years | 0 (0.0%) | 0 (0.0%) |
| 35 to 64 Years | 21 (3.3%) | 22 (2.9%) |
| 65 to 74 Years | 36 (16.7%) | 61 (23.3%) |
| 75 Years and over | 21 (22.1%) | 29 (34.5%) |
Disability Class: Vision Difficulty
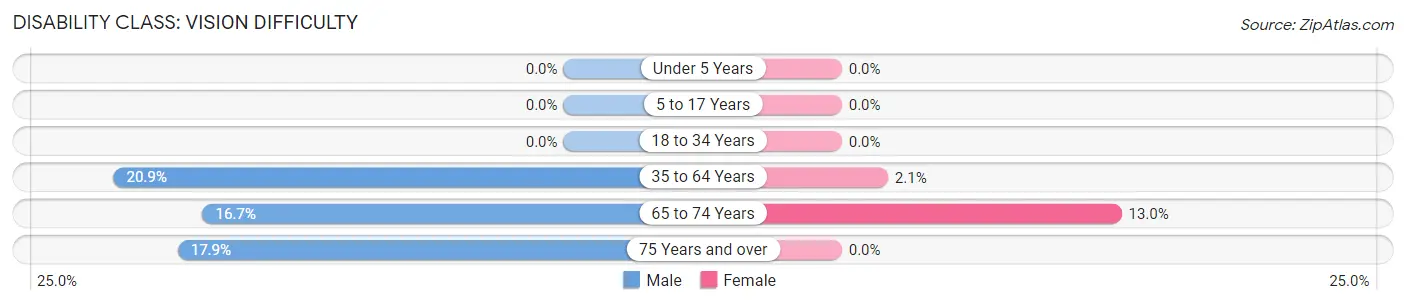
| Age Bracket | Male | Female |
| Under 5 Years | 0 (0.0%) | 0 (0.0%) |
| 5 to 17 Years | 0 (0.0%) | 0 (0.0%) |
| 18 to 34 Years | 0 (0.0%) | 0 (0.0%) |
| 35 to 64 Years | 135 (20.9%) | 16 (2.1%) |
| 65 to 74 Years | 36 (16.7%) | 34 (13.0%) |
| 75 Years and over | 17 (17.9%) | 0 (0.0%) |
Disability Class: Cognitive Difficulty
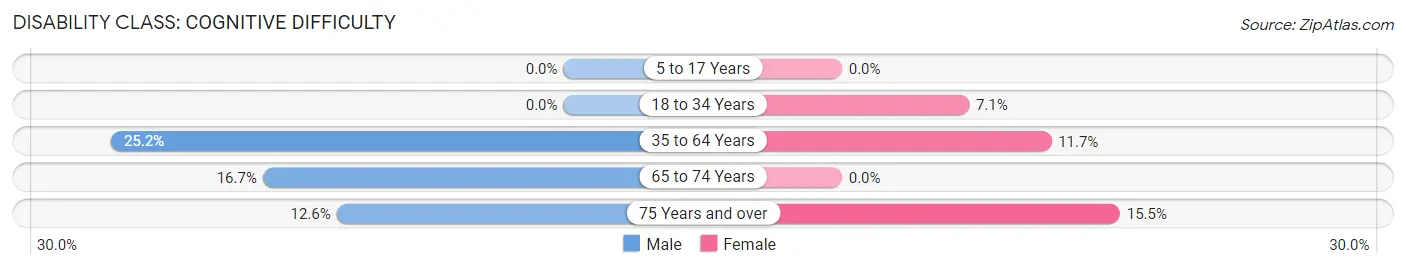
| Age Bracket | Male | Female |
| 5 to 17 Years | 0 (0.0%) | 0 (0.0%) |
| 18 to 34 Years | 0 (0.0%) | 40 (7.1%) |
| 35 to 64 Years | 163 (25.2%) | 87 (11.7%) |
| 65 to 74 Years | 36 (16.7%) | 0 (0.0%) |
| 75 Years and over | 12 (12.6%) | 13 (15.5%) |
Disability Class: Ambulatory Difficulty
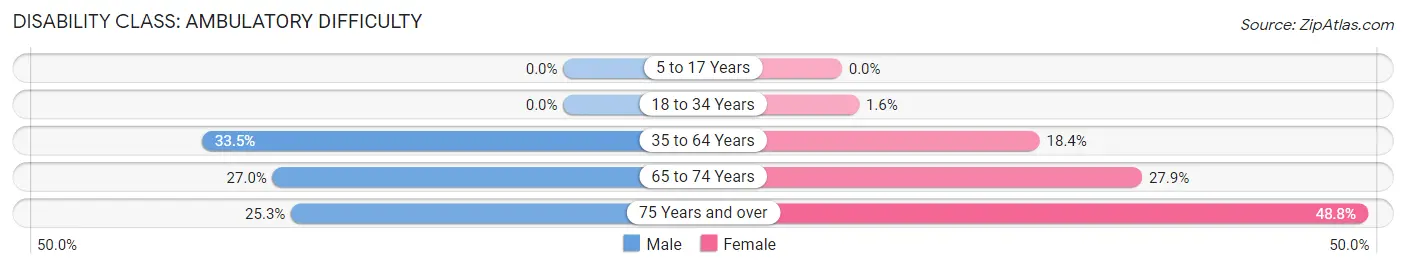
| Age Bracket | Male | Female |
| 5 to 17 Years | 0 (0.0%) | 0 (0.0%) |
| 18 to 34 Years | 0 (0.0%) | 9 (1.6%) |
| 35 to 64 Years | 217 (33.5%) | 137 (18.4%) |
| 65 to 74 Years | 58 (27.0%) | 73 (27.9%) |
| 75 Years and over | 24 (25.3%) | 41 (48.8%) |
Disability Class: Self-Care Difficulty
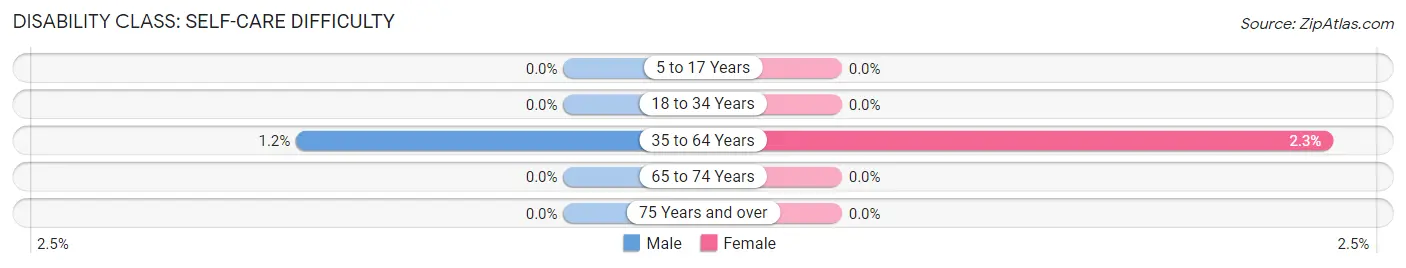
| Age Bracket | Male | Female |
| 5 to 17 Years | 0 (0.0%) | 0 (0.0%) |
| 18 to 34 Years | 0 (0.0%) | 0 (0.0%) |
| 35 to 64 Years | 8 (1.2%) | 17 (2.3%) |
| 65 to 74 Years | 0 (0.0%) | 0 (0.0%) |
| 75 Years and over | 0 (0.0%) | 0 (0.0%) |
Technology Access in Austin
Computing Device Access in Austin
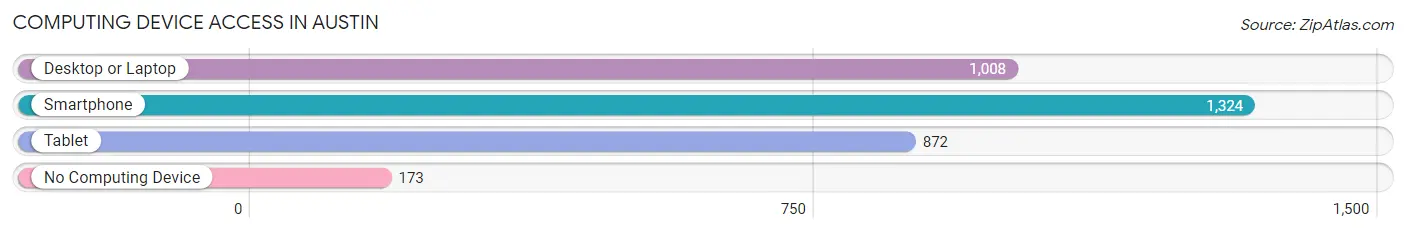
| Device Type | # Households | % Households |
| Desktop or Laptop | 1,008 | 61.1% |
| Smartphone | 1,324 | 80.2% |
| Tablet | 872 | 52.8% |
| No Computing Device | 173 | 10.5% |
| Total | 1,651 | 100.0% |
Internet Access in Austin
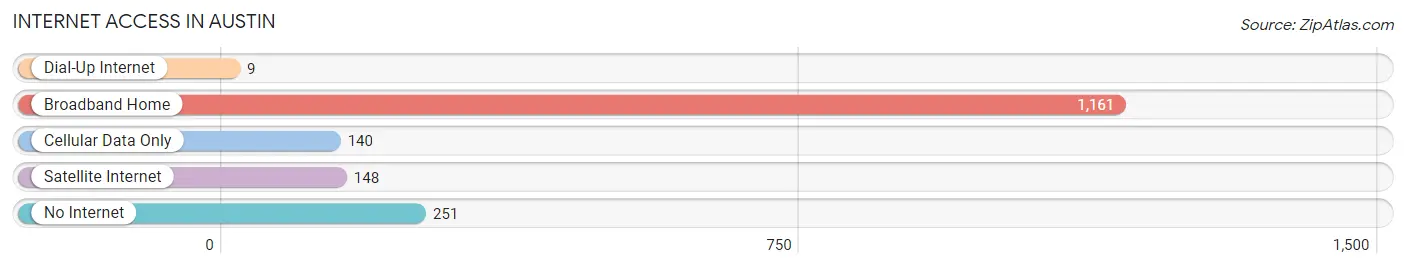
| Internet Type | # Households | % Households |
| Dial-Up Internet | 9 | 0.5% |
| Broadband Home | 1,161 | 70.3% |
| Cellular Data Only | 140 | 8.5% |
| Satellite Internet | 148 | 9.0% |
| No Internet | 251 | 15.2% |
| Total | 1,651 | 100.0% |
Austin Summary
Austin, Indiana is a small city located in Scott County, Indiana. It is situated on the banks of the Ohio River, approximately 30 miles north of Louisville, Kentucky. The city has a population of approximately 4,200 people and is the county seat of Scott County.
History
The area that is now Austin was first settled in the early 1800s by a group of settlers from North Carolina. The town was originally known as “Hogtown” due to the large number of hogs that were raised in the area. In 1817, the town was renamed Austin in honor of Stephen F. Austin, the “Father of Texas.”
In 1820, Austin was officially incorporated as a town. The town quickly grew and by the mid-1800s, it had become a major trading center for the surrounding area. The town was also home to a number of businesses, including a flour mill, a sawmill, a gristmill, and a distillery.
In the late 1800s, Austin experienced a period of economic decline due to the decline of the Ohio River as a major transportation route. However, the town was able to rebound in the early 1900s with the construction of the Louisville and Nashville Railroad. This allowed the town to become a major shipping center for the surrounding area.
Geography
Austin is located in the southwestern corner of Scott County, Indiana. It is situated on the banks of the Ohio River, approximately 30 miles north of Louisville, Kentucky. The city has a total area of 1.7 square miles, all of which is land.
The terrain of Austin is mostly flat, with some rolling hills in the surrounding area. The climate is humid subtropical, with hot, humid summers and mild winters. The average annual temperature is around 57 degrees Fahrenheit.
Economy
The economy of Austin is largely based on manufacturing and agriculture. The city is home to a number of manufacturing plants, including a steel mill, a paper mill, and a plastics plant. The city is also home to a number of agricultural businesses, including a dairy farm, a hog farm, and a poultry farm.
The city is also home to a number of retail businesses, including a grocery store, a hardware store, and a number of restaurants. The city is also home to a number of service businesses, including a bank, a post office, and a number of medical offices.
Demographics
As of the 2010 census, the population of Austin was 4,200 people. The racial makeup of the city was 97.2% White, 0.7% African American, 0.2% Native American, 0.2% Asian, 0.1% Pacific Islander, 0.7% from other races, and 0.9% from two or more races. Hispanic or Latino of any race were 1.7% of the population.
The median household income in Austin was $37,917, and the median family income was $45,938. The per capita income for the city was $18,945. About 11.2% of families and 14.2% of the population were below the poverty line, including 19.2% of those under age 18 and 8.2% of those age 65 or over.
Common Questions
What is Per Capita Income in Austin?
Per Capita income in Austin is $20,683.
What is the Median Family Income in Austin?
Median Family Income in Austin is $50,000.
What is the Median Household income in Austin?
Median Household Income in Austin is $29,880.
What is Income or Wage Gap in Austin?
Income or Wage Gap in Austin is 32.1%.
Women in Austin earn 67.9 cents for every dollar earned by a man.
What is Inequality or Gini Index in Austin?
Inequality or Gini Index in Austin is 0.40.
What is the Total Population of Austin?
Total Population of Austin is 3,596.
What is the Total Male Population of Austin?
Total Male Population of Austin is 1,692.
What is the Total Female Population of Austin?
Total Female Population of Austin is 1,904.
What is the Ratio of Males per 100 Females in Austin?
There are 88.87 Males per 100 Females in Austin.
What is the Ratio of Females per 100 Males in Austin?
There are 112.53 Females per 100 Males in Austin.
What is the Median Population Age in Austin?
Median Population Age in Austin is 43.1 Years.
What is the Average Family Size in Austin
Average Family Size in Austin is 2.8 People.
What is the Average Household Size in Austin
Average Household Size in Austin is 2.2 People.
How Large is the Labor Force in Austin?
There are 1,772 People in the Labor Forcein in Austin.
What is the Percentage of People in the Labor Force in Austin?
60.2% of People are in the Labor Force in Austin.
What is the Unemployment Rate in Austin?
Unemployment Rate in Austin is 3.8%.