Americus, IN Map & Demographics
Americus Map
Americus Overview
$73,156
PER CAPITA INCOME
$121,250
AVG FAMILY INCOME
$135,147
AVG HOUSEHOLD INCOME
0.33
INEQUALITY / GINI INDEX
286
TOTAL POPULATION
154
MALE POPULATION
132
FEMALE POPULATION
116.67
MALES / 100 FEMALES
85.71
FEMALES / 100 MALES
49.9
MEDIAN AGE
2.9
AVG FAMILY SIZE
1.7
AVG HOUSEHOLD SIZE
179
LABOR FORCE [ PEOPLE ]
73.1%
PERCENT IN LABOR FORCE
Income in Americus
Income Overview in Americus
Per Capita Income in Americus is $73,156, while median incomes of families and households are $121,250 and $135,147 respectively.
| Characteristic | Number | Measure |
| Per Capita Income | 286 | $73,156 |
| Median Family Income | 62 | $121,250 |
| Mean Family Income | 62 | $97,819 |
| Median Household Income | 168 | $135,147 |
| Mean Household Income | 168 | $120,048 |
| Income Deficit | 62 | $0 |
| Wage / Income Gap (%) | 286 | 0.00% |
| Wage / Income Gap ($) | 286 | 100.00¢ per $1 |
| Gini / Inequality Index | 286 | 0.33 |
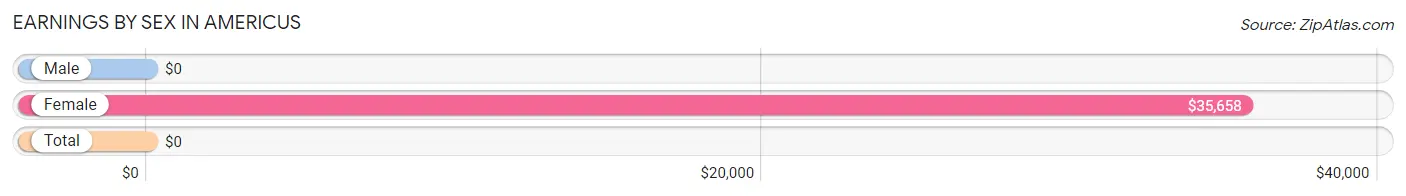
Earnings by Sex in Americus
| Sex | Number | Average Earnings |
| Male | 117 (65.4%) | $0 |
| Female | 62 (34.6%) | $35,658 |
| Total | 179 (100.0%) | $0 |
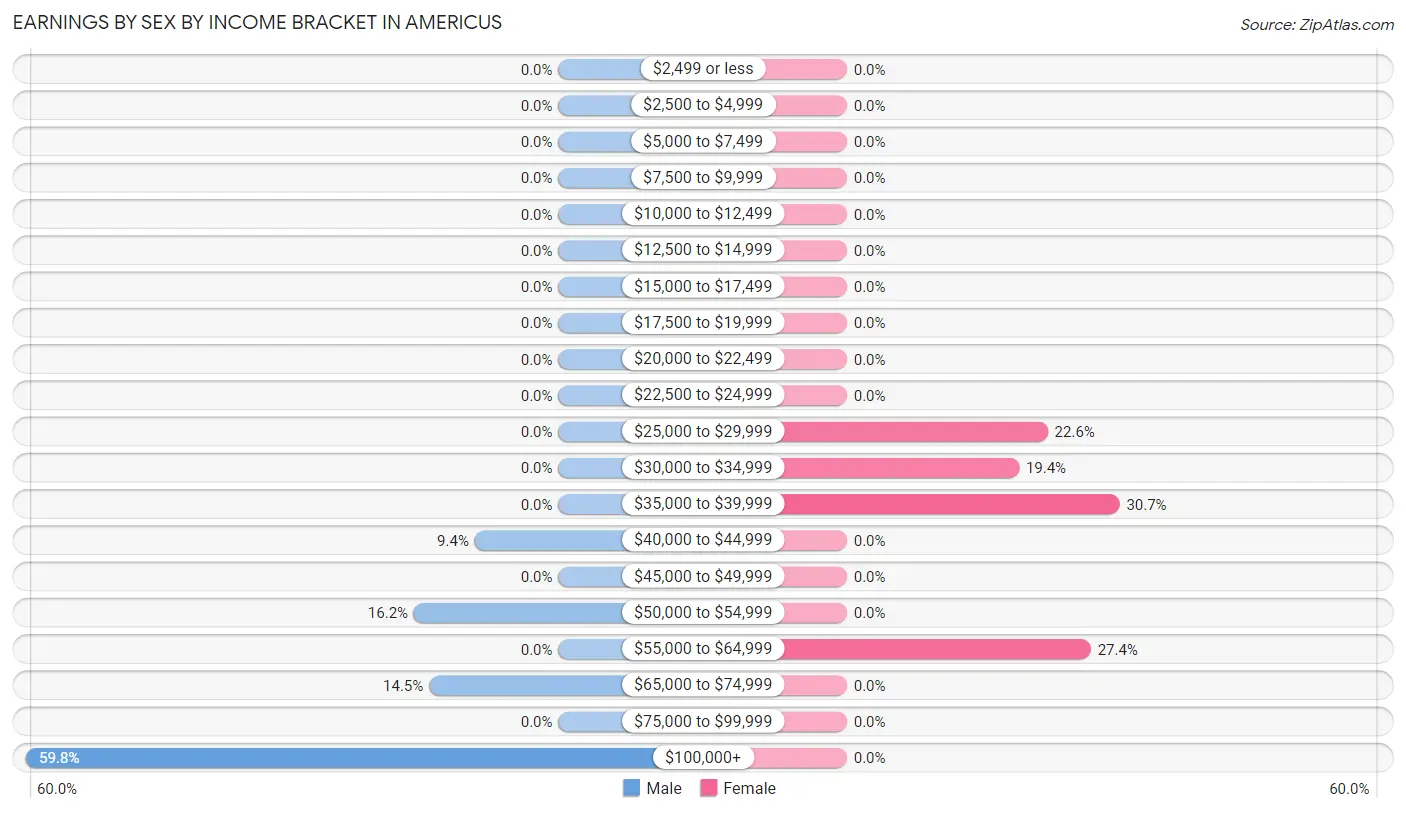
Earnings by Sex by Income Bracket in Americus
The most common earnings brackets in Americus are $100,000+ for men (70 | 59.8%) and $35,000 to $39,999 for women (19 | 30.6%).
| Income | Male | Female |
| $2,499 or less | 0 (0.0%) | 0 (0.0%) |
| $2,500 to $4,999 | 0 (0.0%) | 0 (0.0%) |
| $5,000 to $7,499 | 0 (0.0%) | 0 (0.0%) |
| $7,500 to $9,999 | 0 (0.0%) | 0 (0.0%) |
| $10,000 to $12,499 | 0 (0.0%) | 0 (0.0%) |
| $12,500 to $14,999 | 0 (0.0%) | 0 (0.0%) |
| $15,000 to $17,499 | 0 (0.0%) | 0 (0.0%) |
| $17,500 to $19,999 | 0 (0.0%) | 0 (0.0%) |
| $20,000 to $22,499 | 0 (0.0%) | 0 (0.0%) |
| $22,500 to $24,999 | 0 (0.0%) | 0 (0.0%) |
| $25,000 to $29,999 | 0 (0.0%) | 14 (22.6%) |
| $30,000 to $34,999 | 0 (0.0%) | 12 (19.4%) |
| $35,000 to $39,999 | 0 (0.0%) | 19 (30.6%) |
| $40,000 to $44,999 | 11 (9.4%) | 0 (0.0%) |
| $45,000 to $49,999 | 0 (0.0%) | 0 (0.0%) |
| $50,000 to $54,999 | 19 (16.2%) | 0 (0.0%) |
| $55,000 to $64,999 | 0 (0.0%) | 17 (27.4%) |
| $65,000 to $74,999 | 17 (14.5%) | 0 (0.0%) |
| $75,000 to $99,999 | 0 (0.0%) | 0 (0.0%) |
| $100,000+ | 70 (59.8%) | 0 (0.0%) |
| Total | 117 (100.0%) | 62 (100.0%) |
Earnings by Sex by Educational Attainment in Americus
| Educational Attainment | Male Income | Female Income |
| Less than High School | - | - |
| High School Diploma | - | - |
| College or Associate's Degree | - | - |
| Bachelor's Degree | - | - |
| Graduate Degree | - | - |
| Total | - | - |
Family Income in Americus
Family Income Brackets in Americus
According to the Americus family income data, there are 37 families falling into the $100,000 to $149,999 income range, which is the most common income bracket and makes up 59.7% of all families.
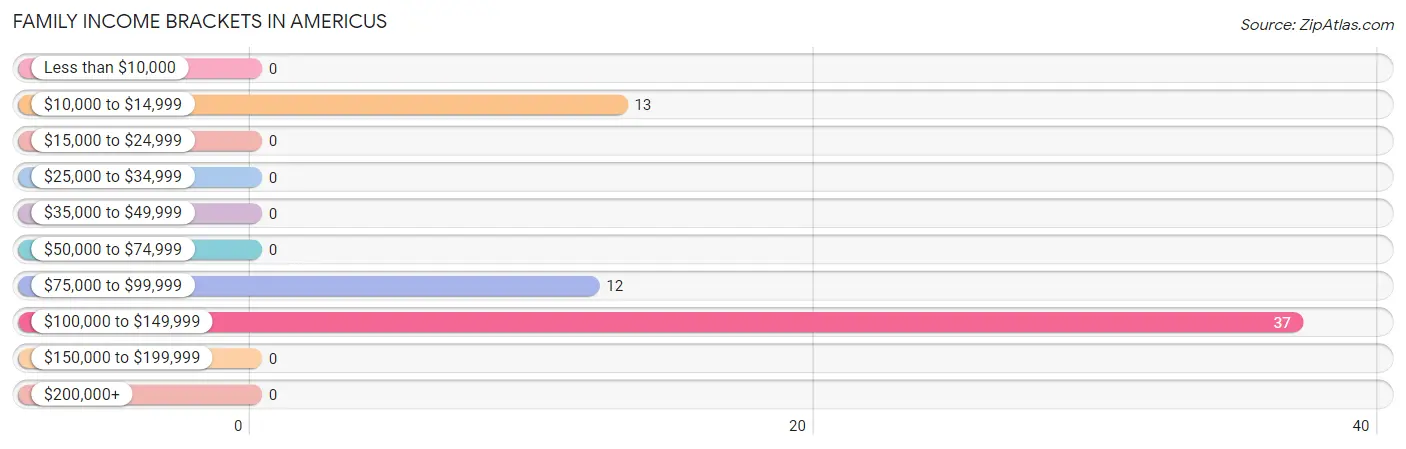
| Income Bracket | # Families | % Families |
| Less than $10,000 | 0 | 0.0% |
| $10,000 to $14,999 | 13 | 21.0% |
| $15,000 to $24,999 | 0 | 0.0% |
| $25,000 to $34,999 | 0 | 0.0% |
| $35,000 to $49,999 | 0 | 0.0% |
| $50,000 to $74,999 | 0 | 0.0% |
| $75,000 to $99,999 | 12 | 19.4% |
| $100,000 to $149,999 | 37 | 59.7% |
| $150,000 to $199,999 | 0 | 0.0% |
| $200,000+ | 0 | 0.0% |
Family Income by Famaliy Size in Americus
2-person families (50 | 80.6%) account for the highest median family income in Americus with $135,882 per family, while 2-person families (50 | 80.6%) have the highest median income of $67,941 per family member.
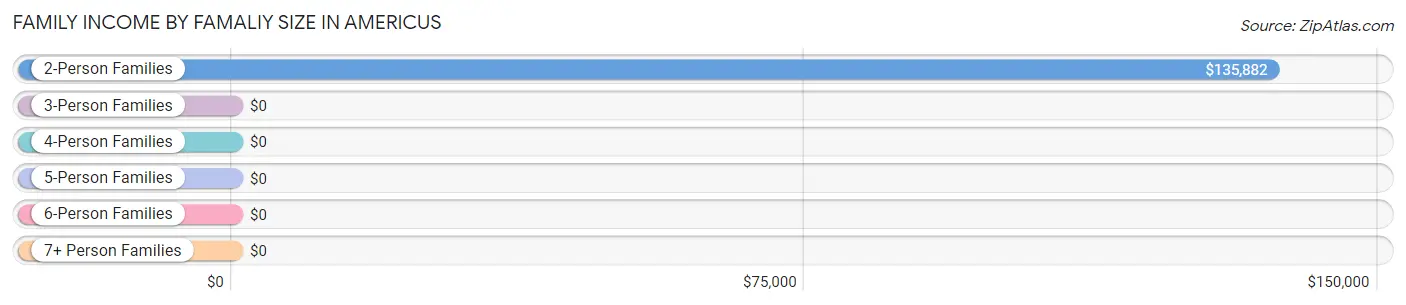
| Income Bracket | # Families | Median Income |
| 2-Person Families | 50 (80.6%) | $135,882 |
| 3-Person Families | 0 (0.0%) | $0 |
| 4-Person Families | 0 (0.0%) | $0 |
| 5-Person Families | 12 (19.4%) | $0 |
| 6-Person Families | 0 (0.0%) | $0 |
| 7+ Person Families | 0 (0.0%) | $0 |
| Total | 62 (100.0%) | $121,250 |
Family Income by Number of Earners in Americus
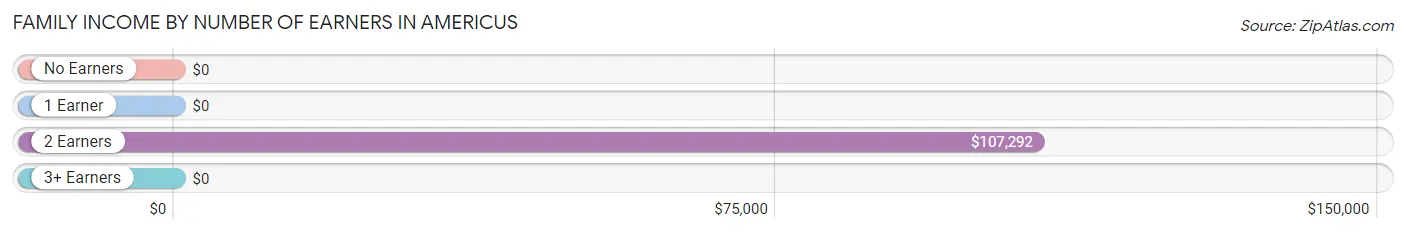
| Number of Earners | # Families | Median Income |
| No Earners | 13 (21.0%) | $0 |
| 1 Earner | 14 (22.6%) | $0 |
| 2 Earners | 35 (56.5%) | $107,292 |
| 3+ Earners | 0 (0.0%) | $0 |
| Total | 62 (100.0%) | $121,250 |
Household Income in Americus
Household Income Brackets in Americus
With 54 households falling in the category, the $200,000+ income range is the most frequent in Americus, accounting for 32.1% of all households.
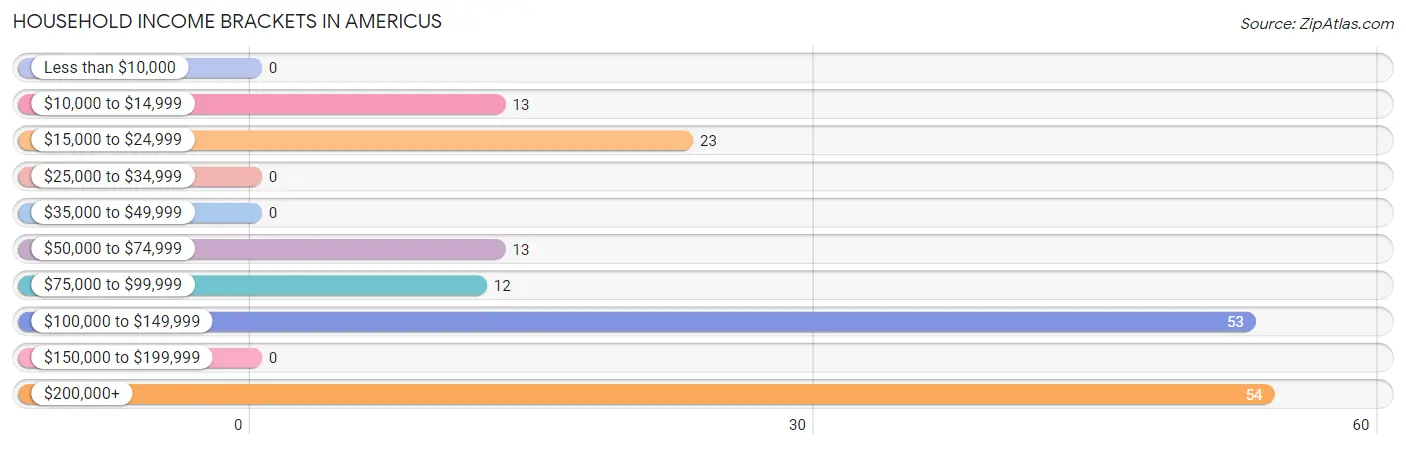
| Income Bracket | # Households | % Households |
| Less than $10,000 | 0 | 0.0% |
| $10,000 to $14,999 | 13 | 7.7% |
| $15,000 to $24,999 | 23 | 13.7% |
| $25,000 to $34,999 | 0 | 0.0% |
| $35,000 to $49,999 | 0 | 0.0% |
| $50,000 to $74,999 | 13 | 7.7% |
| $75,000 to $99,999 | 12 | 7.1% |
| $100,000 to $149,999 | 53 | 31.5% |
| $150,000 to $199,999 | 0 | 0.0% |
| $200,000+ | 54 | 32.1% |
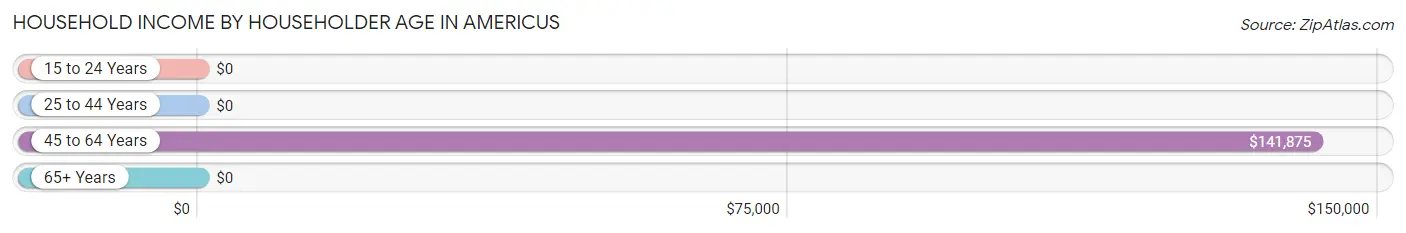
Household Income by Householder Age in Americus
The median household income in Americus is $135,147, with the highest median household income of $141,875 found in the 45 to 64 years age bracket for the primary householder. A total of 115 households (68.4%) fall into this category.
| Income Bracket | # Households | Median Income |
| 15 to 24 Years | 0 (0.0%) | $0 |
| 25 to 44 Years | 12 (7.1%) | $0 |
| 45 to 64 Years | 115 (68.4%) | $141,875 |
| 65+ Years | 41 (24.4%) | $0 |
| Total | 168 (100.0%) | $135,147 |
Poverty in Americus
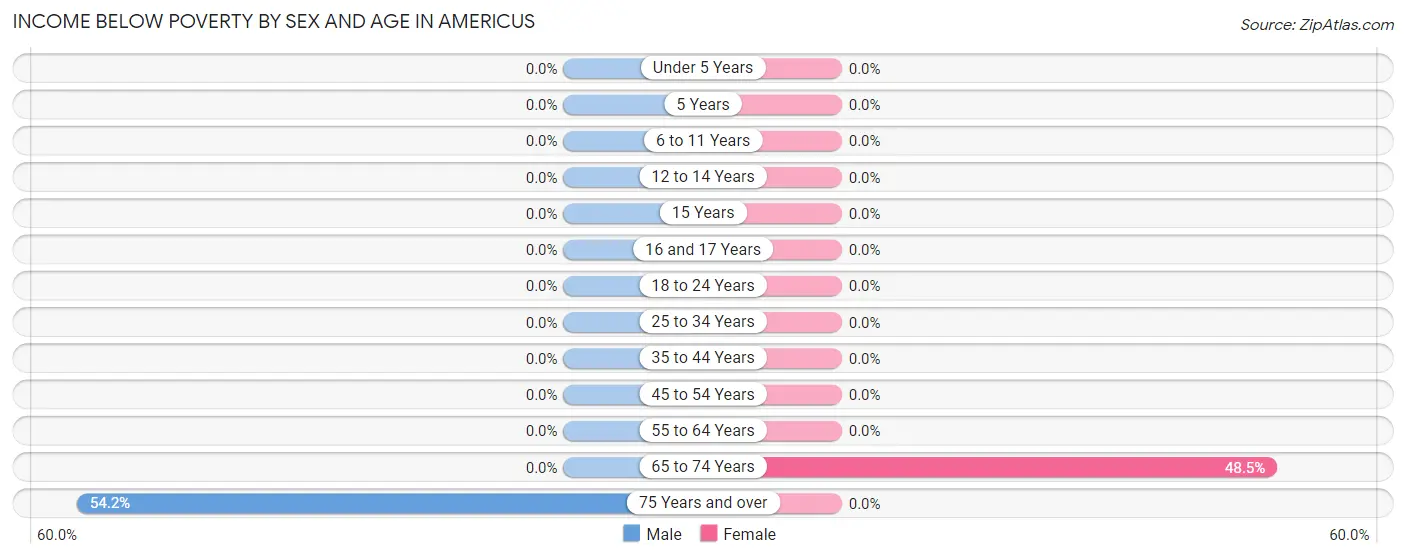
Income Below Poverty by Sex and Age in Americus
With 8.4% poverty level for males and 12.1% for females among the residents of Americus, 75 year old and over males and 65 to 74 year old females are the most vulnerable to poverty, with 13 males (54.2%) and 16 females (48.5%) in their respective age groups living below the poverty level.
| Age Bracket | Male | Female |
| Under 5 Years | 0 (0.0%) | 0 (0.0%) |
| 5 Years | 0 (0.0%) | 0 (0.0%) |
| 6 to 11 Years | 0 (0.0%) | 0 (0.0%) |
| 12 to 14 Years | 0 (0.0%) | 0 (0.0%) |
| 15 Years | 0 (0.0%) | 0 (0.0%) |
| 16 and 17 Years | 0 (0.0%) | 0 (0.0%) |
| 18 to 24 Years | 0 (0.0%) | 0 (0.0%) |
| 25 to 34 Years | 0 (0.0%) | 0 (0.0%) |
| 35 to 44 Years | 0 (0.0%) | 0 (0.0%) |
| 45 to 54 Years | 0 (0.0%) | 0 (0.0%) |
| 55 to 64 Years | 0 (0.0%) | 0 (0.0%) |
| 65 to 74 Years | 0 (0.0%) | 16 (48.5%) |
| 75 Years and over | 13 (54.2%) | 0 (0.0%) |
| Total | 13 (8.4%) | 16 (12.1%) |
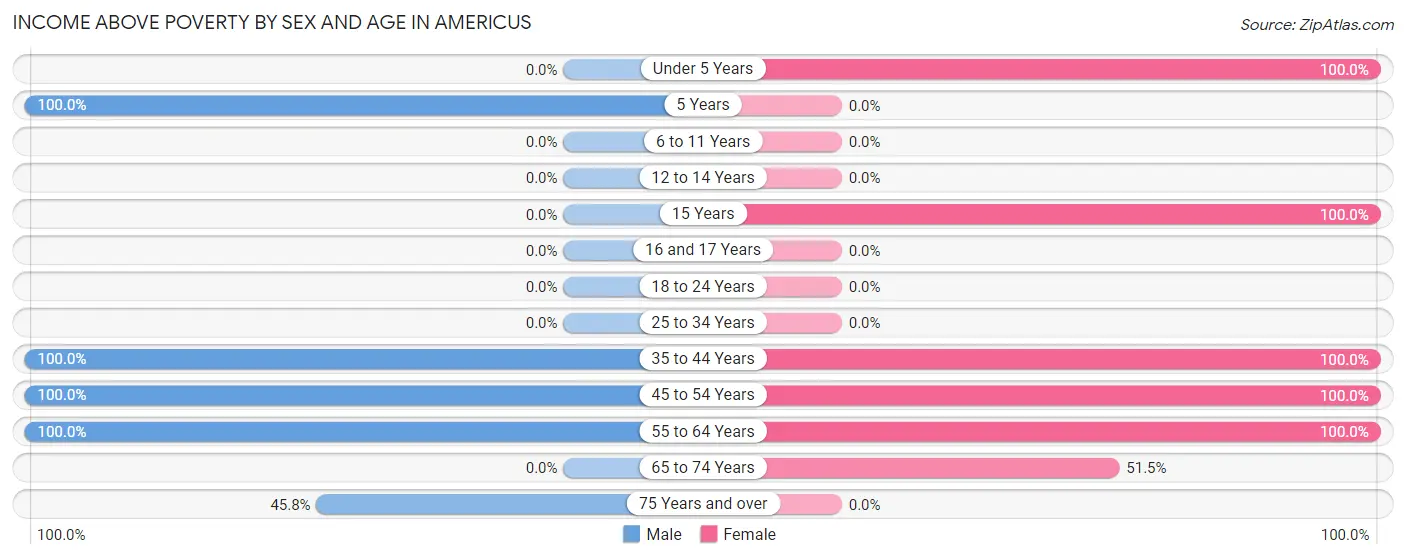
Income Above Poverty by Sex and Age in Americus
According to the poverty statistics in Americus, males aged 5 years and females aged under 5 years are the age groups that are most secure financially, with 100.0% of males and 100.0% of females in these age groups living above the poverty line.
| Age Bracket | Male | Female |
| Under 5 Years | 0 (0.0%) | 13 (100.0%) |
| 5 Years | 13 (100.0%) | 0 (0.0%) |
| 6 to 11 Years | 0 (0.0%) | 0 (0.0%) |
| 12 to 14 Years | 0 (0.0%) | 0 (0.0%) |
| 15 Years | 0 (0.0%) | 15 (100.0%) |
| 16 and 17 Years | 0 (0.0%) | 0 (0.0%) |
| 18 to 24 Years | 0 (0.0%) | 0 (0.0%) |
| 25 to 34 Years | 0 (0.0%) | 0 (0.0%) |
| 35 to 44 Years | 11 (100.0%) | 12 (100.0%) |
| 45 to 54 Years | 54 (100.0%) | 26 (100.0%) |
| 55 to 64 Years | 52 (100.0%) | 33 (100.0%) |
| 65 to 74 Years | 0 (0.0%) | 17 (51.5%) |
| 75 Years and over | 11 (45.8%) | 0 (0.0%) |
| Total | 141 (91.6%) | 116 (87.9%) |
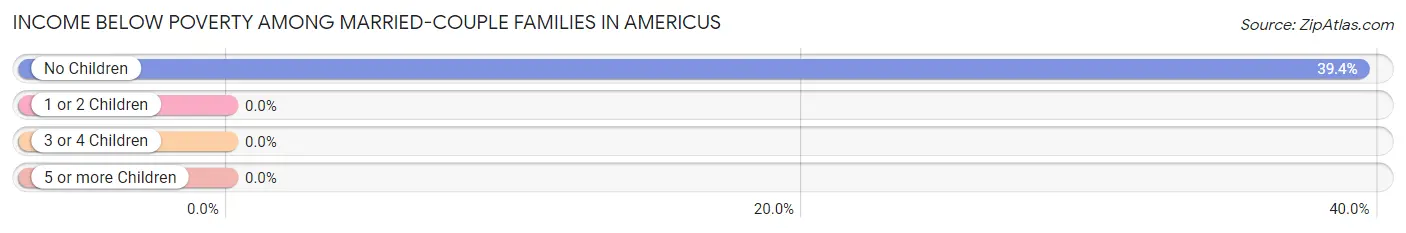
Income Below Poverty Among Married-Couple Families in Americus
The poverty statistics for married-couple families in Americus show that 28.9% or 13 of the total 45 families live below the poverty line. Families with no children have the highest poverty rate of 39.4%, comprising of 13 families. On the other hand, families with 3 or 4 children have the lowest poverty rate of 0.0%, which includes 0 families.
| Children | Above Poverty | Below Poverty |
| No Children | 20 (60.6%) | 13 (39.4%) |
| 1 or 2 Children | 0 (0.0%) | 0 (0.0%) |
| 3 or 4 Children | 12 (100.0%) | 0 (0.0%) |
| 5 or more Children | 0 (0.0%) | 0 (0.0%) |
| Total | 32 (71.1%) | 13 (28.9%) |
Income Below Poverty Among Single-Parent Households in Americus
| Children | Single Father | Single Mother |
| No Children | 0 (0.0%) | 0 (0.0%) |
| 1 or 2 Children | 0 (0.0%) | 0 (0.0%) |
| 3 or 4 Children | 0 (0.0%) | 0 (0.0%) |
| 5 or more Children | 0 (0.0%) | 0 (0.0%) |
| Total | 0 (0.0%) | 0 (0.0%) |
Income Below Poverty Among Married-Couple vs Single-Parent Households in Americus
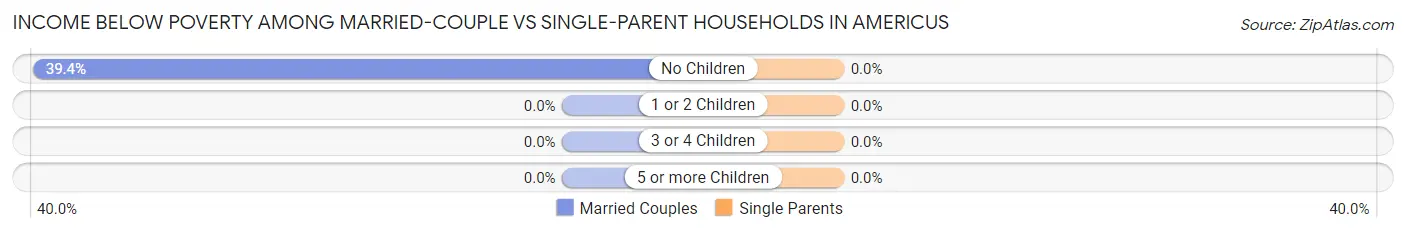
| Children | Married-Couple Families | Single-Parent Households |
| No Children | 13 (39.4%) | 0 (0.0%) |
| 1 or 2 Children | 0 (0.0%) | 0 (0.0%) |
| 3 or 4 Children | 0 (0.0%) | 0 (0.0%) |
| 5 or more Children | 0 (0.0%) | 0 (0.0%) |
| Total | 13 (28.9%) | 0 (0.0%) |
Race in Americus
The most populous races in Americus are White / Caucasian (249 | 87.1%), Two or more Races (31 | 10.8%), and Hispanic or Latino (19 | 6.6%).
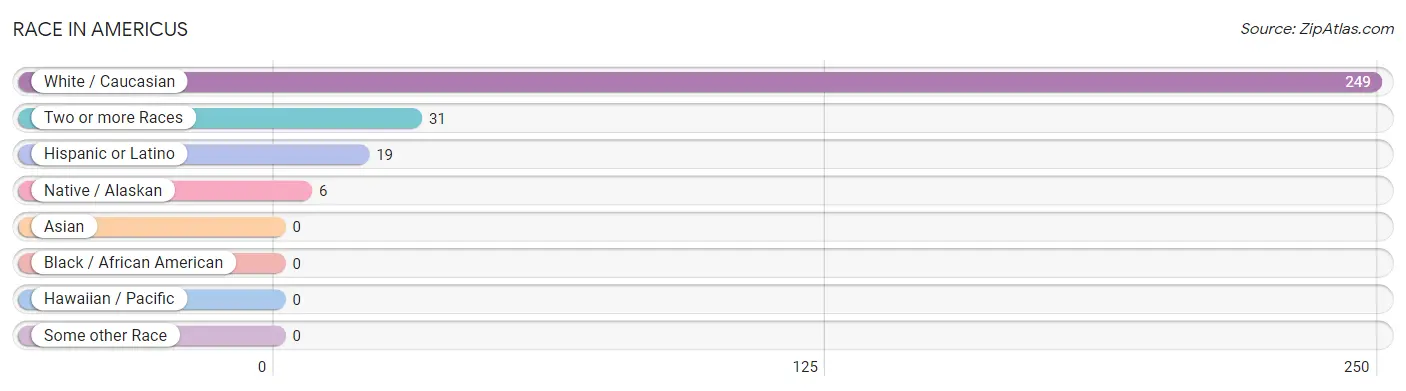
| Race | # Population | % Population |
| Asian | 0 | 0.0% |
| Black / African American | 0 | 0.0% |
| Hawaiian / Pacific | 0 | 0.0% |
| Hispanic or Latino | 19 | 6.6% |
| Native / Alaskan | 6 | 2.1% |
| White / Caucasian | 249 | 87.1% |
| Two or more Races | 31 | 10.8% |
| Some other Race | 0 | 0.0% |
| Total | 286 | 100.0% |
Ancestry in Americus
The most populous ancestries reported in Americus are Dutch (31 | 10.8%), German (28 | 9.8%), Central American (19 | 6.6%), Guatemalan (19 | 6.6%), and English (17 | 5.9%), together accounting for 39.9% of all Americus residents.
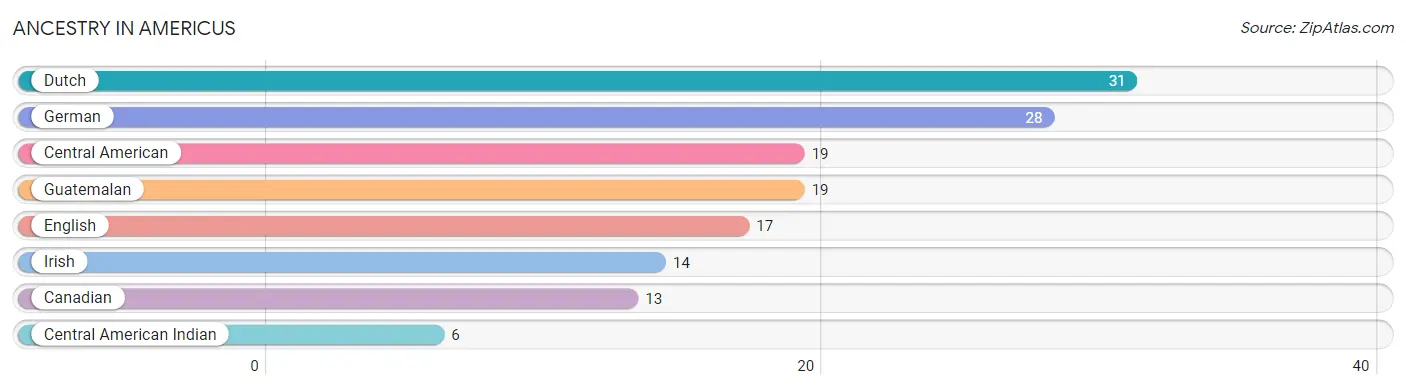
| Ancestry | # Population | % Population |
| Canadian | 13 | 4.5% |
| Central American | 19 | 6.6% |
| Central American Indian | 6 | 2.1% |
| Dutch | 31 | 10.8% |
| English | 17 | 5.9% |
| German | 28 | 9.8% |
| Guatemalan | 19 | 6.6% |
| Irish | 14 | 4.9% | View All 8 Rows |
Immigrants in Americus
The most numerous immigrant groups reported in Americus came from Central America (25 | 8.7%), Guatemala (25 | 8.7%), Latin America (25 | 8.7%), and Canada (13 | 4.5%), together accounting for 30.8% of all Americus residents.
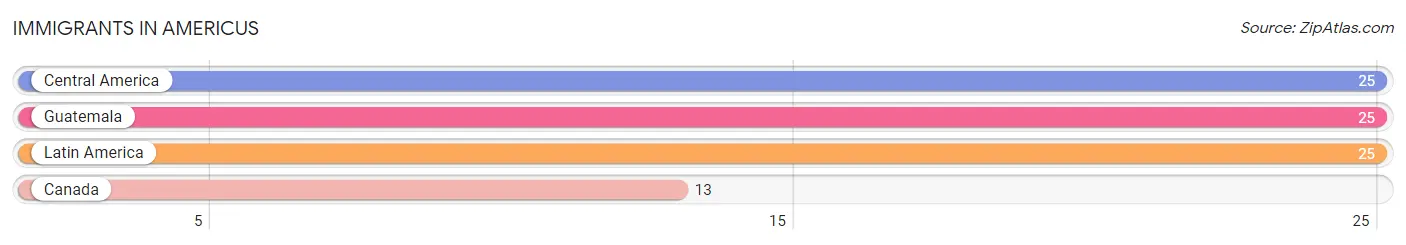
| Immigration Origin | # Population | % Population |
| Canada | 13 | 4.5% |
| Central America | 25 | 8.7% |
| Guatemala | 25 | 8.7% |
| Latin America | 25 | 8.7% | View All 4 Rows |
Sex and Age in Americus
Sex and Age in Americus
The most populous age groups in Americus are 45 to 49 Years (54 | 35.1%) for men and 60 to 64 Years (33 | 25.0%) for women.
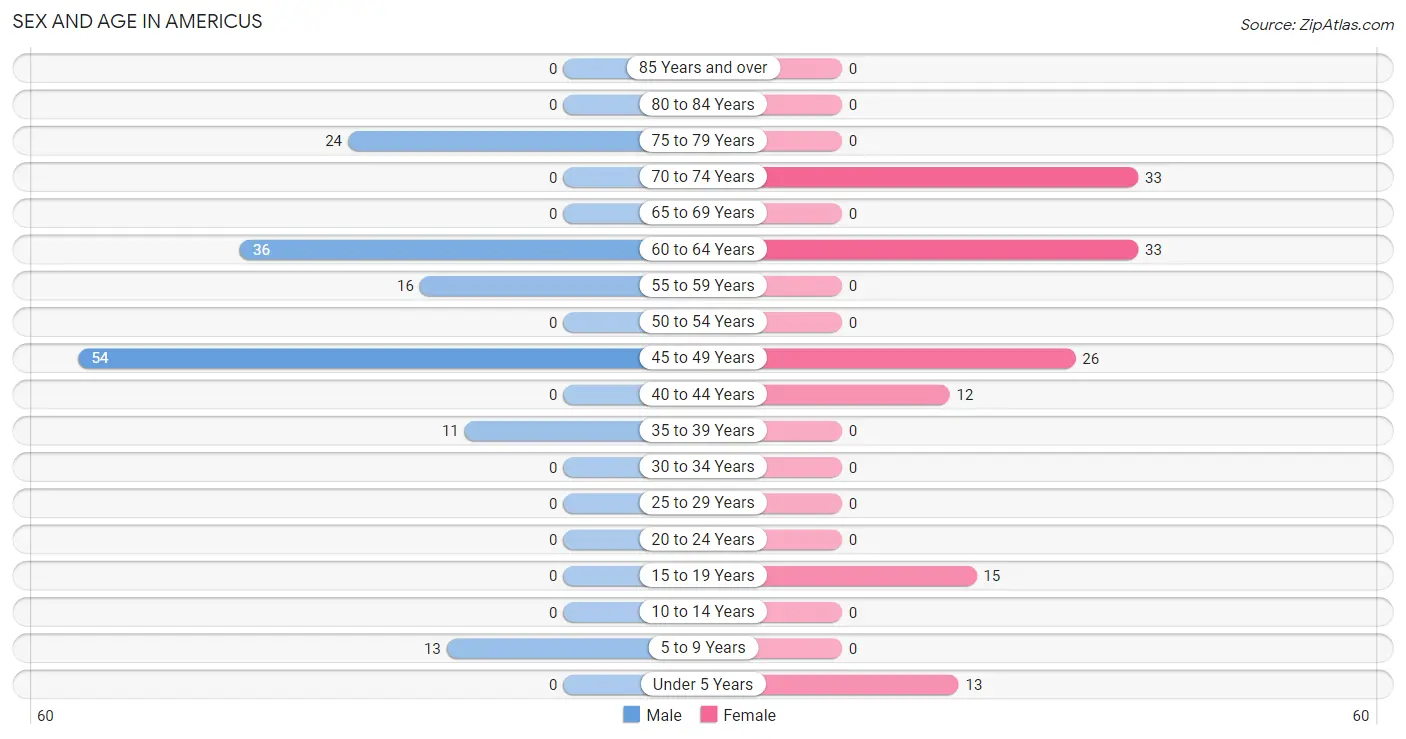
| Age Bracket | Male | Female |
| Under 5 Years | 0 (0.0%) | 13 (9.9%) |
| 5 to 9 Years | 13 (8.4%) | 0 (0.0%) |
| 10 to 14 Years | 0 (0.0%) | 0 (0.0%) |
| 15 to 19 Years | 0 (0.0%) | 15 (11.4%) |
| 20 to 24 Years | 0 (0.0%) | 0 (0.0%) |
| 25 to 29 Years | 0 (0.0%) | 0 (0.0%) |
| 30 to 34 Years | 0 (0.0%) | 0 (0.0%) |
| 35 to 39 Years | 11 (7.1%) | 0 (0.0%) |
| 40 to 44 Years | 0 (0.0%) | 12 (9.1%) |
| 45 to 49 Years | 54 (35.1%) | 26 (19.7%) |
| 50 to 54 Years | 0 (0.0%) | 0 (0.0%) |
| 55 to 59 Years | 16 (10.4%) | 0 (0.0%) |
| 60 to 64 Years | 36 (23.4%) | 33 (25.0%) |
| 65 to 69 Years | 0 (0.0%) | 0 (0.0%) |
| 70 to 74 Years | 0 (0.0%) | 33 (25.0%) |
| 75 to 79 Years | 24 (15.6%) | 0 (0.0%) |
| 80 to 84 Years | 0 (0.0%) | 0 (0.0%) |
| 85 Years and over | 0 (0.0%) | 0 (0.0%) |
| Total | 154 (100.0%) | 132 (100.0%) |
Families and Households in Americus
Median Family Size in Americus
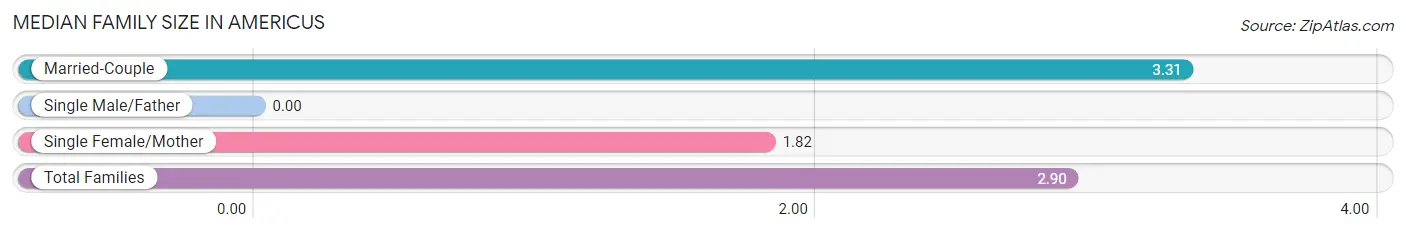
| Family Type | # Families | Family Size |
| Married-Couple | 45 (72.6%) | 3.31 |
| Single Male/Father | 0 (0.0%) | - |
| Single Female/Mother | 17 (27.4%) | 1.82 |
| Total Families | 62 (100.0%) | 2.90 |
Median Household Size in Americus
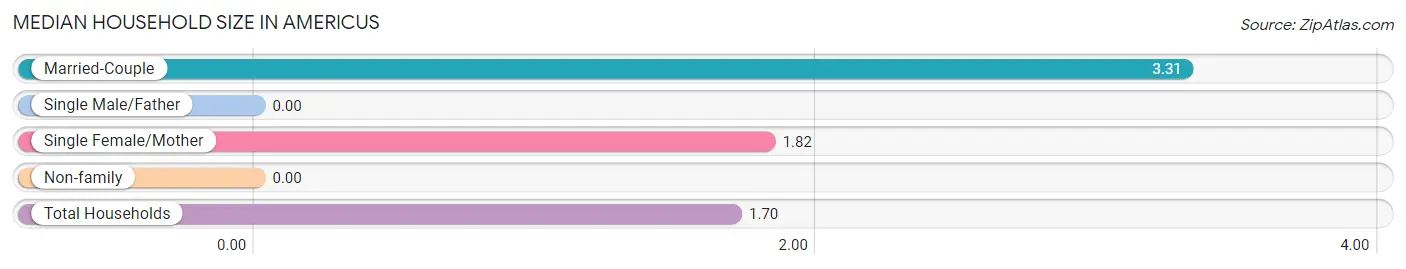
| Household Type | # Households | Household Size |
| Married-Couple | 45 (26.8%) | 3.31 |
| Single Male/Father | 0 (0.0%) | - |
| Single Female/Mother | 17 (10.1%) | 1.82 |
| Non-family | 106 (63.1%) | - |
| Total Households | 168 (100.0%) | 1.70 |
Household Size by Marriage Status in Americus
Out of a total of 168 households in Americus, 62 (36.9%) are family households, while 106 (63.1%) are nonfamily households. The most numerous type of family households are 2-person households, comprising 50, and the most common type of nonfamily households are 1-person households, comprising 106.
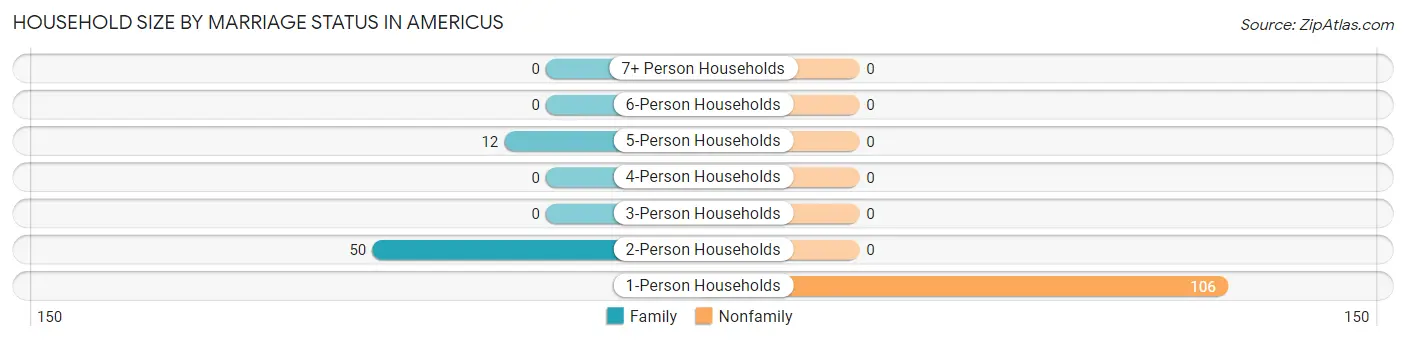
| Household Size | Family Households | Nonfamily Households |
| 1-Person Households | - | 106 (63.1%) |
| 2-Person Households | 50 (29.8%) | 0 (0.0%) |
| 3-Person Households | 0 (0.0%) | 0 (0.0%) |
| 4-Person Households | 0 (0.0%) | 0 (0.0%) |
| 5-Person Households | 12 (7.1%) | 0 (0.0%) |
| 6-Person Households | 0 (0.0%) | 0 (0.0%) |
| 7+ Person Households | 0 (0.0%) | 0 (0.0%) |
| Total | 62 (36.9%) | 106 (63.1%) |
Female Fertility in Americus
Fertility by Age in Americus
| Age Bracket | Women with Births | Births / 1,000 Women |
| 15 to 19 years | 0 (0.0%) | 0.0 |
| 20 to 34 years | 0 (0.0%) | 0.0 |
| 35 to 50 years | 0 (0.0%) | 0.0 |
| Total | 0 (0.0%) | 0.0 |
Fertility by Age by Marriage Status in Americus
| Age Bracket | Married | Unmarried |
| 15 to 19 years | 0 (0.0%) | 0 (0.0%) |
| 20 to 34 years | 0 (0.0%) | 0 (0.0%) |
| 35 to 50 years | 0 (0.0%) | 0 (0.0%) |
| Total | 0 (0.0%) | 0 (0.0%) |
Fertility by Education in Americus
| Educational Attainment | Women with Births | Births / 1,000 Women |
| Less than High School | 0 (0.0%) | 0.0 |
| High School Diploma | 0 (0.0%) | 0.0 |
| College or Associate's Degree | 0 (0.0%) | 0.0 |
| Bachelor's Degree | 0 (0.0%) | 0.0 |
| Graduate Degree | 0 (0.0%) | 0.0 |
| Total | 0 (0.0%) | 0.0 |
Fertility by Education by Marriage Status in Americus
| Educational Attainment | Married | Unmarried |
| Less than High School | 0 (0.0%) | 0 (0.0%) |
| High School Diploma | 0 (0.0%) | 0 (0.0%) |
| College or Associate's Degree | 0 (0.0%) | 0 (0.0%) |
| Bachelor's Degree | 0 (0.0%) | 0 (0.0%) |
| Graduate Degree | 0 (0.0%) | 0 (0.0%) |
| Total | 0 (0.0%) | 0 (0.0%) |
Employment Characteristics in Americus
Employment by Class of Employer in Americus
Among the 179 employed individuals in Americus, private company employees (125 | 69.8%), and federal government employees (54 | 30.2%) make up the most common classes of employment.
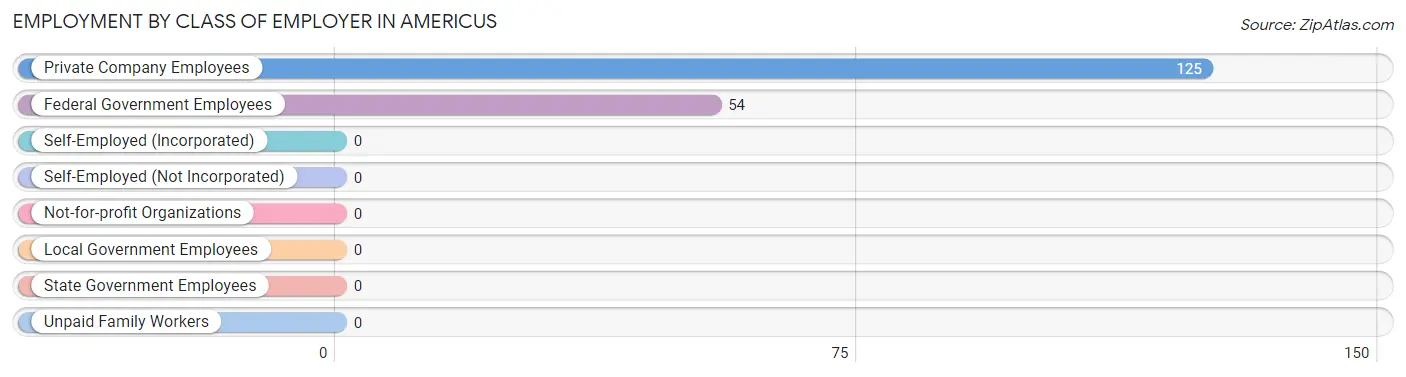
| Employer Class | # Employees | % Employees |
| Private Company Employees | 125 | 69.8% |
| Self-Employed (Incorporated) | 0 | 0.0% |
| Self-Employed (Not Incorporated) | 0 | 0.0% |
| Not-for-profit Organizations | 0 | 0.0% |
| Local Government Employees | 0 | 0.0% |
| State Government Employees | 0 | 0.0% |
| Federal Government Employees | 54 | 30.2% |
| Unpaid Family Workers | 0 | 0.0% |
| Total | 179 | 100.0% |
Employment Status by Age in Americus
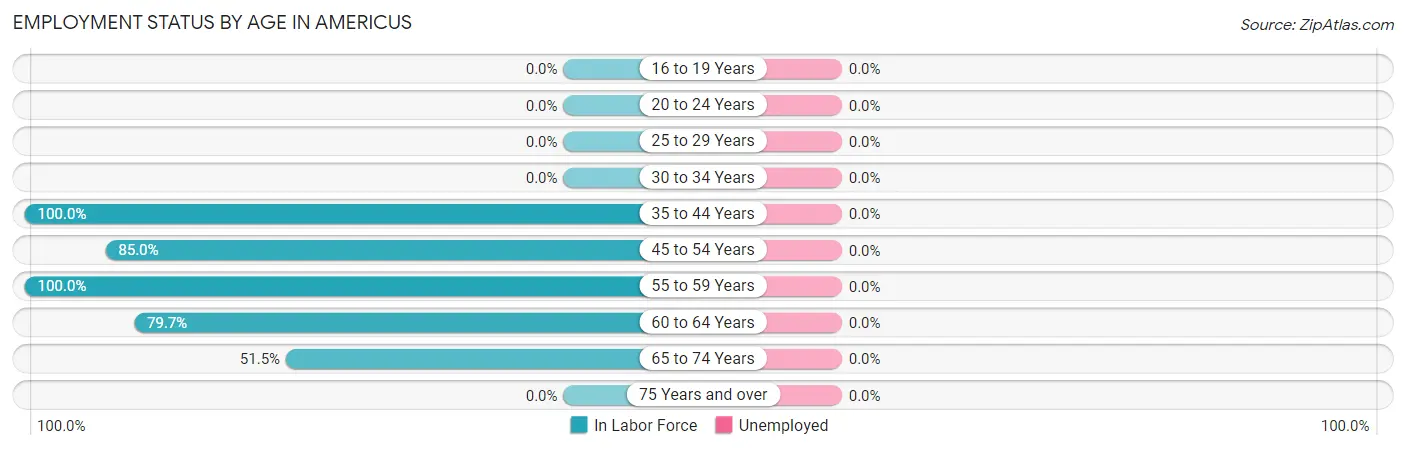
| Age Bracket | In Labor Force | Unemployed |
| 16 to 19 Years | 0 (0.0%) | 0 (0.0%) |
| 20 to 24 Years | 0 (0.0%) | 0 (0.0%) |
| 25 to 29 Years | 0 (0.0%) | 0 (0.0%) |
| 30 to 34 Years | 0 (0.0%) | 0 (0.0%) |
| 35 to 44 Years | 23 (100.0%) | 0 (0.0%) |
| 45 to 54 Years | 68 (85.0%) | 0 (0.0%) |
| 55 to 59 Years | 16 (100.0%) | 0 (0.0%) |
| 60 to 64 Years | 55 (79.7%) | 0 (0.0%) |
| 65 to 74 Years | 17 (51.5%) | 0 (0.0%) |
| 75 Years and over | 0 (0.0%) | 0 (0.0%) |
| Total | 179 (73.1%) | 0 (0.0%) |
Employment Status by Educational Attainment in Americus
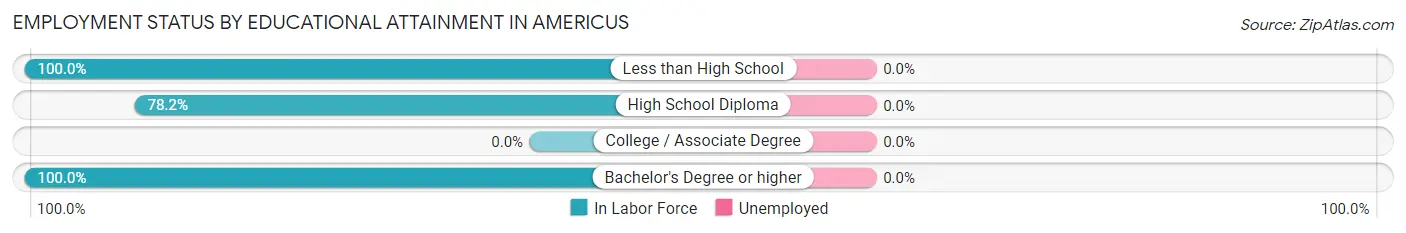
| Educational Attainment | In Labor Force | Unemployed |
| Less than High School | 25 (100.0%) | 0 (0.0%) |
| High School Diploma | 43 (78.2%) | 0 (0.0%) |
| College / Associate Degree | 0 (0.0%) | 0 (0.0%) |
| Bachelor's Degree or higher | 94 (100.0%) | 0 (0.0%) |
| Total | 162 (86.2%) | 0 (0.0%) |
Employment Occupations by Sex in Americus
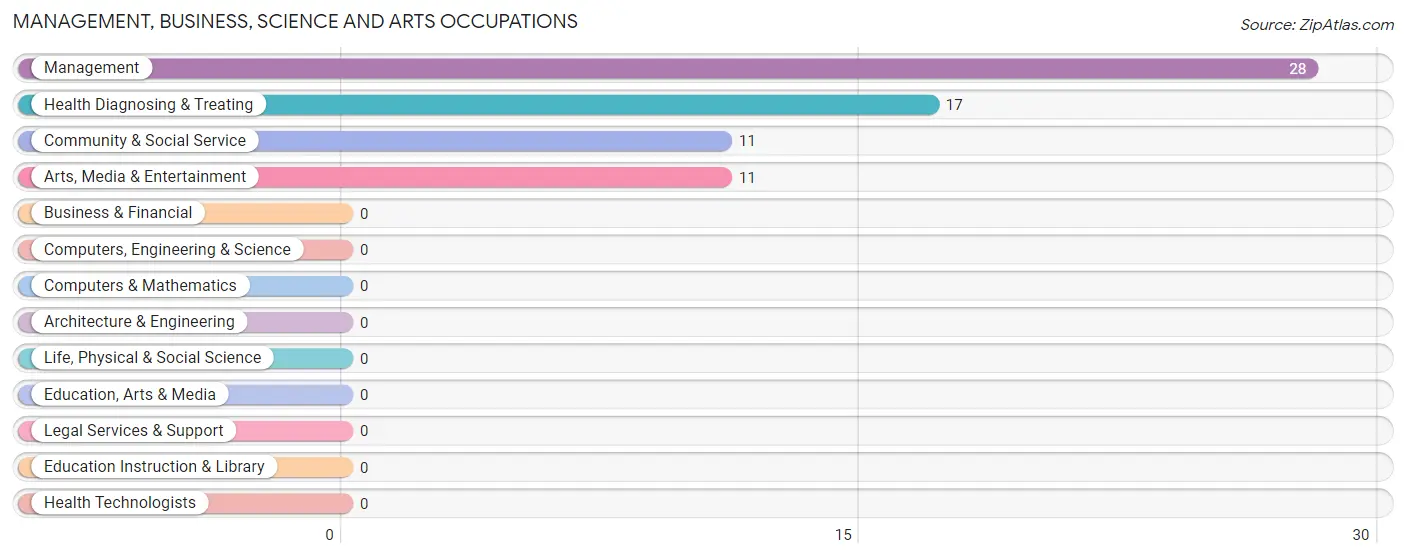
Management, Business, Science and Arts Occupations
The most common Management, Business, Science and Arts occupations in Americus are Management (28 | 15.6%), Health Diagnosing & Treating (17 | 9.5%), Community & Social Service (11 | 6.1%), and Arts, Media & Entertainment (11 | 6.1%).
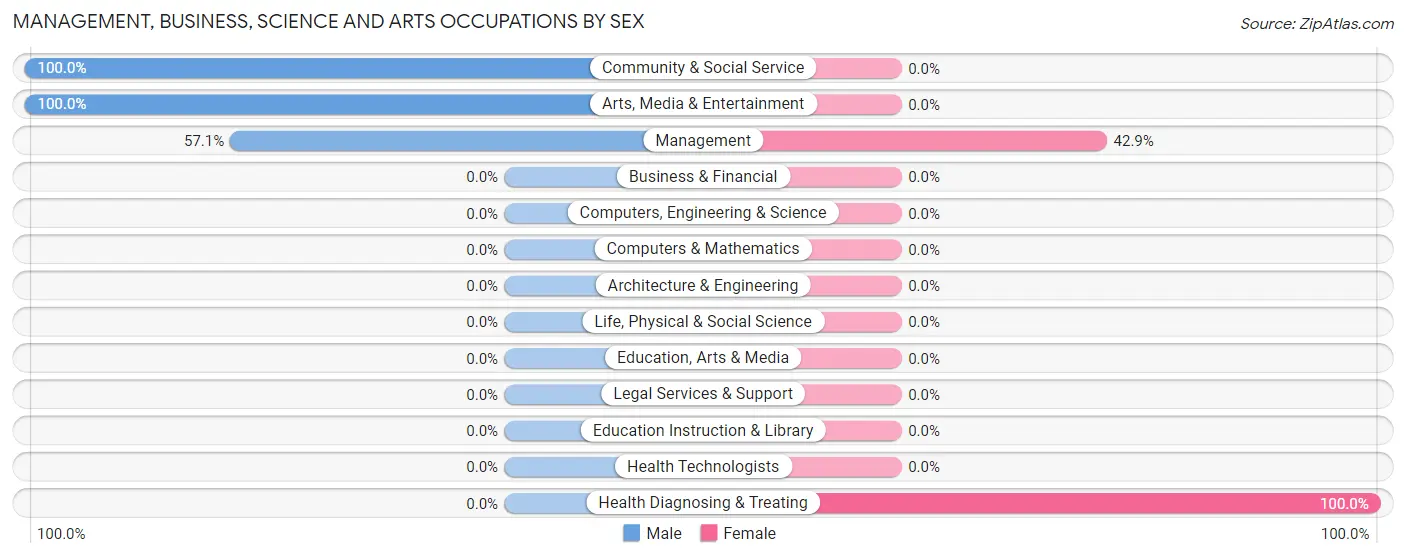
Management, Business, Science and Arts Occupations by Sex
Within the Management, Business, Science and Arts occupations in Americus, the most male-oriented occupations are Community & Social Service (100.0%), Arts, Media & Entertainment (100.0%), and Management (57.1%), while the most female-oriented occupations are Health Diagnosing & Treating (100.0%), and Management (42.9%).
| Occupation | Male | Female |
| Management | 16 (57.1%) | 12 (42.9%) |
| Business & Financial | 0 (0.0%) | 0 (0.0%) |
| Computers, Engineering & Science | 0 (0.0%) | 0 (0.0%) |
| Computers & Mathematics | 0 (0.0%) | 0 (0.0%) |
| Architecture & Engineering | 0 (0.0%) | 0 (0.0%) |
| Life, Physical & Social Science | 0 (0.0%) | 0 (0.0%) |
| Community & Social Service | 11 (100.0%) | 0 (0.0%) |
| Education, Arts & Media | 0 (0.0%) | 0 (0.0%) |
| Legal Services & Support | 0 (0.0%) | 0 (0.0%) |
| Education Instruction & Library | 0 (0.0%) | 0 (0.0%) |
| Arts, Media & Entertainment | 11 (100.0%) | 0 (0.0%) |
| Health Diagnosing & Treating | 0 (0.0%) | 17 (100.0%) |
| Health Technologists | 0 (0.0%) | 0 (0.0%) |
| Total (Category) | 27 (48.2%) | 29 (51.8%) |
| Total (Overall) | 117 (65.4%) | 62 (34.6%) |
Services Occupations
Services Occupations by Sex
| Occupation | Male | Female |
| Healthcare Support | 0 (0.0%) | 0 (0.0%) |
| Security & Protection | 0 (0.0%) | 0 (0.0%) |
| Firefighting & Prevention | 0 (0.0%) | 0 (0.0%) |
| Law Enforcement | 0 (0.0%) | 0 (0.0%) |
| Food Preparation & Serving | 0 (0.0%) | 0 (0.0%) |
| Cleaning & Maintenance | 0 (0.0%) | 0 (0.0%) |
| Personal Care & Service | 0 (0.0%) | 0 (0.0%) |
| Total (Category) | 0 (0.0%) | 0 (0.0%) |
| Total (Overall) | 117 (65.4%) | 62 (34.6%) |
Sales and Office Occupations
The most common Sales and Office occupations in Americus are Office & Administration (71 | 39.7%), and Sales & Related (14 | 7.8%).
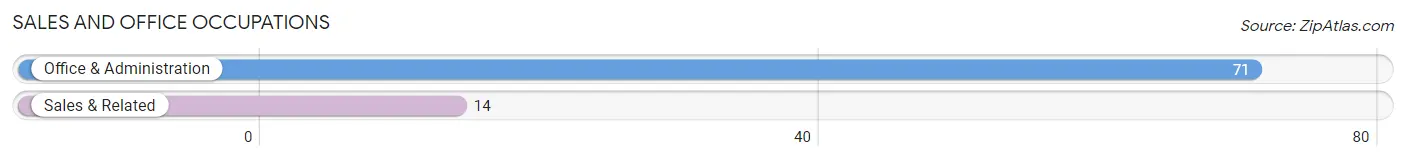
Sales and Office Occupations by Sex

| Occupation | Male | Female |
| Sales & Related | 0 (0.0%) | 14 (100.0%) |
| Office & Administration | 71 (100.0%) | 0 (0.0%) |
| Total (Category) | 71 (83.5%) | 14 (16.5%) |
| Total (Overall) | 117 (65.4%) | 62 (34.6%) |
Natural Resources, Construction and Maintenance Occupations
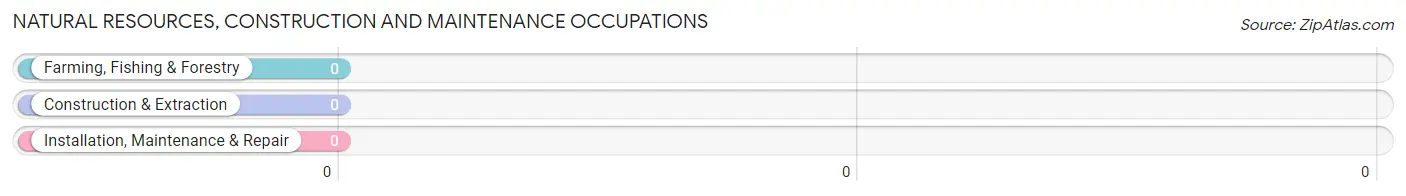
Natural Resources, Construction and Maintenance Occupations by Sex
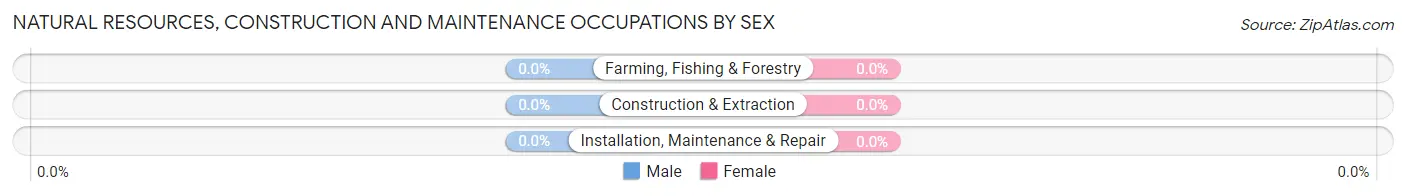
| Occupation | Male | Female |
| Farming, Fishing & Forestry | 0 (0.0%) | 0 (0.0%) |
| Construction & Extraction | 0 (0.0%) | 0 (0.0%) |
| Installation, Maintenance & Repair | 0 (0.0%) | 0 (0.0%) |
| Total (Category) | 0 (0.0%) | 0 (0.0%) |
| Total (Overall) | 117 (65.4%) | 62 (34.6%) |
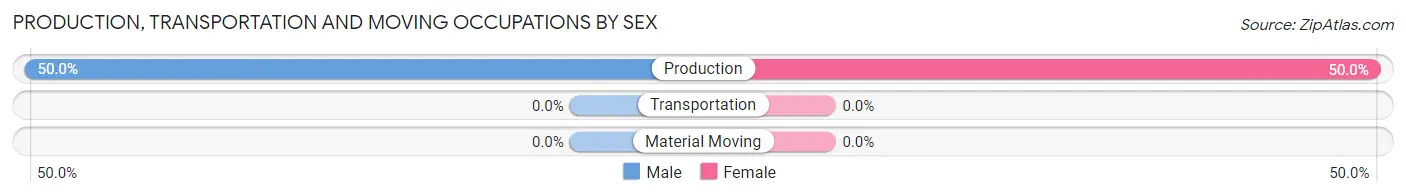
Production, Transportation and Moving Occupations
The most common Production, Transportation and Moving occupations in Americus are , and Production (38 | 21.2%).
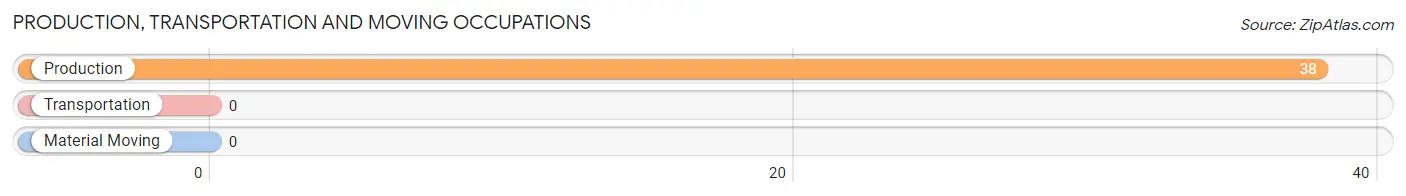
Production, Transportation and Moving Occupations by Sex
| Occupation | Male | Female |
| Production | 19 (50.0%) | 19 (50.0%) |
| Transportation | 0 (0.0%) | 0 (0.0%) |
| Material Moving | 0 (0.0%) | 0 (0.0%) |
| Total (Category) | 19 (50.0%) | 19 (50.0%) |
| Total (Overall) | 117 (65.4%) | 62 (34.6%) |
Employment Industries by Sex in Americus
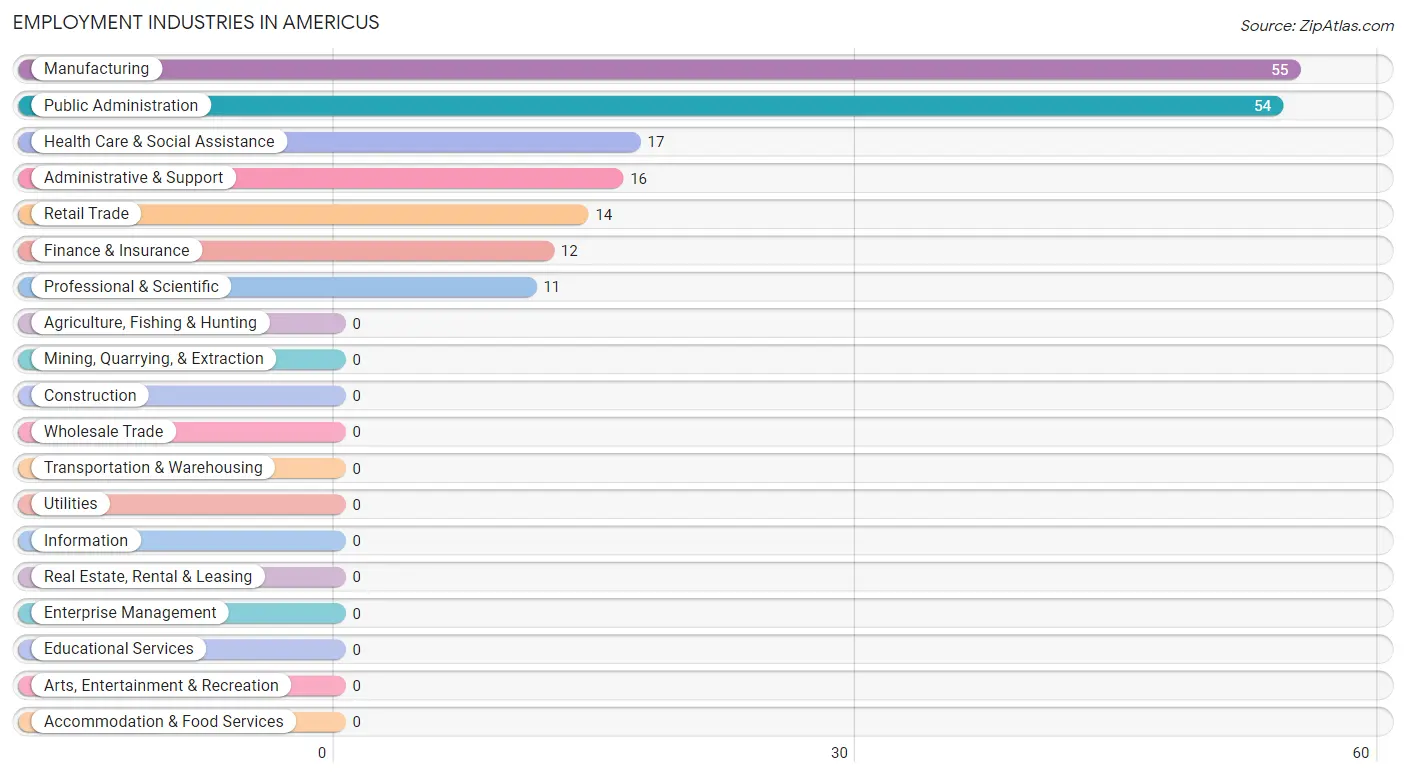
Employment Industries in Americus
The major employment industries in Americus include Manufacturing (55 | 30.7%), Public Administration (54 | 30.2%), Health Care & Social Assistance (17 | 9.5%), Administrative & Support (16 | 8.9%), and Retail Trade (14 | 7.8%).
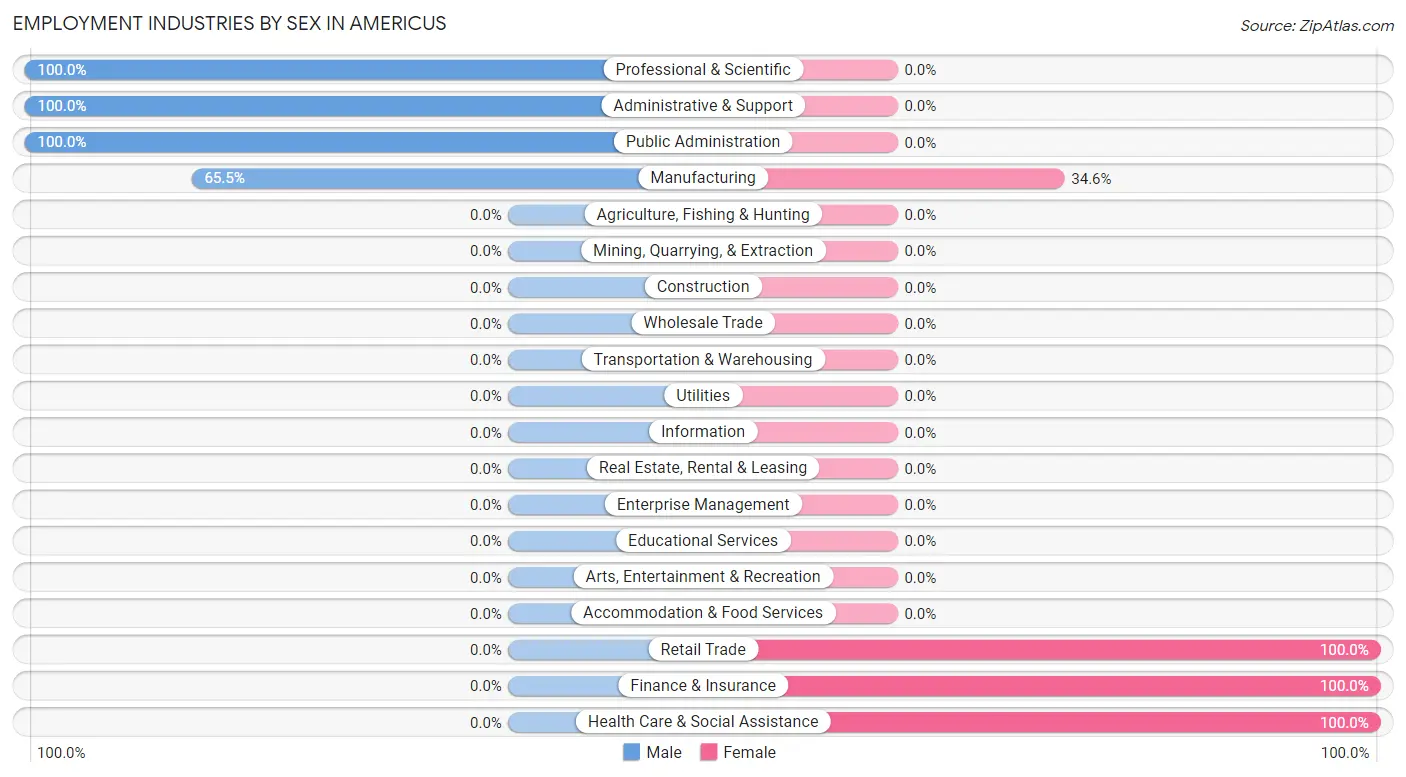
Employment Industries by Sex in Americus
The Americus industries that see more men than women are Professional & Scientific (100.0%), Administrative & Support (100.0%), and Public Administration (100.0%), whereas the industries that tend to have a higher number of women are Retail Trade (100.0%), Finance & Insurance (100.0%), and Health Care & Social Assistance (100.0%).
| Industry | Male | Female |
| Agriculture, Fishing & Hunting | 0 (0.0%) | 0 (0.0%) |
| Mining, Quarrying, & Extraction | 0 (0.0%) | 0 (0.0%) |
| Construction | 0 (0.0%) | 0 (0.0%) |
| Manufacturing | 36 (65.4%) | 19 (34.5%) |
| Wholesale Trade | 0 (0.0%) | 0 (0.0%) |
| Retail Trade | 0 (0.0%) | 14 (100.0%) |
| Transportation & Warehousing | 0 (0.0%) | 0 (0.0%) |
| Utilities | 0 (0.0%) | 0 (0.0%) |
| Information | 0 (0.0%) | 0 (0.0%) |
| Finance & Insurance | 0 (0.0%) | 12 (100.0%) |
| Real Estate, Rental & Leasing | 0 (0.0%) | 0 (0.0%) |
| Professional & Scientific | 11 (100.0%) | 0 (0.0%) |
| Enterprise Management | 0 (0.0%) | 0 (0.0%) |
| Administrative & Support | 16 (100.0%) | 0 (0.0%) |
| Educational Services | 0 (0.0%) | 0 (0.0%) |
| Health Care & Social Assistance | 0 (0.0%) | 17 (100.0%) |
| Arts, Entertainment & Recreation | 0 (0.0%) | 0 (0.0%) |
| Accommodation & Food Services | 0 (0.0%) | 0 (0.0%) |
| Public Administration | 54 (100.0%) | 0 (0.0%) |
| Total | 117 (65.4%) | 62 (34.6%) |
Education in Americus
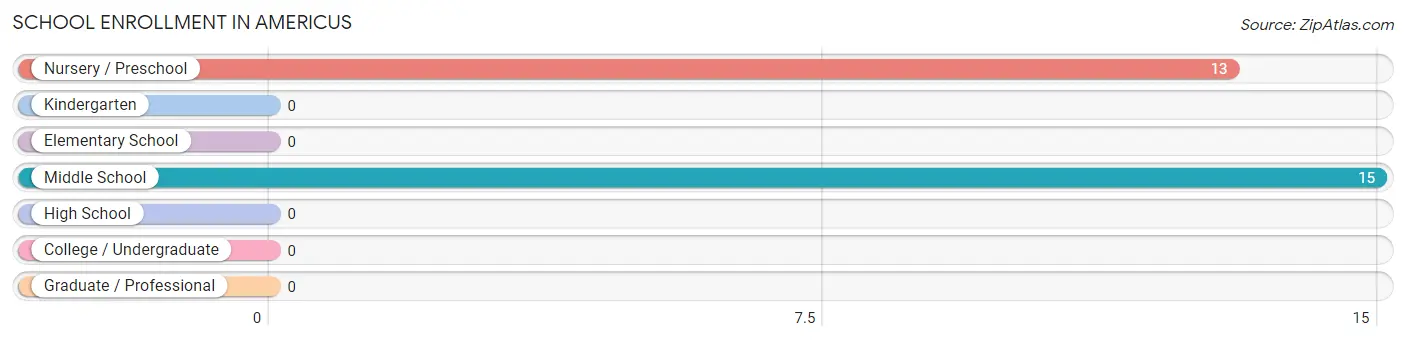
School Enrollment in Americus
The most common levels of schooling among the 28 students in Americus are middle school (15 | 53.6%), and nursery / preschool (13 | 46.4%).
| School Level | # Students | % Students |
| Nursery / Preschool | 13 | 46.4% |
| Kindergarten | 0 | 0.0% |
| Elementary School | 0 | 0.0% |
| Middle School | 15 | 53.6% |
| High School | 0 | 0.0% |
| College / Undergraduate | 0 | 0.0% |
| Graduate / Professional | 0 | 0.0% |
| Total | 28 | 100.0% |
School Enrollment by Age by Funding Source in Americus
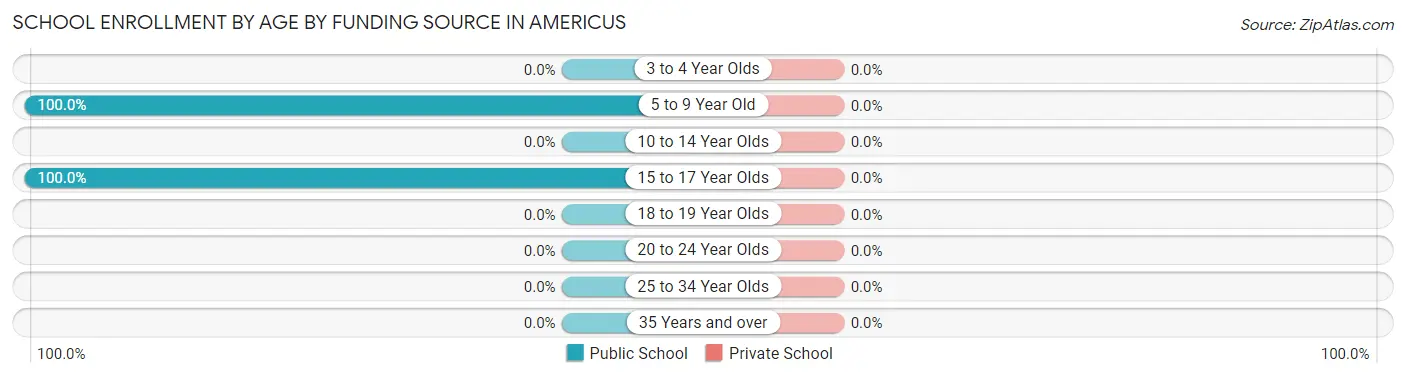
| Age Bracket | Public School | Private School |
| 3 to 4 Year Olds | 0 (0.0%) | 0 (0.0%) |
| 5 to 9 Year Old | 13 (100.0%) | 0 (0.0%) |
| 10 to 14 Year Olds | 0 (0.0%) | 0 (0.0%) |
| 15 to 17 Year Olds | 15 (100.0%) | 0 (0.0%) |
| 18 to 19 Year Olds | 0 (0.0%) | 0 (0.0%) |
| 20 to 24 Year Olds | 0 (0.0%) | 0 (0.0%) |
| 25 to 34 Year Olds | 0 (0.0%) | 0 (0.0%) |
| 35 Years and over | 0 (0.0%) | 0 (0.0%) |
| Total | 28 (100.0%) | 0 (0.0%) |
Educational Attainment by Field of Study in Americus
Engineering (54 | 43.9%), business (23 | 18.7%), bio, nature & agricultural (17 | 13.8%), psychology (16 | 13.0%), and education (13 | 10.6%) are the most common fields of study among 123 individuals in Americus who have obtained a bachelor's degree or higher.
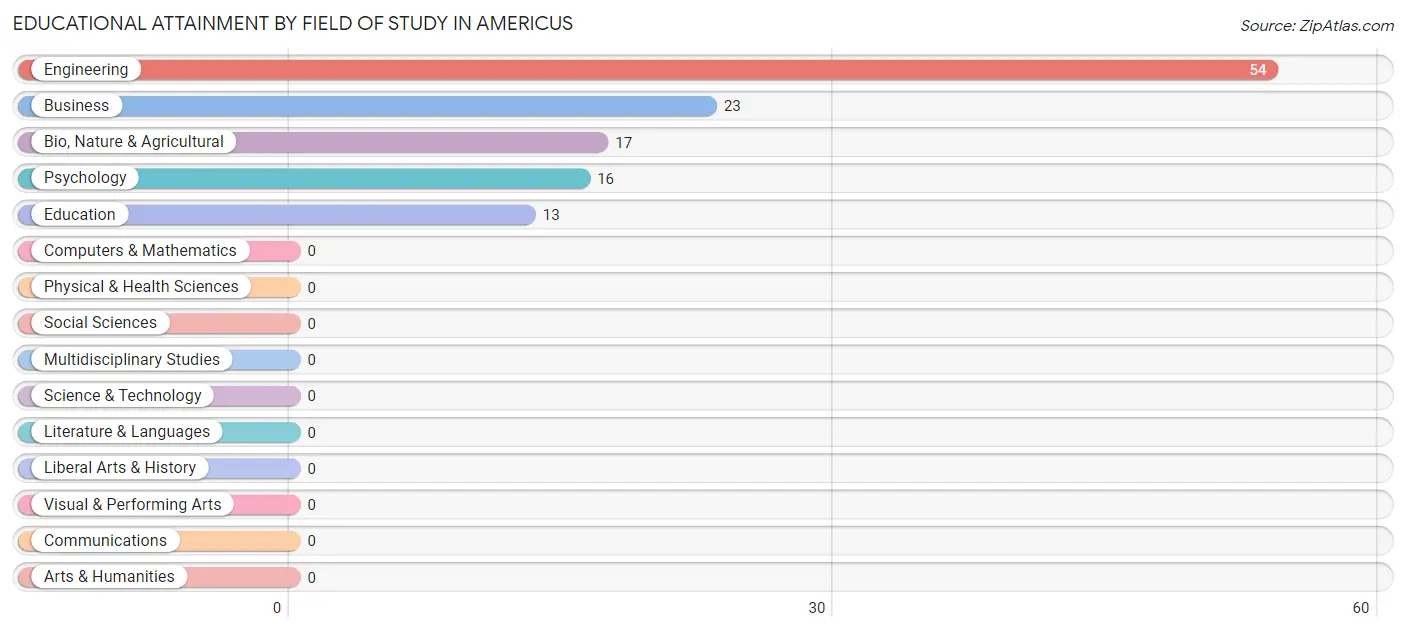
| Field of Study | # Graduates | % Graduates |
| Computers & Mathematics | 0 | 0.0% |
| Bio, Nature & Agricultural | 17 | 13.8% |
| Physical & Health Sciences | 0 | 0.0% |
| Psychology | 16 | 13.0% |
| Social Sciences | 0 | 0.0% |
| Engineering | 54 | 43.9% |
| Multidisciplinary Studies | 0 | 0.0% |
| Science & Technology | 0 | 0.0% |
| Business | 23 | 18.7% |
| Education | 13 | 10.6% |
| Literature & Languages | 0 | 0.0% |
| Liberal Arts & History | 0 | 0.0% |
| Visual & Performing Arts | 0 | 0.0% |
| Communications | 0 | 0.0% |
| Arts & Humanities | 0 | 0.0% |
| Total | 123 | 100.0% |
Transportation & Commute in Americus
Vehicle Availability by Sex in Americus
The most prevalent vehicle ownership categories in Americus are males with 3 vehicles (54, accounting for 46.2%) and females with 3 vehicles (0, making up 87.1%).
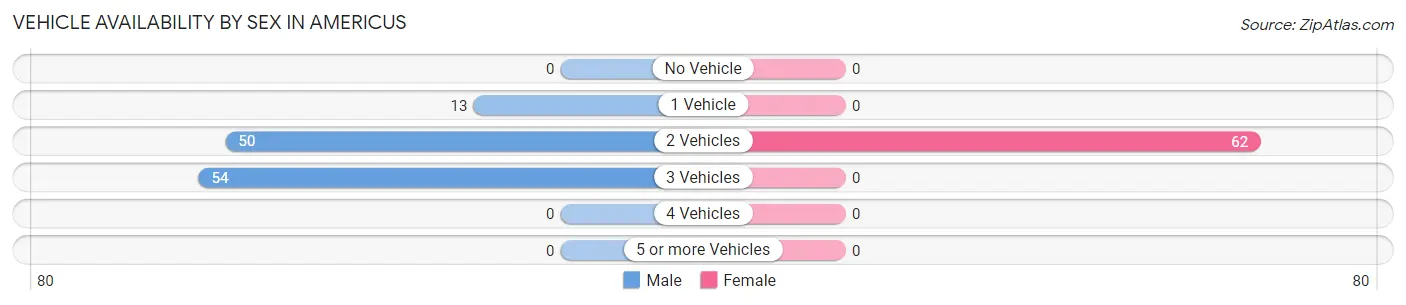
| Vehicles Available | Male | Female |
| No Vehicle | 0 (0.0%) | 0 (0.0%) |
| 1 Vehicle | 13 (11.1%) | 0 (0.0%) |
| 2 Vehicles | 50 (42.7%) | 62 (100.0%) |
| 3 Vehicles | 54 (46.2%) | 0 (0.0%) |
| 4 Vehicles | 0 (0.0%) | 0 (0.0%) |
| 5 or more Vehicles | 0 (0.0%) | 0 (0.0%) |
| Total | 117 (100.0%) | 62 (100.0%) |
Commute Time in Americus
The most frequently occuring commute durations in Americus are 25 to 29 minutes (70 commuters, 39.1%), 40 to 44 minutes (34 commuters, 19.0%), and 15 to 19 minutes (27 commuters, 15.1%).
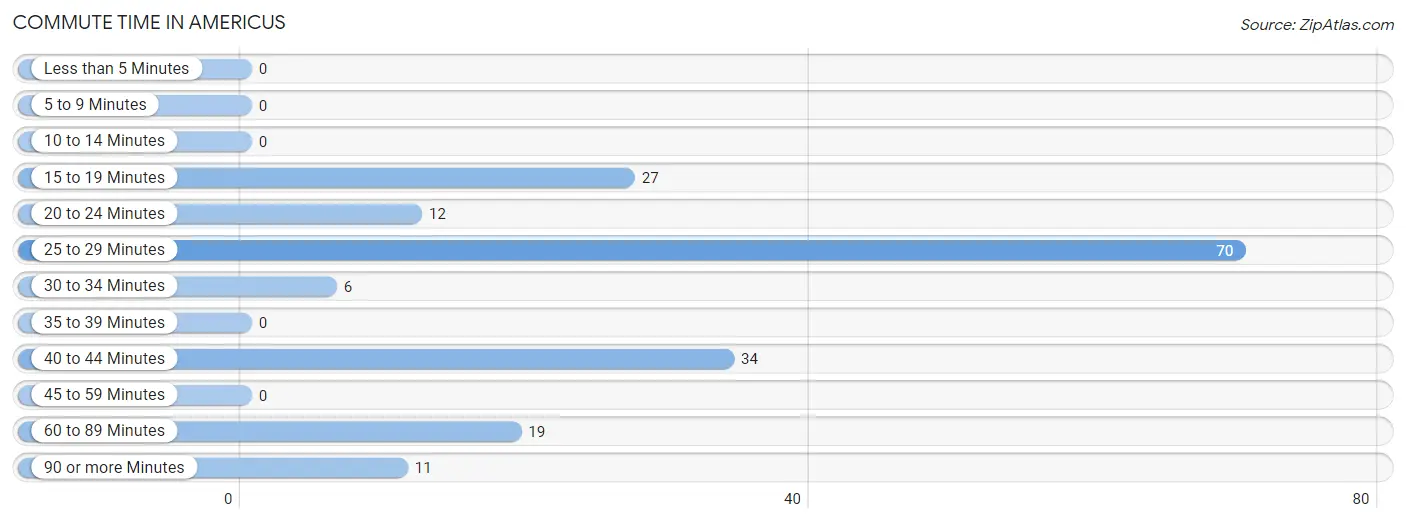
| Commute Time | # Commuters | % Commuters |
| Less than 5 Minutes | 0 | 0.0% |
| 5 to 9 Minutes | 0 | 0.0% |
| 10 to 14 Minutes | 0 | 0.0% |
| 15 to 19 Minutes | 27 | 15.1% |
| 20 to 24 Minutes | 12 | 6.7% |
| 25 to 29 Minutes | 70 | 39.1% |
| 30 to 34 Minutes | 6 | 3.4% |
| 35 to 39 Minutes | 0 | 0.0% |
| 40 to 44 Minutes | 34 | 19.0% |
| 45 to 59 Minutes | 0 | 0.0% |
| 60 to 89 Minutes | 19 | 10.6% |
| 90 or more Minutes | 11 | 6.1% |
Commute Time by Sex in Americus
The most common commute times in Americus are 25 to 29 minutes (70 commuters, 59.8%) for males and 60 to 89 minutes (19 commuters, 30.6%) for females.
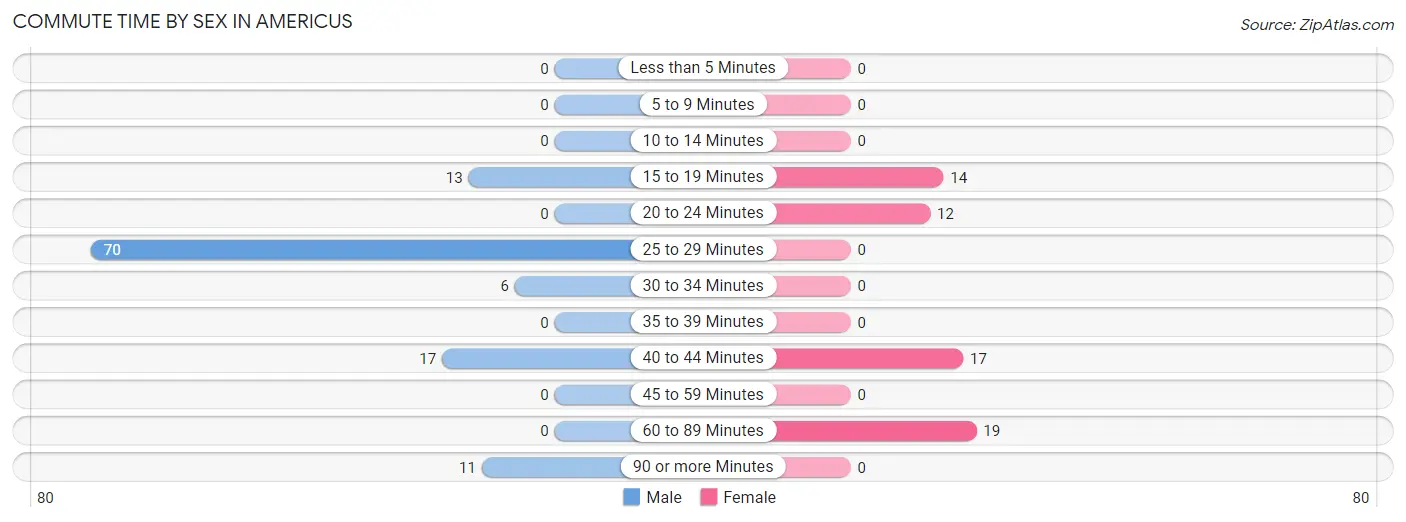
| Commute Time | Male | Female |
| Less than 5 Minutes | 0 (0.0%) | 0 (0.0%) |
| 5 to 9 Minutes | 0 (0.0%) | 0 (0.0%) |
| 10 to 14 Minutes | 0 (0.0%) | 0 (0.0%) |
| 15 to 19 Minutes | 13 (11.1%) | 14 (22.6%) |
| 20 to 24 Minutes | 0 (0.0%) | 12 (19.4%) |
| 25 to 29 Minutes | 70 (59.8%) | 0 (0.0%) |
| 30 to 34 Minutes | 6 (5.1%) | 0 (0.0%) |
| 35 to 39 Minutes | 0 (0.0%) | 0 (0.0%) |
| 40 to 44 Minutes | 17 (14.5%) | 17 (27.4%) |
| 45 to 59 Minutes | 0 (0.0%) | 0 (0.0%) |
| 60 to 89 Minutes | 0 (0.0%) | 19 (30.6%) |
| 90 or more Minutes | 11 (9.4%) | 0 (0.0%) |
Time of Departure to Work by Sex in Americus
The most frequent times of departure to work in Americus are 8:00 AM to 8:29 AM (71, 60.7%) for males and 6:00 AM to 6:29 AM (19, 30.6%) for females.
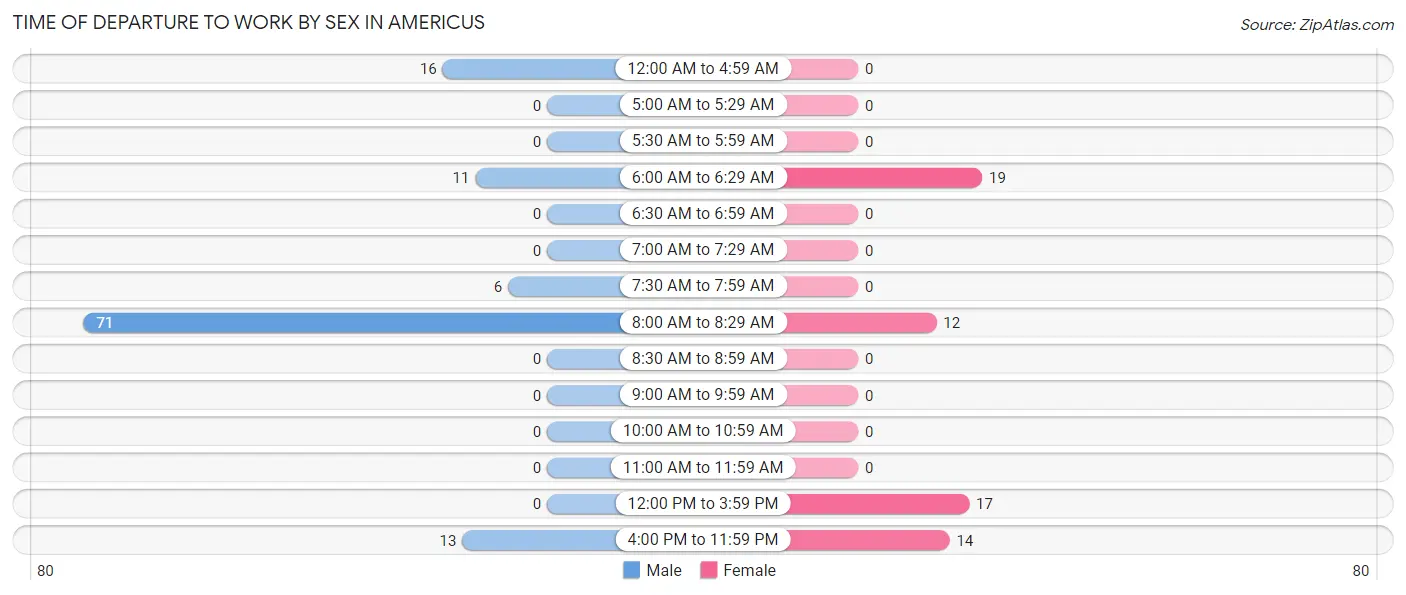
| Time of Departure | Male | Female |
| 12:00 AM to 4:59 AM | 16 (13.7%) | 0 (0.0%) |
| 5:00 AM to 5:29 AM | 0 (0.0%) | 0 (0.0%) |
| 5:30 AM to 5:59 AM | 0 (0.0%) | 0 (0.0%) |
| 6:00 AM to 6:29 AM | 11 (9.4%) | 19 (30.6%) |
| 6:30 AM to 6:59 AM | 0 (0.0%) | 0 (0.0%) |
| 7:00 AM to 7:29 AM | 0 (0.0%) | 0 (0.0%) |
| 7:30 AM to 7:59 AM | 6 (5.1%) | 0 (0.0%) |
| 8:00 AM to 8:29 AM | 71 (60.7%) | 12 (19.4%) |
| 8:30 AM to 8:59 AM | 0 (0.0%) | 0 (0.0%) |
| 9:00 AM to 9:59 AM | 0 (0.0%) | 0 (0.0%) |
| 10:00 AM to 10:59 AM | 0 (0.0%) | 0 (0.0%) |
| 11:00 AM to 11:59 AM | 0 (0.0%) | 0 (0.0%) |
| 12:00 PM to 3:59 PM | 0 (0.0%) | 17 (27.4%) |
| 4:00 PM to 11:59 PM | 13 (11.1%) | 14 (22.6%) |
| Total | 117 (100.0%) | 62 (100.0%) |
Housing Occupancy in Americus
Occupancy by Ownership in Americus
Of the total 168 dwellings in Americus, owner-occupied units account for 143 (85.1%), while renter-occupied units make up 25 (14.9%).
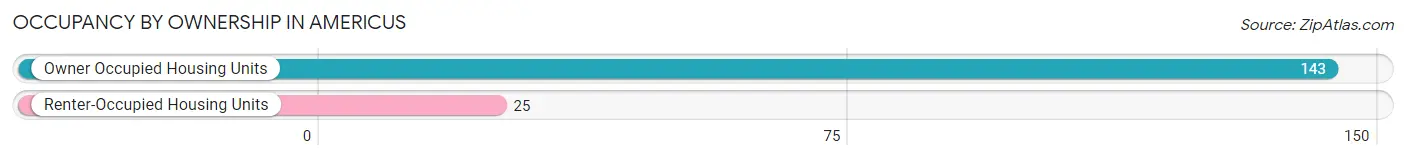
| Occupancy | # Housing Units | % Housing Units |
| Owner Occupied Housing Units | 143 | 85.1% |
| Renter-Occupied Housing Units | 25 | 14.9% |
| Total Occupied Housing Units | 168 | 100.0% |
Occupancy by Household Size in Americus
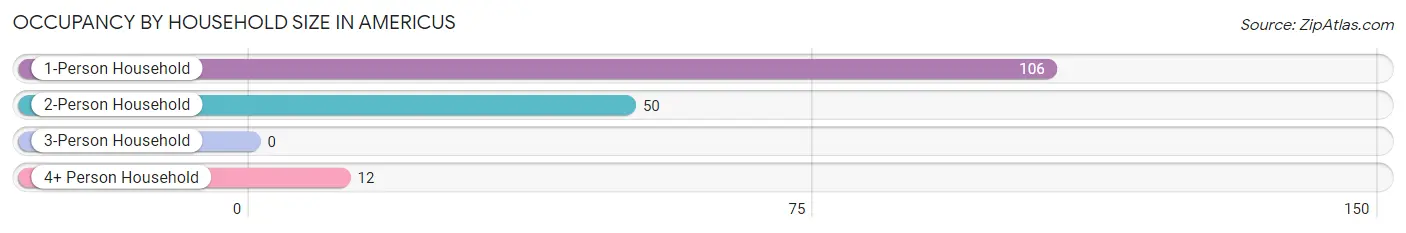
| Household Size | # Housing Units | % Housing Units |
| 1-Person Household | 106 | 63.1% |
| 2-Person Household | 50 | 29.8% |
| 3-Person Household | 0 | 0.0% |
| 4+ Person Household | 12 | 7.1% |
| Total Housing Units | 168 | 100.0% |
Occupancy by Ownership by Household Size in Americus
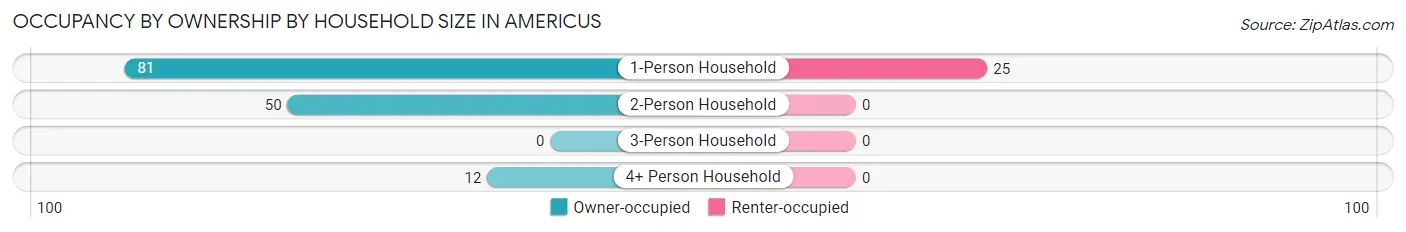
| Household Size | Owner-occupied | Renter-occupied |
| 1-Person Household | 81 (76.4%) | 25 (23.6%) |
| 2-Person Household | 50 (100.0%) | 0 (0.0%) |
| 3-Person Household | 0 (0.0%) | 0 (0.0%) |
| 4+ Person Household | 12 (100.0%) | 0 (0.0%) |
| Total Housing Units | 143 (85.1%) | 25 (14.9%) |
Occupancy by Educational Attainment in Americus
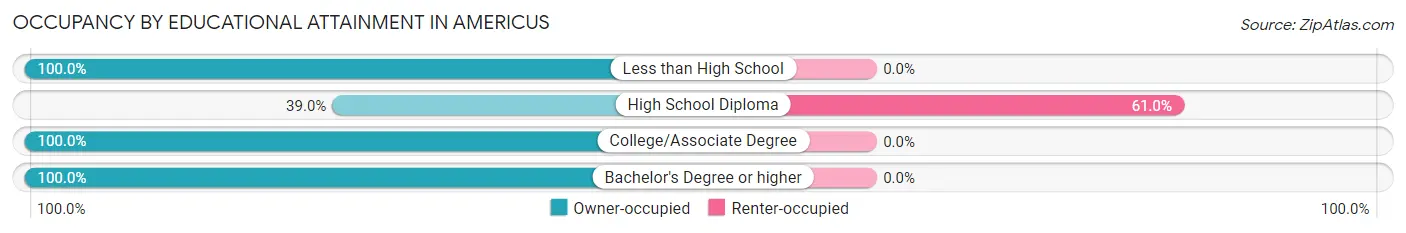
| Household Size | Owner-occupied | Renter-occupied |
| Less than High School | 17 (100.0%) | 0 (0.0%) |
| High School Diploma | 16 (39.0%) | 25 (61.0%) |
| College/Associate Degree | 31 (100.0%) | 0 (0.0%) |
| Bachelor's Degree or higher | 79 (100.0%) | 0 (0.0%) |
Occupancy by Age of Householder in Americus
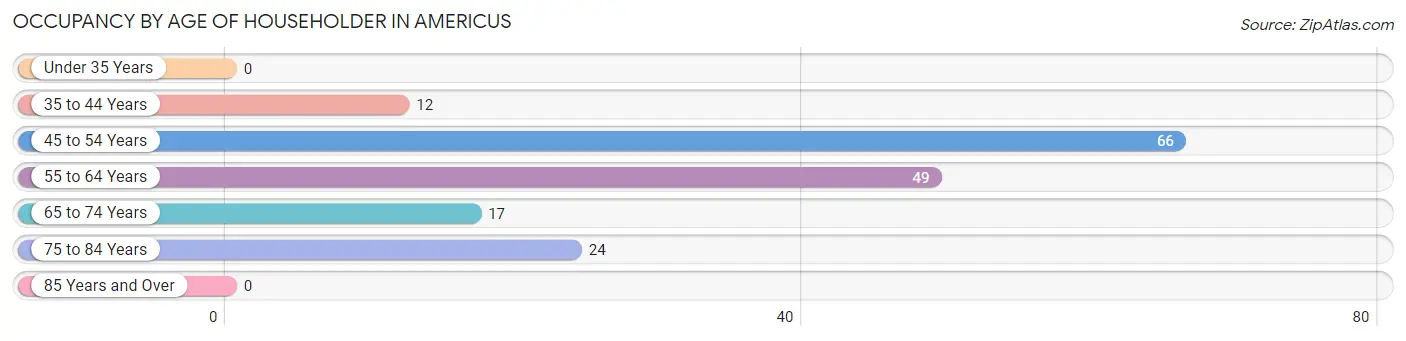
| Age Bracket | # Households | % Households |
| Under 35 Years | 0 | 0.0% |
| 35 to 44 Years | 12 | 7.1% |
| 45 to 54 Years | 66 | 39.3% |
| 55 to 64 Years | 49 | 29.2% |
| 65 to 74 Years | 17 | 10.1% |
| 75 to 84 Years | 24 | 14.3% |
| 85 Years and Over | 0 | 0.0% |
| Total | 168 | 100.0% |
Housing Finances in Americus
Median Income by Occupancy in Americus
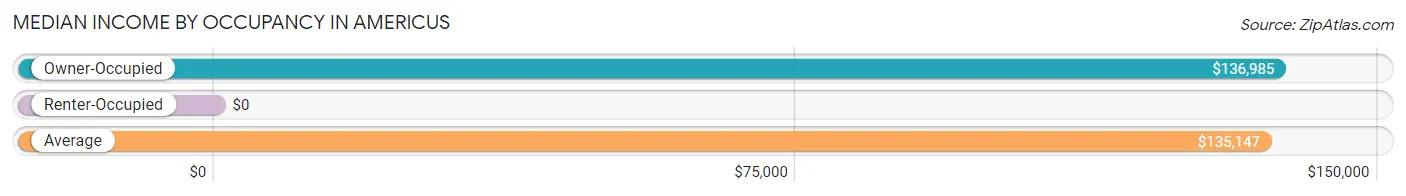
| Occupancy Type | # Households | Median Income |
| Owner-Occupied | 143 (85.1%) | $136,985 |
| Renter-Occupied | 25 (14.9%) | $0 |
| Average | 168 (100.0%) | $135,147 |
Occupancy by Householder Income Bracket in Americus
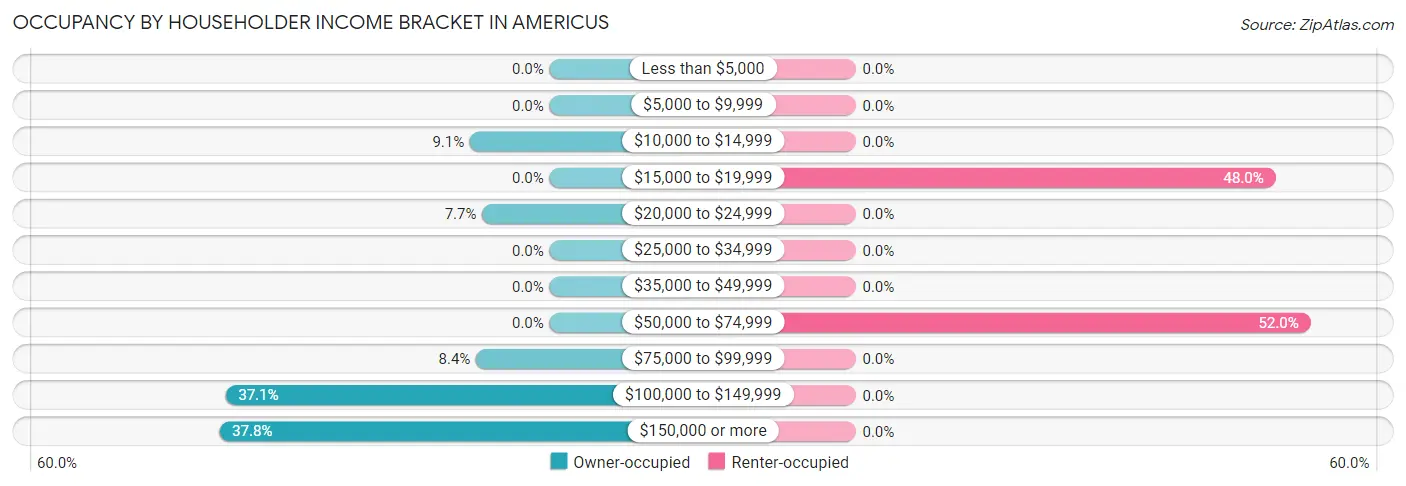
| Income Bracket | Owner-occupied | Renter-occupied |
| Less than $5,000 | 0 (0.0%) | 0 (0.0%) |
| $5,000 to $9,999 | 0 (0.0%) | 0 (0.0%) |
| $10,000 to $14,999 | 13 (9.1%) | 0 (0.0%) |
| $15,000 to $19,999 | 0 (0.0%) | 12 (48.0%) |
| $20,000 to $24,999 | 11 (7.7%) | 0 (0.0%) |
| $25,000 to $34,999 | 0 (0.0%) | 0 (0.0%) |
| $35,000 to $49,999 | 0 (0.0%) | 0 (0.0%) |
| $50,000 to $74,999 | 0 (0.0%) | 13 (52.0%) |
| $75,000 to $99,999 | 12 (8.4%) | 0 (0.0%) |
| $100,000 to $149,999 | 53 (37.1%) | 0 (0.0%) |
| $150,000 or more | 54 (37.8%) | 0 (0.0%) |
| Total | 143 (100.0%) | 25 (100.0%) |
Monthly Housing Cost Tiers in Americus
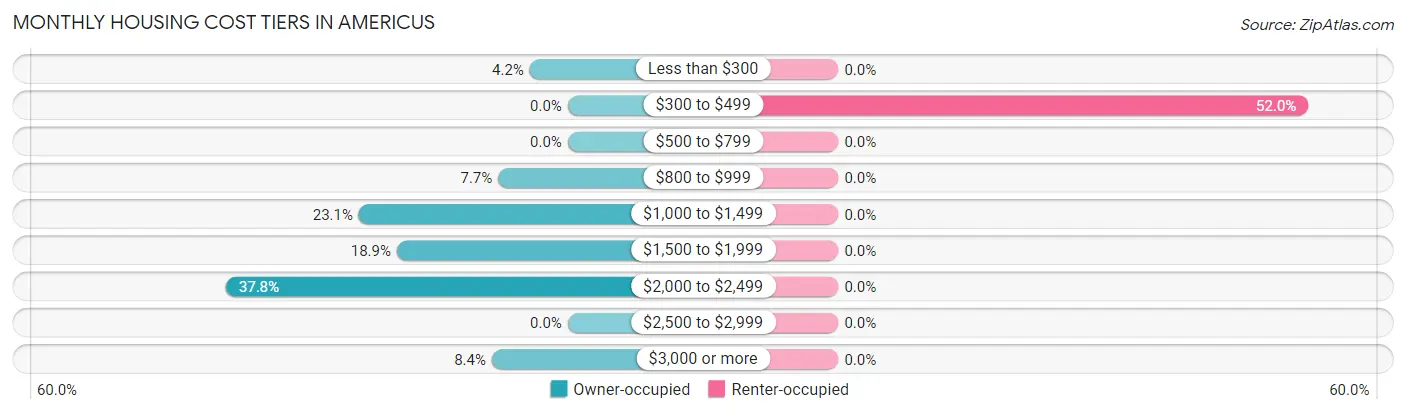
| Monthly Cost | Owner-occupied | Renter-occupied |
| Less than $300 | 6 (4.2%) | 0 (0.0%) |
| $300 to $499 | 0 (0.0%) | 13 (52.0%) |
| $500 to $799 | 0 (0.0%) | 0 (0.0%) |
| $800 to $999 | 11 (7.7%) | 0 (0.0%) |
| $1,000 to $1,499 | 33 (23.1%) | 0 (0.0%) |
| $1,500 to $1,999 | 27 (18.9%) | 0 (0.0%) |
| $2,000 to $2,499 | 54 (37.8%) | 0 (0.0%) |
| $2,500 to $2,999 | 0 (0.0%) | 0 (0.0%) |
| $3,000 or more | 12 (8.4%) | 0 (0.0%) |
| Total | 143 (100.0%) | 25 (100.0%) |
Physical Housing Characteristics in Americus
Housing Structures in Americus
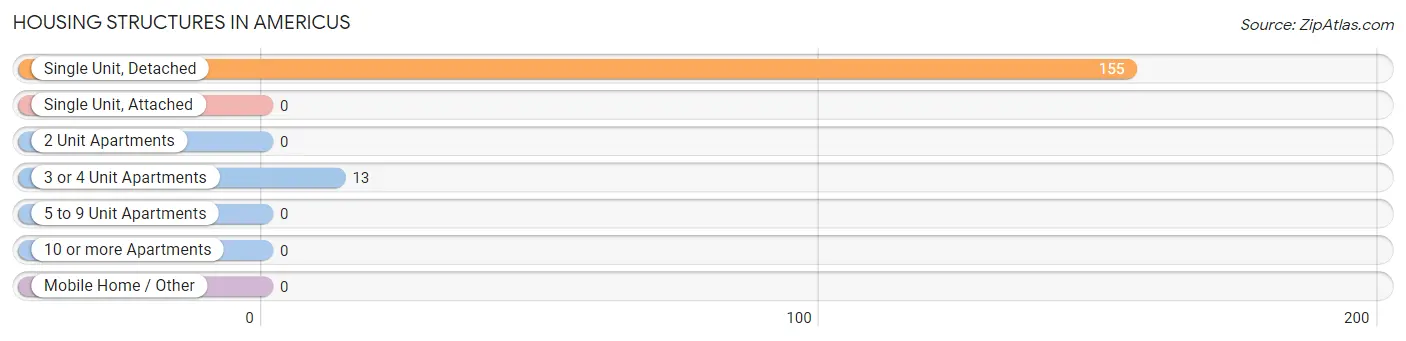
| Structure Type | # Housing Units | % Housing Units |
| Single Unit, Detached | 155 | 92.3% |
| Single Unit, Attached | 0 | 0.0% |
| 2 Unit Apartments | 0 | 0.0% |
| 3 or 4 Unit Apartments | 13 | 7.7% |
| 5 to 9 Unit Apartments | 0 | 0.0% |
| 10 or more Apartments | 0 | 0.0% |
| Mobile Home / Other | 0 | 0.0% |
| Total | 168 | 100.0% |
Housing Structures by Occupancy in Americus
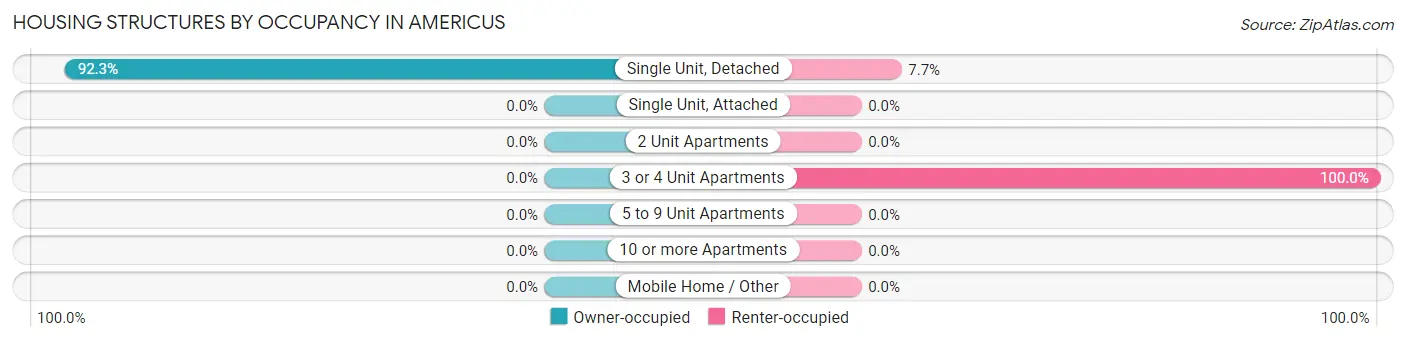
| Structure Type | Owner-occupied | Renter-occupied |
| Single Unit, Detached | 143 (92.3%) | 12 (7.7%) |
| Single Unit, Attached | 0 (0.0%) | 0 (0.0%) |
| 2 Unit Apartments | 0 (0.0%) | 0 (0.0%) |
| 3 or 4 Unit Apartments | 0 (0.0%) | 13 (100.0%) |
| 5 to 9 Unit Apartments | 0 (0.0%) | 0 (0.0%) |
| 10 or more Apartments | 0 (0.0%) | 0 (0.0%) |
| Mobile Home / Other | 0 (0.0%) | 0 (0.0%) |
| Total | 143 (85.1%) | 25 (14.9%) |
Housing Structures by Number of Rooms in Americus
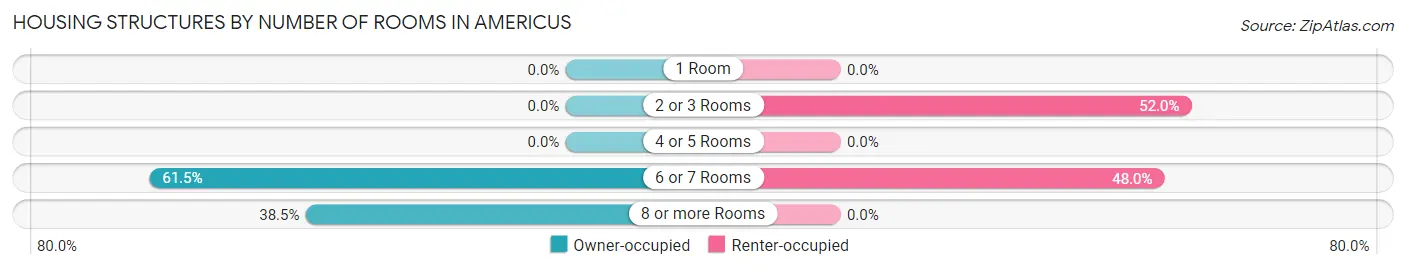
| Number of Rooms | Owner-occupied | Renter-occupied |
| 1 Room | 0 (0.0%) | 0 (0.0%) |
| 2 or 3 Rooms | 0 (0.0%) | 13 (52.0%) |
| 4 or 5 Rooms | 0 (0.0%) | 0 (0.0%) |
| 6 or 7 Rooms | 88 (61.5%) | 12 (48.0%) |
| 8 or more Rooms | 55 (38.5%) | 0 (0.0%) |
| Total | 143 (100.0%) | 25 (100.0%) |
Housing Structure by Heating Type in Americus
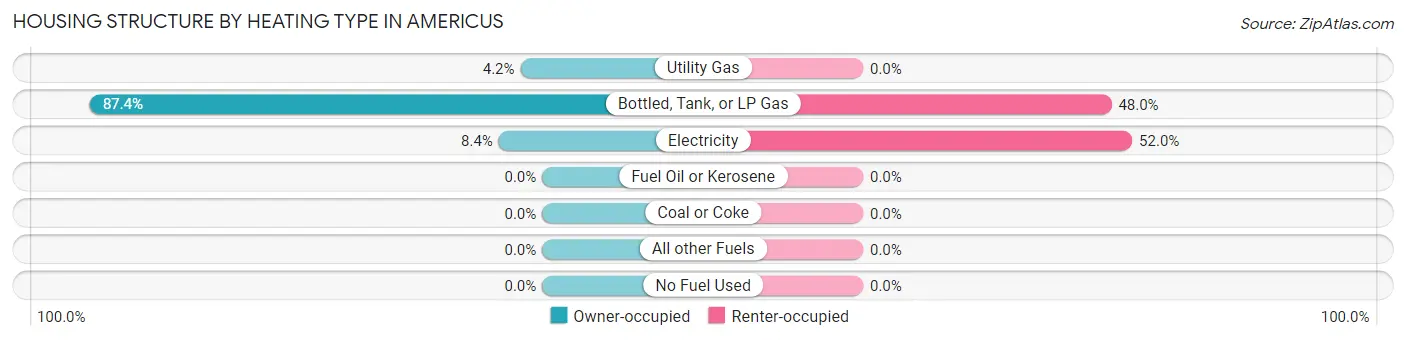
| Heating Type | Owner-occupied | Renter-occupied |
| Utility Gas | 6 (4.2%) | 0 (0.0%) |
| Bottled, Tank, or LP Gas | 125 (87.4%) | 12 (48.0%) |
| Electricity | 12 (8.4%) | 13 (52.0%) |
| Fuel Oil or Kerosene | 0 (0.0%) | 0 (0.0%) |
| Coal or Coke | 0 (0.0%) | 0 (0.0%) |
| All other Fuels | 0 (0.0%) | 0 (0.0%) |
| No Fuel Used | 0 (0.0%) | 0 (0.0%) |
| Total | 143 (100.0%) | 25 (100.0%) |
Household Vehicle Usage in Americus
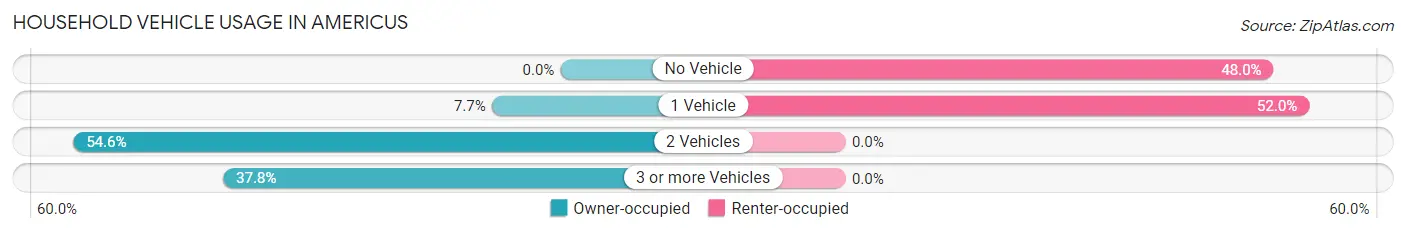
| Vehicles per Household | Owner-occupied | Renter-occupied |
| No Vehicle | 0 (0.0%) | 12 (48.0%) |
| 1 Vehicle | 11 (7.7%) | 13 (52.0%) |
| 2 Vehicles | 78 (54.5%) | 0 (0.0%) |
| 3 or more Vehicles | 54 (37.8%) | 0 (0.0%) |
| Total | 143 (100.0%) | 25 (100.0%) |
Real Estate & Mortgages in Americus
Real Estate and Mortgage Overview in Americus
| Characteristic | Without Mortgage | With Mortgage |
| Housing Units | 6 | 137 |
| Median Property Value | - | - |
| Median Household Income | - | - |
| Monthly Housing Costs | - | - |
| Real Estate Taxes | - | - |
Property Value by Mortgage Status in Americus
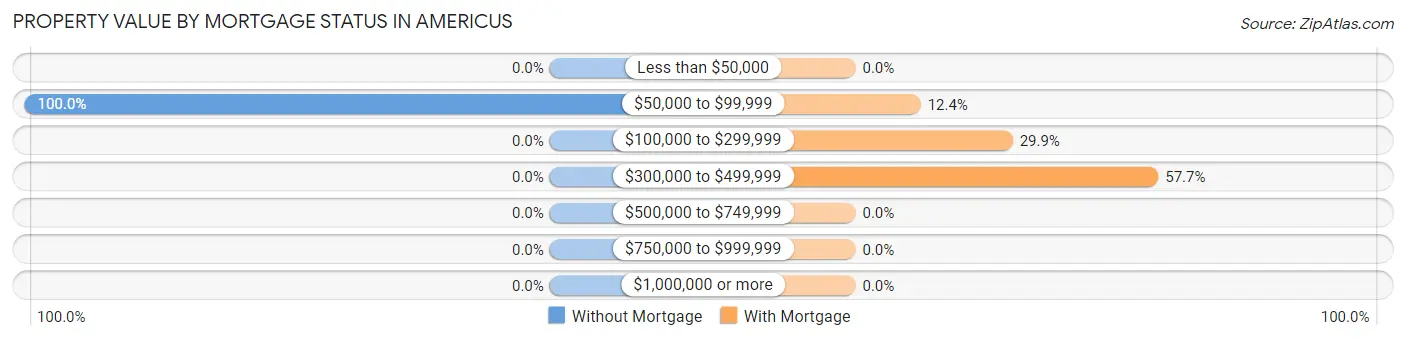
| Property Value | Without Mortgage | With Mortgage |
| Less than $50,000 | 0 (0.0%) | 0 (0.0%) |
| $50,000 to $99,999 | 6 (100.0%) | 17 (12.4%) |
| $100,000 to $299,999 | 0 (0.0%) | 41 (29.9%) |
| $300,000 to $499,999 | 0 (0.0%) | 79 (57.7%) |
| $500,000 to $749,999 | 0 (0.0%) | 0 (0.0%) |
| $750,000 to $999,999 | 0 (0.0%) | 0 (0.0%) |
| $1,000,000 or more | 0 (0.0%) | 0 (0.0%) |
| Total | 6 (100.0%) | 137 (100.0%) |
Household Income by Mortgage Status in Americus
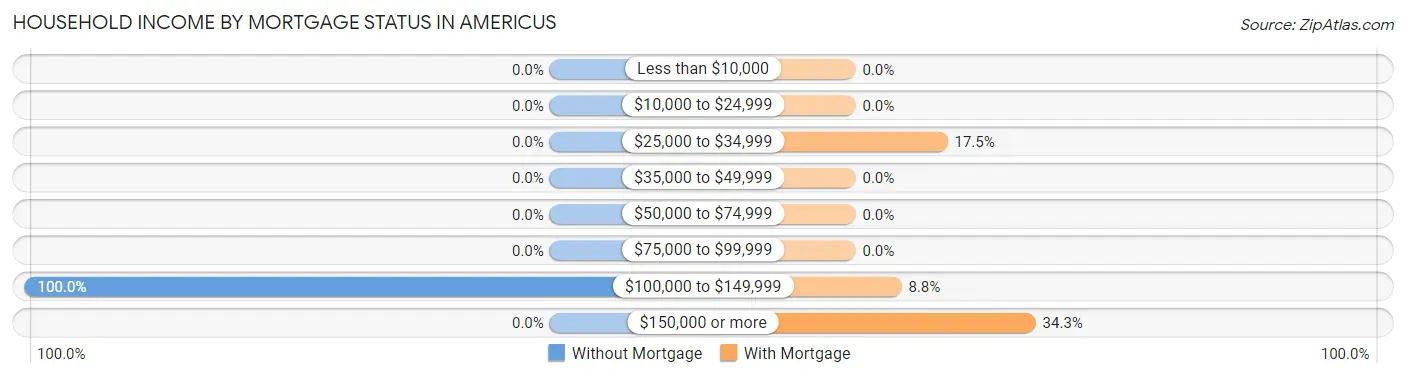
| Household Income | Without Mortgage | With Mortgage |
| Less than $10,000 | 0 (0.0%) | 0 (0.0%) |
| $10,000 to $24,999 | 0 (0.0%) | 0 (0.0%) |
| $25,000 to $34,999 | 0 (0.0%) | 24 (17.5%) |
| $35,000 to $49,999 | 0 (0.0%) | 0 (0.0%) |
| $50,000 to $74,999 | 0 (0.0%) | 0 (0.0%) |
| $75,000 to $99,999 | 0 (0.0%) | 0 (0.0%) |
| $100,000 to $149,999 | 6 (100.0%) | 12 (8.8%) |
| $150,000 or more | 0 (0.0%) | 47 (34.3%) |
| Total | 6 (100.0%) | 137 (100.0%) |
Property Value to Household Income Ratio in Americus
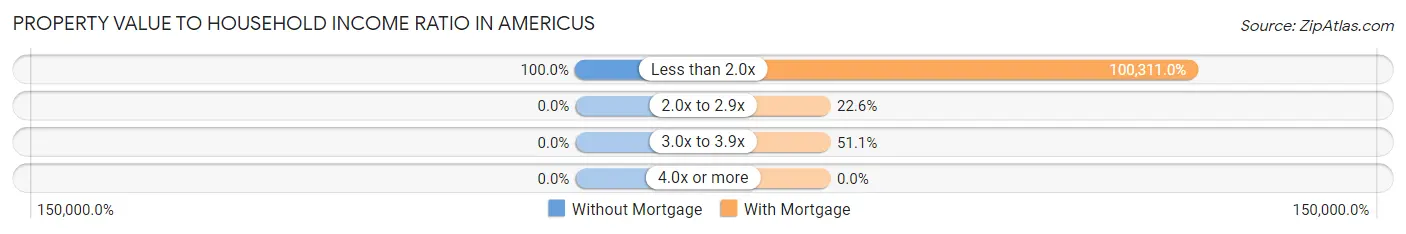
| Value-to-Income Ratio | Without Mortgage | With Mortgage |
| Less than 2.0x | 6 (100.0%) | 137,426 (100,311.0%) |
| 2.0x to 2.9x | 0 (0.0%) | 31 (22.6%) |
| 3.0x to 3.9x | 0 (0.0%) | 70 (51.1%) |
| 4.0x or more | 0 (0.0%) | 0 (0.0%) |
| Total | 6 (100.0%) | 137 (100.0%) |
Real Estate Taxes by Mortgage Status in Americus
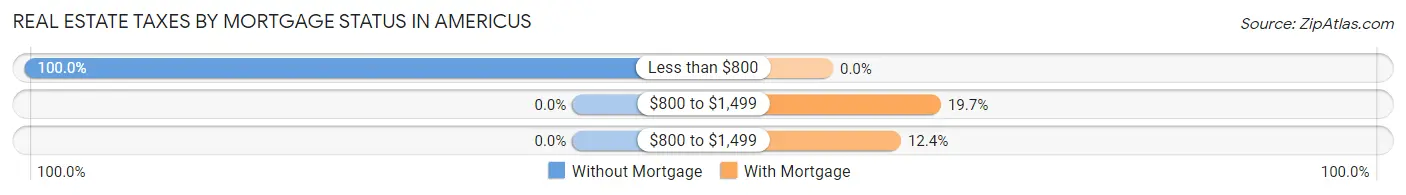
| Property Taxes | Without Mortgage | With Mortgage |
| Less than $800 | 6 (100.0%) | 0 (0.0%) |
| $800 to $1,499 | 0 (0.0%) | 27 (19.7%) |
| $800 to $1,499 | 0 (0.0%) | 17 (12.4%) |
| Total | 6 (100.0%) | 137 (100.0%) |
Health & Disability in Americus
Health Insurance Coverage by Age in Americus
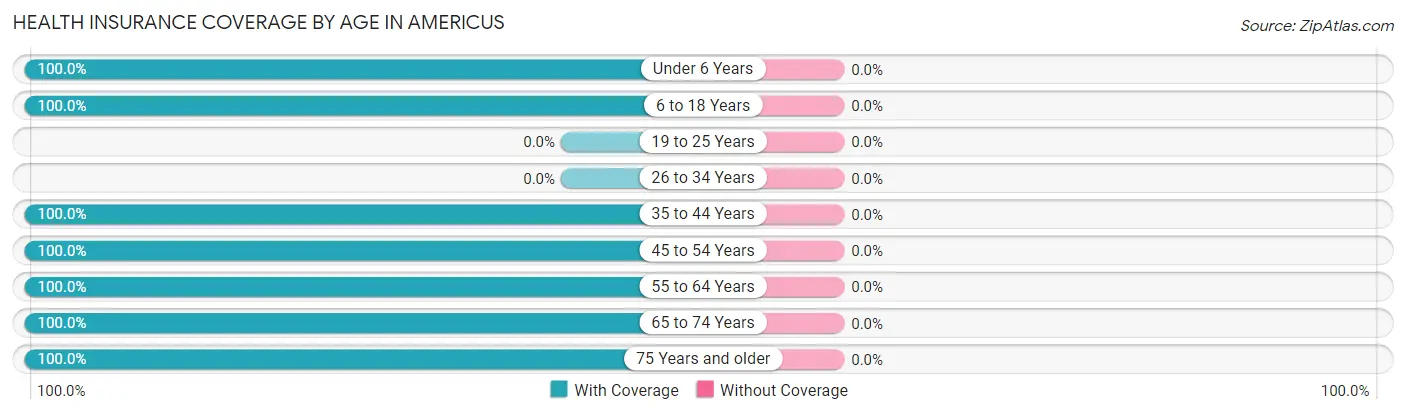
| Age Bracket | With Coverage | Without Coverage |
| Under 6 Years | 26 (100.0%) | 0 (0.0%) |
| 6 to 18 Years | 15 (100.0%) | 0 (0.0%) |
| 19 to 25 Years | 0 (0.0%) | 0 (0.0%) |
| 26 to 34 Years | 0 (0.0%) | 0 (0.0%) |
| 35 to 44 Years | 23 (100.0%) | 0 (0.0%) |
| 45 to 54 Years | 80 (100.0%) | 0 (0.0%) |
| 55 to 64 Years | 85 (100.0%) | 0 (0.0%) |
| 65 to 74 Years | 33 (100.0%) | 0 (0.0%) |
| 75 Years and older | 24 (100.0%) | 0 (0.0%) |
| Total | 286 (100.0%) | 0 (0.0%) |
Health Insurance Coverage by Citizenship Status in Americus
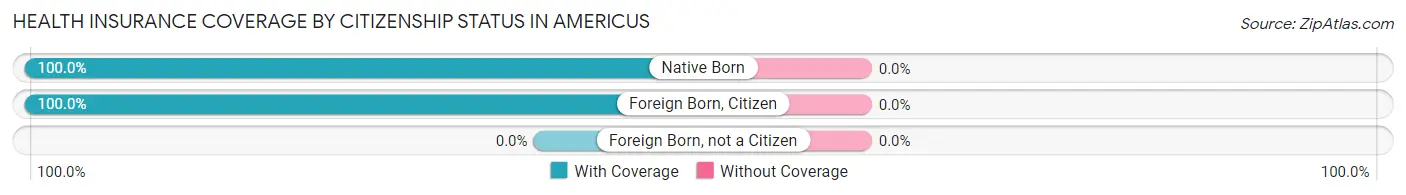
| Citizenship Status | With Coverage | Without Coverage |
| Native Born | 26 (100.0%) | 0 (0.0%) |
| Foreign Born, Citizen | 15 (100.0%) | 0 (0.0%) |
| Foreign Born, not a Citizen | 0 (0.0%) | 0 (0.0%) |
Health Insurance Coverage by Household Income in Americus
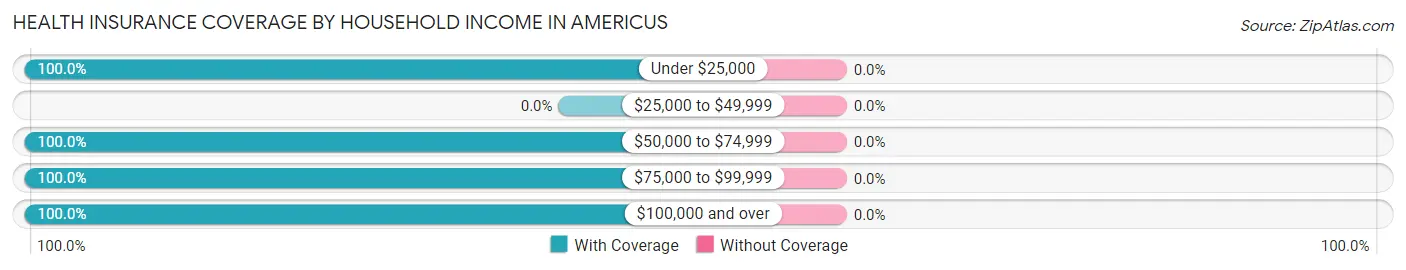
| Household Income | With Coverage | Without Coverage |
| Under $25,000 | 52 (100.0%) | 0 (0.0%) |
| $25,000 to $49,999 | 0 (0.0%) | 0 (0.0%) |
| $50,000 to $74,999 | 13 (100.0%) | 0 (0.0%) |
| $75,000 to $99,999 | 64 (100.0%) | 0 (0.0%) |
| $100,000 and over | 157 (100.0%) | 0 (0.0%) |
Public vs Private Health Insurance Coverage by Age in Americus
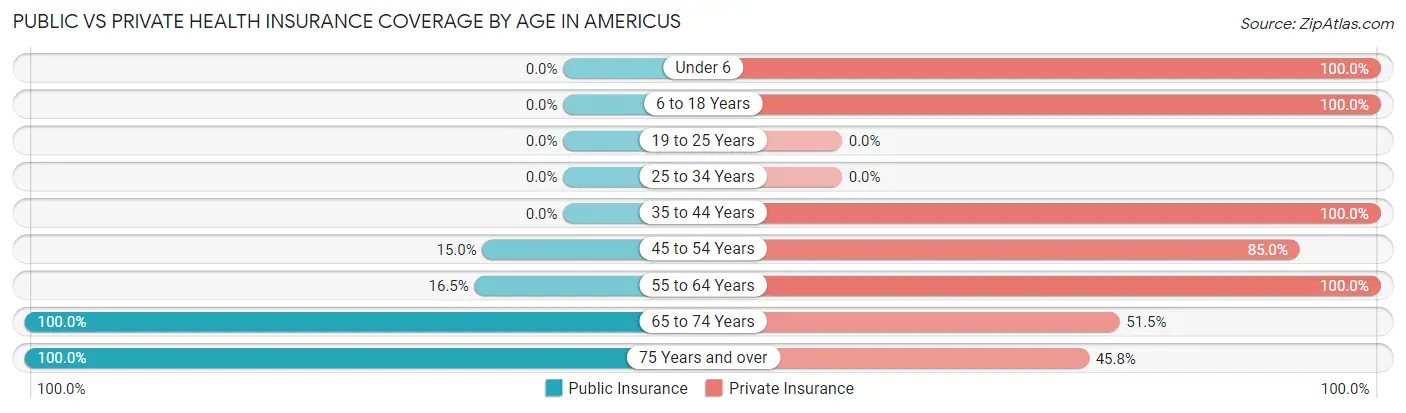
| Age Bracket | Public Insurance | Private Insurance |
| Under 6 | 0 (0.0%) | 26 (100.0%) |
| 6 to 18 Years | 0 (0.0%) | 15 (100.0%) |
| 19 to 25 Years | 0 (0.0%) | 0 (0.0%) |
| 25 to 34 Years | 0 (0.0%) | 0 (0.0%) |
| 35 to 44 Years | 0 (0.0%) | 23 (100.0%) |
| 45 to 54 Years | 12 (15.0%) | 68 (85.0%) |
| 55 to 64 Years | 14 (16.5%) | 85 (100.0%) |
| 65 to 74 Years | 33 (100.0%) | 17 (51.5%) |
| 75 Years and over | 24 (100.0%) | 11 (45.8%) |
| Total | 83 (29.0%) | 245 (85.7%) |
Disability Status by Sex by Age in Americus
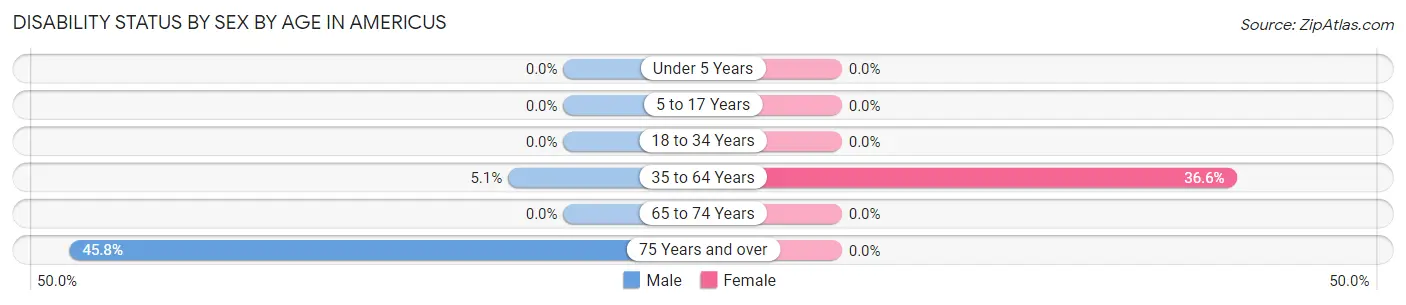
| Age Bracket | Male | Female |
| Under 5 Years | 0 (0.0%) | 0 (0.0%) |
| 5 to 17 Years | 0 (0.0%) | 0 (0.0%) |
| 18 to 34 Years | 0 (0.0%) | 0 (0.0%) |
| 35 to 64 Years | 6 (5.1%) | 26 (36.6%) |
| 65 to 74 Years | 0 (0.0%) | 0 (0.0%) |
| 75 Years and over | 11 (45.8%) | 0 (0.0%) |
Disability Class by Sex by Age in Americus
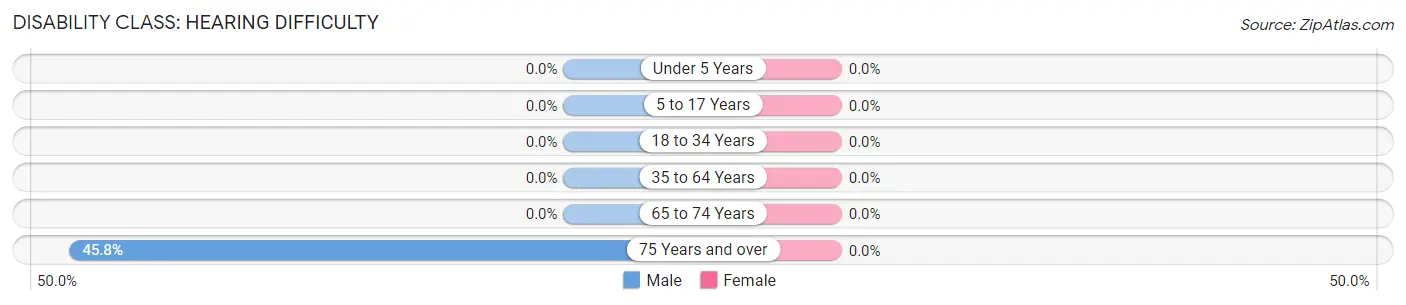
Disability Class: Hearing Difficulty
| Age Bracket | Male | Female |
| Under 5 Years | 0 (0.0%) | 0 (0.0%) |
| 5 to 17 Years | 0 (0.0%) | 0 (0.0%) |
| 18 to 34 Years | 0 (0.0%) | 0 (0.0%) |
| 35 to 64 Years | 0 (0.0%) | 0 (0.0%) |
| 65 to 74 Years | 0 (0.0%) | 0 (0.0%) |
| 75 Years and over | 11 (45.8%) | 0 (0.0%) |
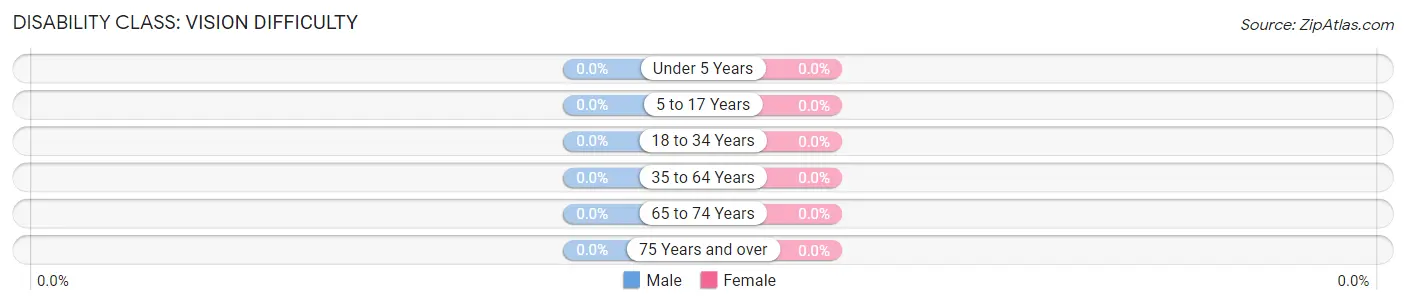
Disability Class: Vision Difficulty
| Age Bracket | Male | Female |
| Under 5 Years | 0 (0.0%) | 0 (0.0%) |
| 5 to 17 Years | 0 (0.0%) | 0 (0.0%) |
| 18 to 34 Years | 0 (0.0%) | 0 (0.0%) |
| 35 to 64 Years | 0 (0.0%) | 0 (0.0%) |
| 65 to 74 Years | 0 (0.0%) | 0 (0.0%) |
| 75 Years and over | 0 (0.0%) | 0 (0.0%) |
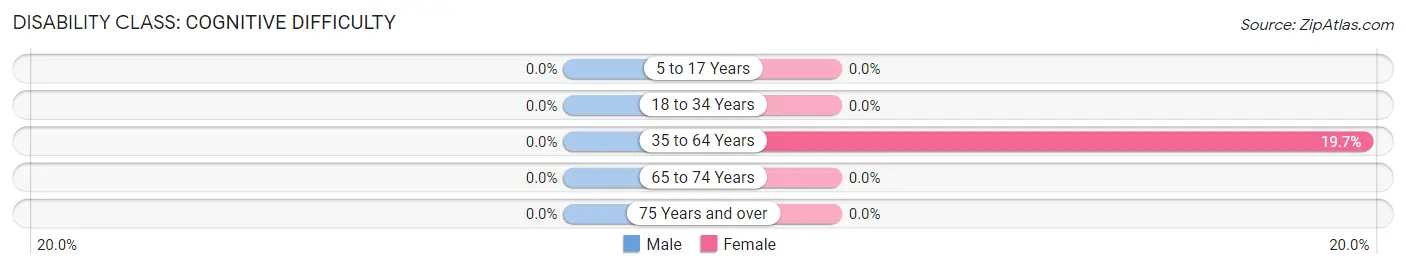
Disability Class: Cognitive Difficulty
| Age Bracket | Male | Female |
| 5 to 17 Years | 0 (0.0%) | 0 (0.0%) |
| 18 to 34 Years | 0 (0.0%) | 0 (0.0%) |
| 35 to 64 Years | 0 (0.0%) | 14 (19.7%) |
| 65 to 74 Years | 0 (0.0%) | 0 (0.0%) |
| 75 Years and over | 0 (0.0%) | 0 (0.0%) |
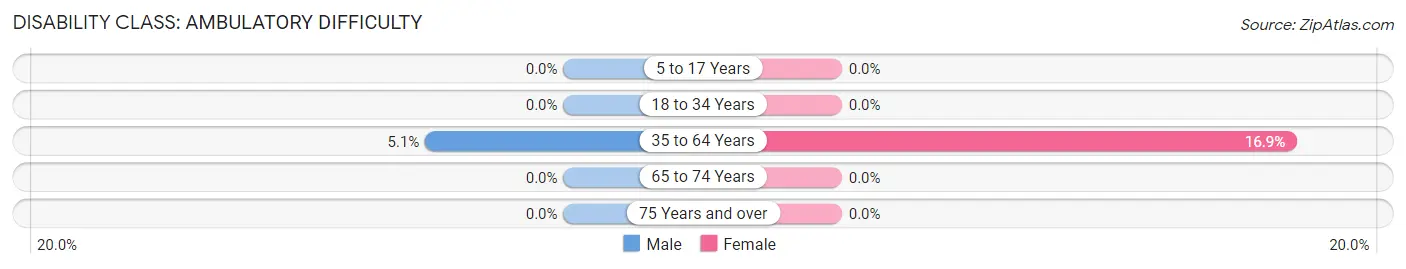
Disability Class: Ambulatory Difficulty
| Age Bracket | Male | Female |
| 5 to 17 Years | 0 (0.0%) | 0 (0.0%) |
| 18 to 34 Years | 0 (0.0%) | 0 (0.0%) |
| 35 to 64 Years | 6 (5.1%) | 12 (16.9%) |
| 65 to 74 Years | 0 (0.0%) | 0 (0.0%) |
| 75 Years and over | 0 (0.0%) | 0 (0.0%) |
Disability Class: Self-Care Difficulty
| Age Bracket | Male | Female |
| 5 to 17 Years | 0 (0.0%) | 0 (0.0%) |
| 18 to 34 Years | 0 (0.0%) | 0 (0.0%) |
| 35 to 64 Years | 0 (0.0%) | 0 (0.0%) |
| 65 to 74 Years | 0 (0.0%) | 0 (0.0%) |
| 75 Years and over | 0 (0.0%) | 0 (0.0%) |
Technology Access in Americus
Computing Device Access in Americus
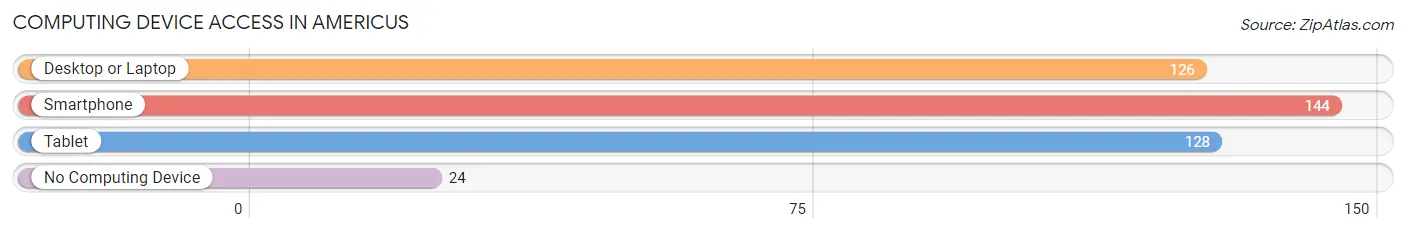
| Device Type | # Households | % Households |
| Desktop or Laptop | 126 | 75.0% |
| Smartphone | 144 | 85.7% |
| Tablet | 128 | 76.2% |
| No Computing Device | 24 | 14.3% |
| Total | 168 | 100.0% |
Internet Access in Americus
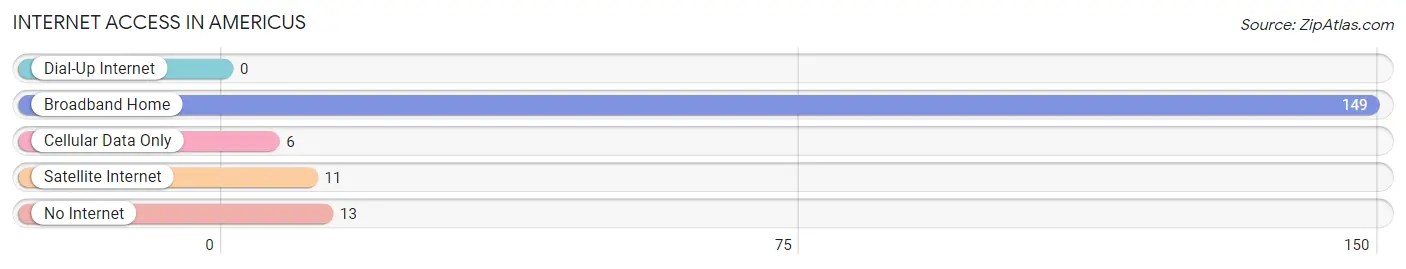
| Internet Type | # Households | % Households |
| Dial-Up Internet | 0 | 0.0% |
| Broadband Home | 149 | 88.7% |
| Cellular Data Only | 6 | 3.6% |
| Satellite Internet | 11 | 6.6% |
| No Internet | 13 | 7.7% |
| Total | 168 | 100.0% |
Americus Summary
History
The town of Americus, Indiana is located in the northern part of the state, in the county of Tippecanoe. It was founded in 1837 by a group of settlers from Ohio, led by William and Mary Ann Miller. The Millers named the town after their hometown of Americus, Ohio. The town was originally a farming community, but soon developed into a small industrial center. The first industry in the town was a sawmill, which was built in 1838. This was followed by a gristmill, a woolen mill, and a tannery.
In the late 19th century, Americus experienced a period of growth and prosperity. The town was home to several businesses, including a furniture factory, a brickyard, a canning factory, and a flour mill. The town also had a railroad station, which connected it to other towns in the area.
In the early 20th century, Americus experienced a decline in its industrial base. The sawmill and gristmill closed, and the woolen mill and tannery were destroyed by fire. The town's population also declined, from a peak of 1,000 in 1900 to just over 500 in 1950.
Geography
Americus is located in the northern part of Tippecanoe County, Indiana. It is situated on the banks of the Wabash River, about 25 miles north of Lafayette. The town is surrounded by rolling hills and farmland. The climate is humid continental, with hot summers and cold winters.
Economy
The economy of Americus is largely based on agriculture. The town is home to several farms, which produce corn, soybeans, wheat, and hay. There are also several small businesses in the town, including a grocery store, a hardware store, and a restaurant.
Demographics
As of the 2010 census, the population of Americus was 545. The racial makeup of the town was 97.3% White, 0.7% African American, 0.2% Native American, 0.2% Asian, and 1.6% from other races. The median household income was $41,250, and the median family income was $50,000. The per capita income was $20,845. About 11.2% of the population was below the poverty line.
Common Questions
What is Per Capita Income in Americus?
Per Capita income in Americus is $73,156.
What is the Median Family Income in Americus?
Median Family Income in Americus is $121,250.
What is the Median Household income in Americus?
Median Household Income in Americus is $135,147.
What is Inequality or Gini Index in Americus?
Inequality or Gini Index in Americus is 0.33.
What is the Total Population of Americus?
Total Population of Americus is 286.
What is the Total Male Population of Americus?
Total Male Population of Americus is 154.
What is the Total Female Population of Americus?
Total Female Population of Americus is 132.
What is the Ratio of Males per 100 Females in Americus?
There are 116.67 Males per 100 Females in Americus.
What is the Ratio of Females per 100 Males in Americus?
There are 85.71 Females per 100 Males in Americus.
What is the Median Population Age in Americus?
Median Population Age in Americus is 49.9 Years.
What is the Average Family Size in Americus
Average Family Size in Americus is 2.9 People.
What is the Average Household Size in Americus
Average Household Size in Americus is 1.7 People.
How Large is the Labor Force in Americus?
There are 179 People in the Labor Forcein in Americus.
What is the Percentage of People in the Labor Force in Americus?
73.1% of People are in the Labor Force in Americus.