Altona, IN Map & Demographics
Altona Map
Altona Overview
$25,307
PER CAPITA INCOME
$61,392
AVG FAMILY INCOME
$61,392
AVG HOUSEHOLD INCOME
52.6%
WAGE / INCOME GAP [ % ]
47.4¢/ $1
WAGE / INCOME GAP [ $ ]
0.29
INEQUALITY / GINI INDEX
421
TOTAL POPULATION
212
MALE POPULATION
209
FEMALE POPULATION
101.44
MALES / 100 FEMALES
98.58
FEMALES / 100 MALES
37.2
MEDIAN AGE
3.1
AVG FAMILY SIZE
2.9
AVG HOUSEHOLD SIZE
177
LABOR FORCE [ PEOPLE ]
55.1%
PERCENT IN LABOR FORCE
2.3%
UNEMPLOYMENT RATE
Income in Altona
Income Overview in Altona
Per Capita Income in Altona is $25,307, while median incomes of families and households are $61,392 and $61,392 respectively.
| Characteristic | Number | Measure |
| Per Capita Income | 421 | $25,307 |
| Median Family Income | 119 | $61,392 |
| Mean Family Income | 119 | $66,082 |
| Median Household Income | 147 | $61,392 |
| Mean Household Income | 147 | $69,078 |
| Income Deficit | 119 | $0 |
| Wage / Income Gap (%) | 421 | 52.63% |
| Wage / Income Gap ($) | 421 | 47.37¢ per $1 |
| Gini / Inequality Index | 421 | 0.29 |
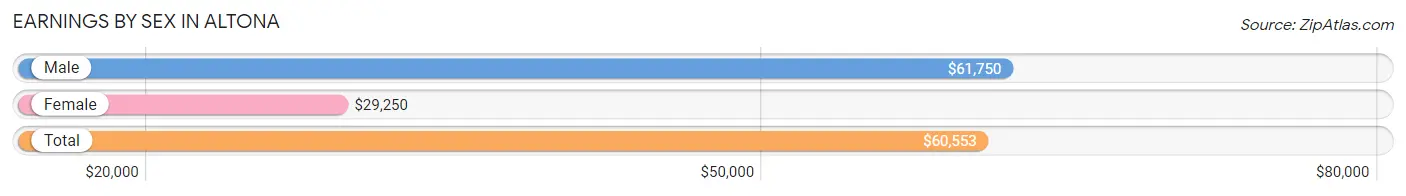
Earnings by Sex in Altona
Average Earnings in Altona are $60,553, $61,750 for men and $29,250 for women, a difference of 52.6%.
| Sex | Number | Average Earnings |
| Male | 118 (67.4%) | $61,750 |
| Female | 57 (32.6%) | $29,250 |
| Total | 175 (100.0%) | $60,553 |
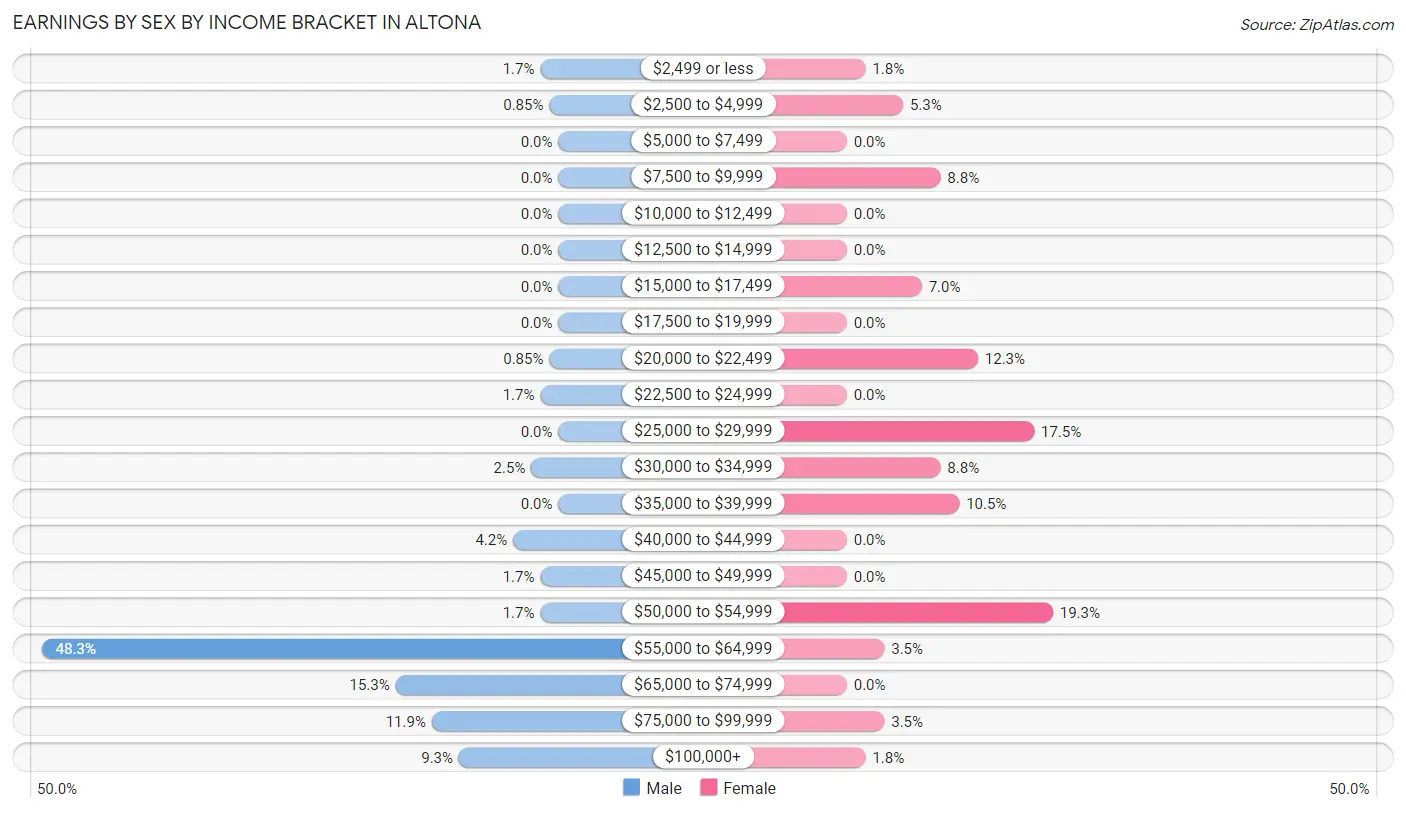
Earnings by Sex by Income Bracket in Altona
The most common earnings brackets in Altona are $55,000 to $64,999 for men (57 | 48.3%) and $50,000 to $54,999 for women (11 | 19.3%).
| Income | Male | Female |
| $2,499 or less | 2 (1.7%) | 1 (1.8%) |
| $2,500 to $4,999 | 1 (0.9%) | 3 (5.3%) |
| $5,000 to $7,499 | 0 (0.0%) | 0 (0.0%) |
| $7,500 to $9,999 | 0 (0.0%) | 5 (8.8%) |
| $10,000 to $12,499 | 0 (0.0%) | 0 (0.0%) |
| $12,500 to $14,999 | 0 (0.0%) | 0 (0.0%) |
| $15,000 to $17,499 | 0 (0.0%) | 4 (7.0%) |
| $17,500 to $19,999 | 0 (0.0%) | 0 (0.0%) |
| $20,000 to $22,499 | 1 (0.9%) | 7 (12.3%) |
| $22,500 to $24,999 | 2 (1.7%) | 0 (0.0%) |
| $25,000 to $29,999 | 0 (0.0%) | 10 (17.5%) |
| $30,000 to $34,999 | 3 (2.5%) | 5 (8.8%) |
| $35,000 to $39,999 | 0 (0.0%) | 6 (10.5%) |
| $40,000 to $44,999 | 5 (4.2%) | 0 (0.0%) |
| $45,000 to $49,999 | 2 (1.7%) | 0 (0.0%) |
| $50,000 to $54,999 | 2 (1.7%) | 11 (19.3%) |
| $55,000 to $64,999 | 57 (48.3%) | 2 (3.5%) |
| $65,000 to $74,999 | 18 (15.2%) | 0 (0.0%) |
| $75,000 to $99,999 | 14 (11.9%) | 2 (3.5%) |
| $100,000+ | 11 (9.3%) | 1 (1.8%) |
| Total | 118 (100.0%) | 57 (100.0%) |
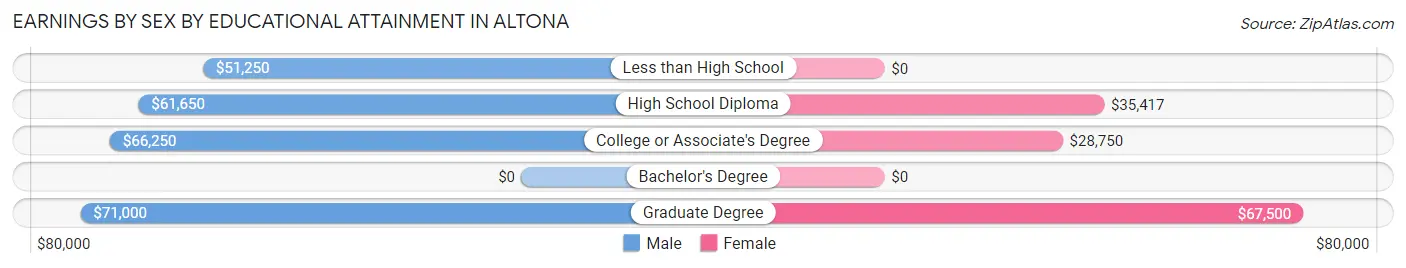
Earnings by Sex by Educational Attainment in Altona
Average earnings in Altona are $61,850 for men and $28,500 for women, a difference of 53.9%. Men with an educational attainment of graduate degree enjoy the highest average annual earnings of $71,000, while those with less than high school education earn the least with $51,250. Women with an educational attainment of graduate degree earn the most with the average annual earnings of $67,500, while those with college or associate's degree education have the smallest earnings of $28,750.
| Educational Attainment | Male Income | Female Income |
| Less than High School | $51,250 | $0 |
| High School Diploma | $61,650 | $35,417 |
| College or Associate's Degree | $66,250 | $28,750 |
| Bachelor's Degree | - | - |
| Graduate Degree | $71,000 | $67,500 |
| Total | $61,850 | $28,500 |
Family Income in Altona
Family Income Brackets in Altona
According to the Altona family income data, there are 78 families falling into the $50,000 to $74,999 income range, which is the most common income bracket and makes up 65.5% of all families.
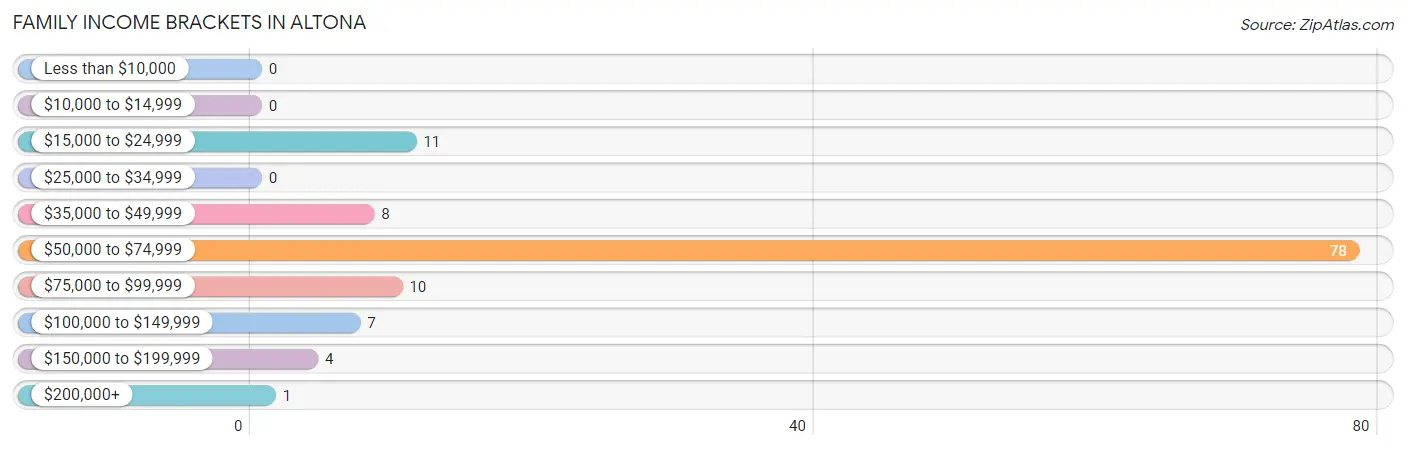
| Income Bracket | # Families | % Families |
| Less than $10,000 | 0 | 0.0% |
| $10,000 to $14,999 | 0 | 0.0% |
| $15,000 to $24,999 | 11 | 9.2% |
| $25,000 to $34,999 | 0 | 0.0% |
| $35,000 to $49,999 | 8 | 6.7% |
| $50,000 to $74,999 | 78 | 65.5% |
| $75,000 to $99,999 | 10 | 8.4% |
| $100,000 to $149,999 | 7 | 5.9% |
| $150,000 to $199,999 | 4 | 3.4% |
| $200,000+ | 1 | 0.8% |
Family Income by Famaliy Size in Altona
3-person families (69 | 58.0%) account for the highest median family income in Altona with $61,375 per family, while 3-person families (69 | 58.0%) have the highest median income of $20,458 per family member.
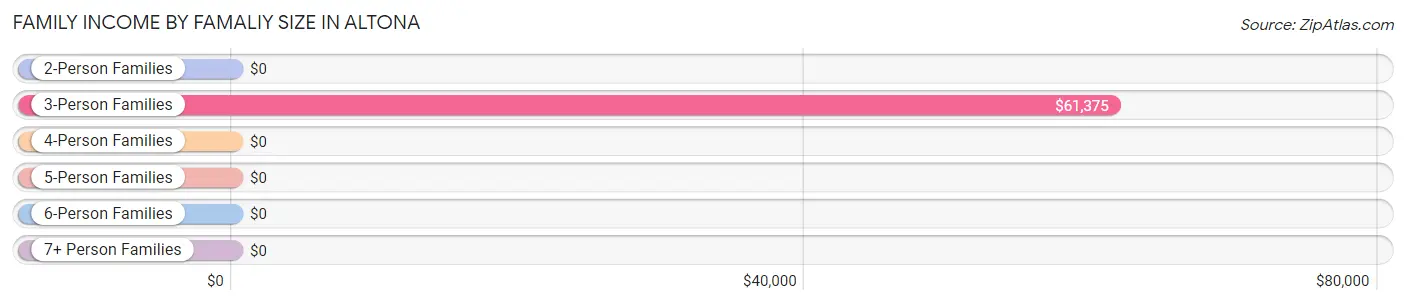
| Income Bracket | # Families | Median Income |
| 2-Person Families | 23 (19.3%) | $0 |
| 3-Person Families | 69 (58.0%) | $61,375 |
| 4-Person Families | 21 (17.6%) | $0 |
| 5-Person Families | 0 (0.0%) | $0 |
| 6-Person Families | 1 (0.8%) | $0 |
| 7+ Person Families | 5 (4.2%) | $0 |
| Total | 119 (100.0%) | $61,392 |
Family Income by Number of Earners in Altona
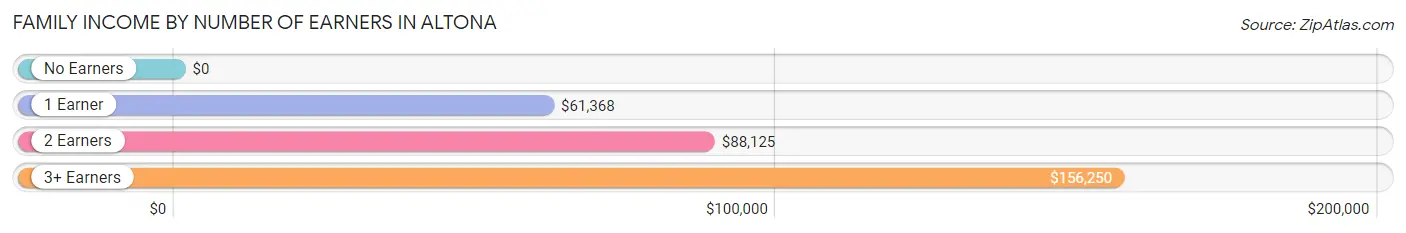
| Number of Earners | # Families | Median Income |
| No Earners | 17 (14.3%) | $0 |
| 1 Earner | 74 (62.2%) | $61,368 |
| 2 Earners | 21 (17.6%) | $88,125 |
| 3+ Earners | 7 (5.9%) | $156,250 |
| Total | 119 (100.0%) | $61,392 |
Household Income in Altona
Household Income Brackets in Altona
With 79 households falling in the category, the $50,000 to $74,999 income range is the most frequent in Altona, accounting for 53.7% of all households. In contrast, only 1 households (0.7%) fall into the $200,000+ income bracket, making it the least populous group.
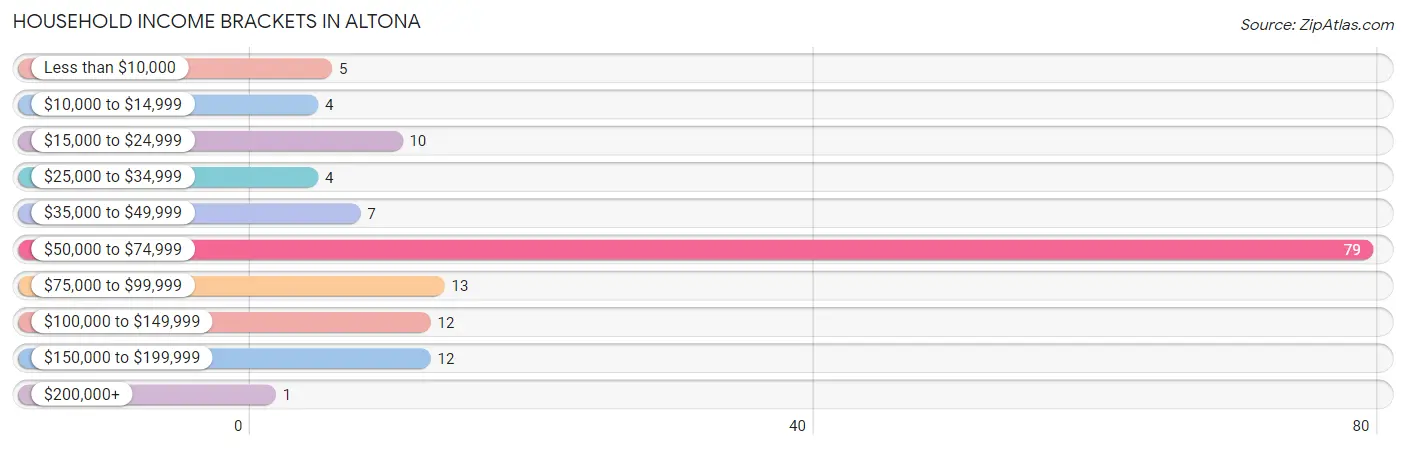
| Income Bracket | # Households | % Households |
| Less than $10,000 | 5 | 3.4% |
| $10,000 to $14,999 | 4 | 2.7% |
| $15,000 to $24,999 | 10 | 6.8% |
| $25,000 to $34,999 | 4 | 2.7% |
| $35,000 to $49,999 | 7 | 4.8% |
| $50,000 to $74,999 | 79 | 53.7% |
| $75,000 to $99,999 | 13 | 8.8% |
| $100,000 to $149,999 | 12 | 8.2% |
| $150,000 to $199,999 | 12 | 8.2% |
| $200,000+ | 1 | 0.7% |
Household Income by Householder Age in Altona
The median household income in Altona is $61,392, with the highest median household income of $89,583 found in the 25 to 44 years age bracket for the primary householder. A total of 34 households (23.1%) fall into this category.
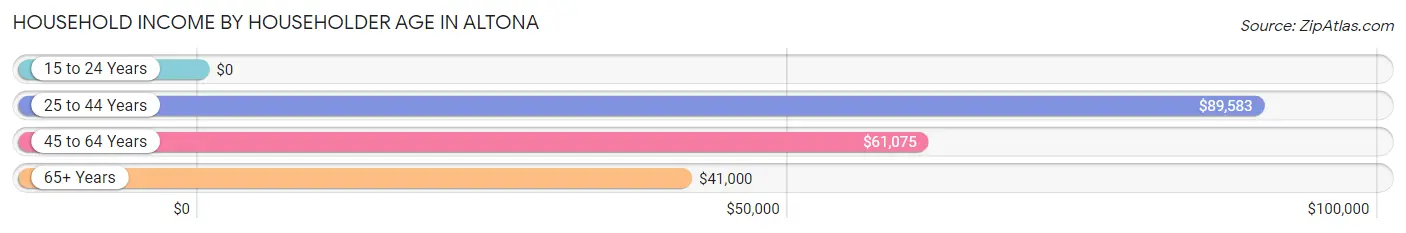
| Income Bracket | # Households | Median Income |
| 15 to 24 Years | 0 (0.0%) | $0 |
| 25 to 44 Years | 34 (23.1%) | $89,583 |
| 45 to 64 Years | 91 (61.9%) | $61,075 |
| 65+ Years | 22 (15.0%) | $41,000 |
| Total | 147 (100.0%) | $61,392 |
Poverty in Altona
Income Below Poverty by Sex and Age in Altona
With 2.4% poverty level for males and 4.8% for females among the residents of Altona, 25 to 34 year old males and 45 to 54 year old females are the most vulnerable to poverty, with 3 males (20.0%) and 7 females (14.6%) in their respective age groups living below the poverty level.
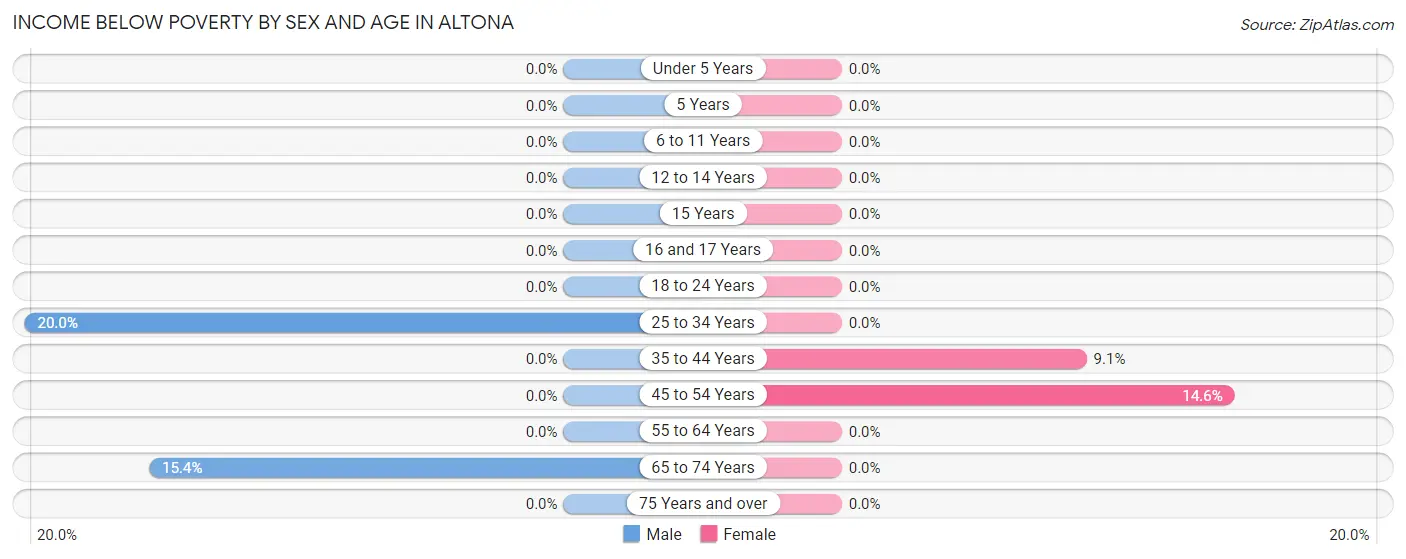
| Age Bracket | Male | Female |
| Under 5 Years | 0 (0.0%) | 0 (0.0%) |
| 5 Years | 0 (0.0%) | 0 (0.0%) |
| 6 to 11 Years | 0 (0.0%) | 0 (0.0%) |
| 12 to 14 Years | 0 (0.0%) | 0 (0.0%) |
| 15 Years | 0 (0.0%) | 0 (0.0%) |
| 16 and 17 Years | 0 (0.0%) | 0 (0.0%) |
| 18 to 24 Years | 0 (0.0%) | 0 (0.0%) |
| 25 to 34 Years | 3 (20.0%) | 0 (0.0%) |
| 35 to 44 Years | 0 (0.0%) | 3 (9.1%) |
| 45 to 54 Years | 0 (0.0%) | 7 (14.6%) |
| 55 to 64 Years | 0 (0.0%) | 0 (0.0%) |
| 65 to 74 Years | 2 (15.4%) | 0 (0.0%) |
| 75 Years and over | 0 (0.0%) | 0 (0.0%) |
| Total | 5 (2.4%) | 10 (4.8%) |
Income Above Poverty by Sex and Age in Altona
According to the poverty statistics in Altona, males aged under 5 years and females aged under 5 years are the age groups that are most secure financially, with 100.0% of males and 100.0% of females in these age groups living above the poverty line.
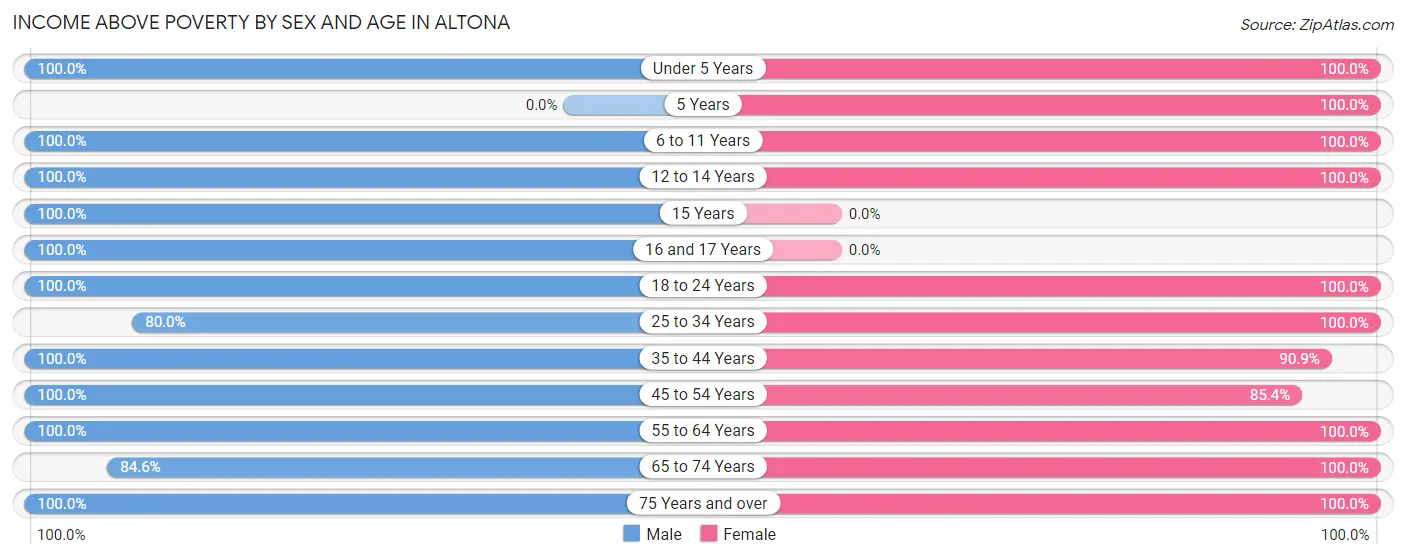
| Age Bracket | Male | Female |
| Under 5 Years | 9 (100.0%) | 15 (100.0%) |
| 5 Years | 0 (0.0%) | 18 (100.0%) |
| 6 to 11 Years | 11 (100.0%) | 12 (100.0%) |
| 12 to 14 Years | 15 (100.0%) | 8 (100.0%) |
| 15 Years | 8 (100.0%) | 0 (0.0%) |
| 16 and 17 Years | 12 (100.0%) | 0 (0.0%) |
| 18 to 24 Years | 3 (100.0%) | 36 (100.0%) |
| 25 to 34 Years | 12 (80.0%) | 14 (100.0%) |
| 35 to 44 Years | 35 (100.0%) | 30 (90.9%) |
| 45 to 54 Years | 74 (100.0%) | 41 (85.4%) |
| 55 to 64 Years | 13 (100.0%) | 9 (100.0%) |
| 65 to 74 Years | 11 (84.6%) | 7 (100.0%) |
| 75 Years and over | 2 (100.0%) | 7 (100.0%) |
| Total | 205 (97.6%) | 197 (95.2%) |
Income Below Poverty Among Married-Couple Families in Altona
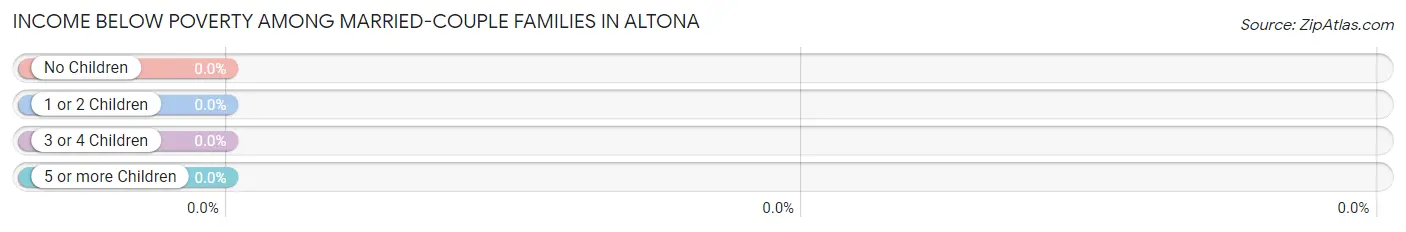
| Children | Above Poverty | Below Poverty |
| No Children | 73 (100.0%) | 0 (0.0%) |
| 1 or 2 Children | 23 (100.0%) | 0 (0.0%) |
| 3 or 4 Children | 0 (0.0%) | 0 (0.0%) |
| 5 or more Children | 1 (100.0%) | 0 (0.0%) |
| Total | 97 (100.0%) | 0 (0.0%) |
Income Below Poverty Among Single-Parent Households in Altona
| Children | Single Father | Single Mother |
| No Children | 0 (0.0%) | 0 (0.0%) |
| 1 or 2 Children | 0 (0.0%) | 0 (0.0%) |
| 3 or 4 Children | 0 (0.0%) | 0 (0.0%) |
| 5 or more Children | 0 (0.0%) | 0 (0.0%) |
| Total | 0 (0.0%) | 0 (0.0%) |
Income Below Poverty Among Married-Couple vs Single-Parent Households in Altona
| Children | Married-Couple Families | Single-Parent Households |
| No Children | 0 (0.0%) | 0 (0.0%) |
| 1 or 2 Children | 0 (0.0%) | 0 (0.0%) |
| 3 or 4 Children | 0 (0.0%) | 0 (0.0%) |
| 5 or more Children | 0 (0.0%) | 0 (0.0%) |
| Total | 0 (0.0%) | 0 (0.0%) |
Race in Altona
The most populous races in Altona are White / Caucasian (351 | 83.4%), Two or more Races (59 | 14.0%), and Hispanic or Latino (10 | 2.4%).
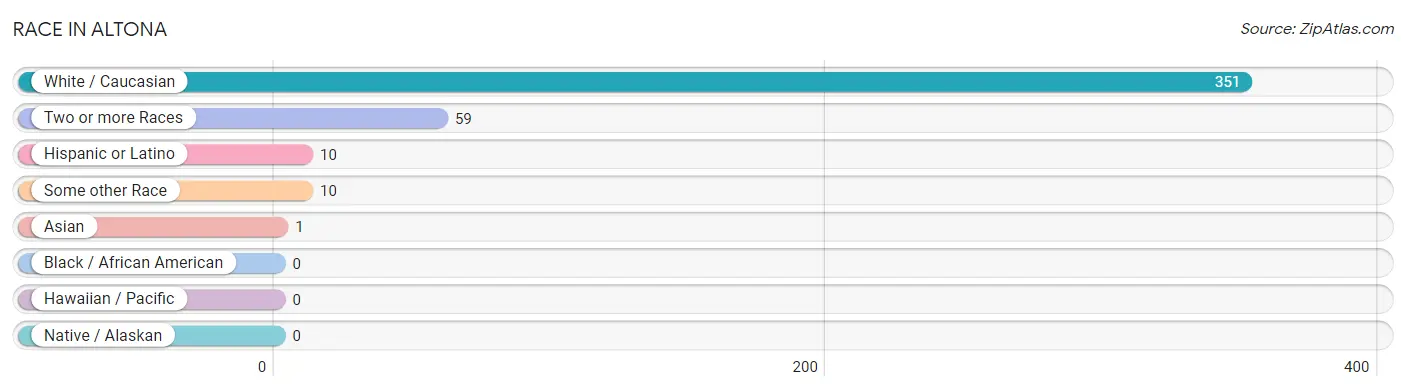
| Race | # Population | % Population |
| Asian | 1 | 0.2% |
| Black / African American | 0 | 0.0% |
| Hawaiian / Pacific | 0 | 0.0% |
| Hispanic or Latino | 10 | 2.4% |
| Native / Alaskan | 0 | 0.0% |
| White / Caucasian | 351 | 83.4% |
| Two or more Races | 59 | 14.0% |
| Some other Race | 10 | 2.4% |
| Total | 421 | 100.0% |
Ancestry in Altona
The most populous ancestries reported in Altona are English (158 | 37.5%), German (76 | 18.0%), Italian (44 | 10.4%), American (17 | 4.0%), and Irish (13 | 3.1%), together accounting for 73.2% of all Altona residents.
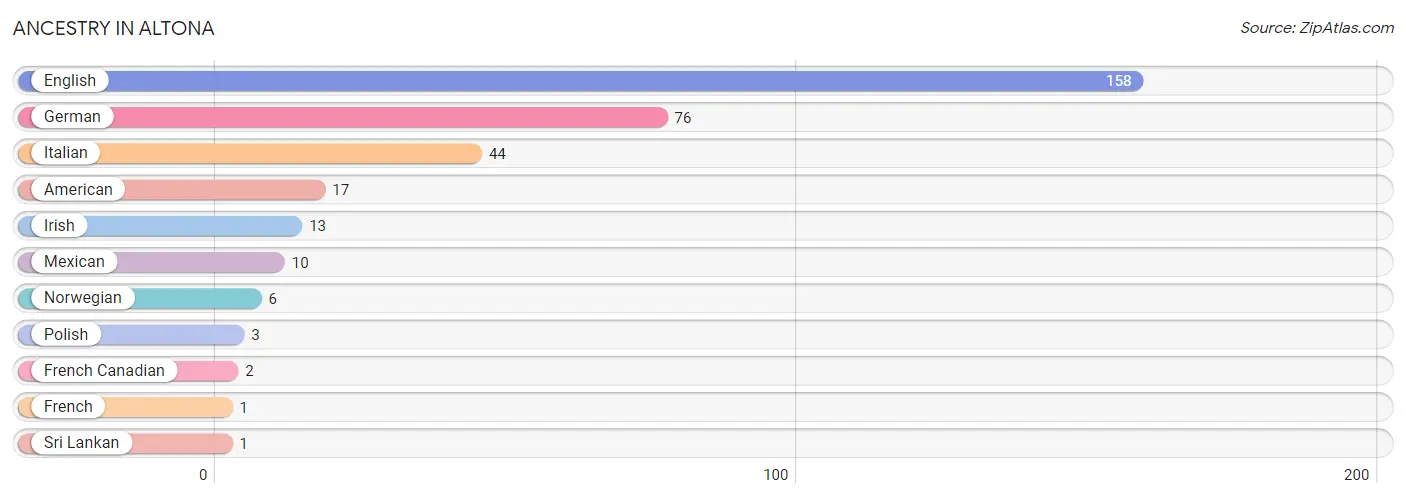
| Ancestry | # Population | % Population |
| American | 17 | 4.0% |
| English | 158 | 37.5% |
| French | 1 | 0.2% |
| French Canadian | 2 | 0.5% |
| German | 76 | 18.0% |
| Irish | 13 | 3.1% |
| Italian | 44 | 10.4% |
| Mexican | 10 | 2.4% |
| Norwegian | 6 | 1.4% |
| Polish | 3 | 0.7% |
| Sri Lankan | 1 | 0.2% | View All 11 Rows |
Immigrants in Altona
The most numerous immigrant groups reported in Altona came from Asia (1 | 0.2%), South Eastern Asia (1 | 0.2%), and Vietnam (1 | 0.2%), together accounting for 0.7% of all Altona residents.
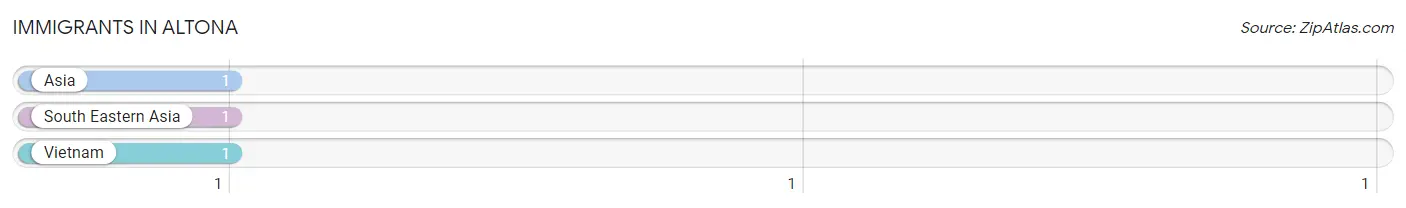
| Immigration Origin | # Population | % Population |
| Asia | 1 | 0.2% |
| South Eastern Asia | 1 | 0.2% |
| Vietnam | 1 | 0.2% | View All 3 Rows |
Sex and Age in Altona
Sex and Age in Altona
The most populous age groups in Altona are 45 to 49 Years (58 | 27.4%) for men and 45 to 49 Years (33 | 15.8%) for women.
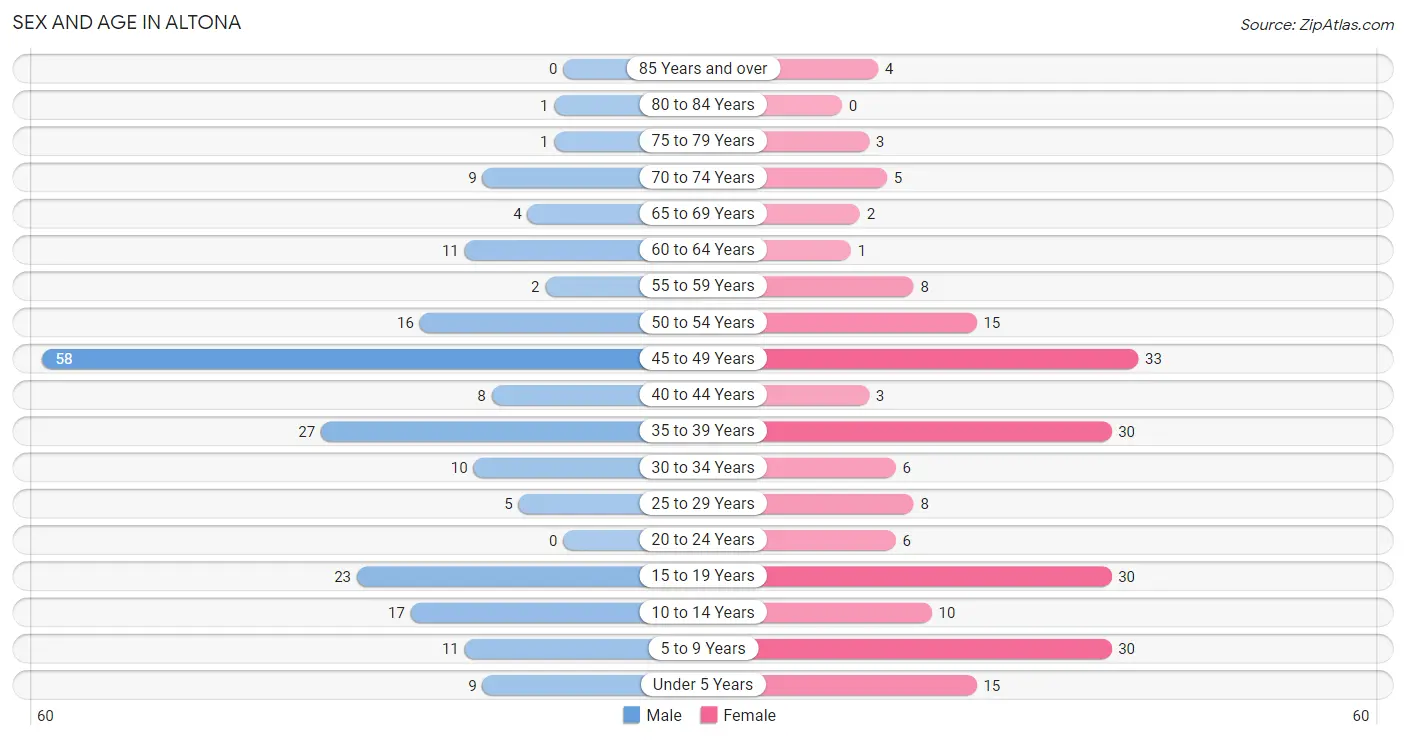
| Age Bracket | Male | Female |
| Under 5 Years | 9 (4.3%) | 15 (7.2%) |
| 5 to 9 Years | 11 (5.2%) | 30 (14.3%) |
| 10 to 14 Years | 17 (8.0%) | 10 (4.8%) |
| 15 to 19 Years | 23 (10.8%) | 30 (14.3%) |
| 20 to 24 Years | 0 (0.0%) | 6 (2.9%) |
| 25 to 29 Years | 5 (2.4%) | 8 (3.8%) |
| 30 to 34 Years | 10 (4.7%) | 6 (2.9%) |
| 35 to 39 Years | 27 (12.7%) | 30 (14.3%) |
| 40 to 44 Years | 8 (3.8%) | 3 (1.4%) |
| 45 to 49 Years | 58 (27.4%) | 33 (15.8%) |
| 50 to 54 Years | 16 (7.5%) | 15 (7.2%) |
| 55 to 59 Years | 2 (0.9%) | 8 (3.8%) |
| 60 to 64 Years | 11 (5.2%) | 1 (0.5%) |
| 65 to 69 Years | 4 (1.9%) | 2 (1.0%) |
| 70 to 74 Years | 9 (4.3%) | 5 (2.4%) |
| 75 to 79 Years | 1 (0.5%) | 3 (1.4%) |
| 80 to 84 Years | 1 (0.5%) | 0 (0.0%) |
| 85 Years and over | 0 (0.0%) | 4 (1.9%) |
| Total | 212 (100.0%) | 209 (100.0%) |
Families and Households in Altona
Median Family Size in Altona
The median family size in Altona is 3.10 persons per family, with single female/mother families (13 | 10.9%) accounting for the largest median family size of 3.62 persons per family. On the other hand, single male/father families (9 | 7.6%) represent the smallest median family size with 1.89 persons per family.
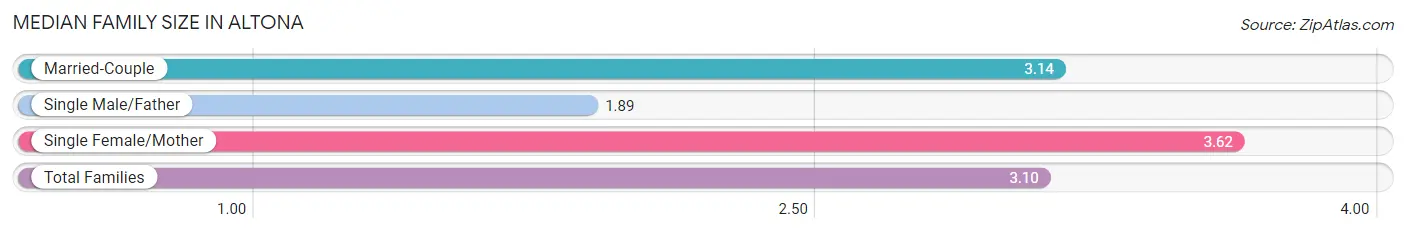
| Family Type | # Families | Family Size |
| Married-Couple | 97 (81.5%) | 3.14 |
| Single Male/Father | 9 (7.6%) | 1.89 |
| Single Female/Mother | 13 (10.9%) | 3.62 |
| Total Families | 119 (100.0%) | 3.10 |
Median Household Size in Altona
The median household size in Altona is 2.86 persons per household, with single female/mother households (13 | 8.8%) accounting for the largest median household size of 4.23 persons per household. non-family households (28 | 19.1%) represent the smallest median household size with 1.46 persons per household.
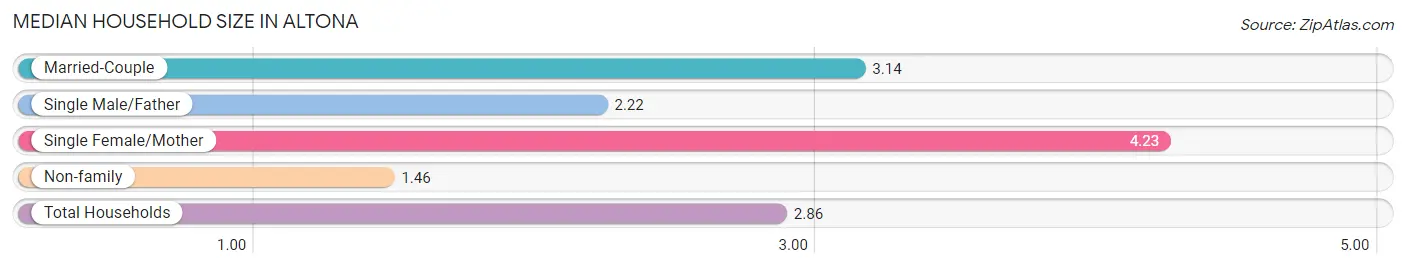
| Household Type | # Households | Household Size |
| Married-Couple | 97 (66.0%) | 3.14 |
| Single Male/Father | 9 (6.1%) | 2.22 |
| Single Female/Mother | 13 (8.8%) | 4.23 |
| Non-family | 28 (19.1%) | 1.46 |
| Total Households | 147 (100.0%) | 2.86 |
Household Size by Marriage Status in Altona
Out of a total of 147 households in Altona, 119 (80.9%) are family households, while 28 (19.1%) are nonfamily households. The most numerous type of family households are 3-person households, comprising 70, and the most common type of nonfamily households are 1-person households, comprising 20.
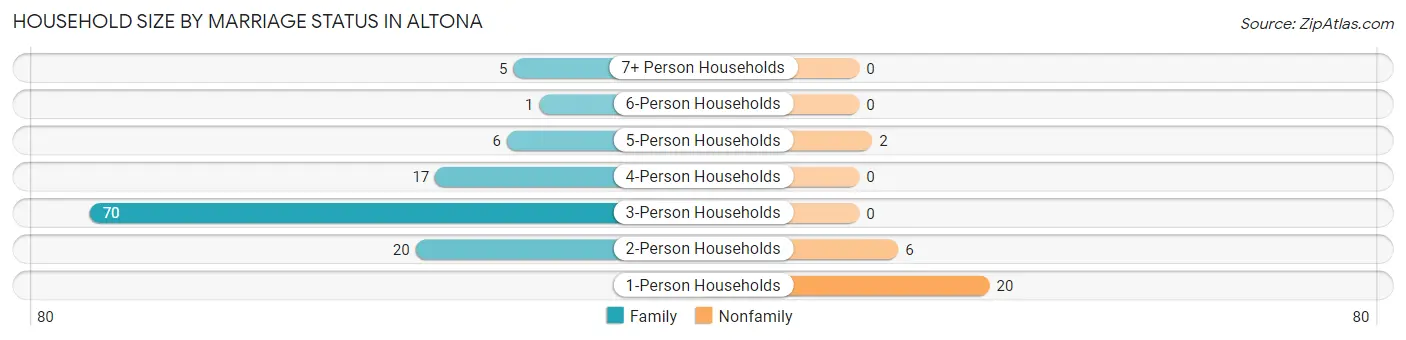
| Household Size | Family Households | Nonfamily Households |
| 1-Person Households | - | 20 (13.6%) |
| 2-Person Households | 20 (13.6%) | 6 (4.1%) |
| 3-Person Households | 70 (47.6%) | 0 (0.0%) |
| 4-Person Households | 17 (11.6%) | 0 (0.0%) |
| 5-Person Households | 6 (4.1%) | 2 (1.4%) |
| 6-Person Households | 1 (0.7%) | 0 (0.0%) |
| 7+ Person Households | 5 (3.4%) | 0 (0.0%) |
| Total | 119 (80.9%) | 28 (19.1%) |
Female Fertility in Altona
Fertility by Age in Altona
Average fertility rate in Altona is 24.0 births per 1,000 women. Women in the age bracket of 20 to 34 years have the highest fertility rate with 150.0 births per 1,000 women. Women in the age bracket of 20 to 34 years acount for 100.0% of all women with births.
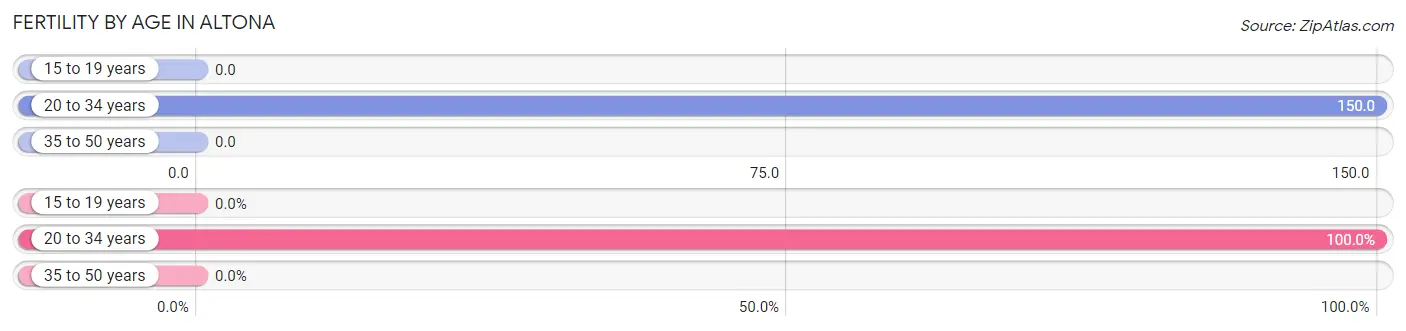
| Age Bracket | Women with Births | Births / 1,000 Women |
| 15 to 19 years | 0 (0.0%) | 0.0 |
| 20 to 34 years | 3 (100.0%) | 150.0 |
| 35 to 50 years | 0 (0.0%) | 0.0 |
| Total | 3 (100.0%) | 24.0 |
Fertility by Age by Marriage Status in Altona
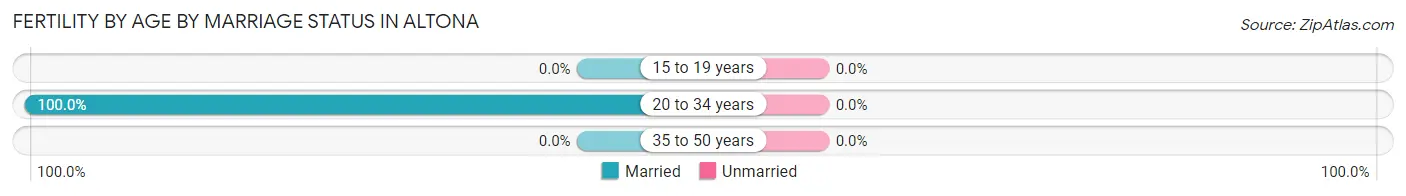
| Age Bracket | Married | Unmarried |
| 15 to 19 years | 0 (0.0%) | 0 (0.0%) |
| 20 to 34 years | 3 (100.0%) | 0 (0.0%) |
| 35 to 50 years | 0 (0.0%) | 0 (0.0%) |
| Total | 3 (100.0%) | 0 (0.0%) |
Fertility by Education in Altona
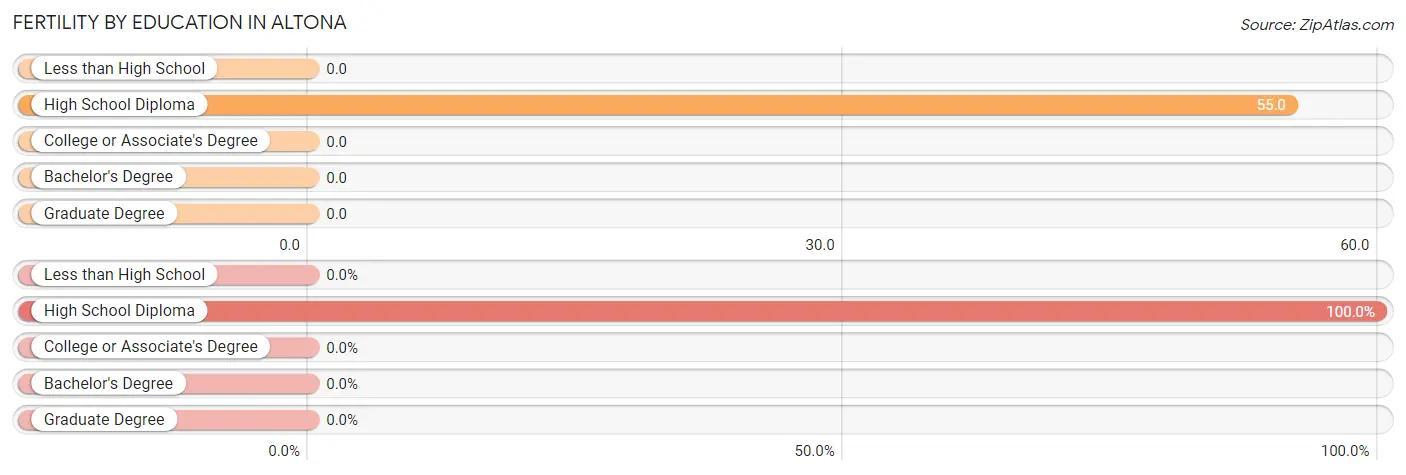
| Educational Attainment | Women with Births | Births / 1,000 Women |
| Less than High School | 0 (0.0%) | 0.0 |
| High School Diploma | 3 (100.0%) | 55.0 |
| College or Associate's Degree | 0 (0.0%) | 0.0 |
| Bachelor's Degree | 0 (0.0%) | 0.0 |
| Graduate Degree | 0 (0.0%) | 0.0 |
| Total | 3 (100.0%) | 24.0 |
Fertility by Education by Marriage Status in Altona
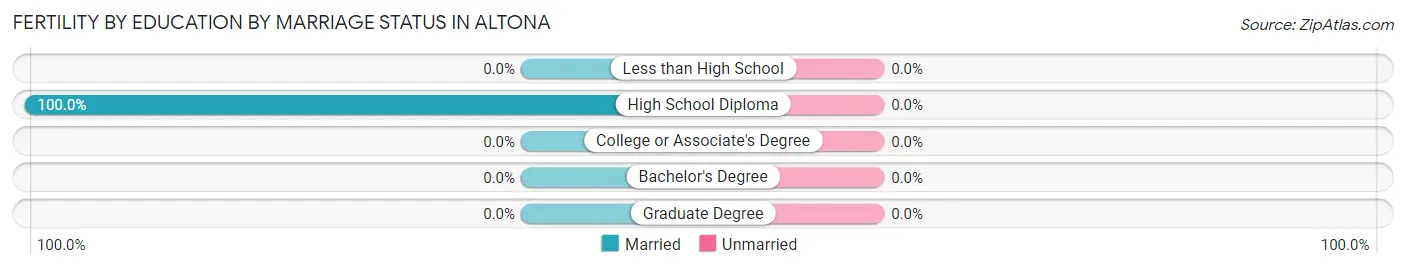
| Educational Attainment | Married | Unmarried |
| Less than High School | 0 (0.0%) | 0 (0.0%) |
| High School Diploma | 3 (100.0%) | 0 (0.0%) |
| College or Associate's Degree | 0 (0.0%) | 0 (0.0%) |
| Bachelor's Degree | 0 (0.0%) | 0 (0.0%) |
| Graduate Degree | 0 (0.0%) | 0 (0.0%) |
| Total | 3 (100.0%) | 0 (0.0%) |
Employment Characteristics in Altona
Employment by Class of Employer in Altona
Among the 170 employed individuals in Altona, private company employees (144 | 84.7%), local government employees (18 | 10.6%), and self-employed (incorporated) (5 | 2.9%) make up the most common classes of employment.
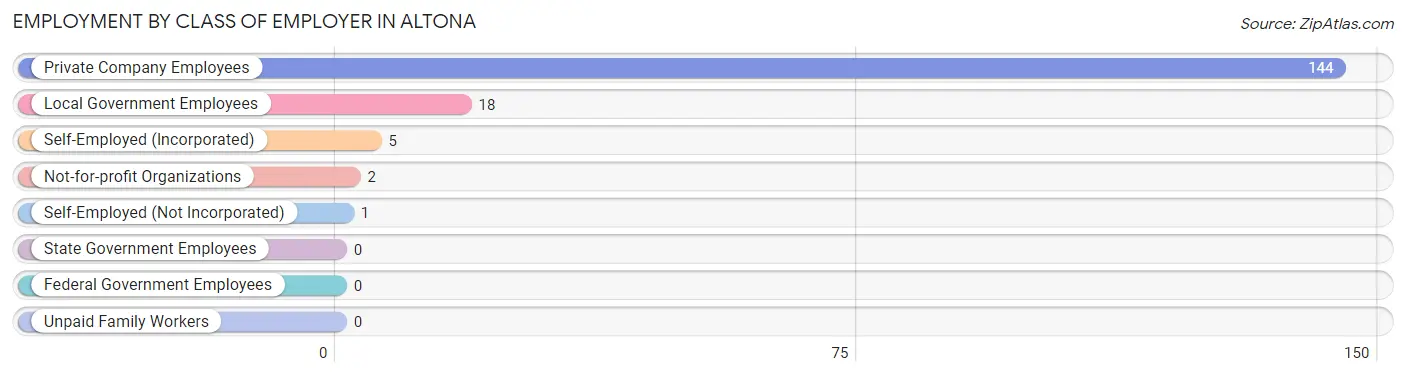
| Employer Class | # Employees | % Employees |
| Private Company Employees | 144 | 84.7% |
| Self-Employed (Incorporated) | 5 | 2.9% |
| Self-Employed (Not Incorporated) | 1 | 0.6% |
| Not-for-profit Organizations | 2 | 1.2% |
| Local Government Employees | 18 | 10.6% |
| State Government Employees | 0 | 0.0% |
| Federal Government Employees | 0 | 0.0% |
| Unpaid Family Workers | 0 | 0.0% |
| Total | 170 | 100.0% |
Employment Status by Age in Altona
According to the labor force statistics for Altona, out of the total population over 16 years of age (321), 55.1% or 177 individuals are in the labor force, with 2.3% or 4 of them unemployed. The age group with the highest labor force participation rate is 55 to 59 years, with 100.0% or 10 individuals in the labor force. Within the labor force, the 30 to 34 years age range has the highest percentage of unemployed individuals, with 33.3% or 4 of them being unemployed.
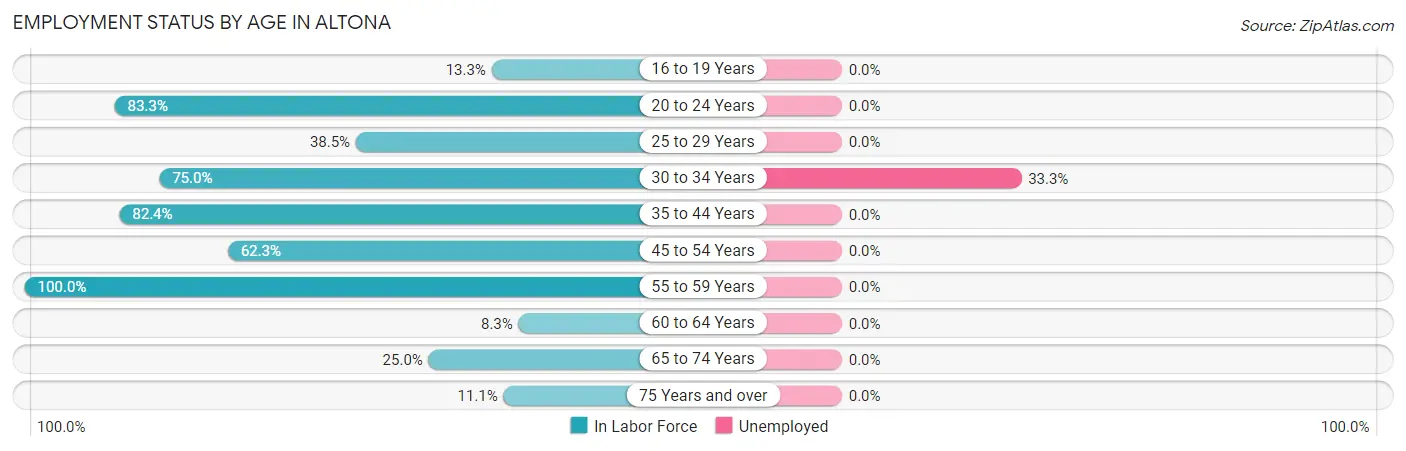
| Age Bracket | In Labor Force | Unemployed |
| 16 to 19 Years | 6 (13.3%) | 0 (0.0%) |
| 20 to 24 Years | 5 (83.3%) | 0 (0.0%) |
| 25 to 29 Years | 5 (38.5%) | 0 (0.0%) |
| 30 to 34 Years | 12 (75.0%) | 4 (33.3%) |
| 35 to 44 Years | 56 (82.4%) | 0 (0.0%) |
| 45 to 54 Years | 76 (62.3%) | 0 (0.0%) |
| 55 to 59 Years | 10 (100.0%) | 0 (0.0%) |
| 60 to 64 Years | 1 (8.3%) | 0 (0.0%) |
| 65 to 74 Years | 5 (25.0%) | 0 (0.0%) |
| 75 Years and over | 1 (11.1%) | 0 (0.0%) |
| Total | 177 (55.1%) | 4 (2.3%) |
Employment Status by Educational Attainment in Altona
According to labor force statistics for Altona, 66.4% of individuals (160) out of the total population between 25 and 64 years of age (241) are in the labor force, with 2.5% or 4 of them being unemployed. The group with the highest labor force participation rate are those with the educational attainment of bachelor's degree or higher, with 100.0% or 13 individuals in the labor force. Within the labor force, individuals with less than high school education have the highest percentage of unemployment, with 40.0% or 4 of them being unemployed.
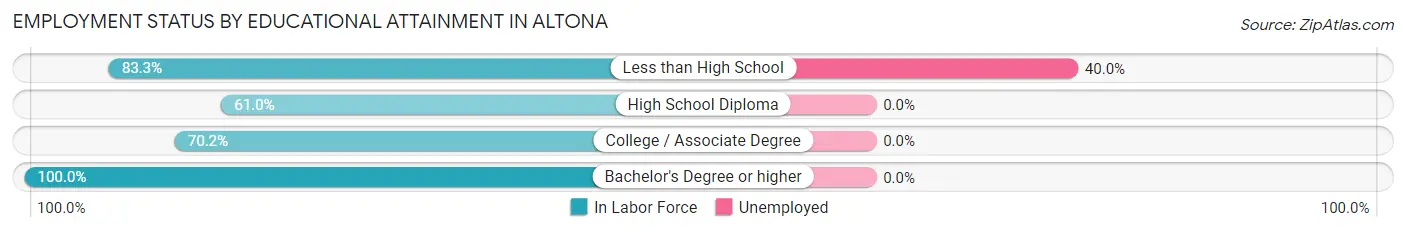
| Educational Attainment | In Labor Force | Unemployed |
| Less than High School | 10 (83.3%) | 5 (40.0%) |
| High School Diploma | 97 (61.0%) | 0 (0.0%) |
| College / Associate Degree | 40 (70.2%) | 0 (0.0%) |
| Bachelor's Degree or higher | 13 (100.0%) | 0 (0.0%) |
| Total | 160 (66.4%) | 6 (2.5%) |
Employment Occupations by Sex in Altona
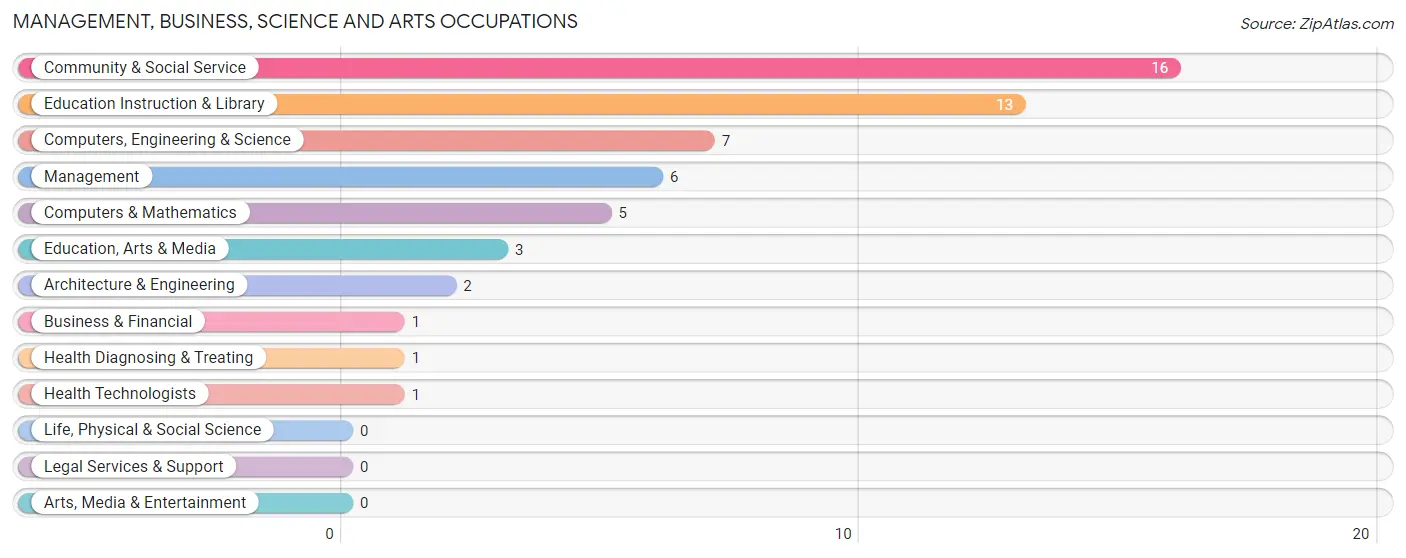
Management, Business, Science and Arts Occupations
The most common Management, Business, Science and Arts occupations in Altona are Community & Social Service (16 | 9.2%), Education Instruction & Library (13 | 7.5%), Computers, Engineering & Science (7 | 4.1%), Management (6 | 3.5%), and Computers & Mathematics (5 | 2.9%).
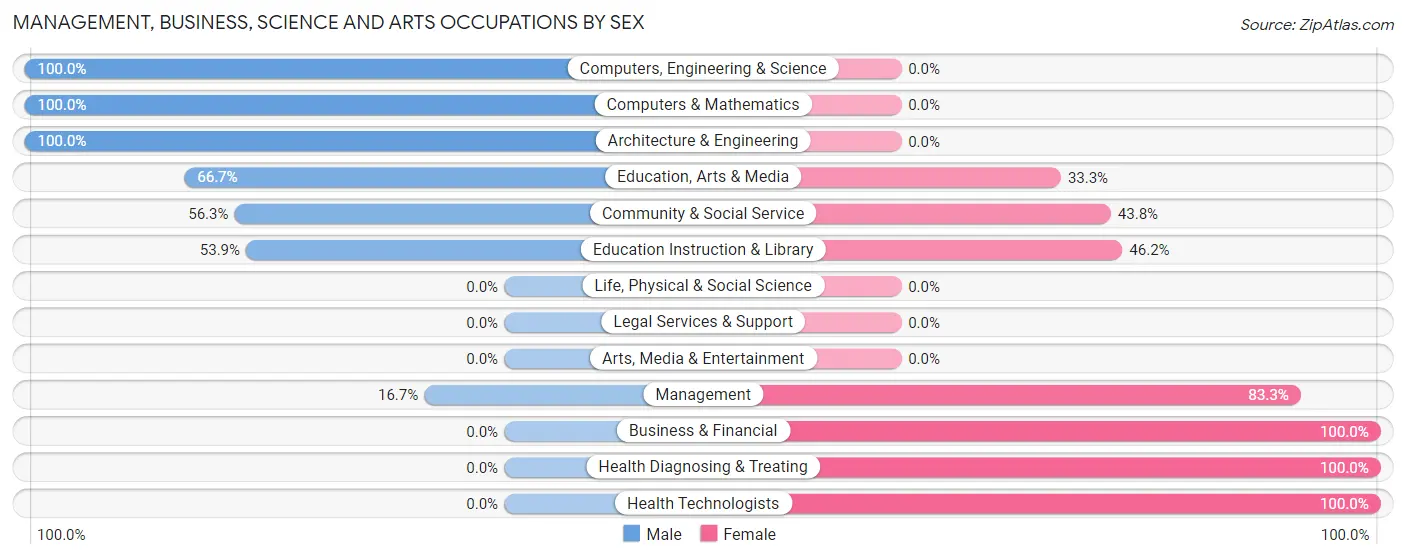
Management, Business, Science and Arts Occupations by Sex
Within the Management, Business, Science and Arts occupations in Altona, the most male-oriented occupations are Computers, Engineering & Science (100.0%), Computers & Mathematics (100.0%), and Architecture & Engineering (100.0%), while the most female-oriented occupations are Business & Financial (100.0%), Health Diagnosing & Treating (100.0%), and Health Technologists (100.0%).
| Occupation | Male | Female |
| Management | 1 (16.7%) | 5 (83.3%) |
| Business & Financial | 0 (0.0%) | 1 (100.0%) |
| Computers, Engineering & Science | 7 (100.0%) | 0 (0.0%) |
| Computers & Mathematics | 5 (100.0%) | 0 (0.0%) |
| Architecture & Engineering | 2 (100.0%) | 0 (0.0%) |
| Life, Physical & Social Science | 0 (0.0%) | 0 (0.0%) |
| Community & Social Service | 9 (56.2%) | 7 (43.8%) |
| Education, Arts & Media | 2 (66.7%) | 1 (33.3%) |
| Legal Services & Support | 0 (0.0%) | 0 (0.0%) |
| Education Instruction & Library | 7 (53.8%) | 6 (46.2%) |
| Arts, Media & Entertainment | 0 (0.0%) | 0 (0.0%) |
| Health Diagnosing & Treating | 0 (0.0%) | 1 (100.0%) |
| Health Technologists | 0 (0.0%) | 1 (100.0%) |
| Total (Category) | 17 (54.8%) | 14 (45.2%) |
| Total (Overall) | 117 (67.6%) | 56 (32.4%) |
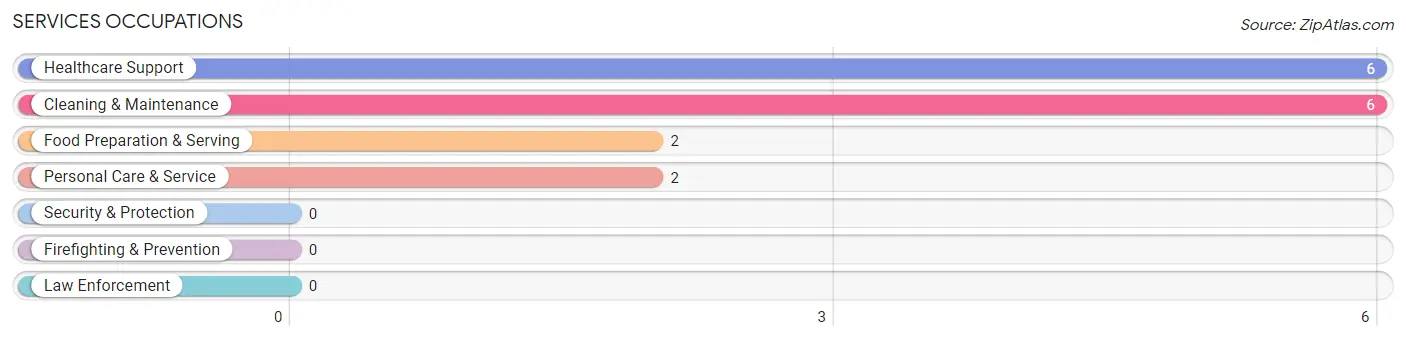
Services Occupations
The most common Services occupations in Altona are Healthcare Support (6 | 3.5%), Cleaning & Maintenance (6 | 3.5%), Food Preparation & Serving (2 | 1.2%), and Personal Care & Service (2 | 1.2%).
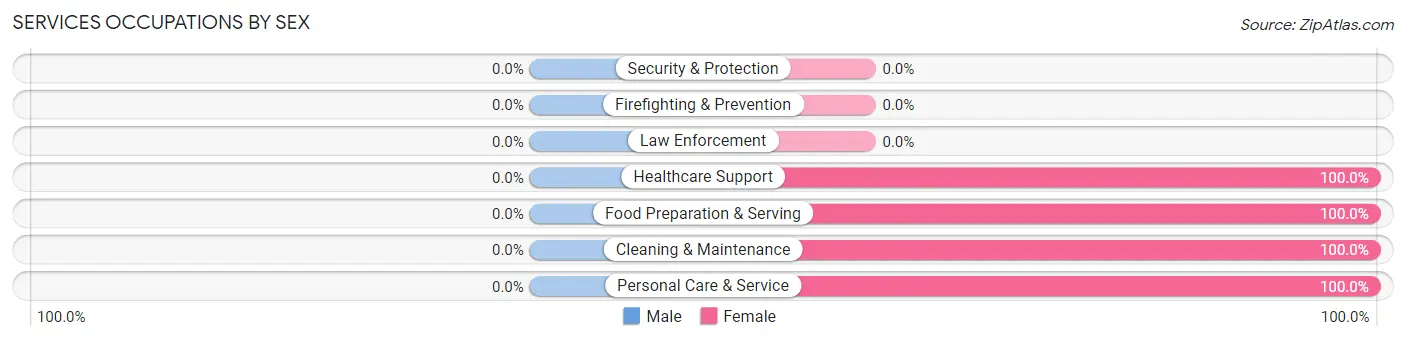
Services Occupations by Sex
| Occupation | Male | Female |
| Healthcare Support | 0 (0.0%) | 6 (100.0%) |
| Security & Protection | 0 (0.0%) | 0 (0.0%) |
| Firefighting & Prevention | 0 (0.0%) | 0 (0.0%) |
| Law Enforcement | 0 (0.0%) | 0 (0.0%) |
| Food Preparation & Serving | 0 (0.0%) | 2 (100.0%) |
| Cleaning & Maintenance | 0 (0.0%) | 6 (100.0%) |
| Personal Care & Service | 0 (0.0%) | 2 (100.0%) |
| Total (Category) | 0 (0.0%) | 16 (100.0%) |
| Total (Overall) | 117 (67.6%) | 56 (32.4%) |
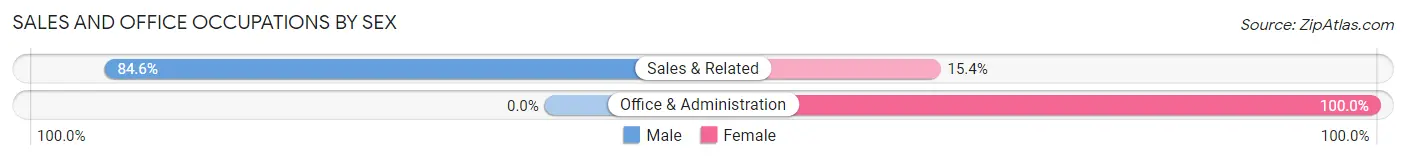
Sales and Office Occupations
The most common Sales and Office occupations in Altona are Sales & Related (13 | 7.5%), and Office & Administration (7 | 4.1%).

Sales and Office Occupations by Sex
| Occupation | Male | Female |
| Sales & Related | 11 (84.6%) | 2 (15.4%) |
| Office & Administration | 0 (0.0%) | 7 (100.0%) |
| Total (Category) | 11 (55.0%) | 9 (45.0%) |
| Total (Overall) | 117 (67.6%) | 56 (32.4%) |
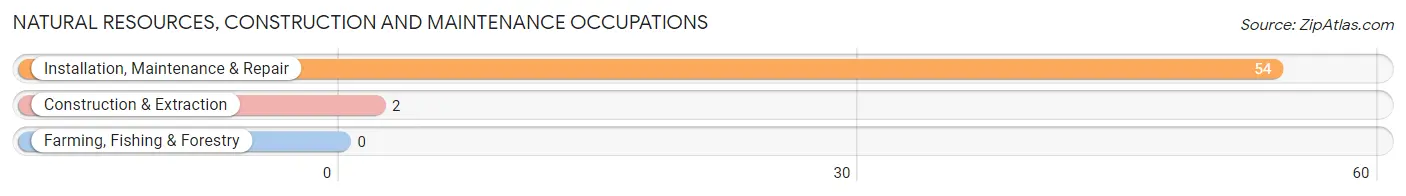
Natural Resources, Construction and Maintenance Occupations
The most common Natural Resources, Construction and Maintenance occupations in Altona are Installation, Maintenance & Repair (54 | 31.2%), and Construction & Extraction (2 | 1.2%).
Natural Resources, Construction and Maintenance Occupations by Sex
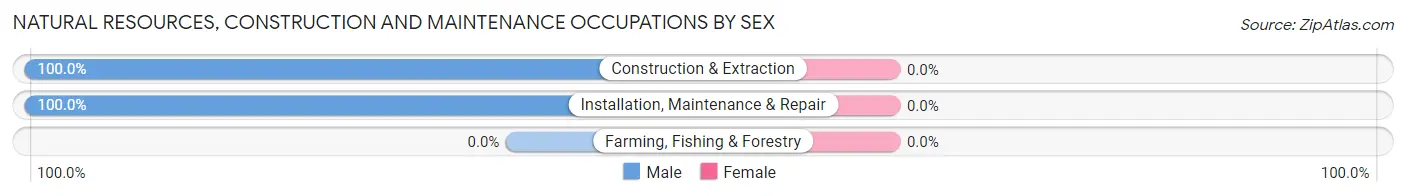
| Occupation | Male | Female |
| Farming, Fishing & Forestry | 0 (0.0%) | 0 (0.0%) |
| Construction & Extraction | 2 (100.0%) | 0 (0.0%) |
| Installation, Maintenance & Repair | 54 (100.0%) | 0 (0.0%) |
| Total (Category) | 56 (100.0%) | 0 (0.0%) |
| Total (Overall) | 117 (67.6%) | 56 (32.4%) |
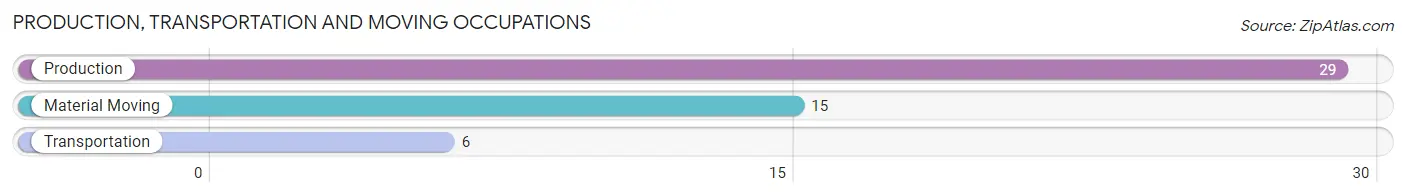
Production, Transportation and Moving Occupations
The most common Production, Transportation and Moving occupations in Altona are Production (29 | 16.8%), Material Moving (15 | 8.7%), and Transportation (6 | 3.5%).
Production, Transportation and Moving Occupations by Sex
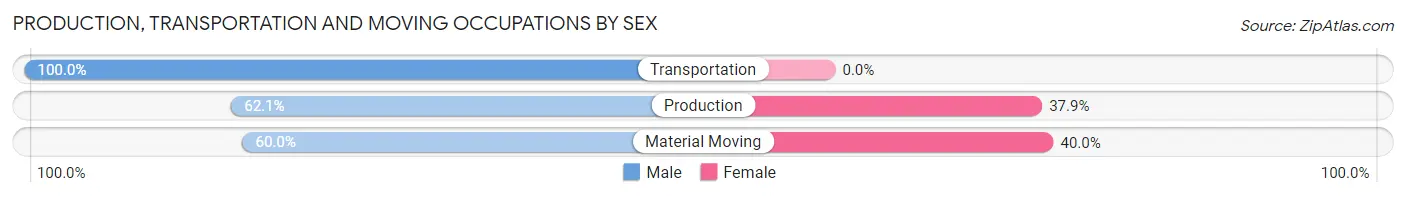
| Occupation | Male | Female |
| Production | 18 (62.1%) | 11 (37.9%) |
| Transportation | 6 (100.0%) | 0 (0.0%) |
| Material Moving | 9 (60.0%) | 6 (40.0%) |
| Total (Category) | 33 (66.0%) | 17 (34.0%) |
| Total (Overall) | 117 (67.6%) | 56 (32.4%) |
Employment Industries by Sex in Altona
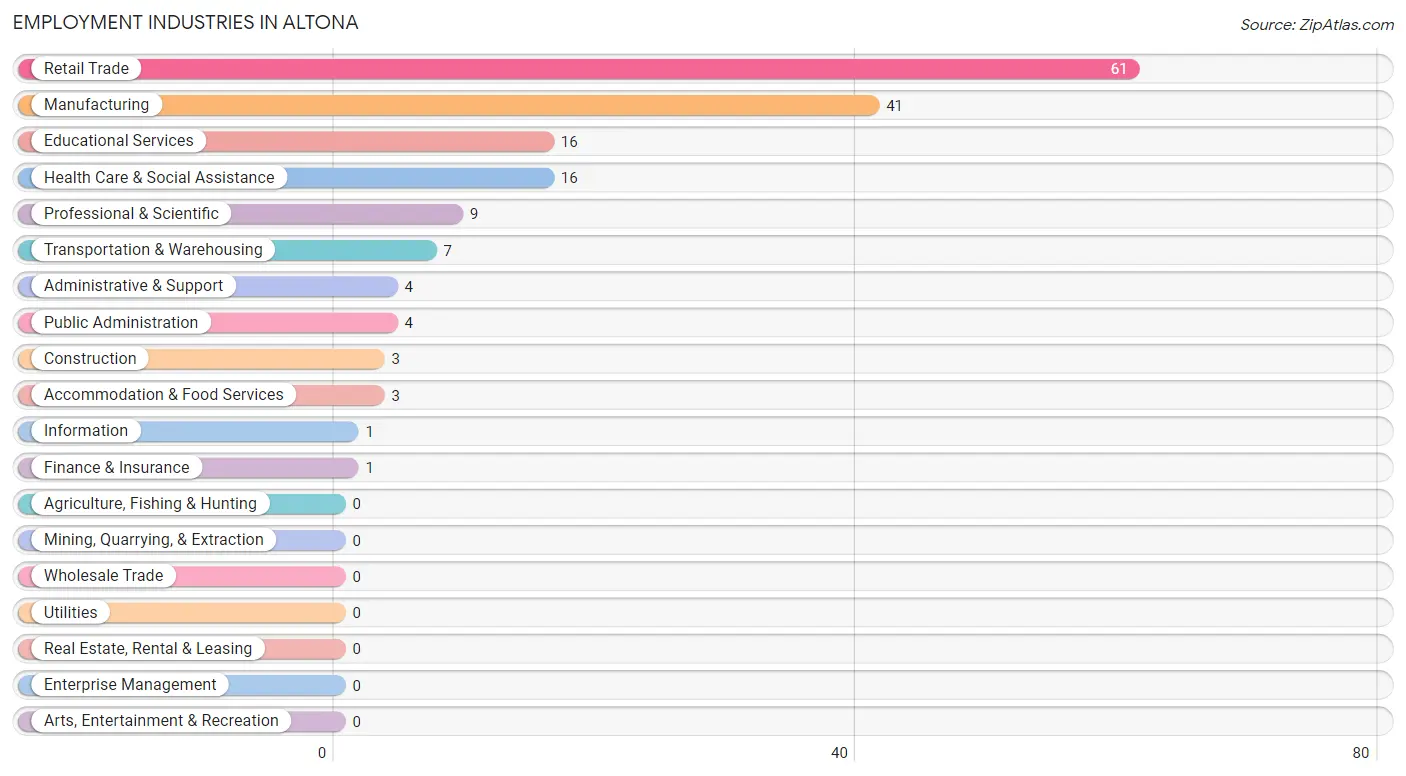
Employment Industries in Altona
The major employment industries in Altona include Retail Trade (61 | 35.3%), Manufacturing (41 | 23.7%), Educational Services (16 | 9.2%), Health Care & Social Assistance (16 | 9.2%), and Professional & Scientific (9 | 5.2%).
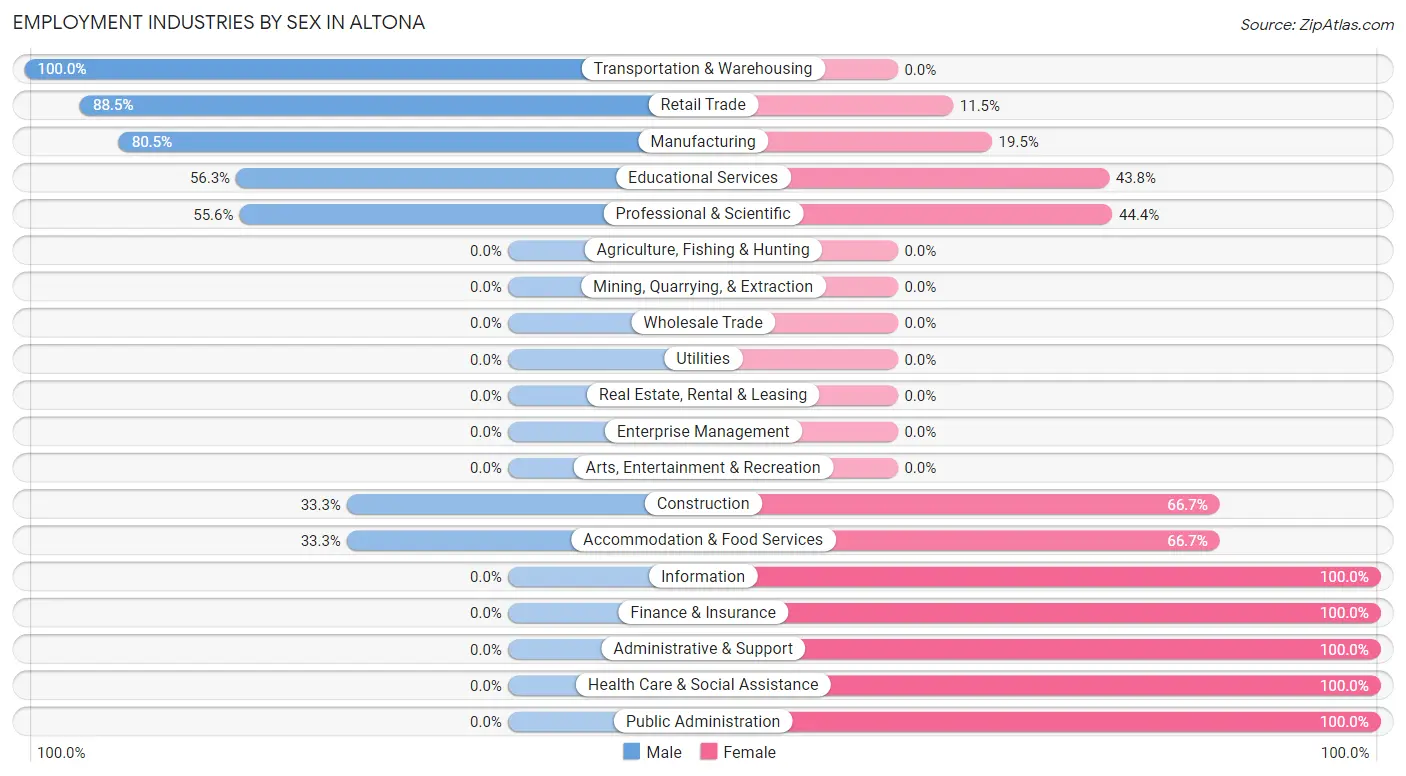
Employment Industries by Sex in Altona
The Altona industries that see more men than women are Transportation & Warehousing (100.0%), Retail Trade (88.5%), and Manufacturing (80.5%), whereas the industries that tend to have a higher number of women are Information (100.0%), Finance & Insurance (100.0%), and Administrative & Support (100.0%).
| Industry | Male | Female |
| Agriculture, Fishing & Hunting | 0 (0.0%) | 0 (0.0%) |
| Mining, Quarrying, & Extraction | 0 (0.0%) | 0 (0.0%) |
| Construction | 1 (33.3%) | 2 (66.7%) |
| Manufacturing | 33 (80.5%) | 8 (19.5%) |
| Wholesale Trade | 0 (0.0%) | 0 (0.0%) |
| Retail Trade | 54 (88.5%) | 7 (11.5%) |
| Transportation & Warehousing | 7 (100.0%) | 0 (0.0%) |
| Utilities | 0 (0.0%) | 0 (0.0%) |
| Information | 0 (0.0%) | 1 (100.0%) |
| Finance & Insurance | 0 (0.0%) | 1 (100.0%) |
| Real Estate, Rental & Leasing | 0 (0.0%) | 0 (0.0%) |
| Professional & Scientific | 5 (55.6%) | 4 (44.4%) |
| Enterprise Management | 0 (0.0%) | 0 (0.0%) |
| Administrative & Support | 0 (0.0%) | 4 (100.0%) |
| Educational Services | 9 (56.2%) | 7 (43.8%) |
| Health Care & Social Assistance | 0 (0.0%) | 16 (100.0%) |
| Arts, Entertainment & Recreation | 0 (0.0%) | 0 (0.0%) |
| Accommodation & Food Services | 1 (33.3%) | 2 (66.7%) |
| Public Administration | 0 (0.0%) | 4 (100.0%) |
| Total | 117 (67.6%) | 56 (32.4%) |
Education in Altona
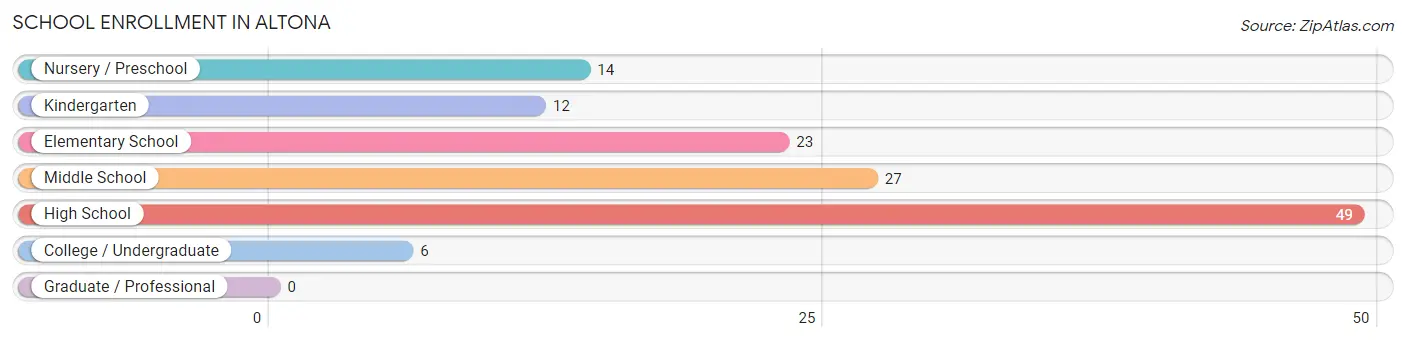
School Enrollment in Altona
The most common levels of schooling among the 131 students in Altona are high school (49 | 37.4%), middle school (27 | 20.6%), and elementary school (23 | 17.6%).
| School Level | # Students | % Students |
| Nursery / Preschool | 14 | 10.7% |
| Kindergarten | 12 | 9.2% |
| Elementary School | 23 | 17.6% |
| Middle School | 27 | 20.6% |
| High School | 49 | 37.4% |
| College / Undergraduate | 6 | 4.6% |
| Graduate / Professional | 0 | 0.0% |
| Total | 131 | 100.0% |
School Enrollment by Age by Funding Source in Altona
Out of a total of 131 students who are enrolled in schools in Altona, 2 (1.5%) attend a private institution, while the remaining 129 (98.5%) are enrolled in public schools. The age group of 20 to 24 year olds has the highest likelihood of being enrolled in private schools, with 1 (100.0% in the age bracket) enrolled. Conversely, the age group of 3 to 4 year olds has the lowest likelihood of being enrolled in a private school, with 8 (100.0% in the age bracket) attending a public institution.
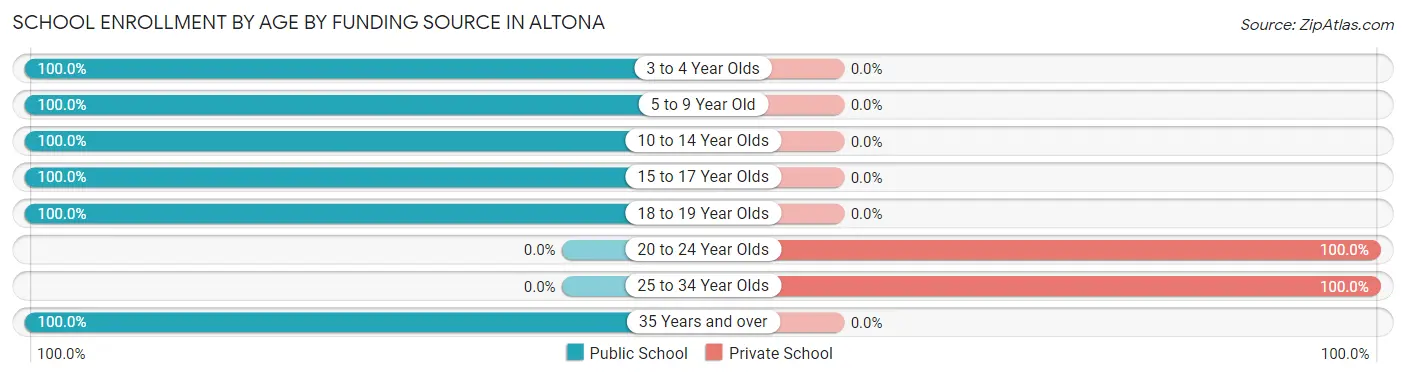
| Age Bracket | Public School | Private School |
| 3 to 4 Year Olds | 8 (100.0%) | 0 (0.0%) |
| 5 to 9 Year Old | 41 (100.0%) | 0 (0.0%) |
| 10 to 14 Year Olds | 27 (100.0%) | 0 (0.0%) |
| 15 to 17 Year Olds | 20 (100.0%) | 0 (0.0%) |
| 18 to 19 Year Olds | 29 (100.0%) | 0 (0.0%) |
| 20 to 24 Year Olds | 0 (0.0%) | 1 (100.0%) |
| 25 to 34 Year Olds | 0 (0.0%) | 1 (100.0%) |
| 35 Years and over | 4 (100.0%) | 0 (0.0%) |
| Total | 129 (98.5%) | 2 (1.5%) |
Educational Attainment by Field of Study in Altona
Computers & mathematics (6 | 42.9%), arts & humanities (3 | 21.4%), science & technology (2 | 14.3%), business (1 | 7.1%), and education (1 | 7.1%) are the most common fields of study among 14 individuals in Altona who have obtained a bachelor's degree or higher.
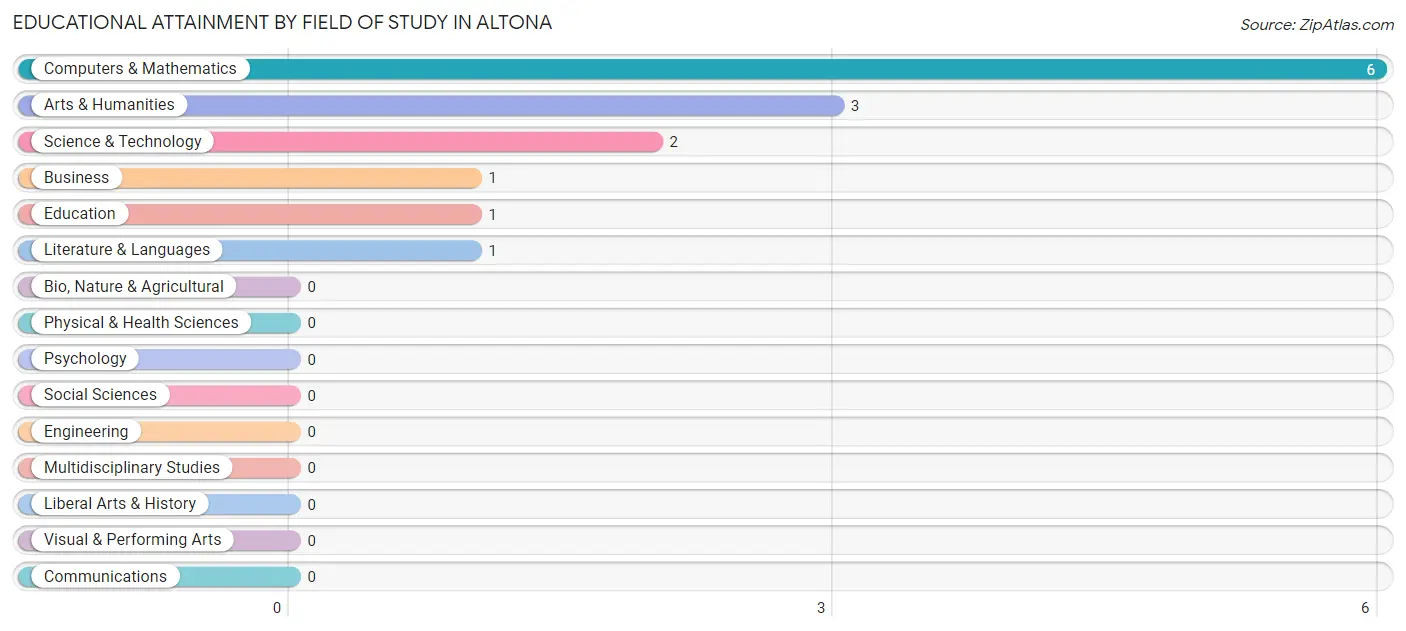
| Field of Study | # Graduates | % Graduates |
| Computers & Mathematics | 6 | 42.9% |
| Bio, Nature & Agricultural | 0 | 0.0% |
| Physical & Health Sciences | 0 | 0.0% |
| Psychology | 0 | 0.0% |
| Social Sciences | 0 | 0.0% |
| Engineering | 0 | 0.0% |
| Multidisciplinary Studies | 0 | 0.0% |
| Science & Technology | 2 | 14.3% |
| Business | 1 | 7.1% |
| Education | 1 | 7.1% |
| Literature & Languages | 1 | 7.1% |
| Liberal Arts & History | 0 | 0.0% |
| Visual & Performing Arts | 0 | 0.0% |
| Communications | 0 | 0.0% |
| Arts & Humanities | 3 | 21.4% |
| Total | 14 | 100.0% |
Transportation & Commute in Altona
Vehicle Availability by Sex in Altona
The most prevalent vehicle ownership categories in Altona are males with 4 vehicles (50, accounting for 43.1%) and females with 4 vehicles (1, making up 92.6%).
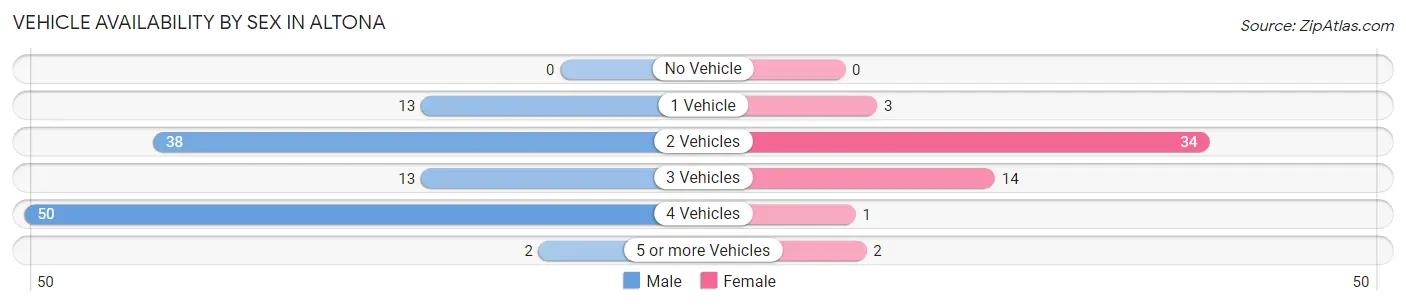
| Vehicles Available | Male | Female |
| No Vehicle | 0 (0.0%) | 0 (0.0%) |
| 1 Vehicle | 13 (11.2%) | 3 (5.6%) |
| 2 Vehicles | 38 (32.8%) | 34 (63.0%) |
| 3 Vehicles | 13 (11.2%) | 14 (25.9%) |
| 4 Vehicles | 50 (43.1%) | 1 (1.8%) |
| 5 or more Vehicles | 2 (1.7%) | 2 (3.7%) |
| Total | 116 (100.0%) | 54 (100.0%) |
Commute Time in Altona
The most frequently occuring commute durations in Altona are 5 to 9 minutes (51 commuters, 30.9%), 10 to 14 minutes (27 commuters, 16.4%), and 15 to 19 minutes (20 commuters, 12.1%).
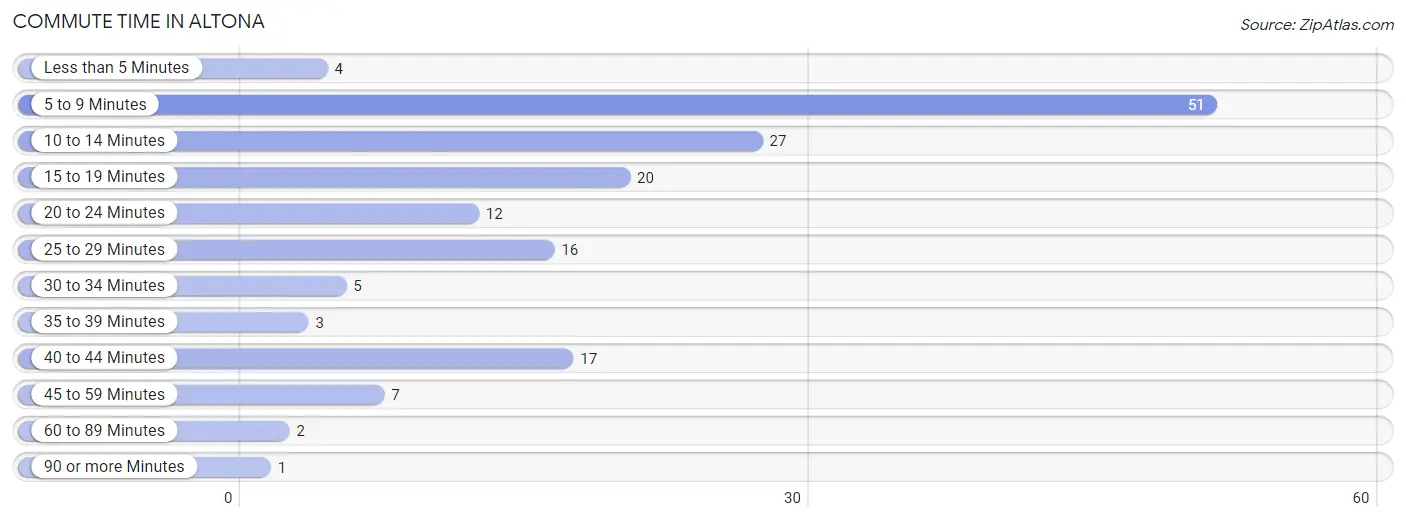
| Commute Time | # Commuters | % Commuters |
| Less than 5 Minutes | 4 | 2.4% |
| 5 to 9 Minutes | 51 | 30.9% |
| 10 to 14 Minutes | 27 | 16.4% |
| 15 to 19 Minutes | 20 | 12.1% |
| 20 to 24 Minutes | 12 | 7.3% |
| 25 to 29 Minutes | 16 | 9.7% |
| 30 to 34 Minutes | 5 | 3.0% |
| 35 to 39 Minutes | 3 | 1.8% |
| 40 to 44 Minutes | 17 | 10.3% |
| 45 to 59 Minutes | 7 | 4.2% |
| 60 to 89 Minutes | 2 | 1.2% |
| 90 or more Minutes | 1 | 0.6% |
Commute Time by Sex in Altona
The most common commute times in Altona are 5 to 9 minutes (50 commuters, 45.1%) for males and 15 to 19 minutes (17 commuters, 31.5%) for females.
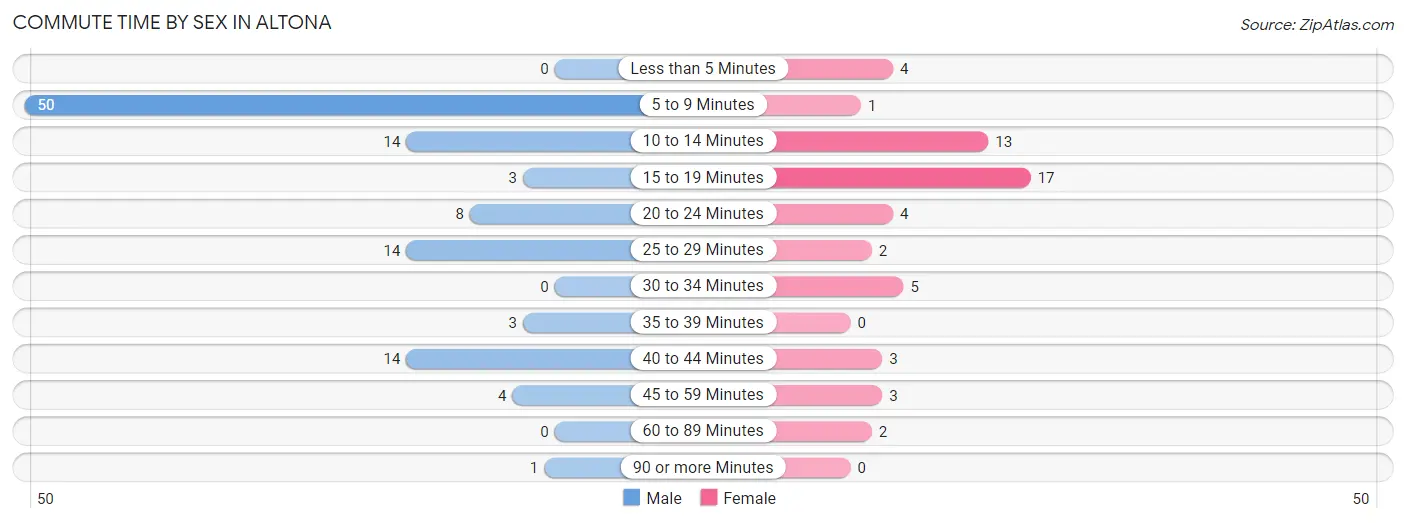
| Commute Time | Male | Female |
| Less than 5 Minutes | 0 (0.0%) | 4 (7.4%) |
| 5 to 9 Minutes | 50 (45.1%) | 1 (1.8%) |
| 10 to 14 Minutes | 14 (12.6%) | 13 (24.1%) |
| 15 to 19 Minutes | 3 (2.7%) | 17 (31.5%) |
| 20 to 24 Minutes | 8 (7.2%) | 4 (7.4%) |
| 25 to 29 Minutes | 14 (12.6%) | 2 (3.7%) |
| 30 to 34 Minutes | 0 (0.0%) | 5 (9.3%) |
| 35 to 39 Minutes | 3 (2.7%) | 0 (0.0%) |
| 40 to 44 Minutes | 14 (12.6%) | 3 (5.6%) |
| 45 to 59 Minutes | 4 (3.6%) | 3 (5.6%) |
| 60 to 89 Minutes | 0 (0.0%) | 2 (3.7%) |
| 90 or more Minutes | 1 (0.9%) | 0 (0.0%) |
Time of Departure to Work by Sex in Altona
The most frequent times of departure to work in Altona are 7:30 AM to 7:59 AM (51, 46.0%) for males and 7:30 AM to 7:59 AM (12, 22.2%) for females.
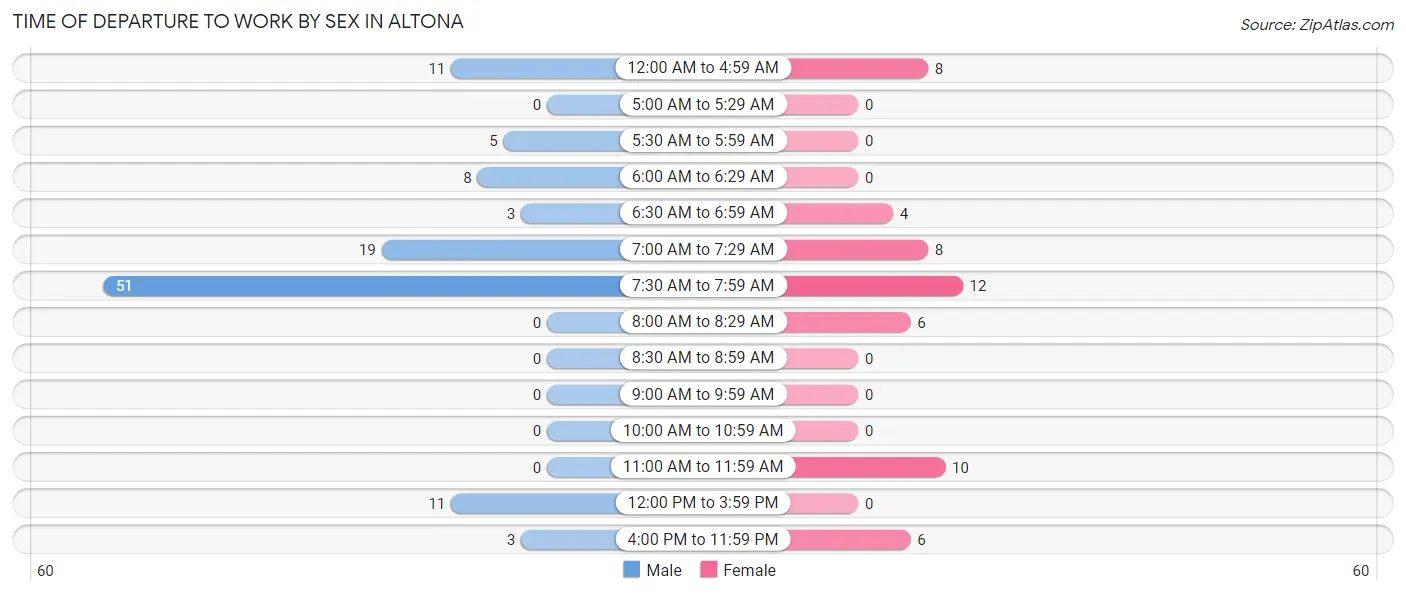
| Time of Departure | Male | Female |
| 12:00 AM to 4:59 AM | 11 (9.9%) | 8 (14.8%) |
| 5:00 AM to 5:29 AM | 0 (0.0%) | 0 (0.0%) |
| 5:30 AM to 5:59 AM | 5 (4.5%) | 0 (0.0%) |
| 6:00 AM to 6:29 AM | 8 (7.2%) | 0 (0.0%) |
| 6:30 AM to 6:59 AM | 3 (2.7%) | 4 (7.4%) |
| 7:00 AM to 7:29 AM | 19 (17.1%) | 8 (14.8%) |
| 7:30 AM to 7:59 AM | 51 (46.0%) | 12 (22.2%) |
| 8:00 AM to 8:29 AM | 0 (0.0%) | 6 (11.1%) |
| 8:30 AM to 8:59 AM | 0 (0.0%) | 0 (0.0%) |
| 9:00 AM to 9:59 AM | 0 (0.0%) | 0 (0.0%) |
| 10:00 AM to 10:59 AM | 0 (0.0%) | 0 (0.0%) |
| 11:00 AM to 11:59 AM | 0 (0.0%) | 10 (18.5%) |
| 12:00 PM to 3:59 PM | 11 (9.9%) | 0 (0.0%) |
| 4:00 PM to 11:59 PM | 3 (2.7%) | 6 (11.1%) |
| Total | 111 (100.0%) | 54 (100.0%) |
Housing Occupancy in Altona
Occupancy by Ownership in Altona
Of the total 147 dwellings in Altona, owner-occupied units account for 119 (80.9%), while renter-occupied units make up 28 (19.1%).
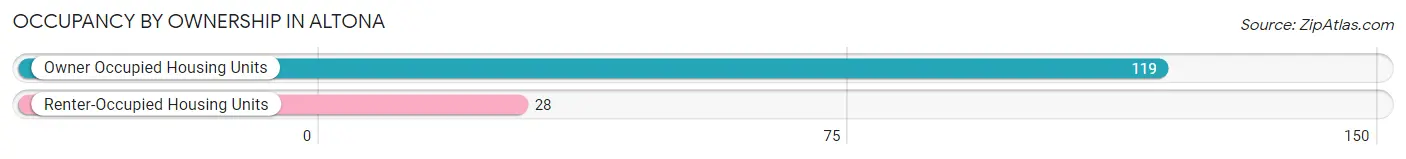
| Occupancy | # Housing Units | % Housing Units |
| Owner Occupied Housing Units | 119 | 80.9% |
| Renter-Occupied Housing Units | 28 | 19.1% |
| Total Occupied Housing Units | 147 | 100.0% |
Occupancy by Household Size in Altona
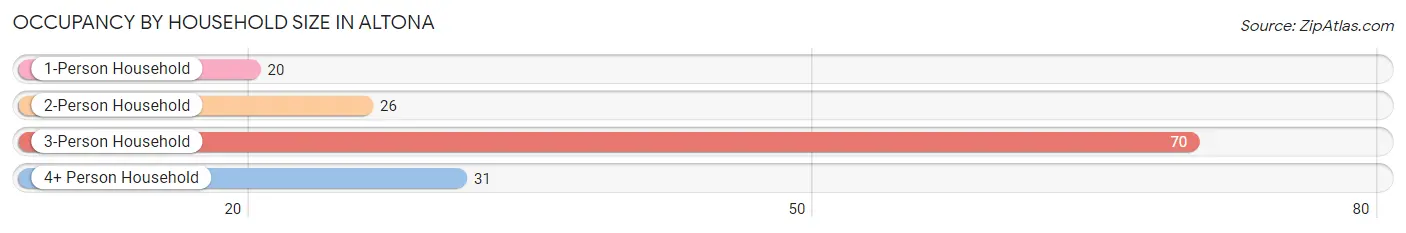
| Household Size | # Housing Units | % Housing Units |
| 1-Person Household | 20 | 13.6% |
| 2-Person Household | 26 | 17.7% |
| 3-Person Household | 70 | 47.6% |
| 4+ Person Household | 31 | 21.1% |
| Total Housing Units | 147 | 100.0% |
Occupancy by Ownership by Household Size in Altona
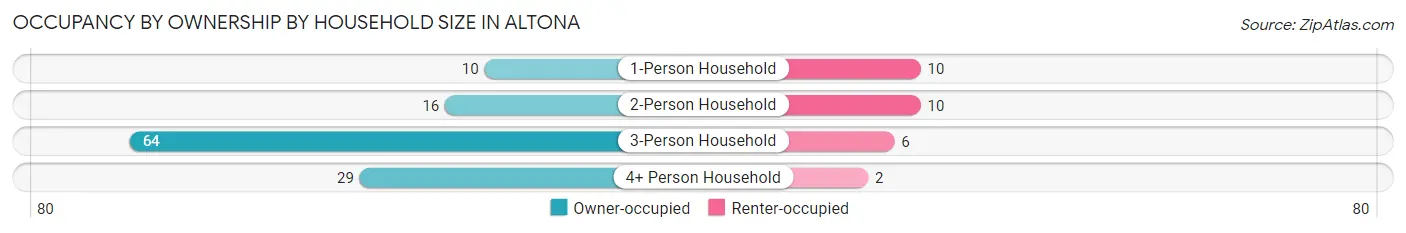
| Household Size | Owner-occupied | Renter-occupied |
| 1-Person Household | 10 (50.0%) | 10 (50.0%) |
| 2-Person Household | 16 (61.5%) | 10 (38.5%) |
| 3-Person Household | 64 (91.4%) | 6 (8.6%) |
| 4+ Person Household | 29 (93.5%) | 2 (6.5%) |
| Total Housing Units | 119 (80.9%) | 28 (19.1%) |
Occupancy by Educational Attainment in Altona
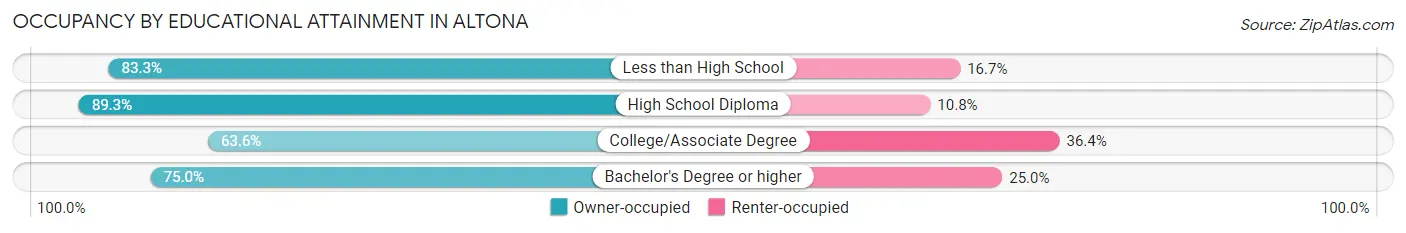
| Household Size | Owner-occupied | Renter-occupied |
| Less than High School | 5 (83.3%) | 1 (16.7%) |
| High School Diploma | 83 (89.2%) | 10 (10.7%) |
| College/Associate Degree | 28 (63.6%) | 16 (36.4%) |
| Bachelor's Degree or higher | 3 (75.0%) | 1 (25.0%) |
Occupancy by Age of Householder in Altona
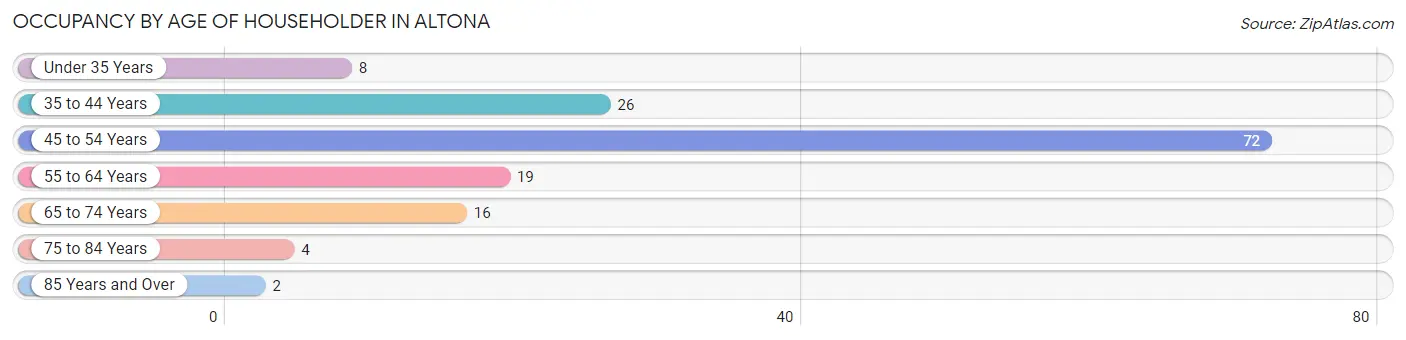
| Age Bracket | # Households | % Households |
| Under 35 Years | 8 | 5.4% |
| 35 to 44 Years | 26 | 17.7% |
| 45 to 54 Years | 72 | 49.0% |
| 55 to 64 Years | 19 | 12.9% |
| 65 to 74 Years | 16 | 10.9% |
| 75 to 84 Years | 4 | 2.7% |
| 85 Years and Over | 2 | 1.4% |
| Total | 147 | 100.0% |
Housing Finances in Altona
Median Income by Occupancy in Altona
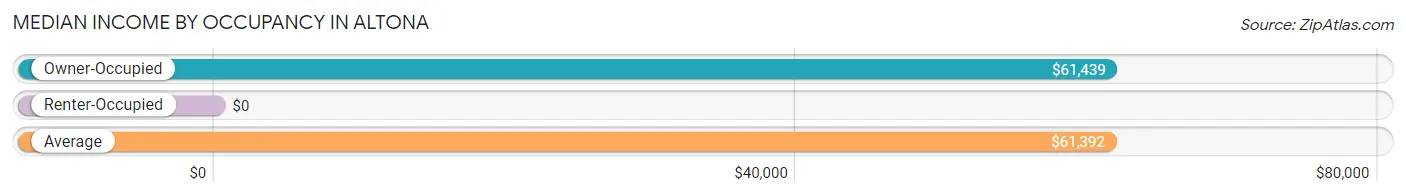
| Occupancy Type | # Households | Median Income |
| Owner-Occupied | 119 (80.9%) | $61,439 |
| Renter-Occupied | 28 (19.1%) | $0 |
| Average | 147 (100.0%) | $61,392 |
Occupancy by Householder Income Bracket in Altona
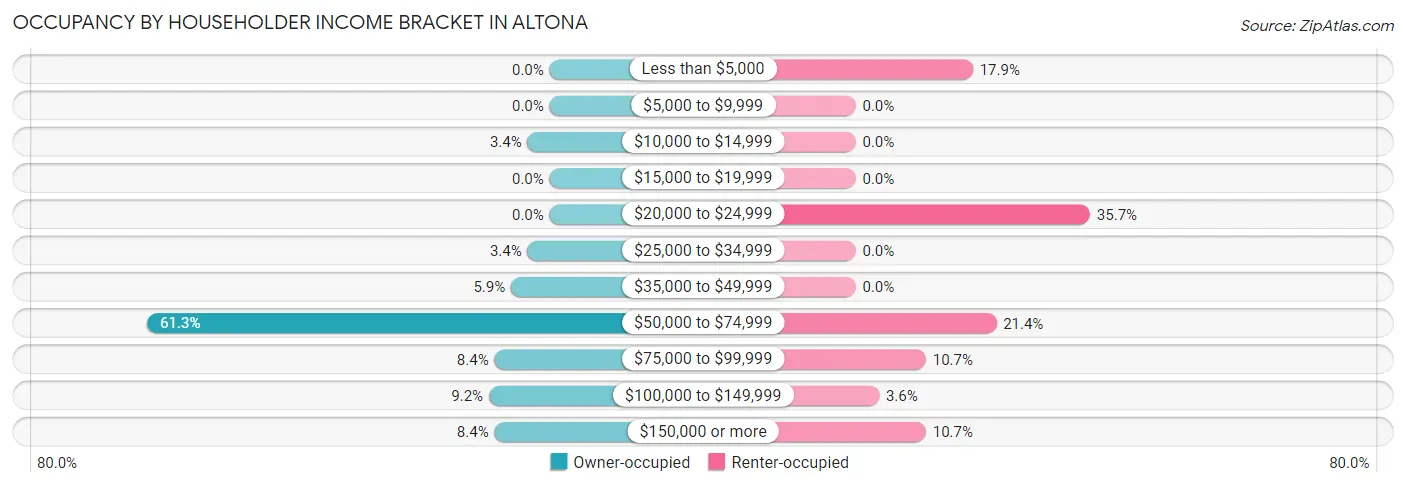
| Income Bracket | Owner-occupied | Renter-occupied |
| Less than $5,000 | 0 (0.0%) | 5 (17.9%) |
| $5,000 to $9,999 | 0 (0.0%) | 0 (0.0%) |
| $10,000 to $14,999 | 4 (3.4%) | 0 (0.0%) |
| $15,000 to $19,999 | 0 (0.0%) | 0 (0.0%) |
| $20,000 to $24,999 | 0 (0.0%) | 10 (35.7%) |
| $25,000 to $34,999 | 4 (3.4%) | 0 (0.0%) |
| $35,000 to $49,999 | 7 (5.9%) | 0 (0.0%) |
| $50,000 to $74,999 | 73 (61.3%) | 6 (21.4%) |
| $75,000 to $99,999 | 10 (8.4%) | 3 (10.7%) |
| $100,000 to $149,999 | 11 (9.2%) | 1 (3.6%) |
| $150,000 or more | 10 (8.4%) | 3 (10.7%) |
| Total | 119 (100.0%) | 28 (100.0%) |
Monthly Housing Cost Tiers in Altona
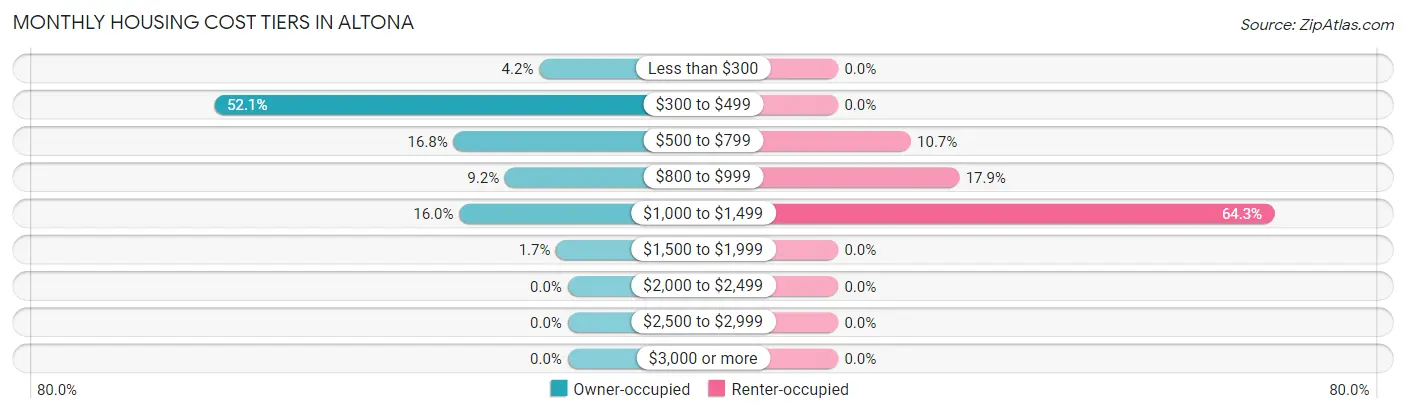
| Monthly Cost | Owner-occupied | Renter-occupied |
| Less than $300 | 5 (4.2%) | 0 (0.0%) |
| $300 to $499 | 62 (52.1%) | 0 (0.0%) |
| $500 to $799 | 20 (16.8%) | 3 (10.7%) |
| $800 to $999 | 11 (9.2%) | 5 (17.9%) |
| $1,000 to $1,499 | 19 (16.0%) | 18 (64.3%) |
| $1,500 to $1,999 | 2 (1.7%) | 0 (0.0%) |
| $2,000 to $2,499 | 0 (0.0%) | 0 (0.0%) |
| $2,500 to $2,999 | 0 (0.0%) | 0 (0.0%) |
| $3,000 or more | 0 (0.0%) | 0 (0.0%) |
| Total | 119 (100.0%) | 28 (100.0%) |
Physical Housing Characteristics in Altona
Housing Structures in Altona
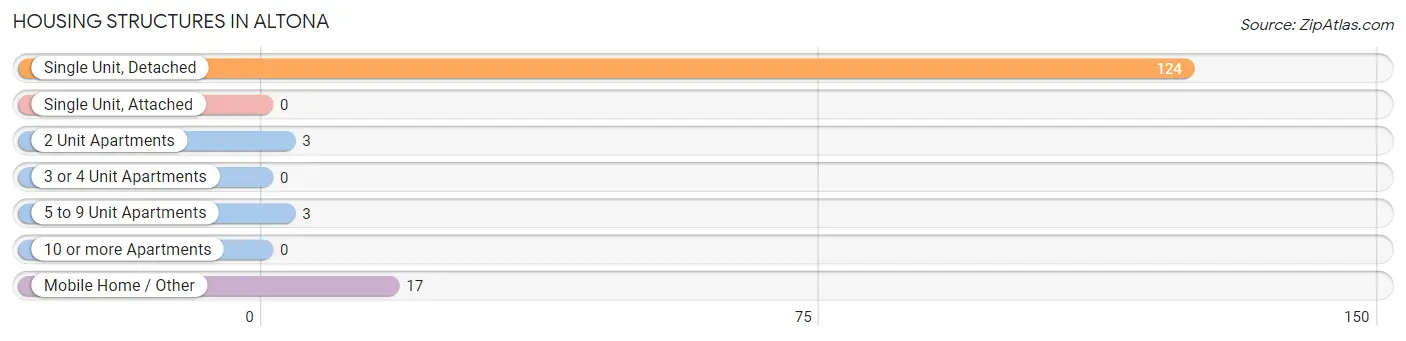
| Structure Type | # Housing Units | % Housing Units |
| Single Unit, Detached | 124 | 84.4% |
| Single Unit, Attached | 0 | 0.0% |
| 2 Unit Apartments | 3 | 2.0% |
| 3 or 4 Unit Apartments | 0 | 0.0% |
| 5 to 9 Unit Apartments | 3 | 2.0% |
| 10 or more Apartments | 0 | 0.0% |
| Mobile Home / Other | 17 | 11.6% |
| Total | 147 | 100.0% |
Housing Structures by Occupancy in Altona
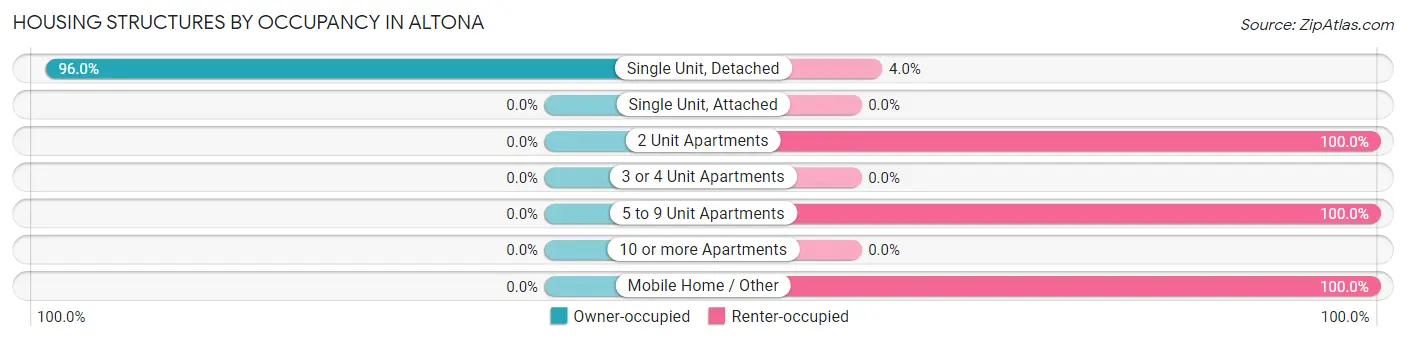
| Structure Type | Owner-occupied | Renter-occupied |
| Single Unit, Detached | 119 (96.0%) | 5 (4.0%) |
| Single Unit, Attached | 0 (0.0%) | 0 (0.0%) |
| 2 Unit Apartments | 0 (0.0%) | 3 (100.0%) |
| 3 or 4 Unit Apartments | 0 (0.0%) | 0 (0.0%) |
| 5 to 9 Unit Apartments | 0 (0.0%) | 3 (100.0%) |
| 10 or more Apartments | 0 (0.0%) | 0 (0.0%) |
| Mobile Home / Other | 0 (0.0%) | 17 (100.0%) |
| Total | 119 (80.9%) | 28 (19.1%) |
Housing Structures by Number of Rooms in Altona
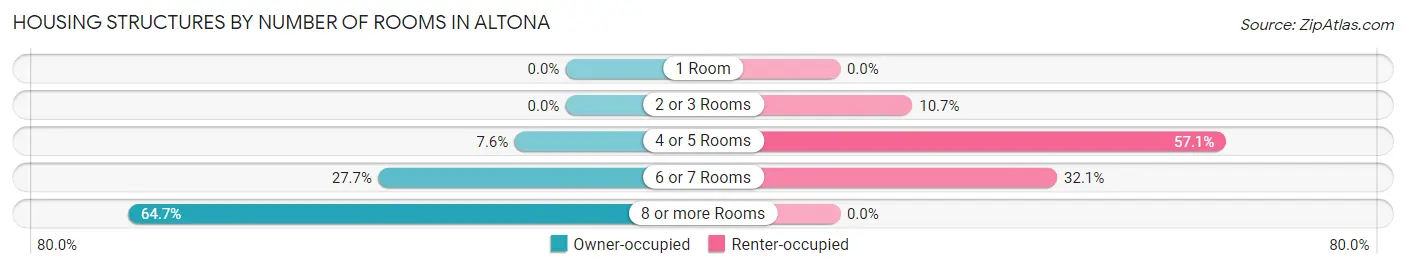
| Number of Rooms | Owner-occupied | Renter-occupied |
| 1 Room | 0 (0.0%) | 0 (0.0%) |
| 2 or 3 Rooms | 0 (0.0%) | 3 (10.7%) |
| 4 or 5 Rooms | 9 (7.6%) | 16 (57.1%) |
| 6 or 7 Rooms | 33 (27.7%) | 9 (32.1%) |
| 8 or more Rooms | 77 (64.7%) | 0 (0.0%) |
| Total | 119 (100.0%) | 28 (100.0%) |
Housing Structure by Heating Type in Altona
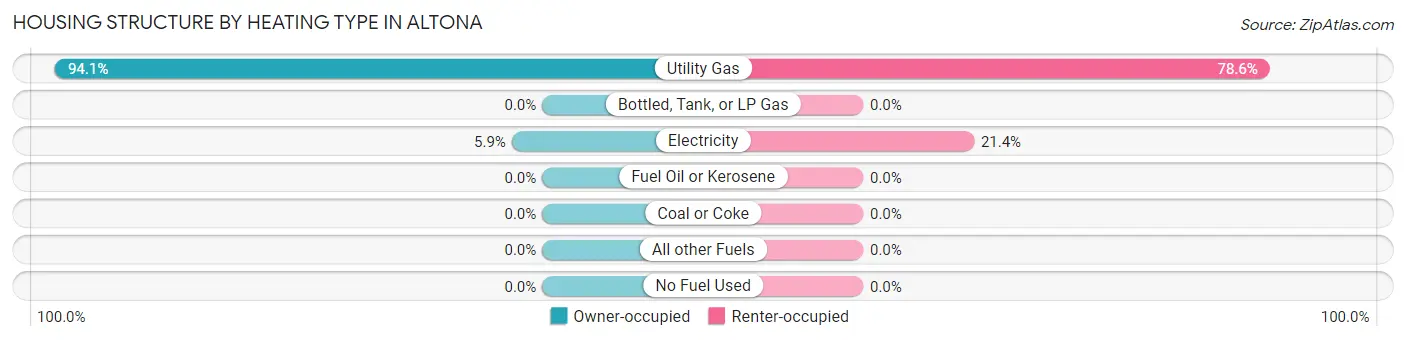
| Heating Type | Owner-occupied | Renter-occupied |
| Utility Gas | 112 (94.1%) | 22 (78.6%) |
| Bottled, Tank, or LP Gas | 0 (0.0%) | 0 (0.0%) |
| Electricity | 7 (5.9%) | 6 (21.4%) |
| Fuel Oil or Kerosene | 0 (0.0%) | 0 (0.0%) |
| Coal or Coke | 0 (0.0%) | 0 (0.0%) |
| All other Fuels | 0 (0.0%) | 0 (0.0%) |
| No Fuel Used | 0 (0.0%) | 0 (0.0%) |
| Total | 119 (100.0%) | 28 (100.0%) |
Household Vehicle Usage in Altona
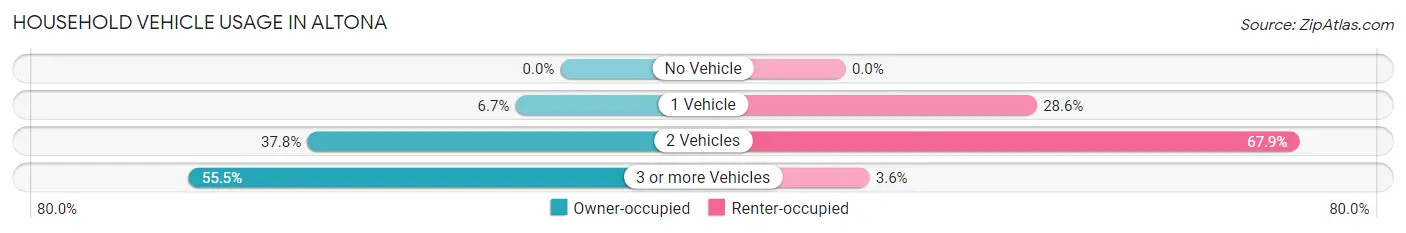
| Vehicles per Household | Owner-occupied | Renter-occupied |
| No Vehicle | 0 (0.0%) | 0 (0.0%) |
| 1 Vehicle | 8 (6.7%) | 8 (28.6%) |
| 2 Vehicles | 45 (37.8%) | 19 (67.9%) |
| 3 or more Vehicles | 66 (55.5%) | 1 (3.6%) |
| Total | 119 (100.0%) | 28 (100.0%) |
Real Estate & Mortgages in Altona
Real Estate and Mortgage Overview in Altona
| Characteristic | Without Mortgage | With Mortgage |
| Housing Units | 75 | 44 |
| Median Property Value | $107,900 | $115,000 |
| Median Household Income | $60,873 | $10 |
| Monthly Housing Costs | $377 | $0 |
| Real Estate Taxes | $520 | $0 |
Property Value by Mortgage Status in Altona
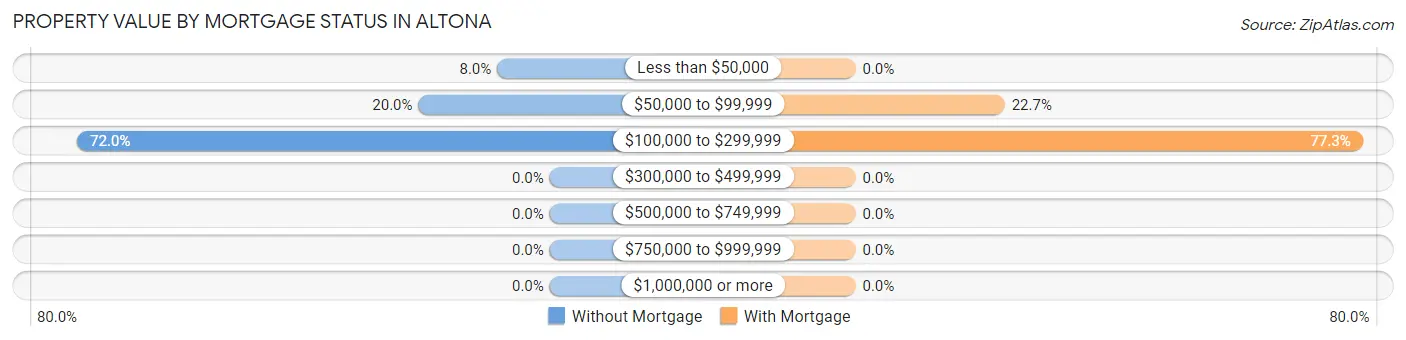
| Property Value | Without Mortgage | With Mortgage |
| Less than $50,000 | 6 (8.0%) | 0 (0.0%) |
| $50,000 to $99,999 | 15 (20.0%) | 10 (22.7%) |
| $100,000 to $299,999 | 54 (72.0%) | 34 (77.3%) |
| $300,000 to $499,999 | 0 (0.0%) | 0 (0.0%) |
| $500,000 to $749,999 | 0 (0.0%) | 0 (0.0%) |
| $750,000 to $999,999 | 0 (0.0%) | 0 (0.0%) |
| $1,000,000 or more | 0 (0.0%) | 0 (0.0%) |
| Total | 75 (100.0%) | 44 (100.0%) |
Household Income by Mortgage Status in Altona
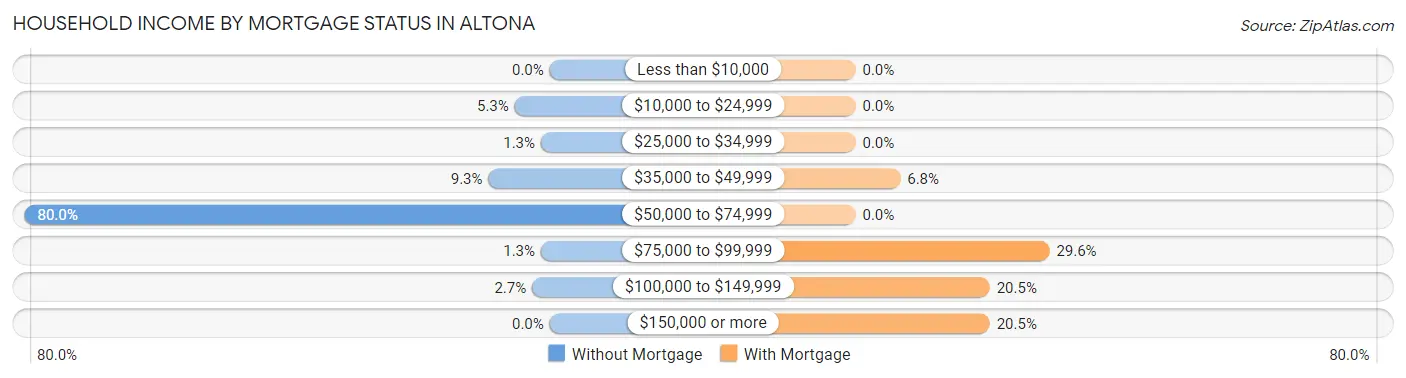
| Household Income | Without Mortgage | With Mortgage |
| Less than $10,000 | 0 (0.0%) | 0 (0.0%) |
| $10,000 to $24,999 | 4 (5.3%) | 0 (0.0%) |
| $25,000 to $34,999 | 1 (1.3%) | 0 (0.0%) |
| $35,000 to $49,999 | 7 (9.3%) | 3 (6.8%) |
| $50,000 to $74,999 | 60 (80.0%) | 0 (0.0%) |
| $75,000 to $99,999 | 1 (1.3%) | 13 (29.5%) |
| $100,000 to $149,999 | 2 (2.7%) | 9 (20.4%) |
| $150,000 or more | 0 (0.0%) | 9 (20.4%) |
| Total | 75 (100.0%) | 44 (100.0%) |
Property Value to Household Income Ratio in Altona
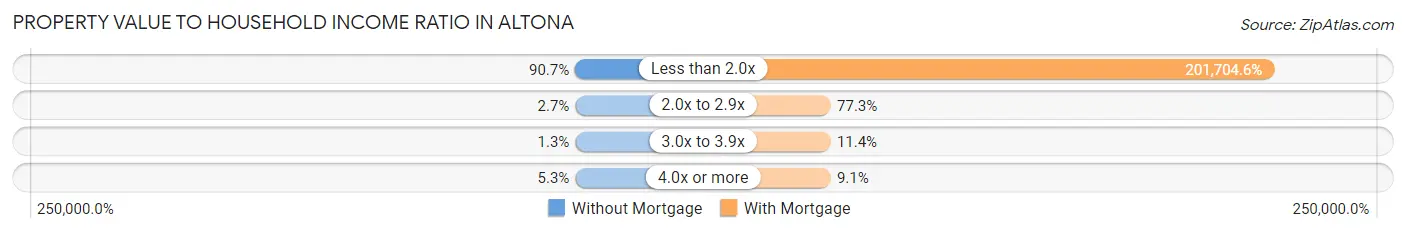
| Value-to-Income Ratio | Without Mortgage | With Mortgage |
| Less than 2.0x | 68 (90.7%) | 88,750 (201,704.5%) |
| 2.0x to 2.9x | 2 (2.7%) | 34 (77.3%) |
| 3.0x to 3.9x | 1 (1.3%) | 5 (11.4%) |
| 4.0x or more | 4 (5.3%) | 4 (9.1%) |
| Total | 75 (100.0%) | 44 (100.0%) |
Real Estate Taxes by Mortgage Status in Altona
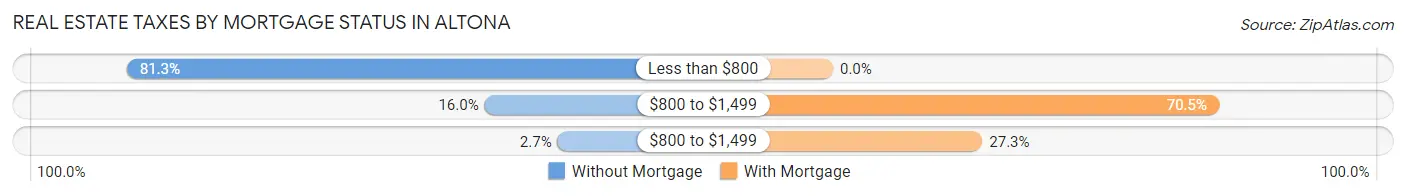
| Property Taxes | Without Mortgage | With Mortgage |
| Less than $800 | 61 (81.3%) | 0 (0.0%) |
| $800 to $1,499 | 12 (16.0%) | 31 (70.5%) |
| $800 to $1,499 | 2 (2.7%) | 12 (27.3%) |
| Total | 75 (100.0%) | 44 (100.0%) |
Health & Disability in Altona
Health Insurance Coverage by Age in Altona
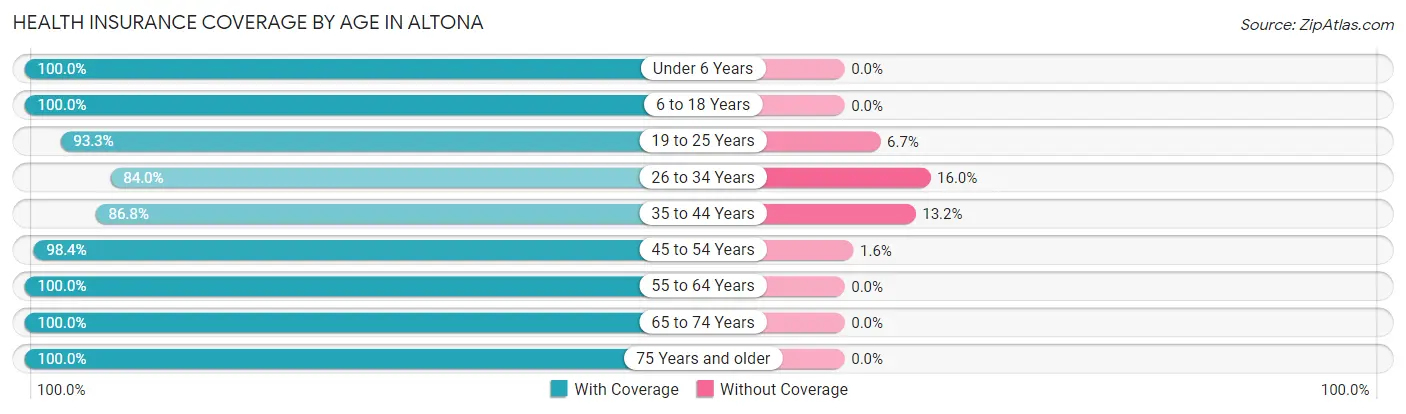
| Age Bracket | With Coverage | Without Coverage |
| Under 6 Years | 42 (100.0%) | 0 (0.0%) |
| 6 to 18 Years | 98 (100.0%) | 0 (0.0%) |
| 19 to 25 Years | 14 (93.3%) | 1 (6.7%) |
| 26 to 34 Years | 21 (84.0%) | 4 (16.0%) |
| 35 to 44 Years | 59 (86.8%) | 9 (13.2%) |
| 45 to 54 Years | 120 (98.4%) | 2 (1.6%) |
| 55 to 64 Years | 22 (100.0%) | 0 (0.0%) |
| 65 to 74 Years | 20 (100.0%) | 0 (0.0%) |
| 75 Years and older | 9 (100.0%) | 0 (0.0%) |
| Total | 405 (96.2%) | 16 (3.8%) |
Health Insurance Coverage by Citizenship Status in Altona

| Citizenship Status | With Coverage | Without Coverage |
| Native Born | 42 (100.0%) | 0 (0.0%) |
| Foreign Born, Citizen | 98 (100.0%) | 0 (0.0%) |
| Foreign Born, not a Citizen | 14 (93.3%) | 1 (6.7%) |
Health Insurance Coverage by Household Income in Altona
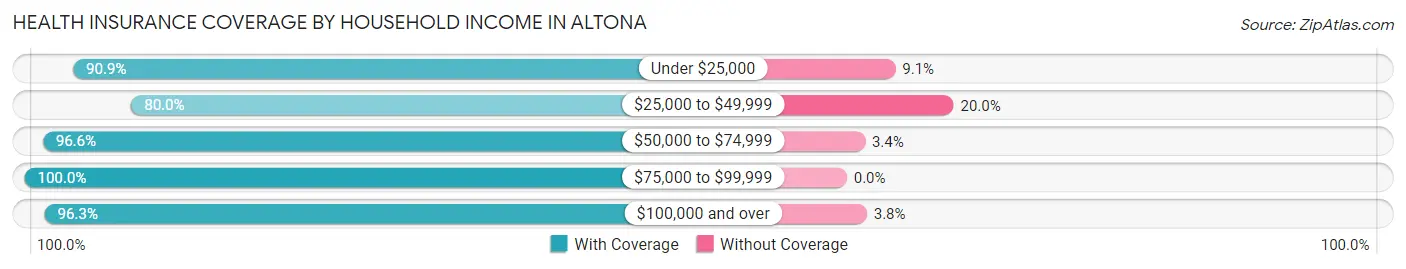
| Household Income | With Coverage | Without Coverage |
| Under $25,000 | 20 (90.9%) | 2 (9.1%) |
| $25,000 to $49,999 | 16 (80.0%) | 4 (20.0%) |
| $50,000 to $74,999 | 198 (96.6%) | 7 (3.4%) |
| $75,000 to $99,999 | 94 (100.0%) | 0 (0.0%) |
| $100,000 and over | 77 (96.3%) | 3 (3.7%) |
Public vs Private Health Insurance Coverage by Age in Altona
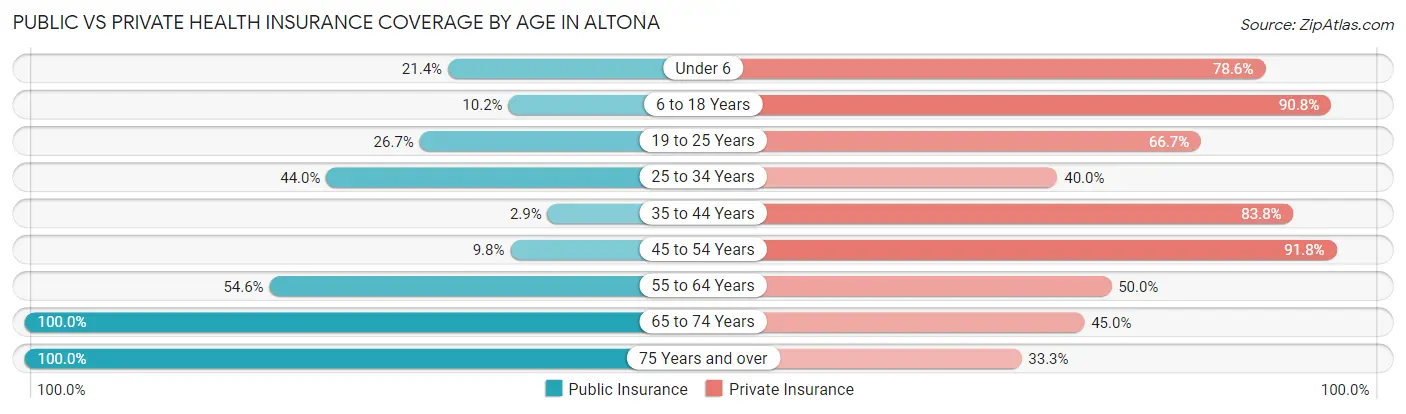
| Age Bracket | Public Insurance | Private Insurance |
| Under 6 | 9 (21.4%) | 33 (78.6%) |
| 6 to 18 Years | 10 (10.2%) | 89 (90.8%) |
| 19 to 25 Years | 4 (26.7%) | 10 (66.7%) |
| 25 to 34 Years | 11 (44.0%) | 10 (40.0%) |
| 35 to 44 Years | 2 (2.9%) | 57 (83.8%) |
| 45 to 54 Years | 12 (9.8%) | 112 (91.8%) |
| 55 to 64 Years | 12 (54.5%) | 11 (50.0%) |
| 65 to 74 Years | 20 (100.0%) | 9 (45.0%) |
| 75 Years and over | 9 (100.0%) | 3 (33.3%) |
| Total | 89 (21.1%) | 334 (79.3%) |
Disability Status by Sex by Age in Altona
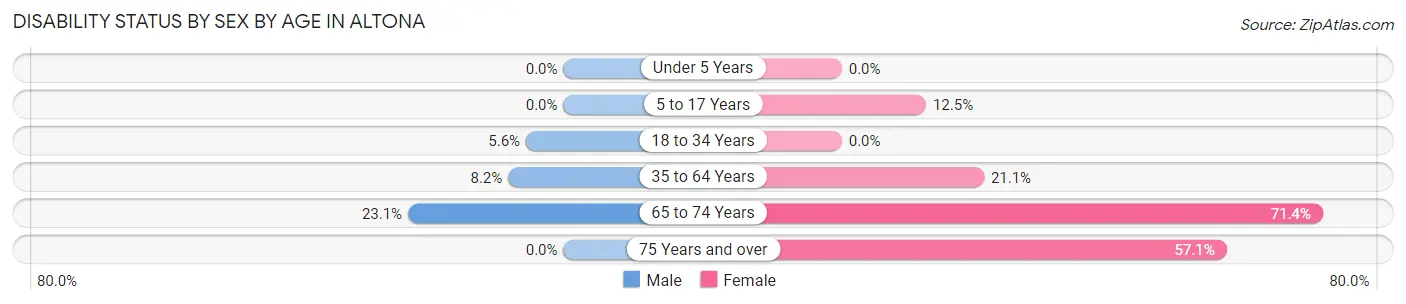
| Age Bracket | Male | Female |
| Under 5 Years | 0 (0.0%) | 0 (0.0%) |
| 5 to 17 Years | 0 (0.0%) | 5 (12.5%) |
| 18 to 34 Years | 1 (5.6%) | 0 (0.0%) |
| 35 to 64 Years | 10 (8.2%) | 19 (21.1%) |
| 65 to 74 Years | 3 (23.1%) | 5 (71.4%) |
| 75 Years and over | 0 (0.0%) | 4 (57.1%) |
Disability Class by Sex by Age in Altona
Disability Class: Hearing Difficulty
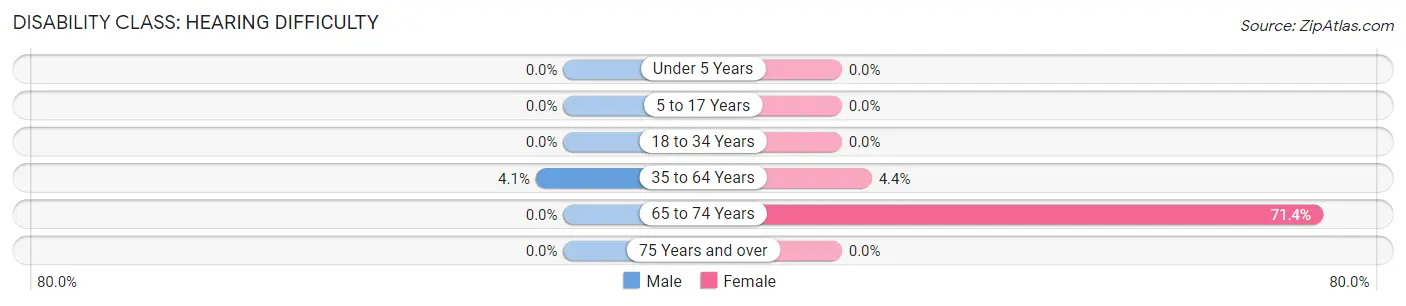
| Age Bracket | Male | Female |
| Under 5 Years | 0 (0.0%) | 0 (0.0%) |
| 5 to 17 Years | 0 (0.0%) | 0 (0.0%) |
| 18 to 34 Years | 0 (0.0%) | 0 (0.0%) |
| 35 to 64 Years | 5 (4.1%) | 4 (4.4%) |
| 65 to 74 Years | 0 (0.0%) | 5 (71.4%) |
| 75 Years and over | 0 (0.0%) | 0 (0.0%) |
Disability Class: Vision Difficulty
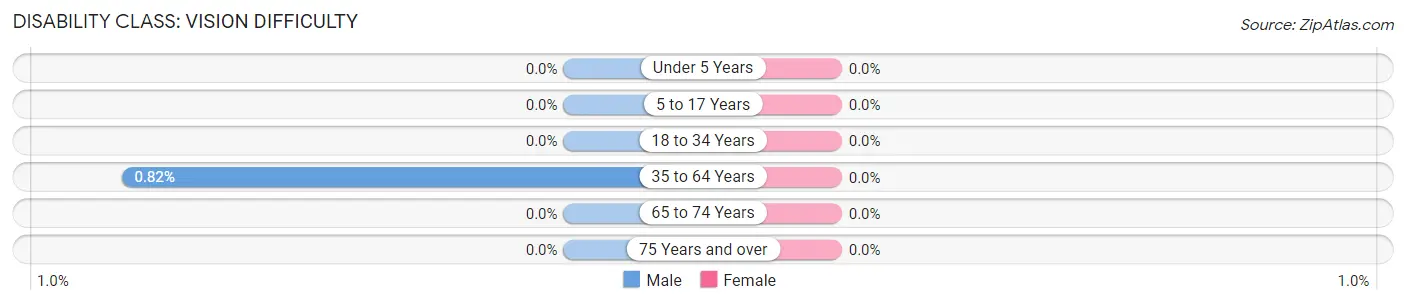
| Age Bracket | Male | Female |
| Under 5 Years | 0 (0.0%) | 0 (0.0%) |
| 5 to 17 Years | 0 (0.0%) | 0 (0.0%) |
| 18 to 34 Years | 0 (0.0%) | 0 (0.0%) |
| 35 to 64 Years | 1 (0.8%) | 0 (0.0%) |
| 65 to 74 Years | 0 (0.0%) | 0 (0.0%) |
| 75 Years and over | 0 (0.0%) | 0 (0.0%) |
Disability Class: Cognitive Difficulty
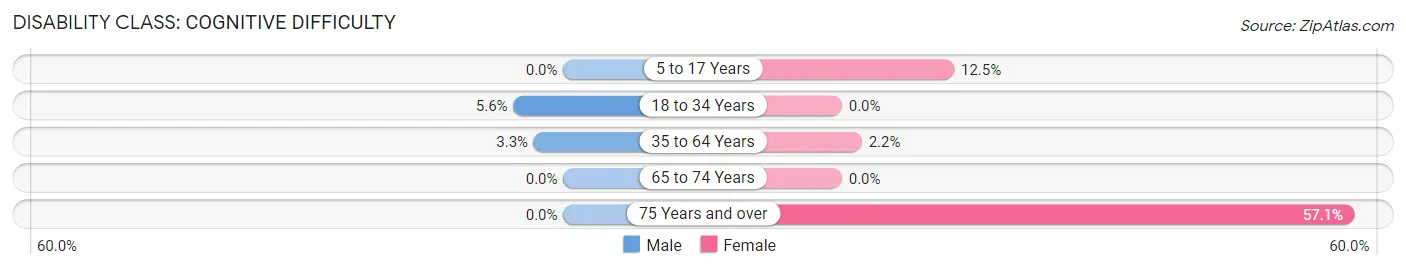
| Age Bracket | Male | Female |
| 5 to 17 Years | 0 (0.0%) | 5 (12.5%) |
| 18 to 34 Years | 1 (5.6%) | 0 (0.0%) |
| 35 to 64 Years | 4 (3.3%) | 2 (2.2%) |
| 65 to 74 Years | 0 (0.0%) | 0 (0.0%) |
| 75 Years and over | 0 (0.0%) | 4 (57.1%) |
Disability Class: Ambulatory Difficulty
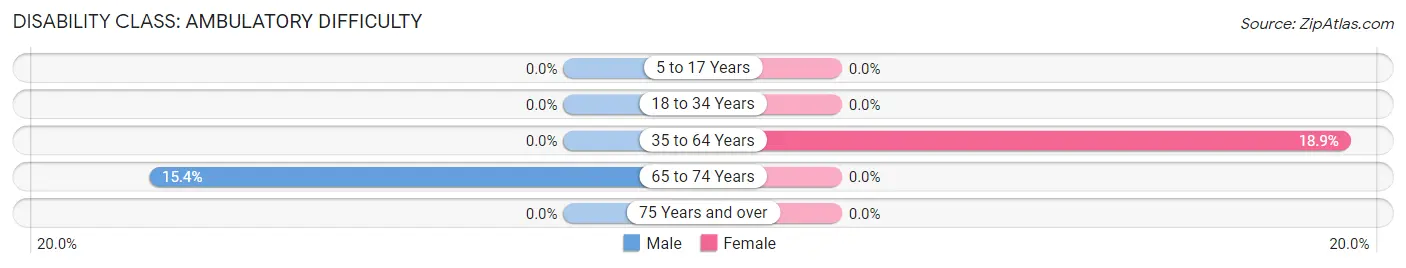
| Age Bracket | Male | Female |
| 5 to 17 Years | 0 (0.0%) | 0 (0.0%) |
| 18 to 34 Years | 0 (0.0%) | 0 (0.0%) |
| 35 to 64 Years | 0 (0.0%) | 17 (18.9%) |
| 65 to 74 Years | 2 (15.4%) | 0 (0.0%) |
| 75 Years and over | 0 (0.0%) | 0 (0.0%) |
Disability Class: Self-Care Difficulty
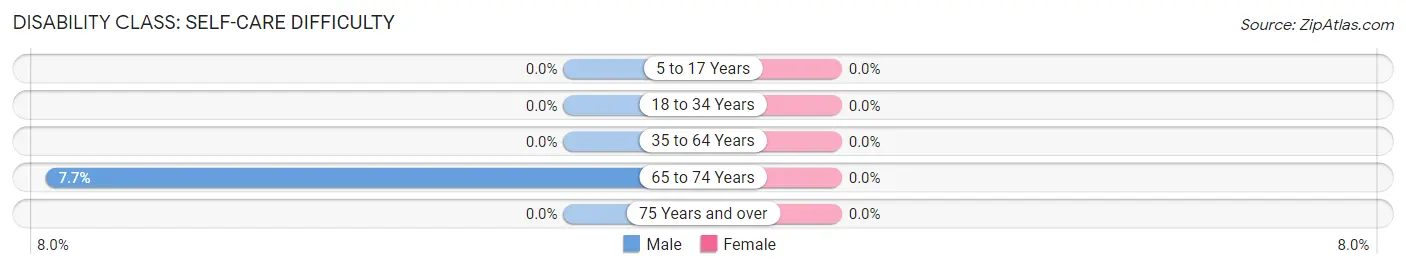
| Age Bracket | Male | Female |
| 5 to 17 Years | 0 (0.0%) | 0 (0.0%) |
| 18 to 34 Years | 0 (0.0%) | 0 (0.0%) |
| 35 to 64 Years | 0 (0.0%) | 0 (0.0%) |
| 65 to 74 Years | 1 (7.7%) | 0 (0.0%) |
| 75 Years and over | 0 (0.0%) | 0 (0.0%) |
Technology Access in Altona
Computing Device Access in Altona
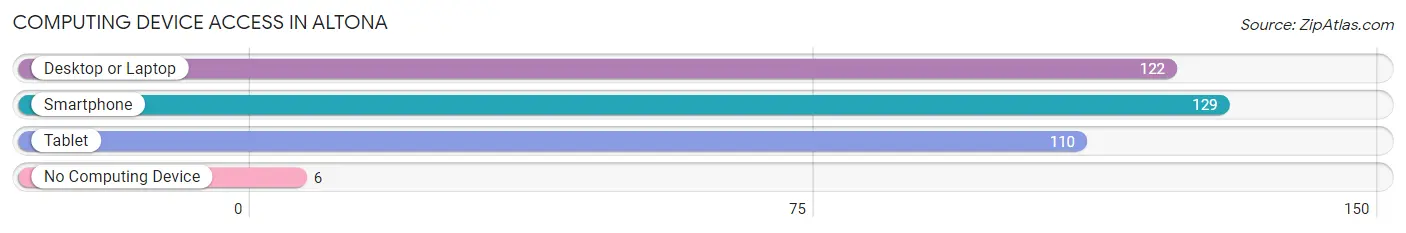
| Device Type | # Households | % Households |
| Desktop or Laptop | 122 | 83.0% |
| Smartphone | 129 | 87.8% |
| Tablet | 110 | 74.8% |
| No Computing Device | 6 | 4.1% |
| Total | 147 | 100.0% |
Internet Access in Altona
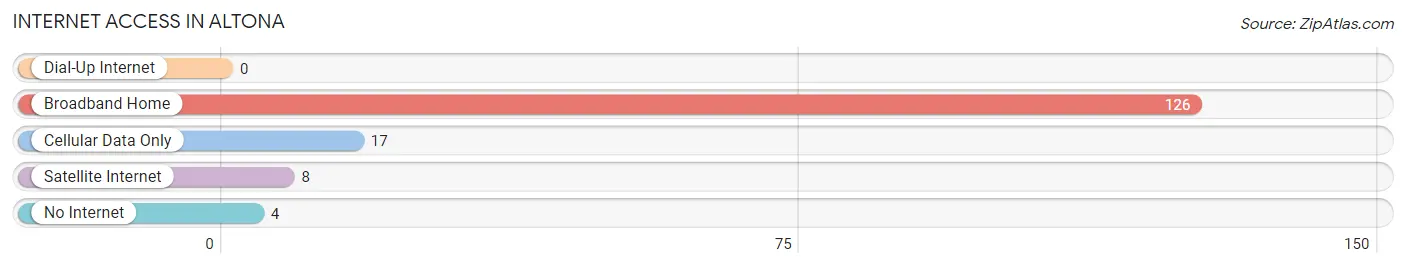
| Internet Type | # Households | % Households |
| Dial-Up Internet | 0 | 0.0% |
| Broadband Home | 126 | 85.7% |
| Cellular Data Only | 17 | 11.6% |
| Satellite Internet | 8 | 5.4% |
| No Internet | 4 | 2.7% |
| Total | 147 | 100.0% |
Altona Summary
Altona, Indiana is a small town located in the northwest corner of the state, in the county of Jasper. It is situated on the banks of the Patoka River, and is surrounded by rolling hills and farmland. The town has a population of just over 1,000 people, and is known for its small-town charm and friendly atmosphere.
History
Altona was founded in 1837 by a group of settlers from Germany. The town was named after the city of Altona in Germany, and the settlers brought with them many of the customs and traditions of their homeland. The town was originally a farming community, and the settlers grew a variety of crops, including corn, wheat, and oats. As the town grew, it became a center for trade and commerce, and the first post office was established in 1845.
In the late 19th century, the town began to experience a period of growth and prosperity. The railroad arrived in 1883, and the town became a hub for the surrounding area. The railroad brought with it new businesses and industries, and the town began to expand. By the early 20th century, Altona had become a thriving community, with a variety of stores, churches, and other businesses.
Geography
Altona is located in the northwest corner of Indiana, in the county of Jasper. It is situated on the banks of the Patoka River, and is surrounded by rolling hills and farmland. The town is located approximately 30 miles from the city of Evansville, and is within easy driving distance of several other cities in the region.
The climate in Altona is typical of the Midwest, with hot summers and cold winters. The average temperature in the summer is around 80 degrees Fahrenheit, and the average temperature in the winter is around 30 degrees Fahrenheit. The town receives an average of 40 inches of precipitation each year, and the area is known for its mild winters and hot summers.
Economy
Altona’s economy is largely based on agriculture and tourism. The town is home to several farms, which produce a variety of crops, including corn, wheat, and oats. The town is also home to several small businesses, including restaurants, shops, and other services.
Tourism is an important part of the local economy, and the town is home to several attractions, including the Patoka River National Wildlife Refuge, the Jasper-Pulaski Fish and Wildlife Area, and the Jasper-Pulaski State Park. The town also hosts several festivals and events throughout the year, including the Altona Harvest Festival and the Altona Music Festival.
Demographics
As of the 2010 census, Altona had a population of 1,072 people. The racial makeup of the town was 97.3% White, 0.7% African American, 0.2% Native American, 0.2% Asian, 0.2% from other races, and 1.6% from two or more races. The median household income was $37,500, and the median family income was $45,000. The town had a poverty rate of 16.2%.
Altona is a small town with a friendly atmosphere and a strong sense of community. The town is home to a variety of businesses and attractions, and is a popular destination for tourists and locals alike. The town is known for its small-town charm and its welcoming atmosphere, and is a great place to live and visit.
Common Questions
What is Per Capita Income in Altona?
Per Capita income in Altona is $25,307.
What is the Median Family Income in Altona?
Median Family Income in Altona is $61,392.
What is the Median Household income in Altona?
Median Household Income in Altona is $61,392.
What is Income or Wage Gap in Altona?
Income or Wage Gap in Altona is 52.6%.
Women in Altona earn 47.4 cents for every dollar earned by a man.
What is Inequality or Gini Index in Altona?
Inequality or Gini Index in Altona is 0.29.
What is the Total Population of Altona?
Total Population of Altona is 421.
What is the Total Male Population of Altona?
Total Male Population of Altona is 212.
What is the Total Female Population of Altona?
Total Female Population of Altona is 209.
What is the Ratio of Males per 100 Females in Altona?
There are 101.44 Males per 100 Females in Altona.
What is the Ratio of Females per 100 Males in Altona?
There are 98.58 Females per 100 Males in Altona.
What is the Median Population Age in Altona?
Median Population Age in Altona is 37.2 Years.
What is the Average Family Size in Altona
Average Family Size in Altona is 3.1 People.
What is the Average Household Size in Altona
Average Household Size in Altona is 2.9 People.
How Large is the Labor Force in Altona?
There are 177 People in the Labor Forcein in Altona.
What is the Percentage of People in the Labor Force in Altona?
55.1% of People are in the Labor Force in Altona.
What is the Unemployment Rate in Altona?
Unemployment Rate in Altona is 2.3%.