Akron, IN Map & Demographics
Akron Map
Akron Overview
$23,970
PER CAPITA INCOME
$58,681
AVG FAMILY INCOME
$58,958
AVG HOUSEHOLD INCOME
40.0%
WAGE / INCOME GAP [ % ]
60.0¢/ $1
WAGE / INCOME GAP [ $ ]
0.35
INEQUALITY / GINI INDEX
1,062
TOTAL POPULATION
513
MALE POPULATION
549
FEMALE POPULATION
93.44
MALES / 100 FEMALES
107.02
FEMALES / 100 MALES
34.5
MEDIAN AGE
3.4
AVG FAMILY SIZE
3.1
AVG HOUSEHOLD SIZE
540
LABOR FORCE [ PEOPLE ]
66.1%
PERCENT IN LABOR FORCE
10.9%
UNEMPLOYMENT RATE
Akron Zip Codes
Akron Area Codes
Income in Akron
Income Overview in Akron
Per Capita Income in Akron is $23,970, while median incomes of families and households are $58,681 and $58,958 respectively.
| Characteristic | Number | Measure |
| Per Capita Income | 1,062 | $23,970 |
| Median Family Income | 279 | $58,681 |
| Mean Family Income | 279 | $72,501 |
| Median Household Income | 339 | $58,958 |
| Mean Household Income | 339 | $72,384 |
| Income Deficit | 279 | $0 |
| Wage / Income Gap (%) | 1,062 | 39.99% |
| Wage / Income Gap ($) | 1,062 | 60.01¢ per $1 |
| Gini / Inequality Index | 1,062 | 0.35 |
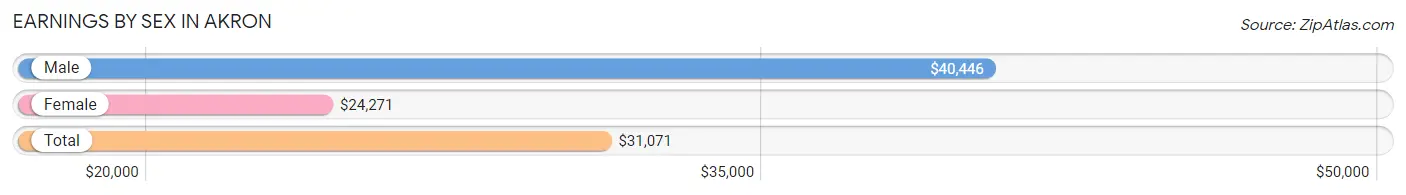
Earnings by Sex in Akron
Average Earnings in Akron are $31,071, $40,446 for men and $24,271 for women, a difference of 40.0%.
| Sex | Number | Average Earnings |
| Male | 308 (52.9%) | $40,446 |
| Female | 274 (47.1%) | $24,271 |
| Total | 582 (100.0%) | $31,071 |
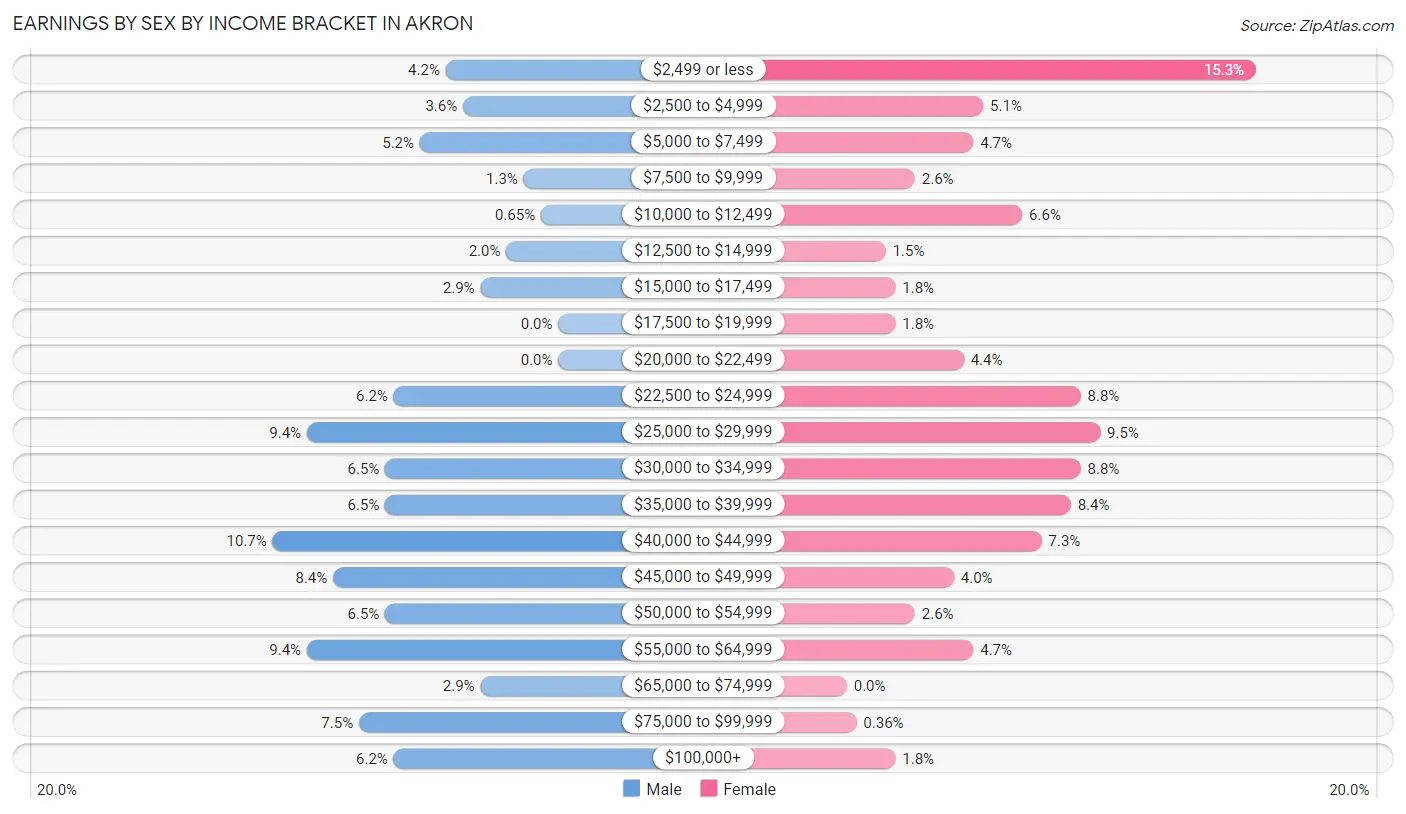
Earnings by Sex by Income Bracket in Akron
The most common earnings brackets in Akron are $40,000 to $44,999 for men (33 | 10.7%) and $2,499 or less for women (42 | 15.3%).
| Income | Male | Female |
| $2,499 or less | 13 (4.2%) | 42 (15.3%) |
| $2,500 to $4,999 | 11 (3.6%) | 14 (5.1%) |
| $5,000 to $7,499 | 16 (5.2%) | 13 (4.7%) |
| $7,500 to $9,999 | 4 (1.3%) | 7 (2.5%) |
| $10,000 to $12,499 | 2 (0.6%) | 18 (6.6%) |
| $12,500 to $14,999 | 6 (1.9%) | 4 (1.5%) |
| $15,000 to $17,499 | 9 (2.9%) | 5 (1.8%) |
| $17,500 to $19,999 | 0 (0.0%) | 5 (1.8%) |
| $20,000 to $22,499 | 0 (0.0%) | 12 (4.4%) |
| $22,500 to $24,999 | 19 (6.2%) | 24 (8.8%) |
| $25,000 to $29,999 | 29 (9.4%) | 26 (9.5%) |
| $30,000 to $34,999 | 20 (6.5%) | 24 (8.8%) |
| $35,000 to $39,999 | 20 (6.5%) | 23 (8.4%) |
| $40,000 to $44,999 | 33 (10.7%) | 20 (7.3%) |
| $45,000 to $49,999 | 26 (8.4%) | 11 (4.0%) |
| $50,000 to $54,999 | 20 (6.5%) | 7 (2.5%) |
| $55,000 to $64,999 | 29 (9.4%) | 13 (4.7%) |
| $65,000 to $74,999 | 9 (2.9%) | 0 (0.0%) |
| $75,000 to $99,999 | 23 (7.5%) | 1 (0.4%) |
| $100,000+ | 19 (6.2%) | 5 (1.8%) |
| Total | 308 (100.0%) | 274 (100.0%) |
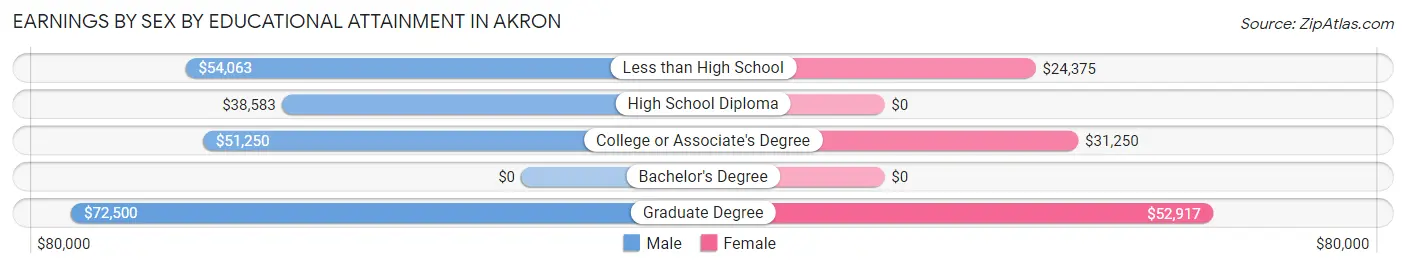
Earnings by Sex by Educational Attainment in Akron
Average earnings in Akron are $46,313 for men and $25,481 for women, a difference of 45.0%. Men with an educational attainment of graduate degree enjoy the highest average annual earnings of $72,500, while those with high school diploma education earn the least with $38,583. Women with an educational attainment of graduate degree earn the most with the average annual earnings of $52,917, while those with less than high school education have the smallest earnings of $24,375.
| Educational Attainment | Male Income | Female Income |
| Less than High School | $54,063 | $24,375 |
| High School Diploma | $38,583 | $0 |
| College or Associate's Degree | $51,250 | $31,250 |
| Bachelor's Degree | - | - |
| Graduate Degree | $72,500 | $52,917 |
| Total | $46,313 | $25,481 |
Family Income in Akron
Family Income Brackets in Akron
According to the Akron family income data, there are 70 families falling into the $35,000 to $49,999 income range, which is the most common income bracket and makes up 25.1% of all families.
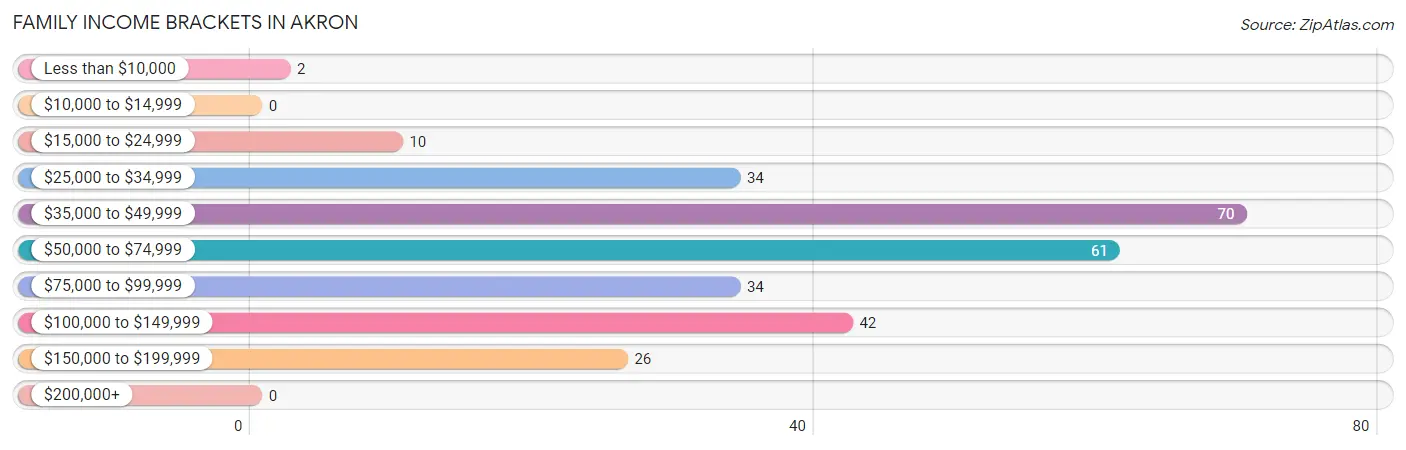
| Income Bracket | # Families | % Families |
| Less than $10,000 | 2 | 0.7% |
| $10,000 to $14,999 | 0 | 0.0% |
| $15,000 to $24,999 | 10 | 3.6% |
| $25,000 to $34,999 | 34 | 12.2% |
| $35,000 to $49,999 | 70 | 25.1% |
| $50,000 to $74,999 | 61 | 21.9% |
| $75,000 to $99,999 | 34 | 12.2% |
| $100,000 to $149,999 | 42 | 15.1% |
| $150,000 to $199,999 | 26 | 9.3% |
| $200,000+ | 0 | 0.0% |
Family Income by Famaliy Size in Akron
3-person families (67 | 24.0%) account for the highest median family income in Akron with $68,625 per family, while 2-person families (125 | 44.8%) have the highest median income of $23,660 per family member.
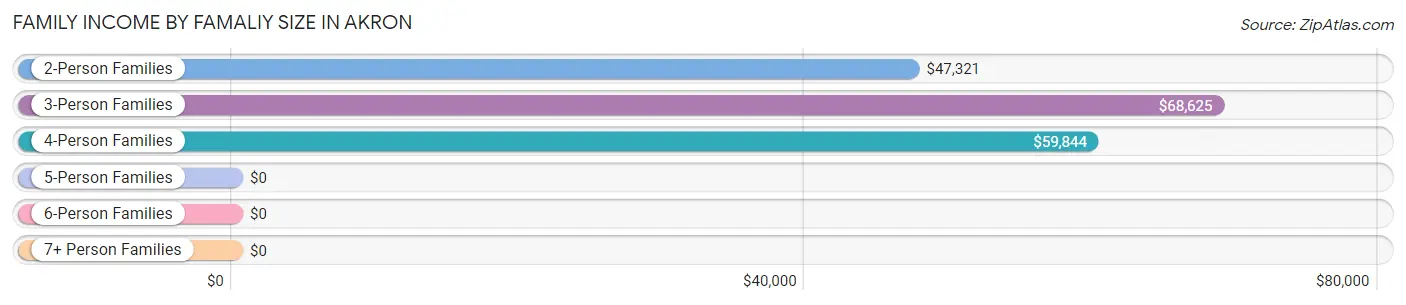
| Income Bracket | # Families | Median Income |
| 2-Person Families | 125 (44.8%) | $47,321 |
| 3-Person Families | 67 (24.0%) | $68,625 |
| 4-Person Families | 33 (11.8%) | $59,844 |
| 5-Person Families | 11 (3.9%) | $0 |
| 6-Person Families | 7 (2.5%) | $0 |
| 7+ Person Families | 36 (12.9%) | $0 |
| Total | 279 (100.0%) | $58,681 |
Family Income by Number of Earners in Akron
The median family income in Akron is $58,681, with families comprising 3+ earners (46) having the highest median family income of $100,625, while families with 1 earner (103) have the lowest median family income of $39,201, accounting for 16.5% and 36.9% of families, respectively.
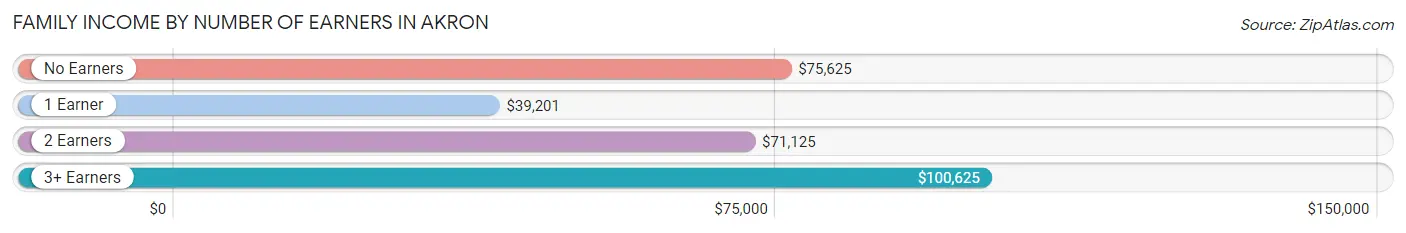
| Number of Earners | # Families | Median Income |
| No Earners | 19 (6.8%) | $75,625 |
| 1 Earner | 103 (36.9%) | $39,201 |
| 2 Earners | 111 (39.8%) | $71,125 |
| 3+ Earners | 46 (16.5%) | $100,625 |
| Total | 279 (100.0%) | $58,681 |
Household Income in Akron
Household Income Brackets in Akron
With 78 households falling in the category, the $50,000 to $74,999 income range is the most frequent in Akron, accounting for 23.0% of all households. In contrast, only 4 households (1.2%) fall into the $10,000 to $14,999 income bracket, making it the least populous group.
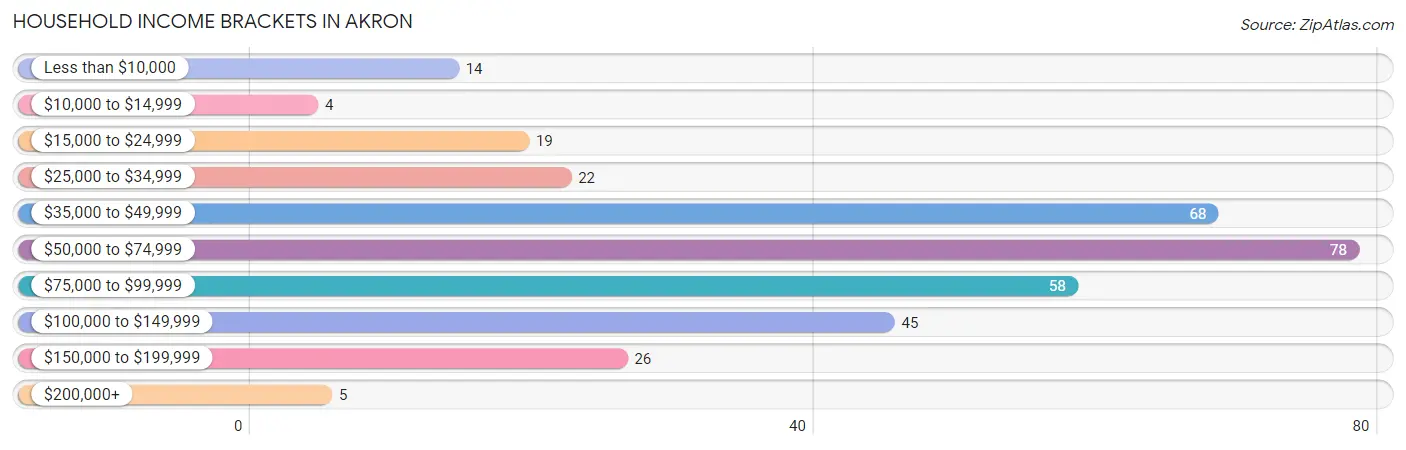
| Income Bracket | # Households | % Households |
| Less than $10,000 | 14 | 4.1% |
| $10,000 to $14,999 | 4 | 1.2% |
| $15,000 to $24,999 | 19 | 5.6% |
| $25,000 to $34,999 | 22 | 6.5% |
| $35,000 to $49,999 | 68 | 20.1% |
| $50,000 to $74,999 | 78 | 23.0% |
| $75,000 to $99,999 | 58 | 17.1% |
| $100,000 to $149,999 | 45 | 13.3% |
| $150,000 to $199,999 | 26 | 7.7% |
| $200,000+ | 5 | 1.5% |
Household Income by Householder Age in Akron
The median household income in Akron is $58,958, with the highest median household income of $71,719 found in the 45 to 64 years age bracket for the primary householder. A total of 123 households (36.3%) fall into this category. Meanwhile, the 65+ years age bracket for the primary householder has the lowest median household income of $39,492, with 89 households (26.3%) in this group.
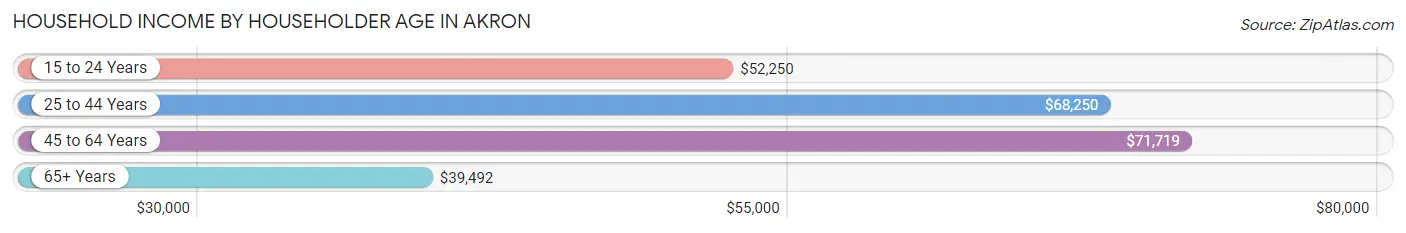
| Income Bracket | # Households | Median Income |
| 15 to 24 Years | 25 (7.4%) | $52,250 |
| 25 to 44 Years | 102 (30.1%) | $68,250 |
| 45 to 64 Years | 123 (36.3%) | $71,719 |
| 65+ Years | 89 (26.3%) | $39,492 |
| Total | 339 (100.0%) | $58,958 |
Poverty in Akron
Income Below Poverty by Sex and Age in Akron
With 14.8% poverty level for males and 16.0% for females among the residents of Akron, 12 to 14 year old males and 15 year old females are the most vulnerable to poverty, with 11 males (68.8%) and 4 females (50.0%) in their respective age groups living below the poverty level.
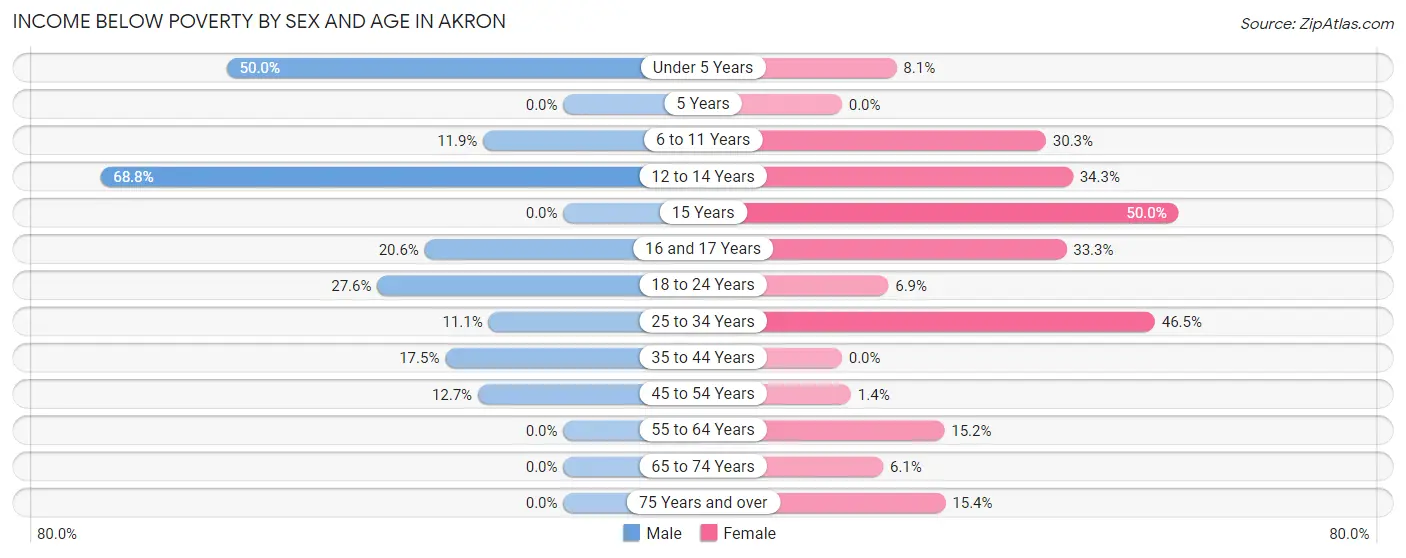
| Age Bracket | Male | Female |
| Under 5 Years | 8 (50.0%) | 6 (8.1%) |
| 5 Years | 0 (0.0%) | 0 (0.0%) |
| 6 to 11 Years | 5 (11.9%) | 10 (30.3%) |
| 12 to 14 Years | 11 (68.8%) | 12 (34.3%) |
| 15 Years | 0 (0.0%) | 4 (50.0%) |
| 16 and 17 Years | 7 (20.6%) | 6 (33.3%) |
| 18 to 24 Years | 21 (27.6%) | 4 (6.9%) |
| 25 to 34 Years | 5 (11.1%) | 33 (46.5%) |
| 35 to 44 Years | 10 (17.5%) | 0 (0.0%) |
| 45 to 54 Years | 9 (12.7%) | 1 (1.3%) |
| 55 to 64 Years | 0 (0.0%) | 7 (15.2%) |
| 65 to 74 Years | 0 (0.0%) | 3 (6.1%) |
| 75 Years and over | 0 (0.0%) | 2 (15.4%) |
| Total | 76 (14.8%) | 88 (16.0%) |
Income Above Poverty by Sex and Age in Akron
According to the poverty statistics in Akron, males aged 5 years and females aged 5 years are the age groups that are most secure financially, with 100.0% of males and 100.0% of females in these age groups living above the poverty line.
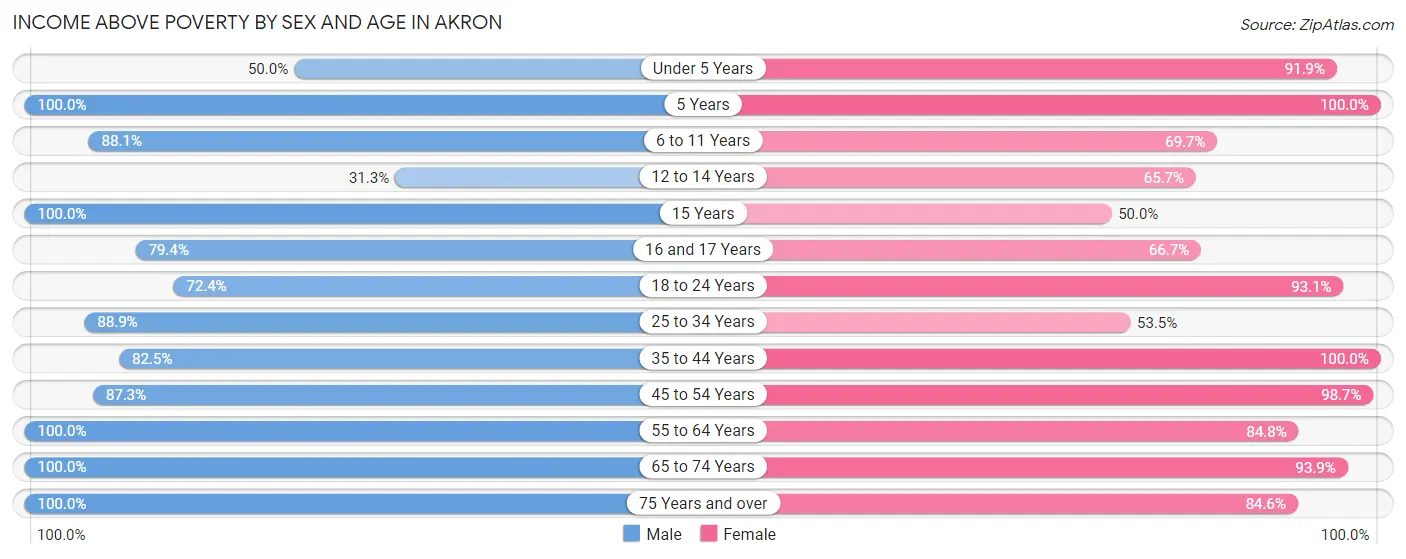
| Age Bracket | Male | Female |
| Under 5 Years | 8 (50.0%) | 68 (91.9%) |
| 5 Years | 7 (100.0%) | 3 (100.0%) |
| 6 to 11 Years | 37 (88.1%) | 23 (69.7%) |
| 12 to 14 Years | 5 (31.2%) | 23 (65.7%) |
| 15 Years | 11 (100.0%) | 4 (50.0%) |
| 16 and 17 Years | 27 (79.4%) | 12 (66.7%) |
| 18 to 24 Years | 55 (72.4%) | 54 (93.1%) |
| 25 to 34 Years | 40 (88.9%) | 38 (53.5%) |
| 35 to 44 Years | 47 (82.5%) | 67 (100.0%) |
| 45 to 54 Years | 62 (87.3%) | 73 (98.7%) |
| 55 to 64 Years | 62 (100.0%) | 39 (84.8%) |
| 65 to 74 Years | 57 (100.0%) | 46 (93.9%) |
| 75 Years and over | 19 (100.0%) | 11 (84.6%) |
| Total | 437 (85.2%) | 461 (84.0%) |
Income Below Poverty Among Married-Couple Families in Akron
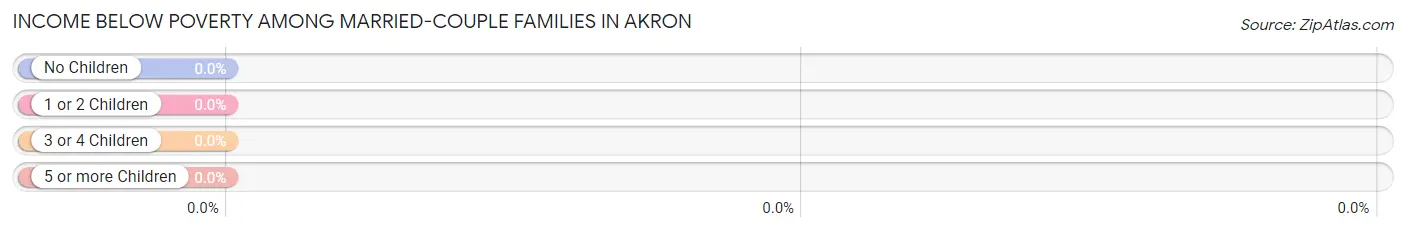
| Children | Above Poverty | Below Poverty |
| No Children | 119 (100.0%) | 0 (0.0%) |
| 1 or 2 Children | 58 (100.0%) | 0 (0.0%) |
| 3 or 4 Children | 27 (100.0%) | 0 (0.0%) |
| 5 or more Children | 0 (0.0%) | 0 (0.0%) |
| Total | 204 (100.0%) | 0 (0.0%) |
Income Below Poverty Among Single-Parent Households in Akron
According to the poverty data in Akron, 26.3% or 5 single-father households and 41.1% or 23 single-mother households are living below the poverty line. Among single-father households, those with 3 or 4 children have the highest poverty rate, with 5 households (100.0%) experiencing poverty. Likewise, among single-mother households, those with 5 or more children have the highest poverty rate, with 11 households (100.0%) falling below the poverty line.
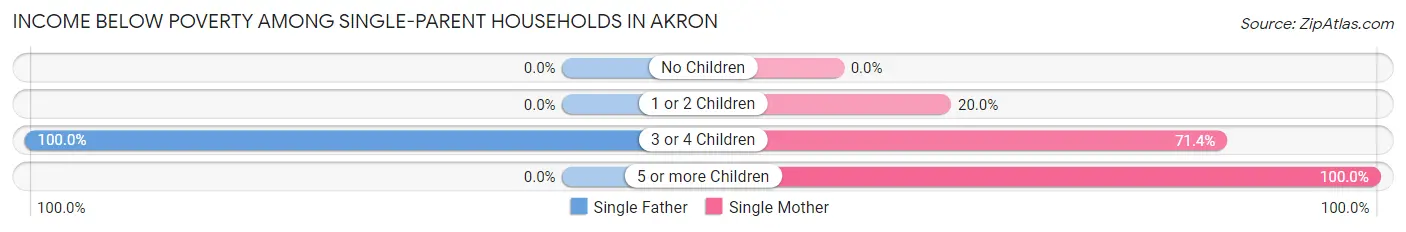
| Children | Single Father | Single Mother |
| No Children | 0 (0.0%) | 0 (0.0%) |
| 1 or 2 Children | 0 (0.0%) | 7 (20.0%) |
| 3 or 4 Children | 5 (100.0%) | 5 (71.4%) |
| 5 or more Children | 0 (0.0%) | 11 (100.0%) |
| Total | 5 (26.3%) | 23 (41.1%) |
Income Below Poverty Among Married-Couple vs Single-Parent Households in Akron
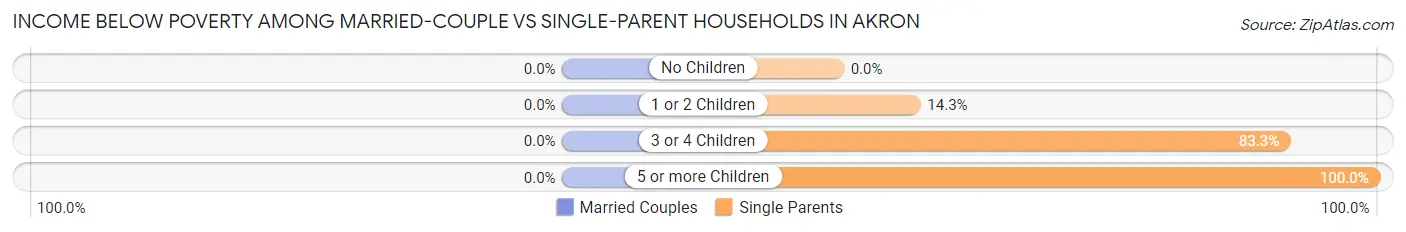
| Children | Married-Couple Families | Single-Parent Households |
| No Children | 0 (0.0%) | 0 (0.0%) |
| 1 or 2 Children | 0 (0.0%) | 7 (14.3%) |
| 3 or 4 Children | 0 (0.0%) | 10 (83.3%) |
| 5 or more Children | 0 (0.0%) | 11 (100.0%) |
| Total | 0 (0.0%) | 28 (37.3%) |
Race in Akron
The most populous races in Akron are White / Caucasian (723 | 68.1%), Hispanic or Latino (353 | 33.2%), and Some other Race (223 | 21.0%).
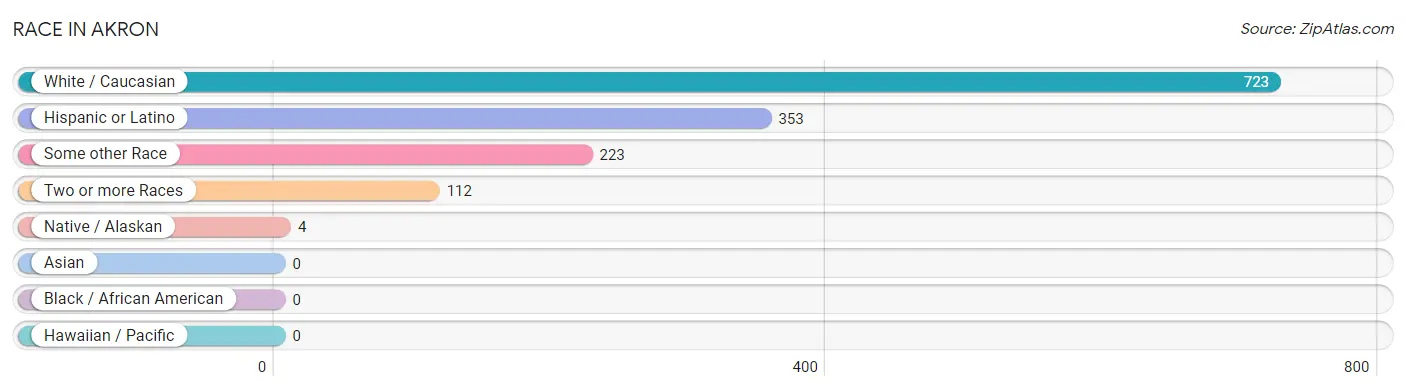
| Race | # Population | % Population |
| Asian | 0 | 0.0% |
| Black / African American | 0 | 0.0% |
| Hawaiian / Pacific | 0 | 0.0% |
| Hispanic or Latino | 353 | 33.2% |
| Native / Alaskan | 4 | 0.4% |
| White / Caucasian | 723 | 68.1% |
| Two or more Races | 112 | 10.5% |
| Some other Race | 223 | 21.0% |
| Total | 1,062 | 100.0% |
Ancestry in Akron
The most populous ancestries reported in Akron are Mexican (353 | 33.2%), German (177 | 16.7%), English (133 | 12.5%), American (84 | 7.9%), and Irish (31 | 2.9%), together accounting for 73.3% of all Akron residents.
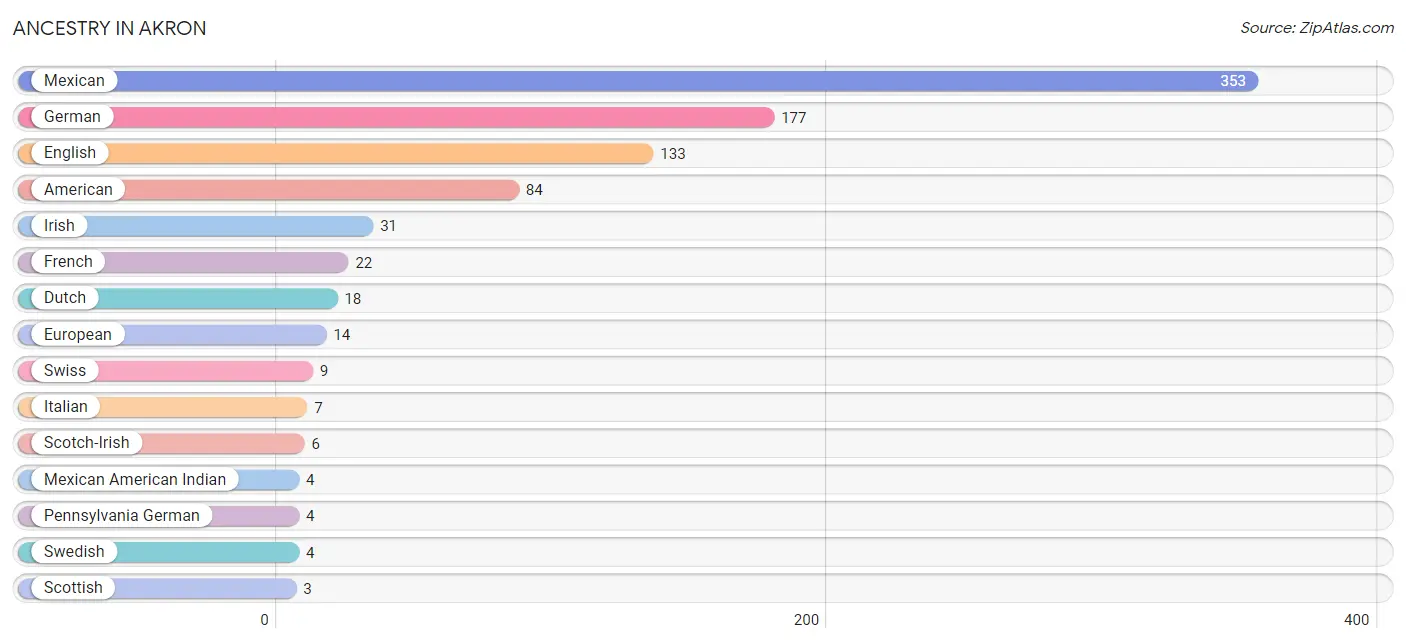
| Ancestry | # Population | % Population |
| American | 84 | 7.9% |
| Dutch | 18 | 1.7% |
| English | 133 | 12.5% |
| European | 14 | 1.3% |
| French | 22 | 2.1% |
| French Canadian | 2 | 0.2% |
| German | 177 | 16.7% |
| Irish | 31 | 2.9% |
| Italian | 7 | 0.7% |
| Mexican | 353 | 33.2% |
| Mexican American Indian | 4 | 0.4% |
| Pennsylvania German | 4 | 0.4% |
| Scotch-Irish | 6 | 0.6% |
| Scottish | 3 | 0.3% |
| Swedish | 4 | 0.4% |
| Swiss | 9 | 0.9% | View All 16 Rows |
Immigrants in Akron
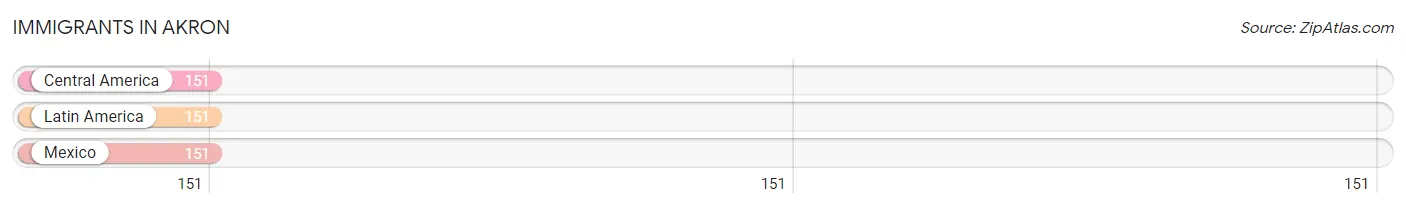
The most numerous immigrant groups reported in Akron came from Central America (151 | 14.2%), Latin America (151 | 14.2%), and Mexico (151 | 14.2%), together accounting for 42.7% of all Akron residents.
| Immigration Origin | # Population | % Population |
| Central America | 151 | 14.2% |
| Latin America | 151 | 14.2% |
| Mexico | 151 | 14.2% | View All 3 Rows |
Sex and Age in Akron
Sex and Age in Akron
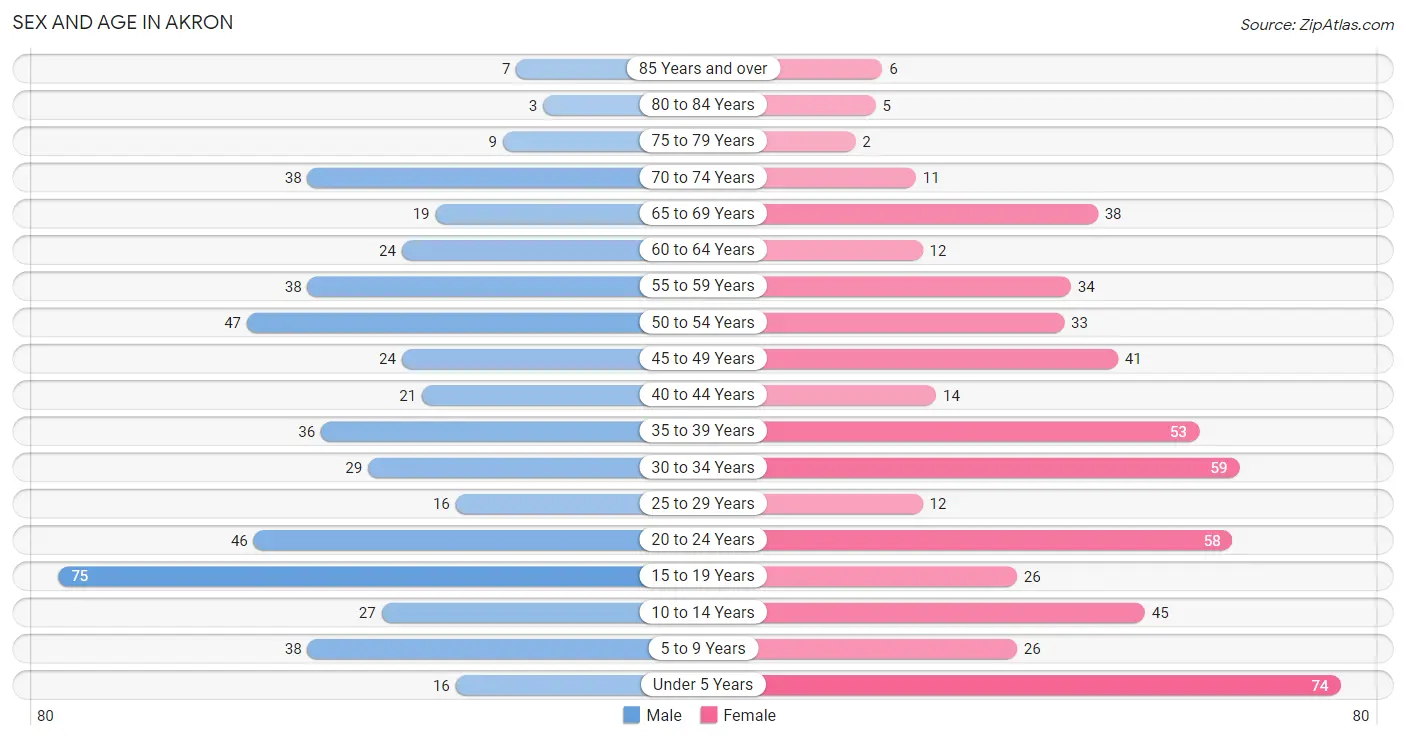
The most populous age groups in Akron are 15 to 19 Years (75 | 14.6%) for men and Under 5 Years (74 | 13.5%) for women.
| Age Bracket | Male | Female |
| Under 5 Years | 16 (3.1%) | 74 (13.5%) |
| 5 to 9 Years | 38 (7.4%) | 26 (4.7%) |
| 10 to 14 Years | 27 (5.3%) | 45 (8.2%) |
| 15 to 19 Years | 75 (14.6%) | 26 (4.7%) |
| 20 to 24 Years | 46 (9.0%) | 58 (10.6%) |
| 25 to 29 Years | 16 (3.1%) | 12 (2.2%) |
| 30 to 34 Years | 29 (5.7%) | 59 (10.7%) |
| 35 to 39 Years | 36 (7.0%) | 53 (9.7%) |
| 40 to 44 Years | 21 (4.1%) | 14 (2.5%) |
| 45 to 49 Years | 24 (4.7%) | 41 (7.5%) |
| 50 to 54 Years | 47 (9.2%) | 33 (6.0%) |
| 55 to 59 Years | 38 (7.4%) | 34 (6.2%) |
| 60 to 64 Years | 24 (4.7%) | 12 (2.2%) |
| 65 to 69 Years | 19 (3.7%) | 38 (6.9%) |
| 70 to 74 Years | 38 (7.4%) | 11 (2.0%) |
| 75 to 79 Years | 9 (1.8%) | 2 (0.4%) |
| 80 to 84 Years | 3 (0.6%) | 5 (0.9%) |
| 85 Years and over | 7 (1.4%) | 6 (1.1%) |
| Total | 513 (100.0%) | 549 (100.0%) |
Families and Households in Akron
Median Family Size in Akron
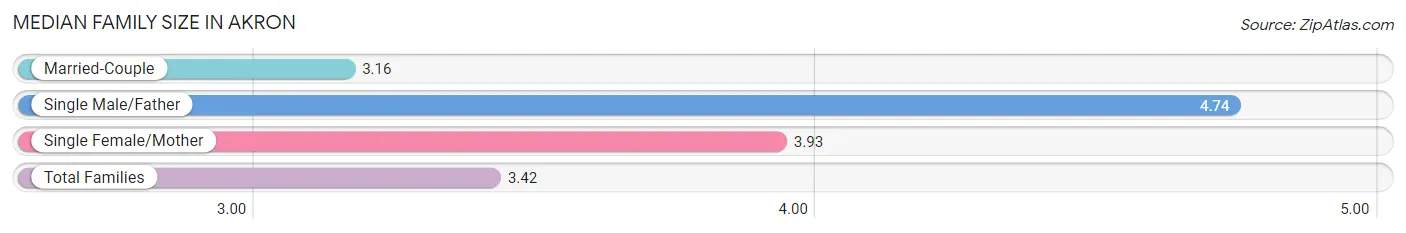
The median family size in Akron is 3.42 persons per family, with single male/father families (19 | 6.8%) accounting for the largest median family size of 4.74 persons per family. On the other hand, married-couple families (204 | 73.1%) represent the smallest median family size with 3.16 persons per family.
| Family Type | # Families | Family Size |
| Married-Couple | 204 (73.1%) | 3.16 |
| Single Male/Father | 19 (6.8%) | 4.74 |
| Single Female/Mother | 56 (20.1%) | 3.93 |
| Total Families | 279 (100.0%) | 3.42 |
Median Household Size in Akron
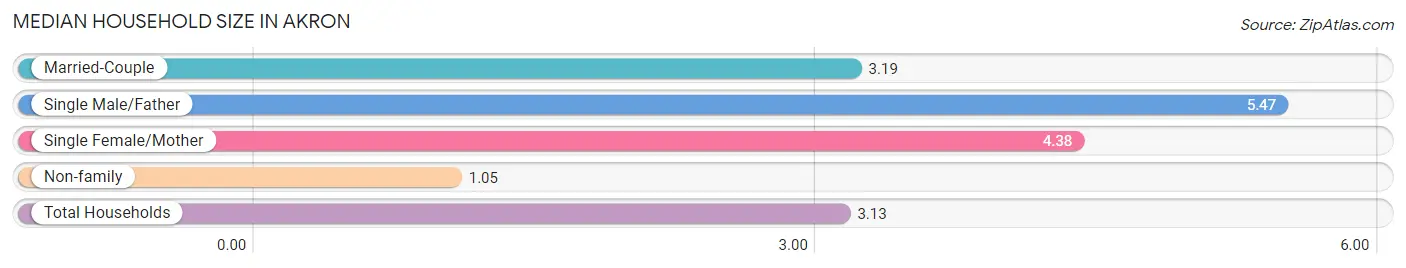
The median household size in Akron is 3.13 persons per household, with single male/father households (19 | 5.6%) accounting for the largest median household size of 5.47 persons per household. non-family households (60 | 17.7%) represent the smallest median household size with 1.05 persons per household.
| Household Type | # Households | Household Size |
| Married-Couple | 204 (60.2%) | 3.19 |
| Single Male/Father | 19 (5.6%) | 5.47 |
| Single Female/Mother | 56 (16.5%) | 4.38 |
| Non-family | 60 (17.7%) | 1.05 |
| Total Households | 339 (100.0%) | 3.13 |
Household Size by Marriage Status in Akron
Out of a total of 339 households in Akron, 279 (82.3%) are family households, while 60 (17.7%) are nonfamily households. The most numerous type of family households are 2-person households, comprising 113, and the most common type of nonfamily households are 1-person households, comprising 56.
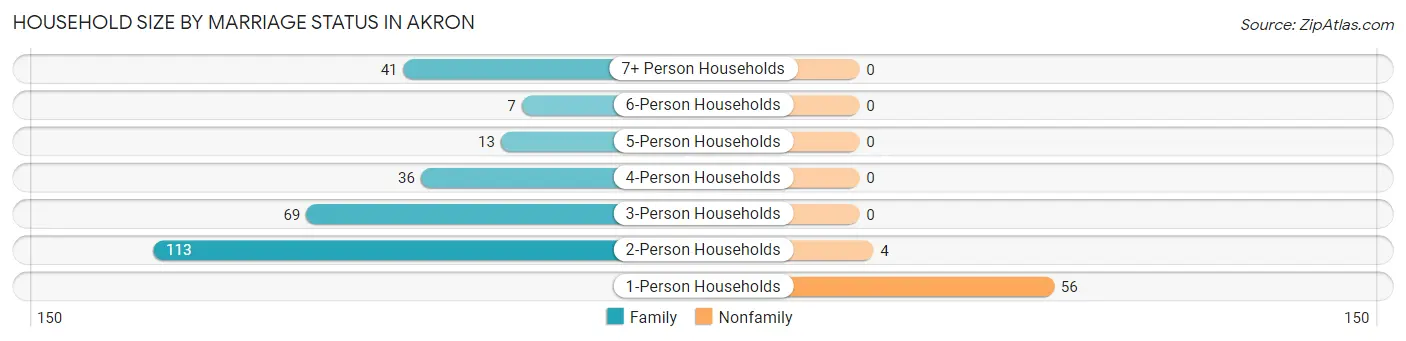
| Household Size | Family Households | Nonfamily Households |
| 1-Person Households | - | 56 (16.5%) |
| 2-Person Households | 113 (33.3%) | 4 (1.2%) |
| 3-Person Households | 69 (20.3%) | 0 (0.0%) |
| 4-Person Households | 36 (10.6%) | 0 (0.0%) |
| 5-Person Households | 13 (3.8%) | 0 (0.0%) |
| 6-Person Households | 7 (2.1%) | 0 (0.0%) |
| 7+ Person Households | 41 (12.1%) | 0 (0.0%) |
| Total | 279 (82.3%) | 60 (17.7%) |
Female Fertility in Akron
Fertility by Age in Akron
Average fertility rate in Akron is 91.0 births per 1,000 women. Women in the age bracket of 20 to 34 years have the highest fertility rate with 132.0 births per 1,000 women. Women in the age bracket of 20 to 34 years acount for 70.8% of all women with births.
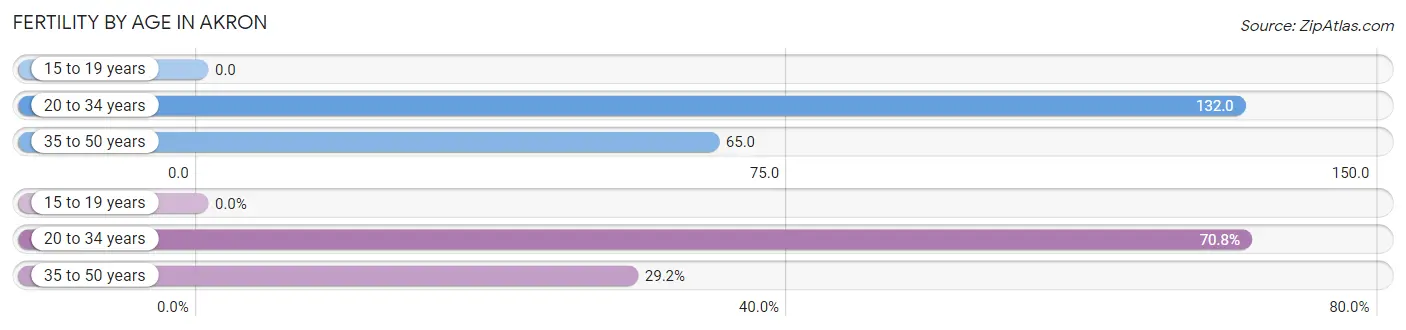
| Age Bracket | Women with Births | Births / 1,000 Women |
| 15 to 19 years | 0 (0.0%) | 0.0 |
| 20 to 34 years | 17 (70.8%) | 132.0 |
| 35 to 50 years | 7 (29.2%) | 65.0 |
| Total | 24 (100.0%) | 91.0 |
Fertility by Age by Marriage Status in Akron
45.8% of women with births (24) in Akron are married. The highest percentage of unmarried women with births falls into 20 to 34 years age bracket with 76.5% of them unmarried at the time of birth, while the lowest percentage of unmarried women with births belong to 35 to 50 years age bracket with 0.0% of them unmarried.
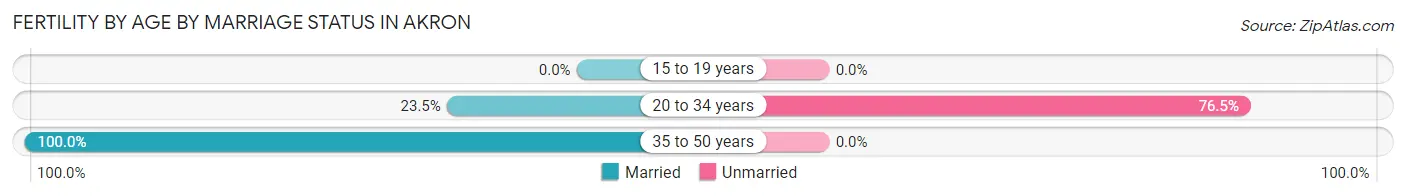
| Age Bracket | Married | Unmarried |
| 15 to 19 years | 0 (0.0%) | 0 (0.0%) |
| 20 to 34 years | 4 (23.5%) | 13 (76.5%) |
| 35 to 50 years | 7 (100.0%) | 0 (0.0%) |
| Total | 11 (45.8%) | 13 (54.2%) |
Fertility by Education in Akron
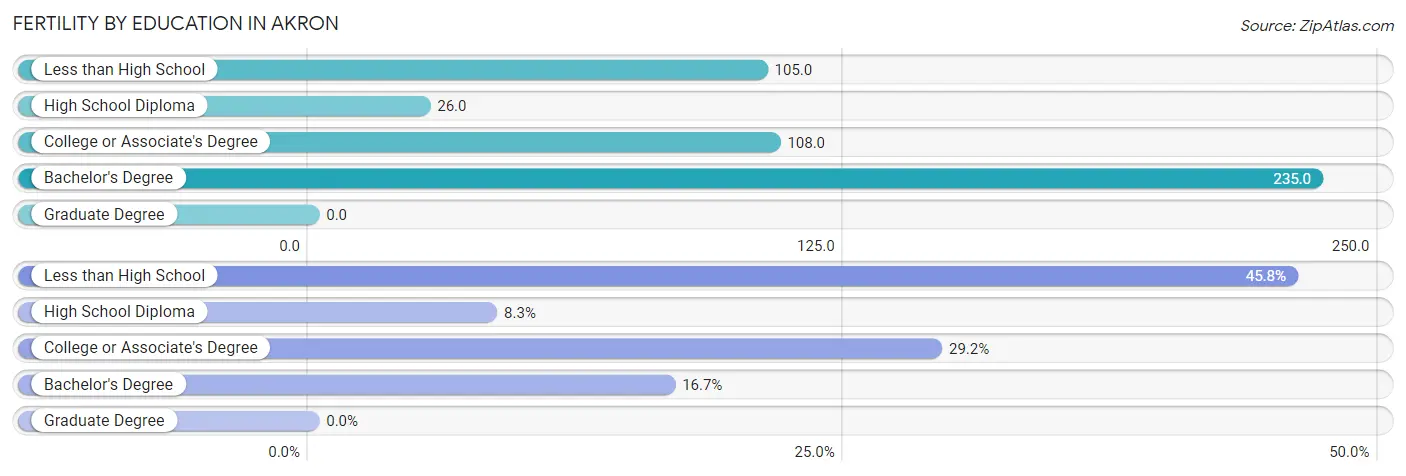
| Educational Attainment | Women with Births | Births / 1,000 Women |
| Less than High School | 11 (45.8%) | 105.0 |
| High School Diploma | 2 (8.3%) | 26.0 |
| College or Associate's Degree | 7 (29.2%) | 108.0 |
| Bachelor's Degree | 4 (16.7%) | 235.0 |
| Graduate Degree | 0 (0.0%) | 0.0 |
| Total | 24 (100.0%) | 91.0 |
Fertility by Education by Marriage Status in Akron
54.2% of women with births in Akron are unmarried. Women with the educational attainment of college or associate's degree are most likely to be married with 100.0% of them married at childbirth, while women with the educational attainment of less than high school are least likely to be married with 100.0% of them unmarried at childbirth.
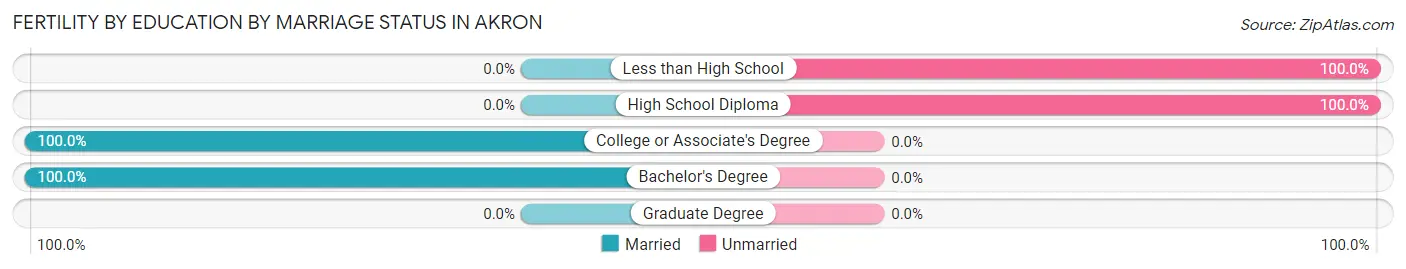
| Educational Attainment | Married | Unmarried |
| Less than High School | 0 (0.0%) | 11 (100.0%) |
| High School Diploma | 0 (0.0%) | 2 (100.0%) |
| College or Associate's Degree | 7 (100.0%) | 0 (0.0%) |
| Bachelor's Degree | 4 (100.0%) | 0 (0.0%) |
| Graduate Degree | 0 (0.0%) | 0 (0.0%) |
| Total | 11 (45.8%) | 13 (54.2%) |
Employment Characteristics in Akron
Employment by Class of Employer in Akron
Among the 458 employed individuals in Akron, private company employees (365 | 79.7%), not-for-profit organizations (39 | 8.5%), and local government employees (36 | 7.9%) make up the most common classes of employment.
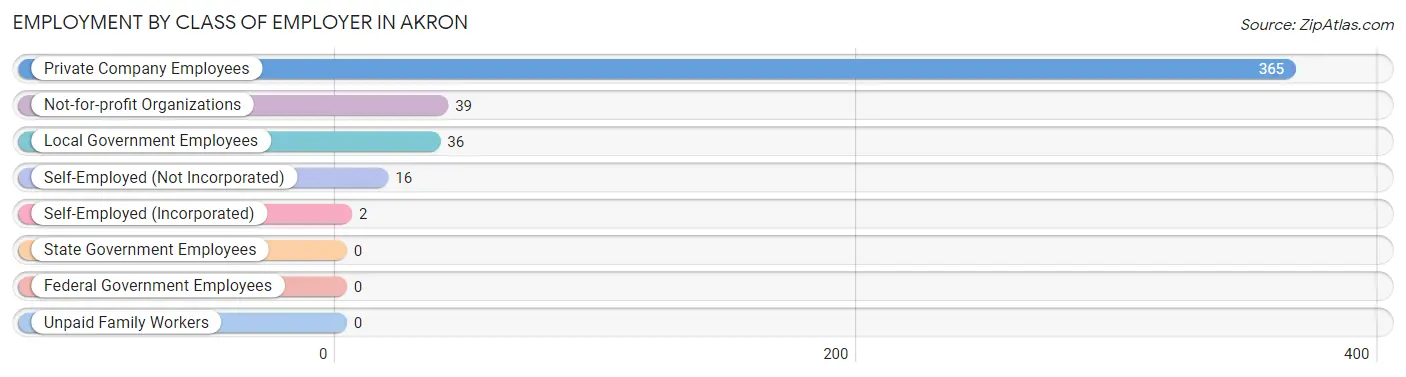
| Employer Class | # Employees | % Employees |
| Private Company Employees | 365 | 79.7% |
| Self-Employed (Incorporated) | 2 | 0.4% |
| Self-Employed (Not Incorporated) | 16 | 3.5% |
| Not-for-profit Organizations | 39 | 8.5% |
| Local Government Employees | 36 | 7.9% |
| State Government Employees | 0 | 0.0% |
| Federal Government Employees | 0 | 0.0% |
| Unpaid Family Workers | 0 | 0.0% |
| Total | 458 | 100.0% |
Employment Status by Age in Akron
According to the labor force statistics for Akron, out of the total population over 16 years of age (817), 66.1% or 540 individuals are in the labor force, with 10.9% or 59 of them unemployed. The age group with the highest labor force participation rate is 60 to 64 years, with 94.4% or 34 individuals in the labor force. Within the labor force, the 16 to 19 years age range has the highest percentage of unemployed individuals, with 47.2% or 17 of them being unemployed.
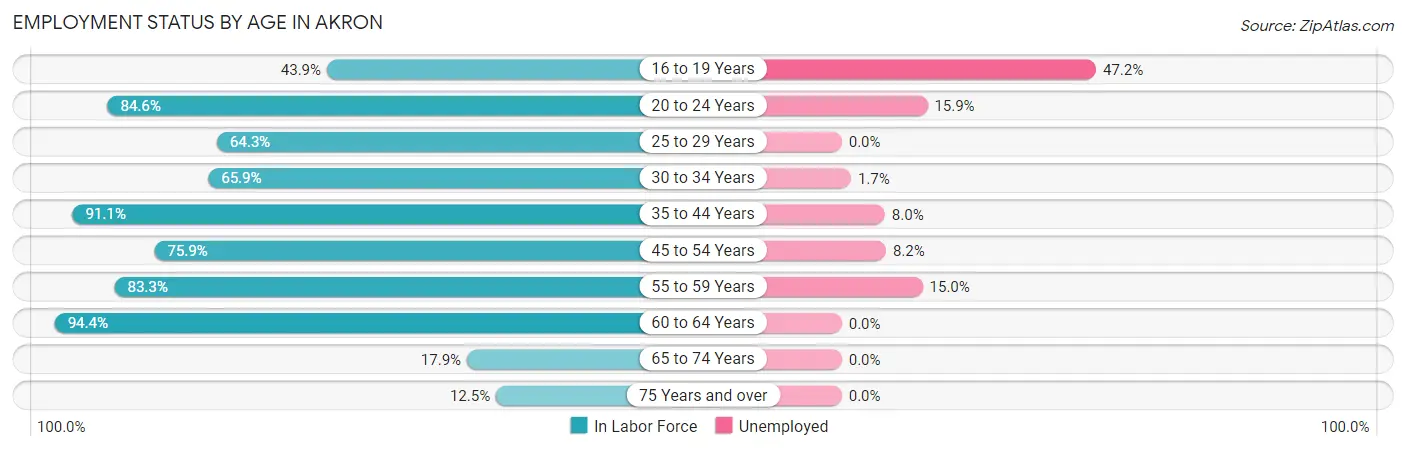
| Age Bracket | In Labor Force | Unemployed |
| 16 to 19 Years | 36 (43.9%) | 17 (47.2%) |
| 20 to 24 Years | 88 (84.6%) | 14 (15.9%) |
| 25 to 29 Years | 18 (64.3%) | 0 (0.0%) |
| 30 to 34 Years | 58 (65.9%) | 1 (1.7%) |
| 35 to 44 Years | 113 (91.1%) | 9 (8.0%) |
| 45 to 54 Years | 110 (75.9%) | 9 (8.2%) |
| 55 to 59 Years | 60 (83.3%) | 9 (15.0%) |
| 60 to 64 Years | 34 (94.4%) | 0 (0.0%) |
| 65 to 74 Years | 19 (17.9%) | 0 (0.0%) |
| 75 Years and over | 4 (12.5%) | 0 (0.0%) |
| Total | 540 (66.1%) | 59 (10.9%) |
Employment Status by Educational Attainment in Akron
According to labor force statistics for Akron, 79.7% of individuals (393) out of the total population between 25 and 64 years of age (493) are in the labor force, with 7.1% or 28 of them being unemployed. The group with the highest labor force participation rate are those with the educational attainment of bachelor's degree or higher, with 100.0% or 61 individuals in the labor force. Within the labor force, individuals with high school diploma education have the highest percentage of unemployment, with 11.5% or 18 of them being unemployed.
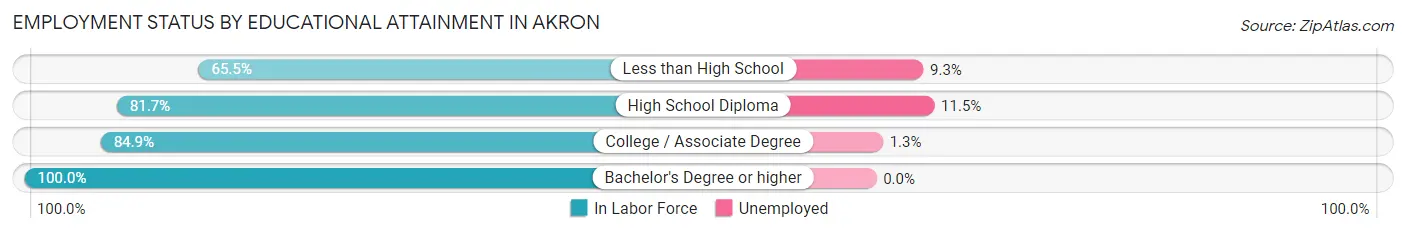
| Educational Attainment | In Labor Force | Unemployed |
| Less than High School | 97 (65.5%) | 14 (9.3%) |
| High School Diploma | 156 (81.7%) | 22 (11.5%) |
| College / Associate Degree | 79 (84.9%) | 1 (1.3%) |
| Bachelor's Degree or higher | 61 (100.0%) | 0 (0.0%) |
| Total | 393 (79.7%) | 35 (7.1%) |
Employment Occupations by Sex in Akron
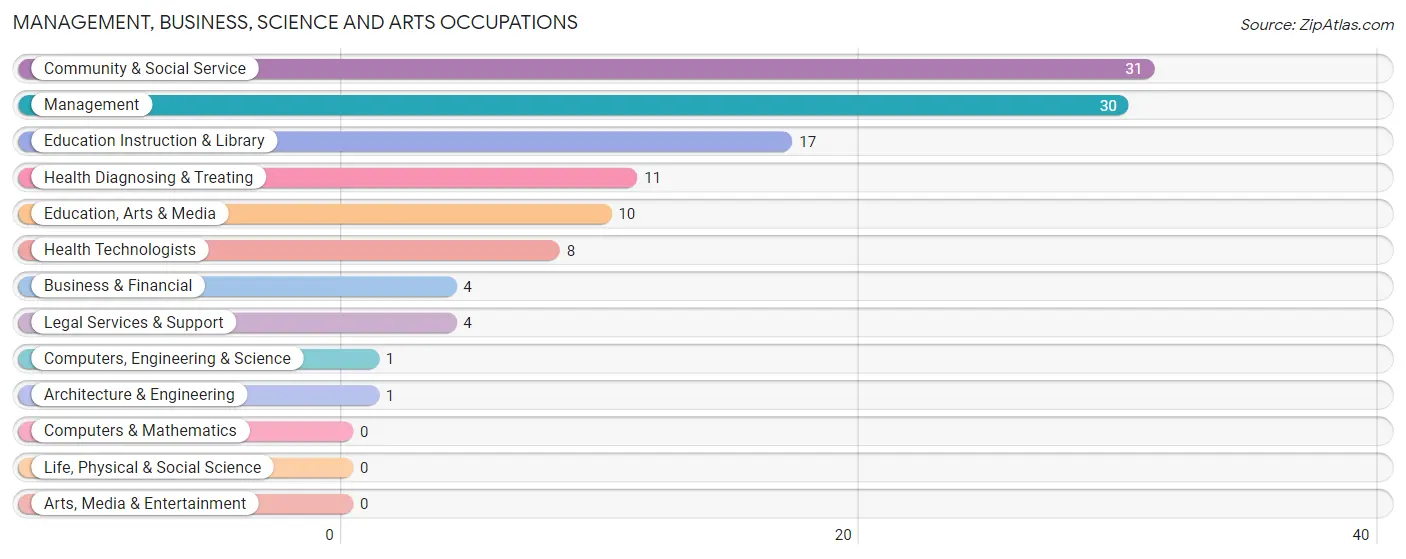
Management, Business, Science and Arts Occupations
The most common Management, Business, Science and Arts occupations in Akron are Community & Social Service (31 | 6.4%), Management (30 | 6.2%), Education Instruction & Library (17 | 3.5%), Health Diagnosing & Treating (11 | 2.3%), and Education, Arts & Media (10 | 2.1%).
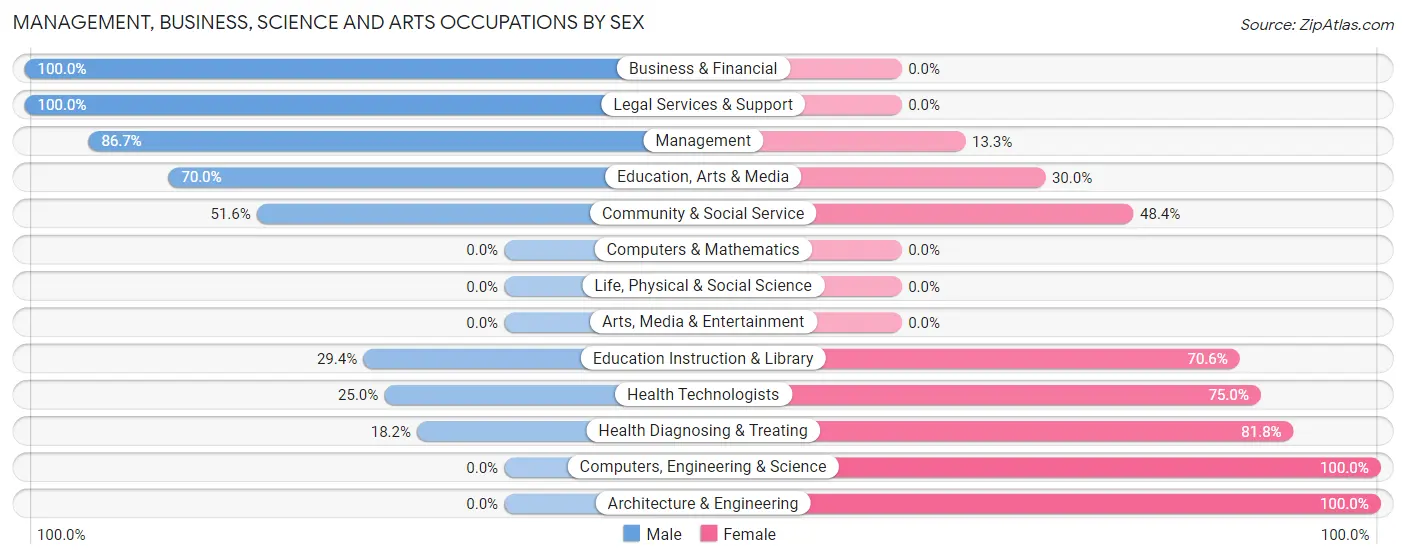
Management, Business, Science and Arts Occupations by Sex
Within the Management, Business, Science and Arts occupations in Akron, the most male-oriented occupations are Business & Financial (100.0%), Legal Services & Support (100.0%), and Management (86.7%), while the most female-oriented occupations are Computers, Engineering & Science (100.0%), Architecture & Engineering (100.0%), and Health Diagnosing & Treating (81.8%).
| Occupation | Male | Female |
| Management | 26 (86.7%) | 4 (13.3%) |
| Business & Financial | 4 (100.0%) | 0 (0.0%) |
| Computers, Engineering & Science | 0 (0.0%) | 1 (100.0%) |
| Computers & Mathematics | 0 (0.0%) | 0 (0.0%) |
| Architecture & Engineering | 0 (0.0%) | 1 (100.0%) |
| Life, Physical & Social Science | 0 (0.0%) | 0 (0.0%) |
| Community & Social Service | 16 (51.6%) | 15 (48.4%) |
| Education, Arts & Media | 7 (70.0%) | 3 (30.0%) |
| Legal Services & Support | 4 (100.0%) | 0 (0.0%) |
| Education Instruction & Library | 5 (29.4%) | 12 (70.6%) |
| Arts, Media & Entertainment | 0 (0.0%) | 0 (0.0%) |
| Health Diagnosing & Treating | 2 (18.2%) | 9 (81.8%) |
| Health Technologists | 2 (25.0%) | 6 (75.0%) |
| Total (Category) | 48 (62.3%) | 29 (37.7%) |
| Total (Overall) | 268 (55.7%) | 213 (44.3%) |
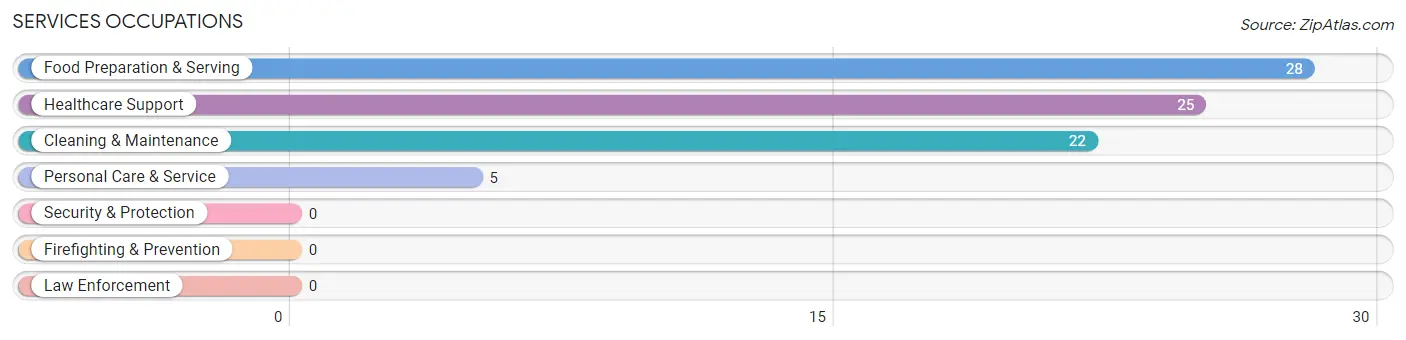
Services Occupations
The most common Services occupations in Akron are Food Preparation & Serving (28 | 5.8%), Healthcare Support (25 | 5.2%), Cleaning & Maintenance (22 | 4.6%), and Personal Care & Service (5 | 1.0%).
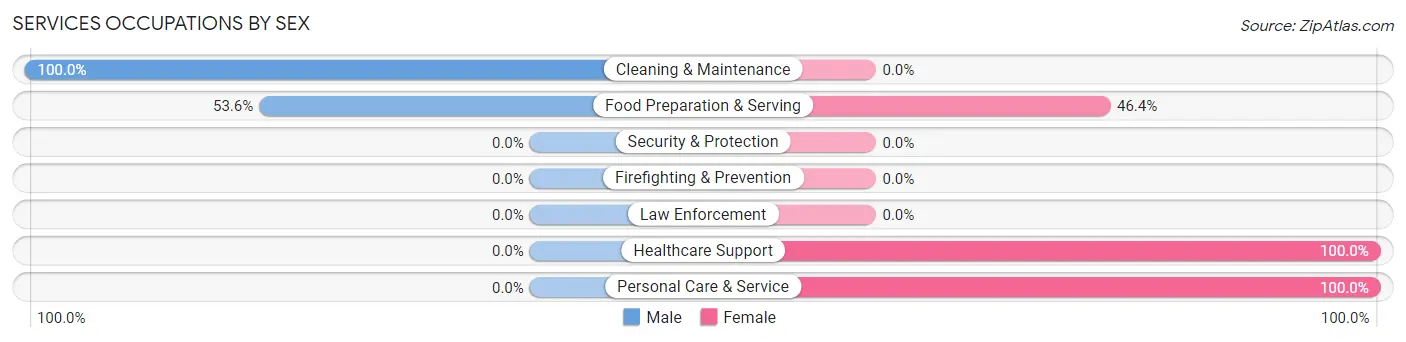
Services Occupations by Sex
Within the Services occupations in Akron, the most male-oriented occupations are Cleaning & Maintenance (100.0%), and Food Preparation & Serving (53.6%), while the most female-oriented occupations are Healthcare Support (100.0%), Personal Care & Service (100.0%), and Food Preparation & Serving (46.4%).
| Occupation | Male | Female |
| Healthcare Support | 0 (0.0%) | 25 (100.0%) |
| Security & Protection | 0 (0.0%) | 0 (0.0%) |
| Firefighting & Prevention | 0 (0.0%) | 0 (0.0%) |
| Law Enforcement | 0 (0.0%) | 0 (0.0%) |
| Food Preparation & Serving | 15 (53.6%) | 13 (46.4%) |
| Cleaning & Maintenance | 22 (100.0%) | 0 (0.0%) |
| Personal Care & Service | 0 (0.0%) | 5 (100.0%) |
| Total (Category) | 37 (46.3%) | 43 (53.7%) |
| Total (Overall) | 268 (55.7%) | 213 (44.3%) |
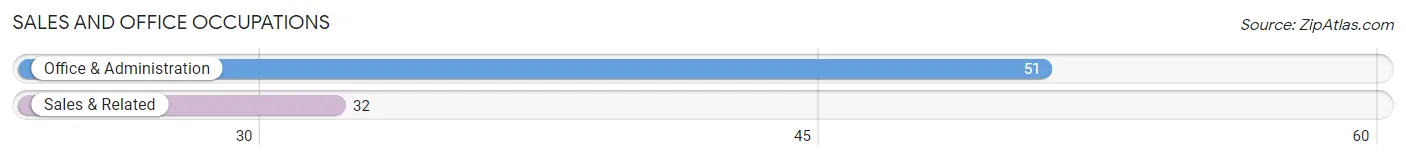
Sales and Office Occupations
The most common Sales and Office occupations in Akron are Office & Administration (51 | 10.6%), and Sales & Related (32 | 6.7%).
Sales and Office Occupations by Sex
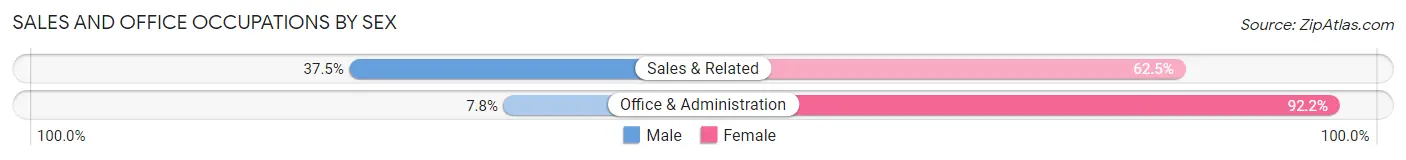
| Occupation | Male | Female |
| Sales & Related | 12 (37.5%) | 20 (62.5%) |
| Office & Administration | 4 (7.8%) | 47 (92.2%) |
| Total (Category) | 16 (19.3%) | 67 (80.7%) |
| Total (Overall) | 268 (55.7%) | 213 (44.3%) |
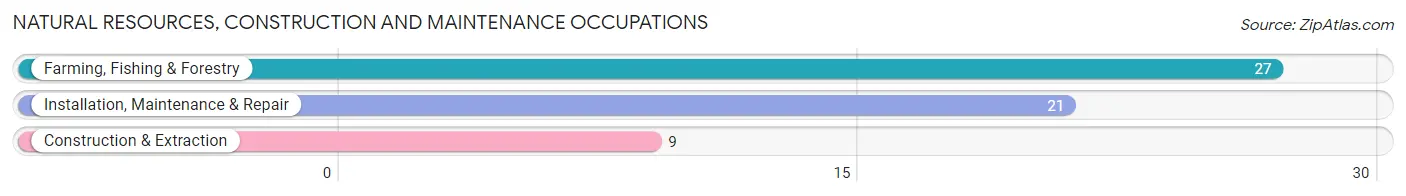
Natural Resources, Construction and Maintenance Occupations
The most common Natural Resources, Construction and Maintenance occupations in Akron are Farming, Fishing & Forestry (27 | 5.6%), Installation, Maintenance & Repair (21 | 4.4%), and Construction & Extraction (9 | 1.9%).
Natural Resources, Construction and Maintenance Occupations by Sex
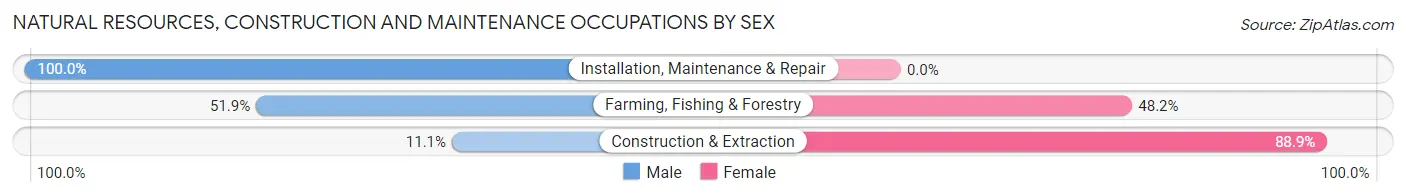
| Occupation | Male | Female |
| Farming, Fishing & Forestry | 14 (51.8%) | 13 (48.1%) |
| Construction & Extraction | 1 (11.1%) | 8 (88.9%) |
| Installation, Maintenance & Repair | 21 (100.0%) | 0 (0.0%) |
| Total (Category) | 36 (63.2%) | 21 (36.8%) |
| Total (Overall) | 268 (55.7%) | 213 (44.3%) |
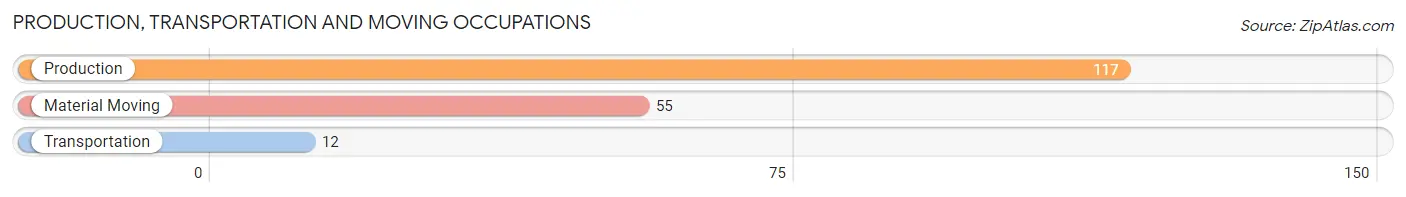
Production, Transportation and Moving Occupations
The most common Production, Transportation and Moving occupations in Akron are Production (117 | 24.3%), Material Moving (55 | 11.4%), and Transportation (12 | 2.5%).
Production, Transportation and Moving Occupations by Sex
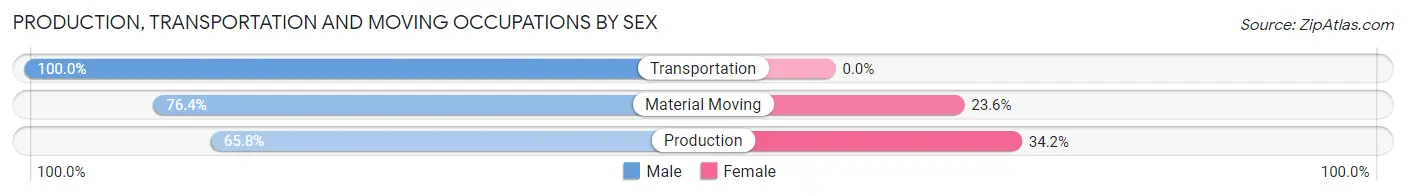
| Occupation | Male | Female |
| Production | 77 (65.8%) | 40 (34.2%) |
| Transportation | 12 (100.0%) | 0 (0.0%) |
| Material Moving | 42 (76.4%) | 13 (23.6%) |
| Total (Category) | 131 (71.2%) | 53 (28.8%) |
| Total (Overall) | 268 (55.7%) | 213 (44.3%) |
Employment Industries by Sex in Akron
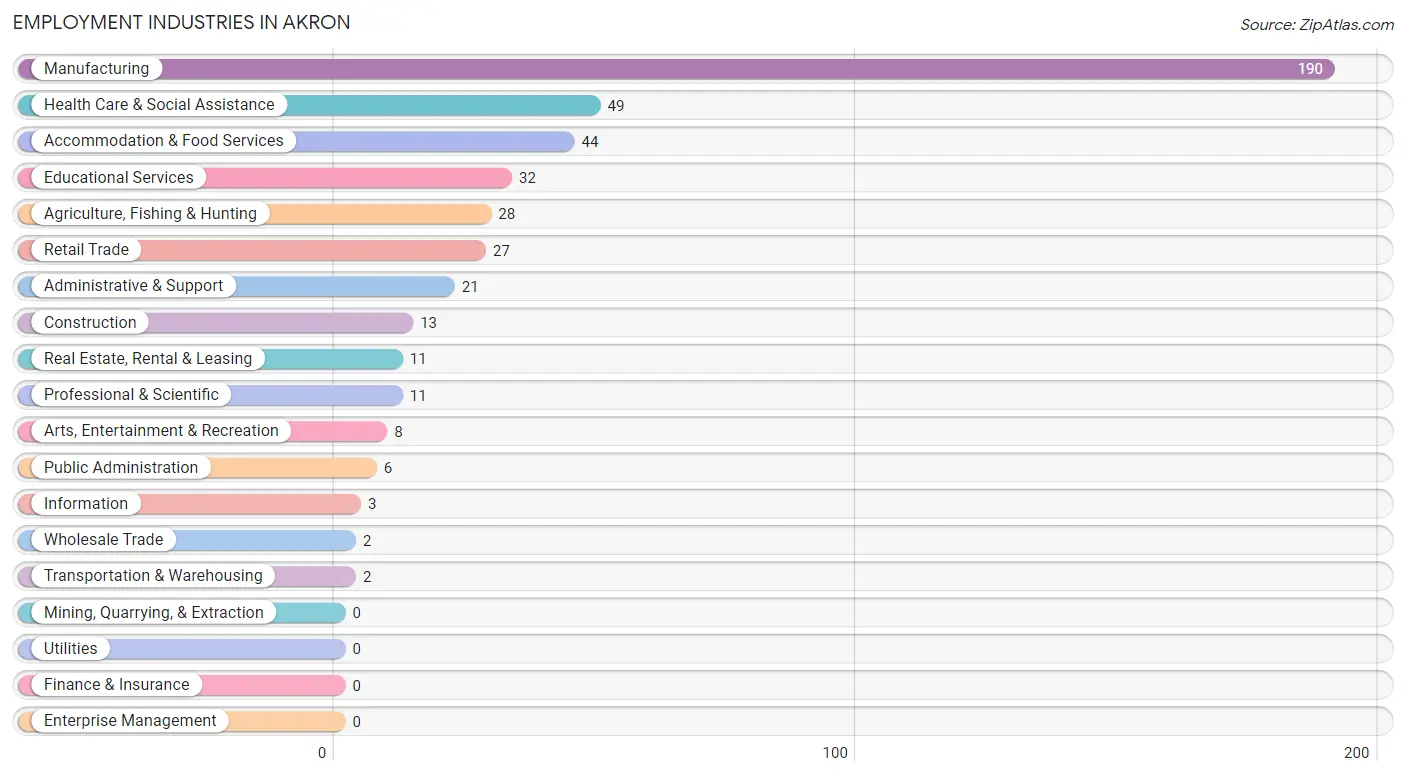
Employment Industries in Akron
The major employment industries in Akron include Manufacturing (190 | 39.5%), Health Care & Social Assistance (49 | 10.2%), Accommodation & Food Services (44 | 9.1%), Educational Services (32 | 6.7%), and Agriculture, Fishing & Hunting (28 | 5.8%).
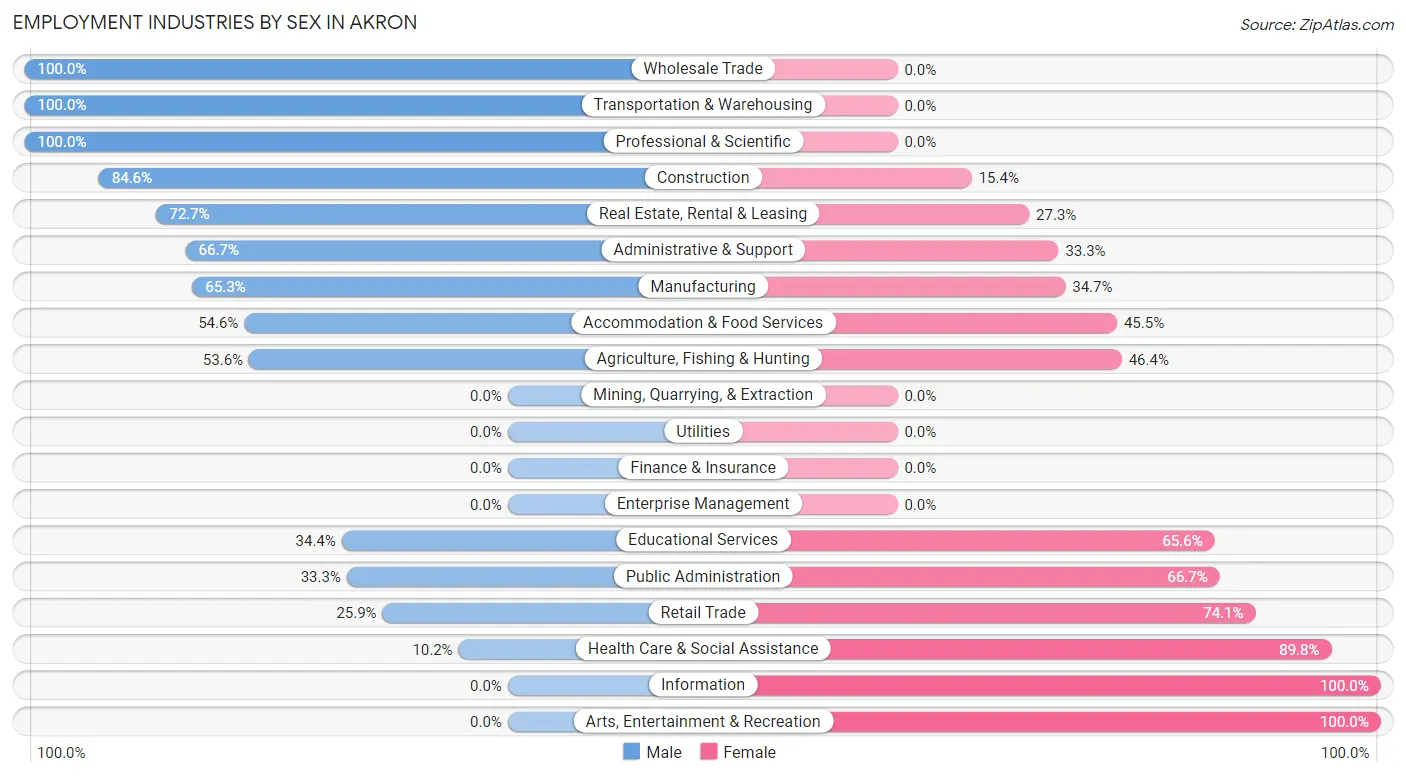
Employment Industries by Sex in Akron
The Akron industries that see more men than women are Wholesale Trade (100.0%), Transportation & Warehousing (100.0%), and Professional & Scientific (100.0%), whereas the industries that tend to have a higher number of women are Information (100.0%), Arts, Entertainment & Recreation (100.0%), and Health Care & Social Assistance (89.8%).
| Industry | Male | Female |
| Agriculture, Fishing & Hunting | 15 (53.6%) | 13 (46.4%) |
| Mining, Quarrying, & Extraction | 0 (0.0%) | 0 (0.0%) |
| Construction | 11 (84.6%) | 2 (15.4%) |
| Manufacturing | 124 (65.3%) | 66 (34.7%) |
| Wholesale Trade | 2 (100.0%) | 0 (0.0%) |
| Retail Trade | 7 (25.9%) | 20 (74.1%) |
| Transportation & Warehousing | 2 (100.0%) | 0 (0.0%) |
| Utilities | 0 (0.0%) | 0 (0.0%) |
| Information | 0 (0.0%) | 3 (100.0%) |
| Finance & Insurance | 0 (0.0%) | 0 (0.0%) |
| Real Estate, Rental & Leasing | 8 (72.7%) | 3 (27.3%) |
| Professional & Scientific | 11 (100.0%) | 0 (0.0%) |
| Enterprise Management | 0 (0.0%) | 0 (0.0%) |
| Administrative & Support | 14 (66.7%) | 7 (33.3%) |
| Educational Services | 11 (34.4%) | 21 (65.6%) |
| Health Care & Social Assistance | 5 (10.2%) | 44 (89.8%) |
| Arts, Entertainment & Recreation | 0 (0.0%) | 8 (100.0%) |
| Accommodation & Food Services | 24 (54.5%) | 20 (45.5%) |
| Public Administration | 2 (33.3%) | 4 (66.7%) |
| Total | 268 (55.7%) | 213 (44.3%) |
Education in Akron
School Enrollment in Akron
The most common levels of schooling among the 261 students in Akron are high school (96 | 36.8%), elementary school (51 | 19.5%), and middle school (48 | 18.4%).
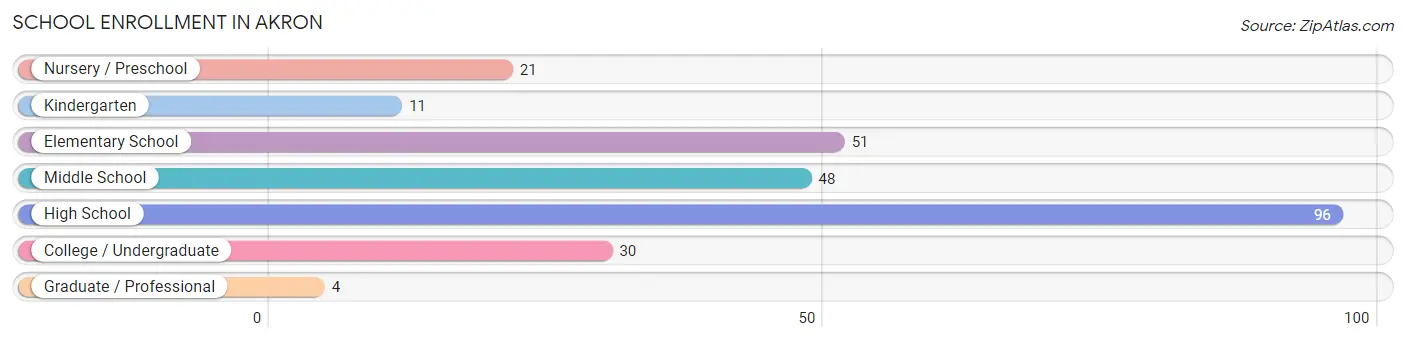
| School Level | # Students | % Students |
| Nursery / Preschool | 21 | 8.1% |
| Kindergarten | 11 | 4.2% |
| Elementary School | 51 | 19.5% |
| Middle School | 48 | 18.4% |
| High School | 96 | 36.8% |
| College / Undergraduate | 30 | 11.5% |
| Graduate / Professional | 4 | 1.5% |
| Total | 261 | 100.0% |
School Enrollment by Age by Funding Source in Akron
Out of a total of 261 students who are enrolled in schools in Akron, 13 (5.0%) attend a private institution, while the remaining 248 (95.0%) are enrolled in public schools. The age group of 20 to 24 year olds has the highest likelihood of being enrolled in private schools, with 4 (16.0% in the age bracket) enrolled. Conversely, the age group of 3 to 4 year olds has the lowest likelihood of being enrolled in a private school, with 14 (100.0% in the age bracket) attending a public institution.
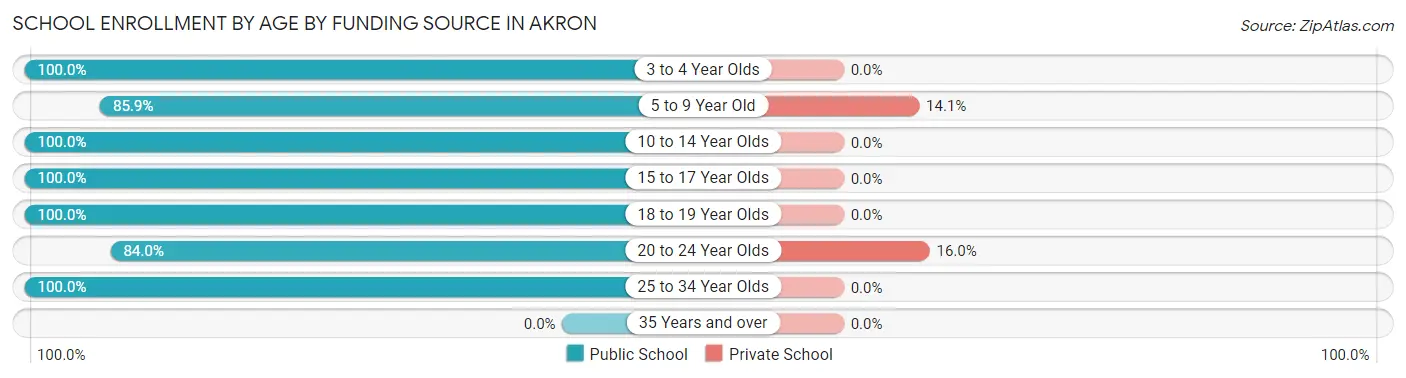
| Age Bracket | Public School | Private School |
| 3 to 4 Year Olds | 14 (100.0%) | 0 (0.0%) |
| 5 to 9 Year Old | 55 (85.9%) | 9 (14.1%) |
| 10 to 14 Year Olds | 72 (100.0%) | 0 (0.0%) |
| 15 to 17 Year Olds | 63 (100.0%) | 0 (0.0%) |
| 18 to 19 Year Olds | 12 (100.0%) | 0 (0.0%) |
| 20 to 24 Year Olds | 21 (84.0%) | 4 (16.0%) |
| 25 to 34 Year Olds | 11 (100.0%) | 0 (0.0%) |
| 35 Years and over | 0 (0.0%) | 0 (0.0%) |
| Total | 248 (95.0%) | 13 (5.0%) |
Educational Attainment by Field of Study in Akron
Education (26 | 37.7%), bio, nature & agricultural (13 | 18.8%), science & technology (12 | 17.4%), business (9 | 13.0%), and arts & humanities (6 | 8.7%) are the most common fields of study among 69 individuals in Akron who have obtained a bachelor's degree or higher.
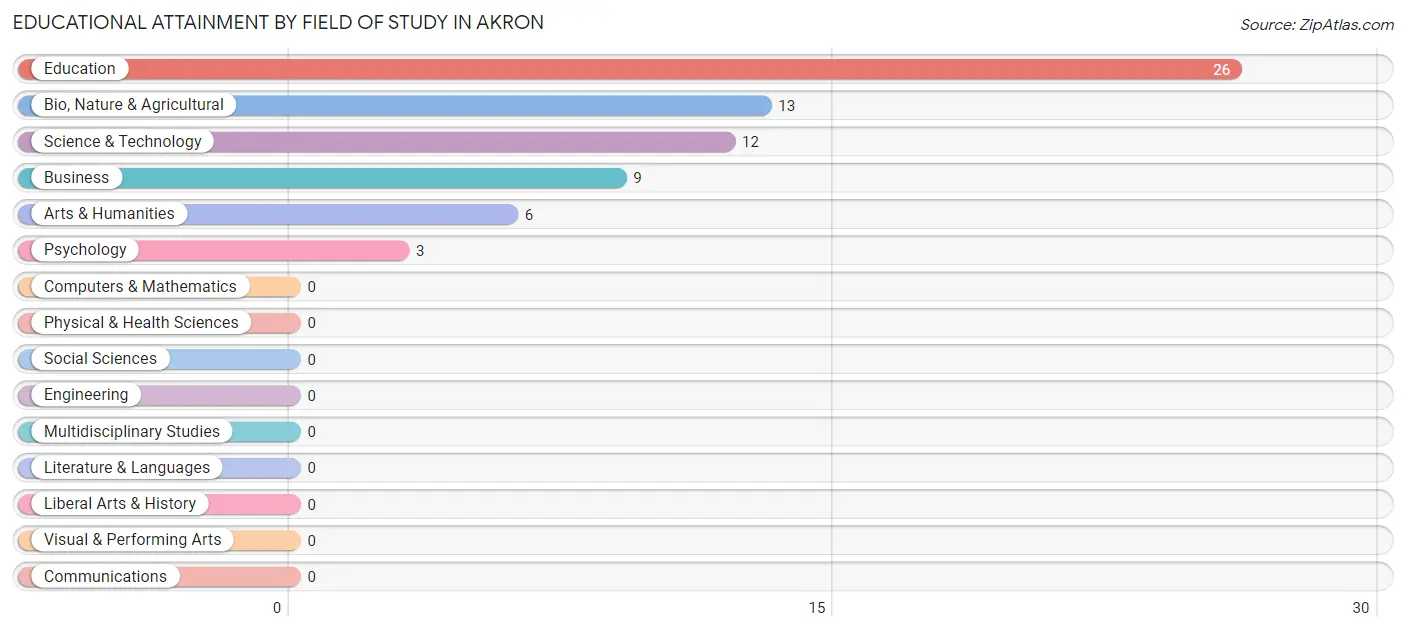
| Field of Study | # Graduates | % Graduates |
| Computers & Mathematics | 0 | 0.0% |
| Bio, Nature & Agricultural | 13 | 18.8% |
| Physical & Health Sciences | 0 | 0.0% |
| Psychology | 3 | 4.3% |
| Social Sciences | 0 | 0.0% |
| Engineering | 0 | 0.0% |
| Multidisciplinary Studies | 0 | 0.0% |
| Science & Technology | 12 | 17.4% |
| Business | 9 | 13.0% |
| Education | 26 | 37.7% |
| Literature & Languages | 0 | 0.0% |
| Liberal Arts & History | 0 | 0.0% |
| Visual & Performing Arts | 0 | 0.0% |
| Communications | 0 | 0.0% |
| Arts & Humanities | 6 | 8.7% |
| Total | 69 | 100.0% |
Transportation & Commute in Akron
Vehicle Availability by Sex in Akron
The most prevalent vehicle ownership categories in Akron are males with 2 vehicles (139, accounting for 54.1%) and females with 2 vehicles (69, making up 69.2%).
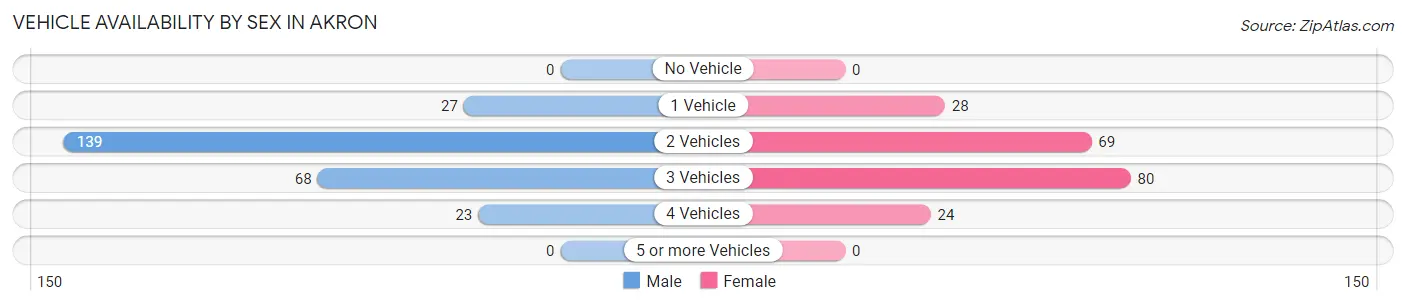
| Vehicles Available | Male | Female |
| No Vehicle | 0 (0.0%) | 0 (0.0%) |
| 1 Vehicle | 27 (10.5%) | 28 (13.9%) |
| 2 Vehicles | 139 (54.1%) | 69 (34.3%) |
| 3 Vehicles | 68 (26.5%) | 80 (39.8%) |
| 4 Vehicles | 23 (8.9%) | 24 (11.9%) |
| 5 or more Vehicles | 0 (0.0%) | 0 (0.0%) |
| Total | 257 (100.0%) | 201 (100.0%) |
Commute Time in Akron
The most frequently occuring commute durations in Akron are 30 to 34 minutes (91 commuters, 20.3%), 15 to 19 minutes (63 commuters, 14.0%), and 20 to 24 minutes (52 commuters, 11.6%).
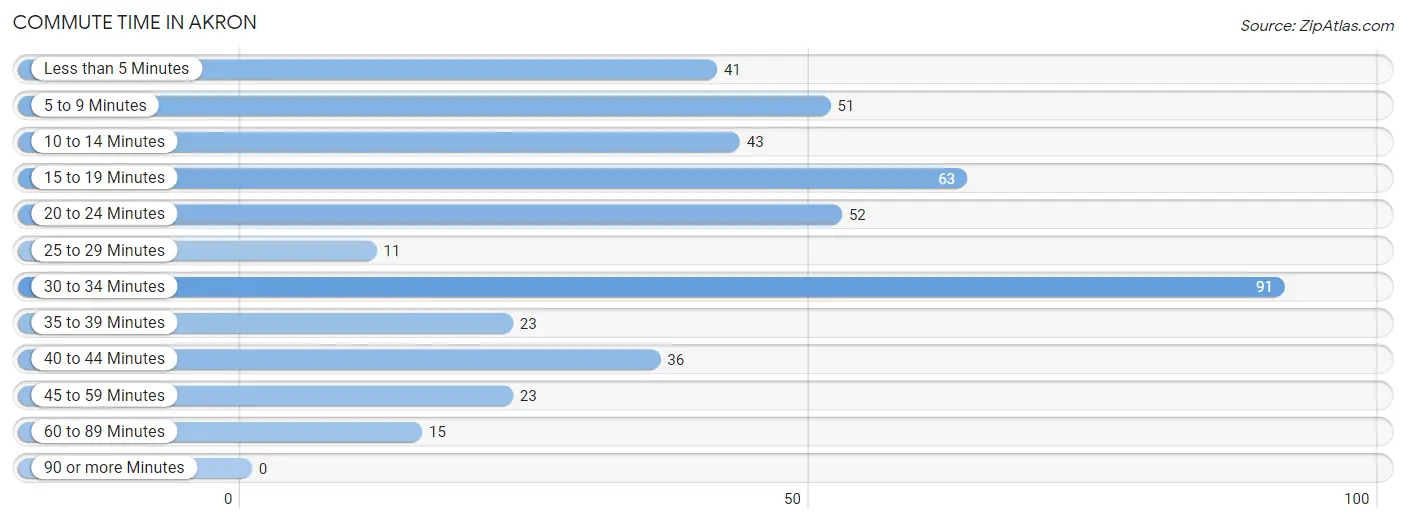
| Commute Time | # Commuters | % Commuters |
| Less than 5 Minutes | 41 | 9.1% |
| 5 to 9 Minutes | 51 | 11.4% |
| 10 to 14 Minutes | 43 | 9.6% |
| 15 to 19 Minutes | 63 | 14.0% |
| 20 to 24 Minutes | 52 | 11.6% |
| 25 to 29 Minutes | 11 | 2.5% |
| 30 to 34 Minutes | 91 | 20.3% |
| 35 to 39 Minutes | 23 | 5.1% |
| 40 to 44 Minutes | 36 | 8.0% |
| 45 to 59 Minutes | 23 | 5.1% |
| 60 to 89 Minutes | 15 | 3.3% |
| 90 or more Minutes | 0 | 0.0% |
Commute Time by Sex in Akron
The most common commute times in Akron are 30 to 34 minutes (47 commuters, 18.3%) for males and 30 to 34 minutes (44 commuters, 22.9%) for females.
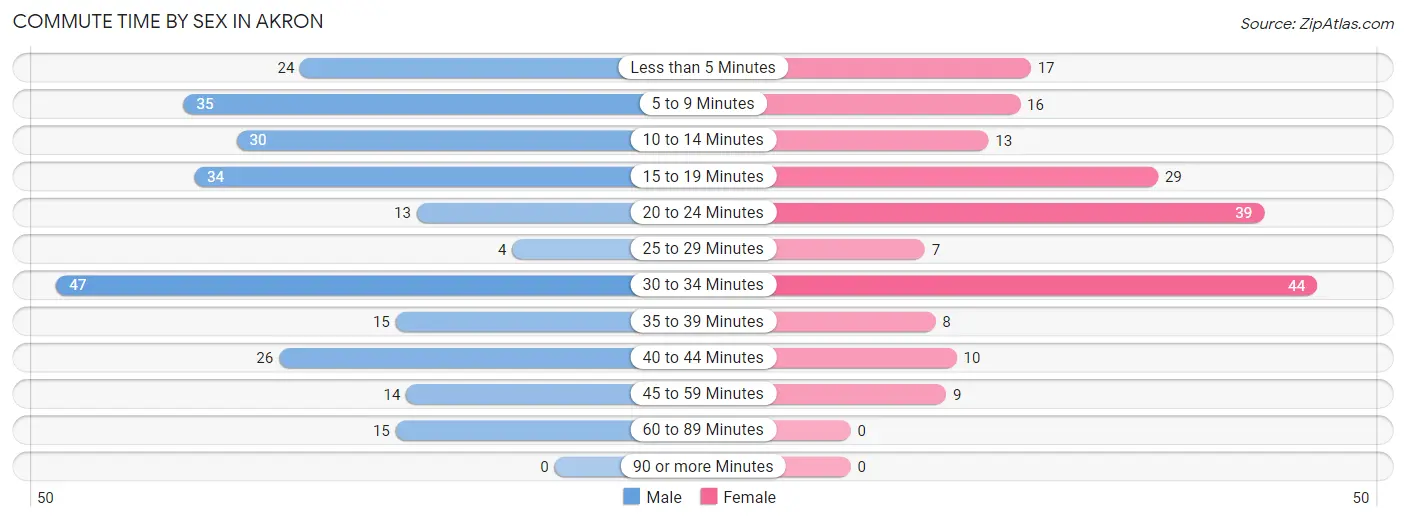
| Commute Time | Male | Female |
| Less than 5 Minutes | 24 (9.3%) | 17 (8.8%) |
| 5 to 9 Minutes | 35 (13.6%) | 16 (8.3%) |
| 10 to 14 Minutes | 30 (11.7%) | 13 (6.8%) |
| 15 to 19 Minutes | 34 (13.2%) | 29 (15.1%) |
| 20 to 24 Minutes | 13 (5.1%) | 39 (20.3%) |
| 25 to 29 Minutes | 4 (1.6%) | 7 (3.6%) |
| 30 to 34 Minutes | 47 (18.3%) | 44 (22.9%) |
| 35 to 39 Minutes | 15 (5.8%) | 8 (4.2%) |
| 40 to 44 Minutes | 26 (10.1%) | 10 (5.2%) |
| 45 to 59 Minutes | 14 (5.4%) | 9 (4.7%) |
| 60 to 89 Minutes | 15 (5.8%) | 0 (0.0%) |
| 90 or more Minutes | 0 (0.0%) | 0 (0.0%) |
Time of Departure to Work by Sex in Akron
The most frequent times of departure to work in Akron are 5:00 AM to 5:29 AM (44, 17.1%) for males and 7:30 AM to 7:59 AM (35, 18.2%) for females.
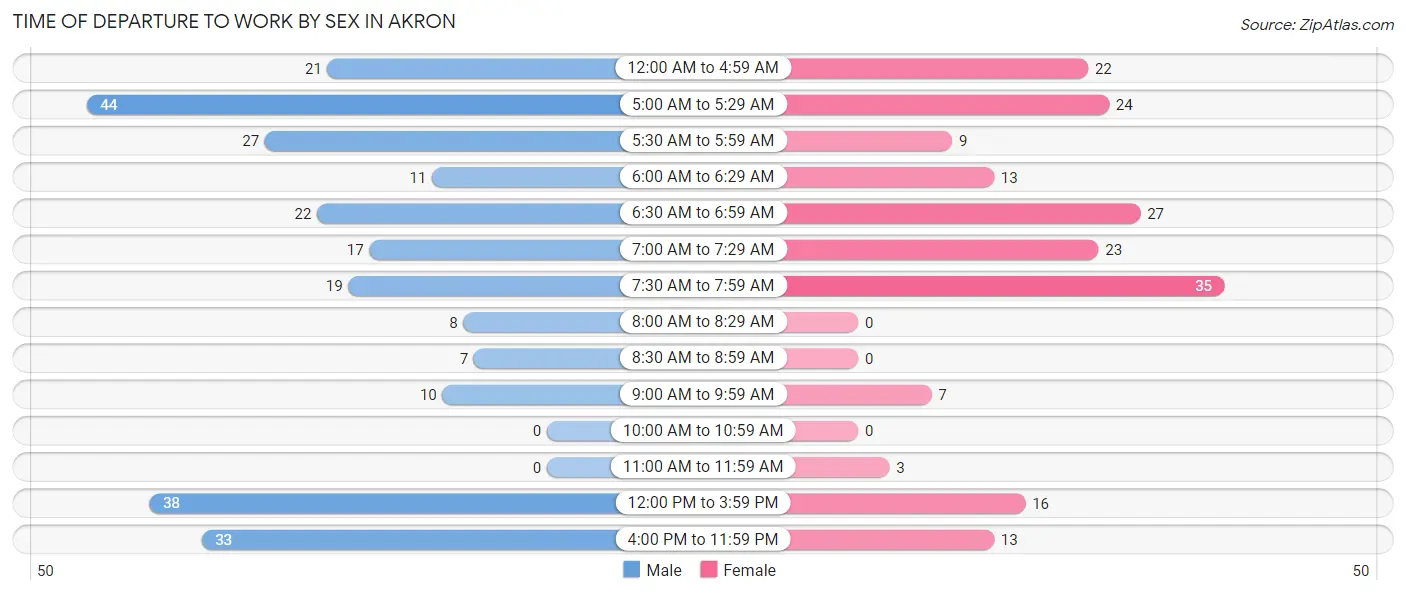
| Time of Departure | Male | Female |
| 12:00 AM to 4:59 AM | 21 (8.2%) | 22 (11.5%) |
| 5:00 AM to 5:29 AM | 44 (17.1%) | 24 (12.5%) |
| 5:30 AM to 5:59 AM | 27 (10.5%) | 9 (4.7%) |
| 6:00 AM to 6:29 AM | 11 (4.3%) | 13 (6.8%) |
| 6:30 AM to 6:59 AM | 22 (8.6%) | 27 (14.1%) |
| 7:00 AM to 7:29 AM | 17 (6.6%) | 23 (12.0%) |
| 7:30 AM to 7:59 AM | 19 (7.4%) | 35 (18.2%) |
| 8:00 AM to 8:29 AM | 8 (3.1%) | 0 (0.0%) |
| 8:30 AM to 8:59 AM | 7 (2.7%) | 0 (0.0%) |
| 9:00 AM to 9:59 AM | 10 (3.9%) | 7 (3.6%) |
| 10:00 AM to 10:59 AM | 0 (0.0%) | 0 (0.0%) |
| 11:00 AM to 11:59 AM | 0 (0.0%) | 3 (1.6%) |
| 12:00 PM to 3:59 PM | 38 (14.8%) | 16 (8.3%) |
| 4:00 PM to 11:59 PM | 33 (12.8%) | 13 (6.8%) |
| Total | 257 (100.0%) | 192 (100.0%) |
Housing Occupancy in Akron
Occupancy by Ownership in Akron
Of the total 339 dwellings in Akron, owner-occupied units account for 245 (72.3%), while renter-occupied units make up 94 (27.7%).
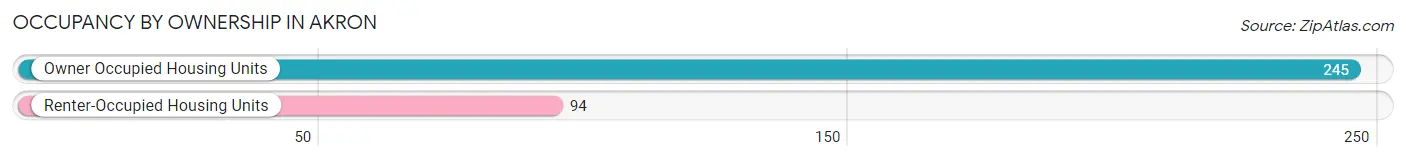
| Occupancy | # Housing Units | % Housing Units |
| Owner Occupied Housing Units | 245 | 72.3% |
| Renter-Occupied Housing Units | 94 | 27.7% |
| Total Occupied Housing Units | 339 | 100.0% |
Occupancy by Household Size in Akron
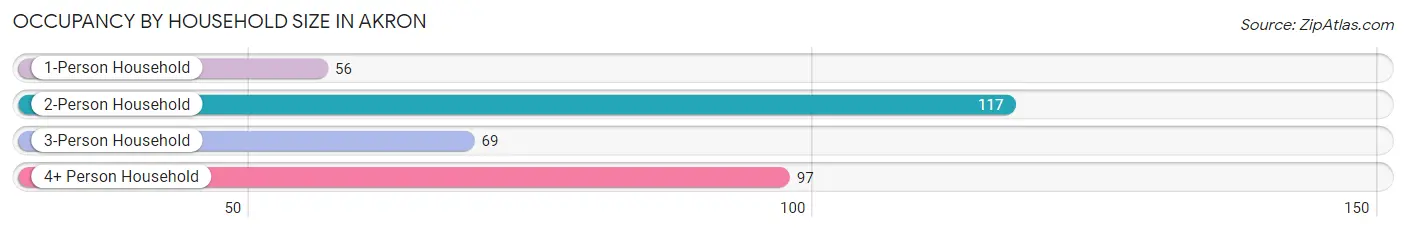
| Household Size | # Housing Units | % Housing Units |
| 1-Person Household | 56 | 16.5% |
| 2-Person Household | 117 | 34.5% |
| 3-Person Household | 69 | 20.3% |
| 4+ Person Household | 97 | 28.6% |
| Total Housing Units | 339 | 100.0% |
Occupancy by Ownership by Household Size in Akron
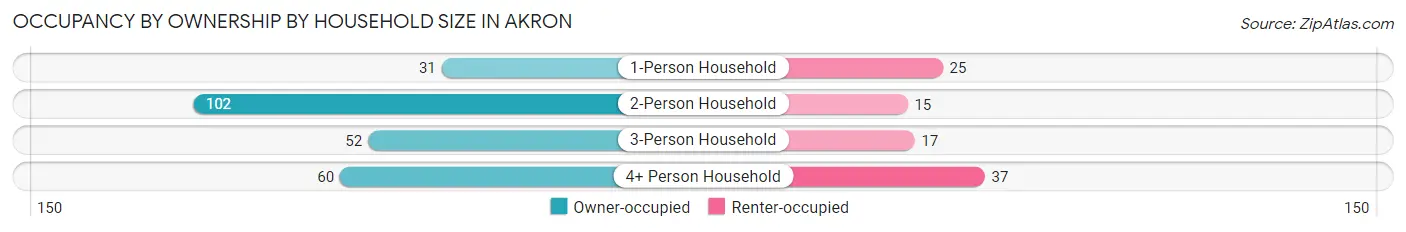
| Household Size | Owner-occupied | Renter-occupied |
| 1-Person Household | 31 (55.4%) | 25 (44.6%) |
| 2-Person Household | 102 (87.2%) | 15 (12.8%) |
| 3-Person Household | 52 (75.4%) | 17 (24.6%) |
| 4+ Person Household | 60 (61.9%) | 37 (38.1%) |
| Total Housing Units | 245 (72.3%) | 94 (27.7%) |
Occupancy by Educational Attainment in Akron
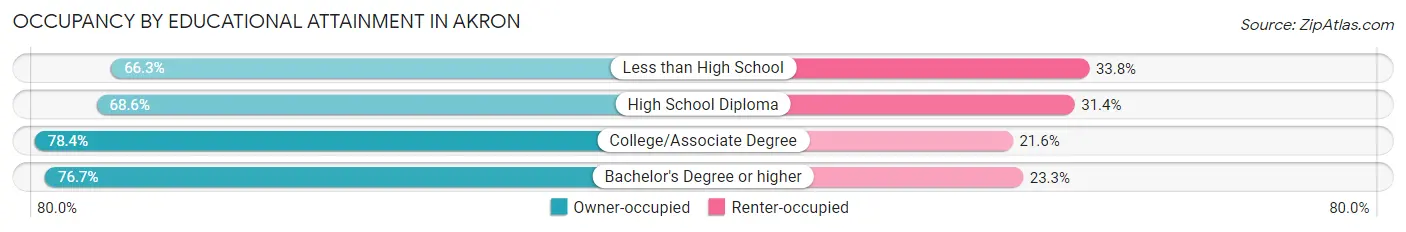
| Household Size | Owner-occupied | Renter-occupied |
| Less than High School | 53 (66.2%) | 27 (33.8%) |
| High School Diploma | 72 (68.6%) | 33 (31.4%) |
| College/Associate Degree | 87 (78.4%) | 24 (21.6%) |
| Bachelor's Degree or higher | 33 (76.7%) | 10 (23.3%) |
Occupancy by Age of Householder in Akron
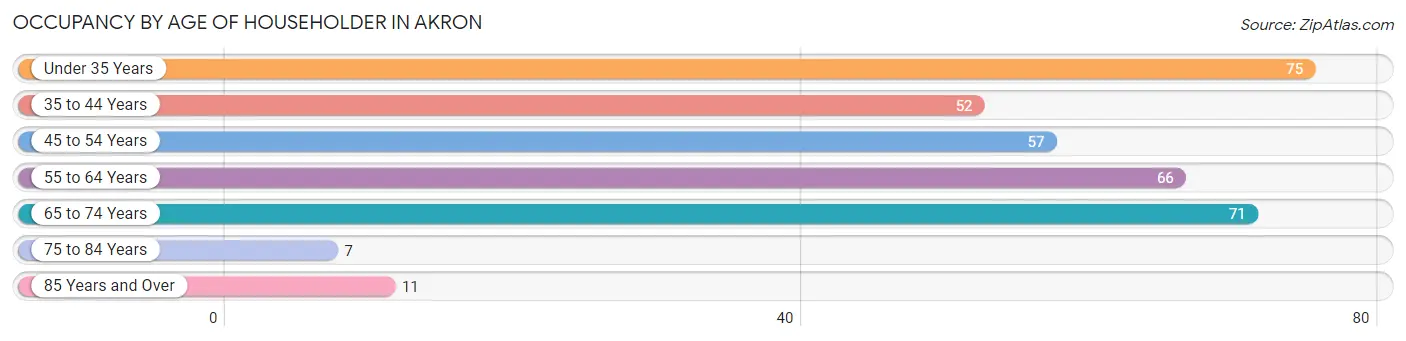
| Age Bracket | # Households | % Households |
| Under 35 Years | 75 | 22.1% |
| 35 to 44 Years | 52 | 15.3% |
| 45 to 54 Years | 57 | 16.8% |
| 55 to 64 Years | 66 | 19.5% |
| 65 to 74 Years | 71 | 20.9% |
| 75 to 84 Years | 7 | 2.1% |
| 85 Years and Over | 11 | 3.2% |
| Total | 339 | 100.0% |
Housing Finances in Akron
Median Income by Occupancy in Akron
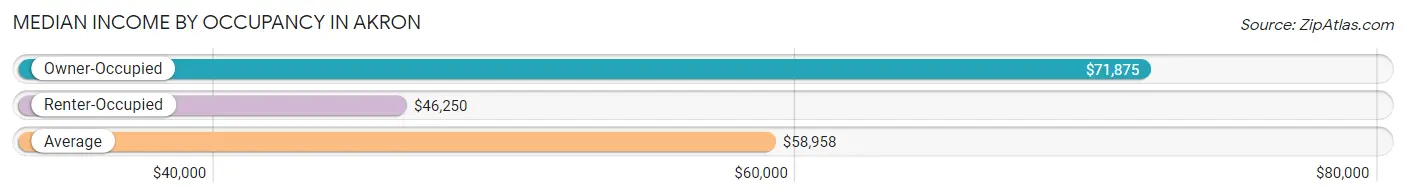
| Occupancy Type | # Households | Median Income |
| Owner-Occupied | 245 (72.3%) | $71,875 |
| Renter-Occupied | 94 (27.7%) | $46,250 |
| Average | 339 (100.0%) | $58,958 |
Occupancy by Householder Income Bracket in Akron
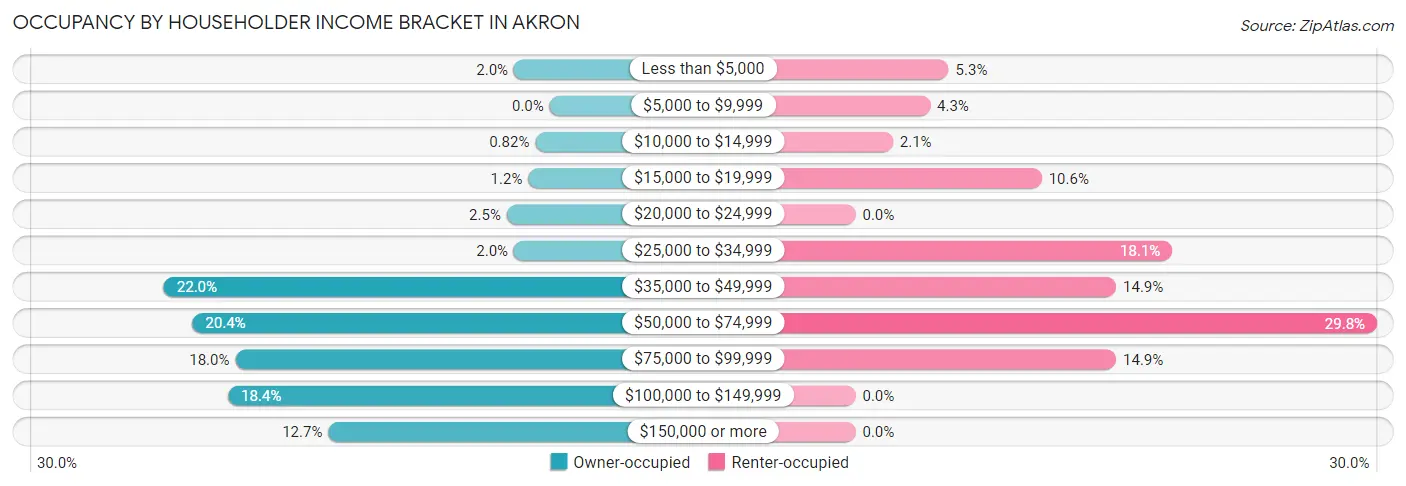
| Income Bracket | Owner-occupied | Renter-occupied |
| Less than $5,000 | 5 (2.0%) | 5 (5.3%) |
| $5,000 to $9,999 | 0 (0.0%) | 4 (4.3%) |
| $10,000 to $14,999 | 2 (0.8%) | 2 (2.1%) |
| $15,000 to $19,999 | 3 (1.2%) | 10 (10.6%) |
| $20,000 to $24,999 | 6 (2.5%) | 0 (0.0%) |
| $25,000 to $34,999 | 5 (2.0%) | 17 (18.1%) |
| $35,000 to $49,999 | 54 (22.0%) | 14 (14.9%) |
| $50,000 to $74,999 | 50 (20.4%) | 28 (29.8%) |
| $75,000 to $99,999 | 44 (18.0%) | 14 (14.9%) |
| $100,000 to $149,999 | 45 (18.4%) | 0 (0.0%) |
| $150,000 or more | 31 (12.7%) | 0 (0.0%) |
| Total | 245 (100.0%) | 94 (100.0%) |
Monthly Housing Cost Tiers in Akron
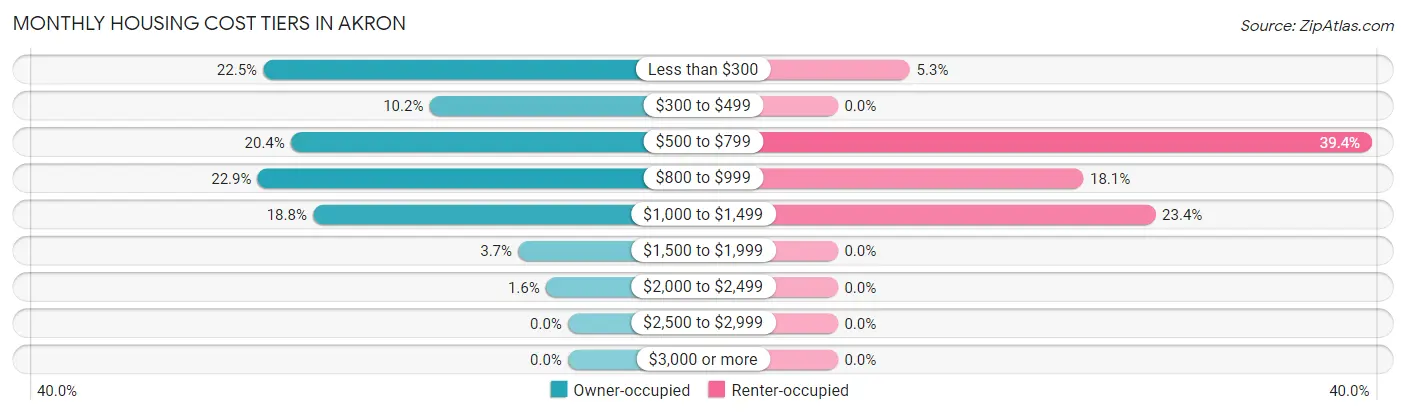
| Monthly Cost | Owner-occupied | Renter-occupied |
| Less than $300 | 55 (22.5%) | 5 (5.3%) |
| $300 to $499 | 25 (10.2%) | 0 (0.0%) |
| $500 to $799 | 50 (20.4%) | 37 (39.4%) |
| $800 to $999 | 56 (22.9%) | 17 (18.1%) |
| $1,000 to $1,499 | 46 (18.8%) | 22 (23.4%) |
| $1,500 to $1,999 | 9 (3.7%) | 0 (0.0%) |
| $2,000 to $2,499 | 4 (1.6%) | 0 (0.0%) |
| $2,500 to $2,999 | 0 (0.0%) | 0 (0.0%) |
| $3,000 or more | 0 (0.0%) | 0 (0.0%) |
| Total | 245 (100.0%) | 94 (100.0%) |
Physical Housing Characteristics in Akron
Housing Structures in Akron
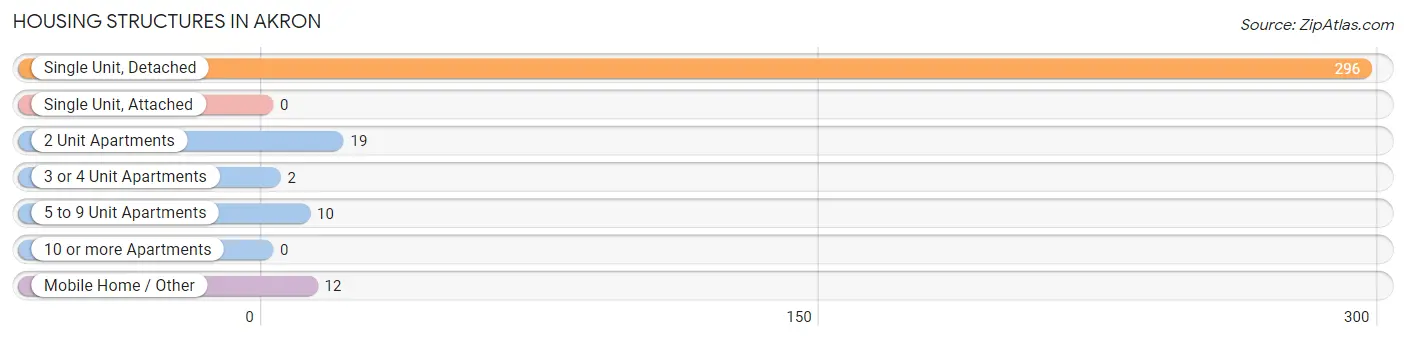
| Structure Type | # Housing Units | % Housing Units |
| Single Unit, Detached | 296 | 87.3% |
| Single Unit, Attached | 0 | 0.0% |
| 2 Unit Apartments | 19 | 5.6% |
| 3 or 4 Unit Apartments | 2 | 0.6% |
| 5 to 9 Unit Apartments | 10 | 2.9% |
| 10 or more Apartments | 0 | 0.0% |
| Mobile Home / Other | 12 | 3.5% |
| Total | 339 | 100.0% |
Housing Structures by Occupancy in Akron
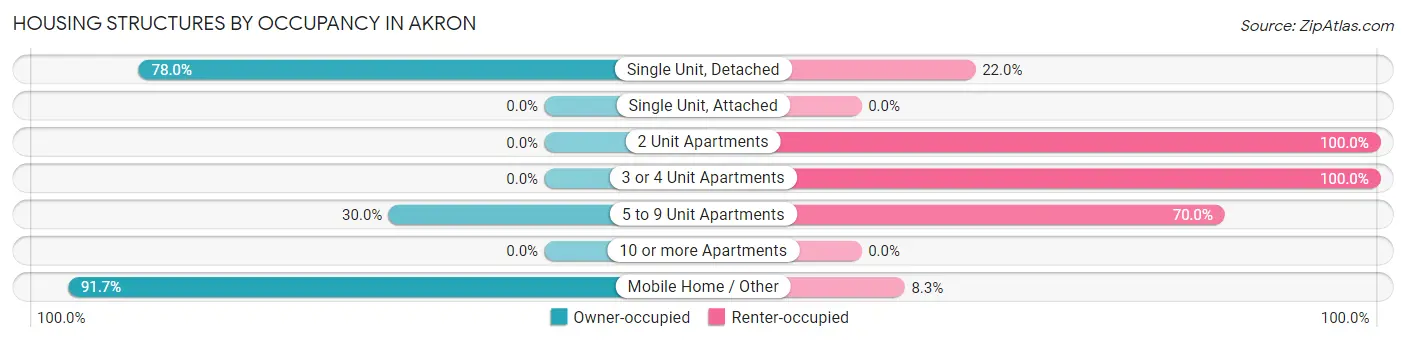
| Structure Type | Owner-occupied | Renter-occupied |
| Single Unit, Detached | 231 (78.0%) | 65 (22.0%) |
| Single Unit, Attached | 0 (0.0%) | 0 (0.0%) |
| 2 Unit Apartments | 0 (0.0%) | 19 (100.0%) |
| 3 or 4 Unit Apartments | 0 (0.0%) | 2 (100.0%) |
| 5 to 9 Unit Apartments | 3 (30.0%) | 7 (70.0%) |
| 10 or more Apartments | 0 (0.0%) | 0 (0.0%) |
| Mobile Home / Other | 11 (91.7%) | 1 (8.3%) |
| Total | 245 (72.3%) | 94 (27.7%) |
Housing Structures by Number of Rooms in Akron
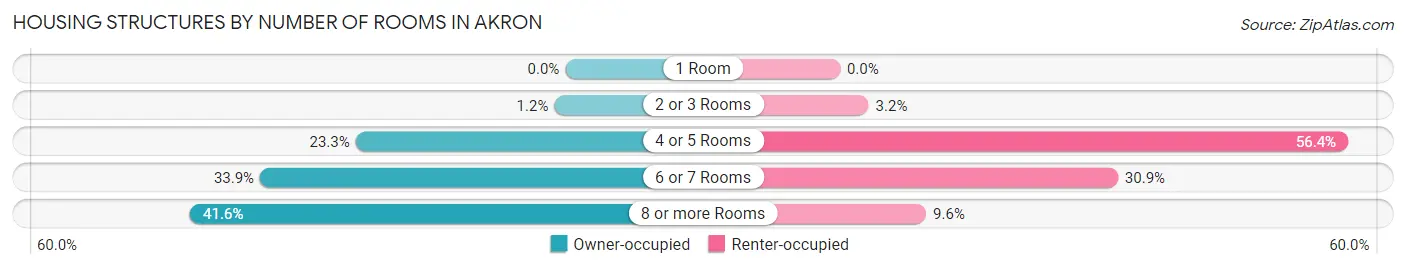
| Number of Rooms | Owner-occupied | Renter-occupied |
| 1 Room | 0 (0.0%) | 0 (0.0%) |
| 2 or 3 Rooms | 3 (1.2%) | 3 (3.2%) |
| 4 or 5 Rooms | 57 (23.3%) | 53 (56.4%) |
| 6 or 7 Rooms | 83 (33.9%) | 29 (30.8%) |
| 8 or more Rooms | 102 (41.6%) | 9 (9.6%) |
| Total | 245 (100.0%) | 94 (100.0%) |
Housing Structure by Heating Type in Akron
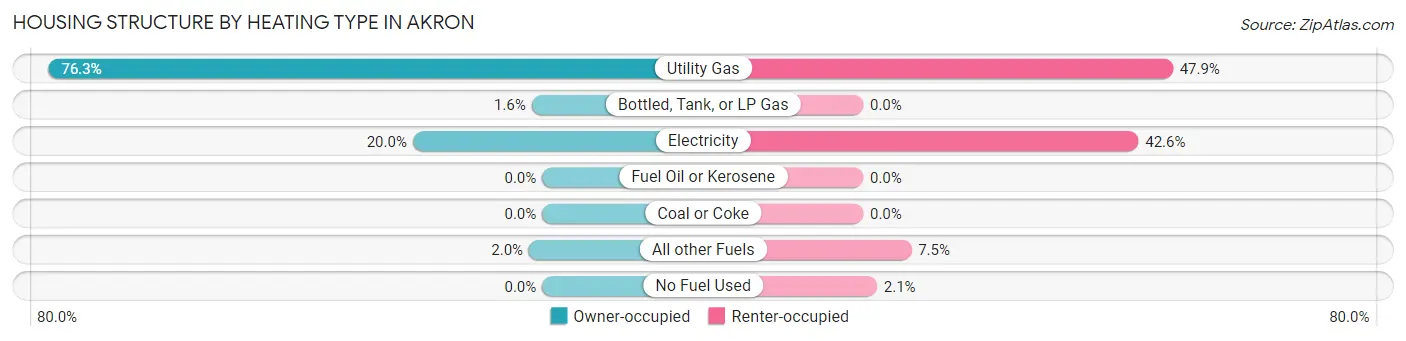
| Heating Type | Owner-occupied | Renter-occupied |
| Utility Gas | 187 (76.3%) | 45 (47.9%) |
| Bottled, Tank, or LP Gas | 4 (1.6%) | 0 (0.0%) |
| Electricity | 49 (20.0%) | 40 (42.5%) |
| Fuel Oil or Kerosene | 0 (0.0%) | 0 (0.0%) |
| Coal or Coke | 0 (0.0%) | 0 (0.0%) |
| All other Fuels | 5 (2.0%) | 7 (7.4%) |
| No Fuel Used | 0 (0.0%) | 2 (2.1%) |
| Total | 245 (100.0%) | 94 (100.0%) |
Household Vehicle Usage in Akron
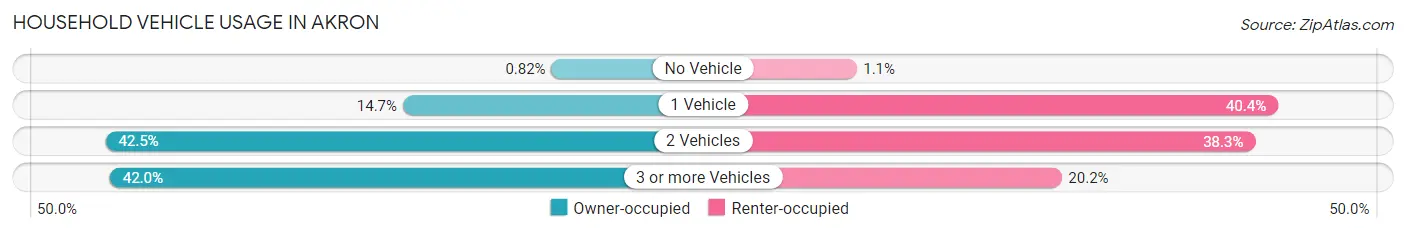
| Vehicles per Household | Owner-occupied | Renter-occupied |
| No Vehicle | 2 (0.8%) | 1 (1.1%) |
| 1 Vehicle | 36 (14.7%) | 38 (40.4%) |
| 2 Vehicles | 104 (42.4%) | 36 (38.3%) |
| 3 or more Vehicles | 103 (42.0%) | 19 (20.2%) |
| Total | 245 (100.0%) | 94 (100.0%) |
Real Estate & Mortgages in Akron
Real Estate and Mortgage Overview in Akron
| Characteristic | Without Mortgage | With Mortgage |
| Housing Units | 96 | 149 |
| Median Property Value | $110,200 | $114,300 |
| Median Household Income | $52,500 | $23 |
| Monthly Housing Costs | $250 | $0 |
| Real Estate Taxes | $524 | $7 |
Property Value by Mortgage Status in Akron
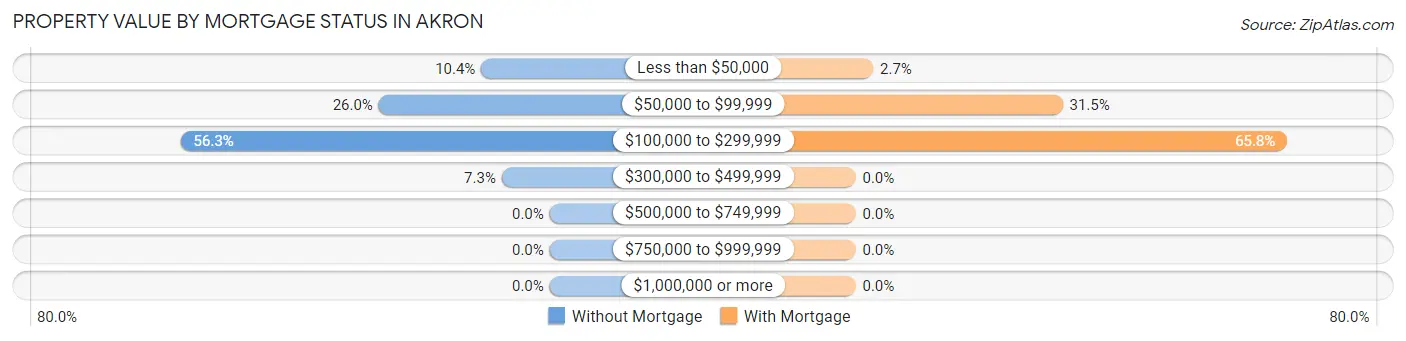
| Property Value | Without Mortgage | With Mortgage |
| Less than $50,000 | 10 (10.4%) | 4 (2.7%) |
| $50,000 to $99,999 | 25 (26.0%) | 47 (31.5%) |
| $100,000 to $299,999 | 54 (56.2%) | 98 (65.8%) |
| $300,000 to $499,999 | 7 (7.3%) | 0 (0.0%) |
| $500,000 to $749,999 | 0 (0.0%) | 0 (0.0%) |
| $750,000 to $999,999 | 0 (0.0%) | 0 (0.0%) |
| $1,000,000 or more | 0 (0.0%) | 0 (0.0%) |
| Total | 96 (100.0%) | 149 (100.0%) |
Household Income by Mortgage Status in Akron
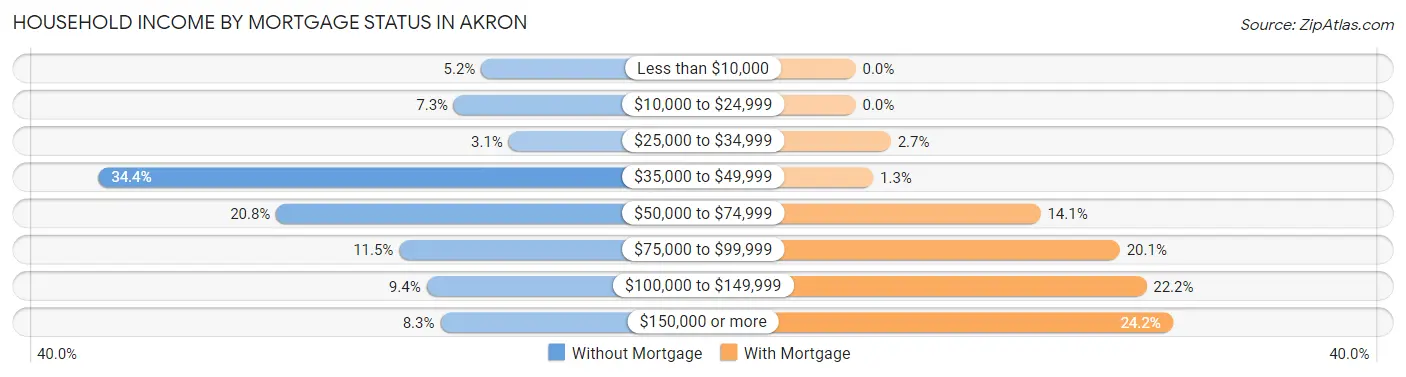
| Household Income | Without Mortgage | With Mortgage |
| Less than $10,000 | 5 (5.2%) | 0 (0.0%) |
| $10,000 to $24,999 | 7 (7.3%) | 0 (0.0%) |
| $25,000 to $34,999 | 3 (3.1%) | 4 (2.7%) |
| $35,000 to $49,999 | 33 (34.4%) | 2 (1.3%) |
| $50,000 to $74,999 | 20 (20.8%) | 21 (14.1%) |
| $75,000 to $99,999 | 11 (11.5%) | 30 (20.1%) |
| $100,000 to $149,999 | 9 (9.4%) | 33 (22.2%) |
| $150,000 or more | 8 (8.3%) | 36 (24.2%) |
| Total | 96 (100.0%) | 149 (100.0%) |
Property Value to Household Income Ratio in Akron
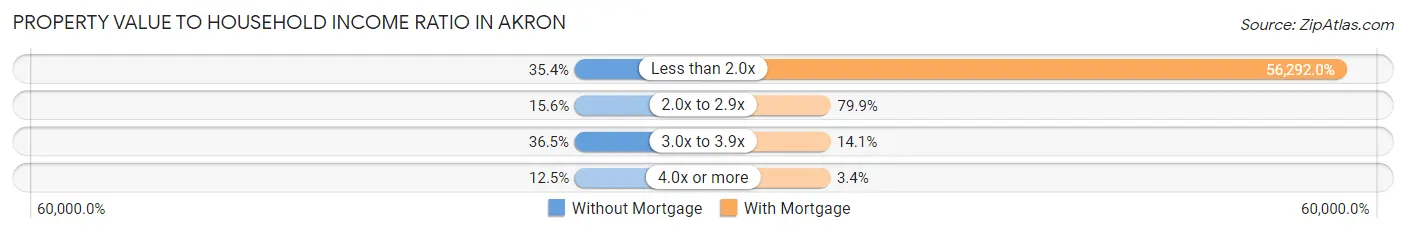
| Value-to-Income Ratio | Without Mortgage | With Mortgage |
| Less than 2.0x | 34 (35.4%) | 83,875 (56,291.9%) |
| 2.0x to 2.9x | 15 (15.6%) | 119 (79.9%) |
| 3.0x to 3.9x | 35 (36.5%) | 21 (14.1%) |
| 4.0x or more | 12 (12.5%) | 5 (3.4%) |
| Total | 96 (100.0%) | 149 (100.0%) |
Real Estate Taxes by Mortgage Status in Akron
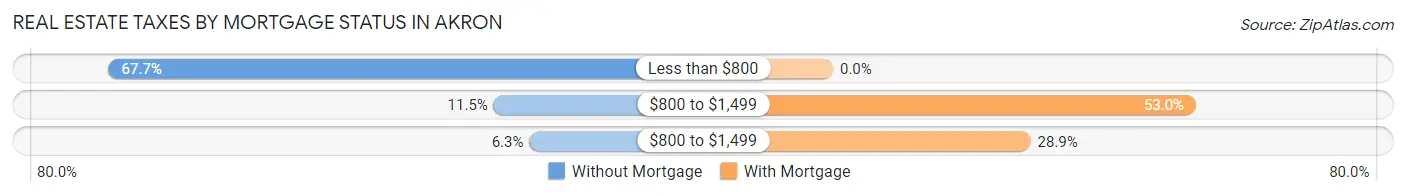
| Property Taxes | Without Mortgage | With Mortgage |
| Less than $800 | 65 (67.7%) | 0 (0.0%) |
| $800 to $1,499 | 11 (11.5%) | 79 (53.0%) |
| $800 to $1,499 | 6 (6.2%) | 43 (28.9%) |
| Total | 96 (100.0%) | 149 (100.0%) |
Health & Disability in Akron
Health Insurance Coverage by Age in Akron
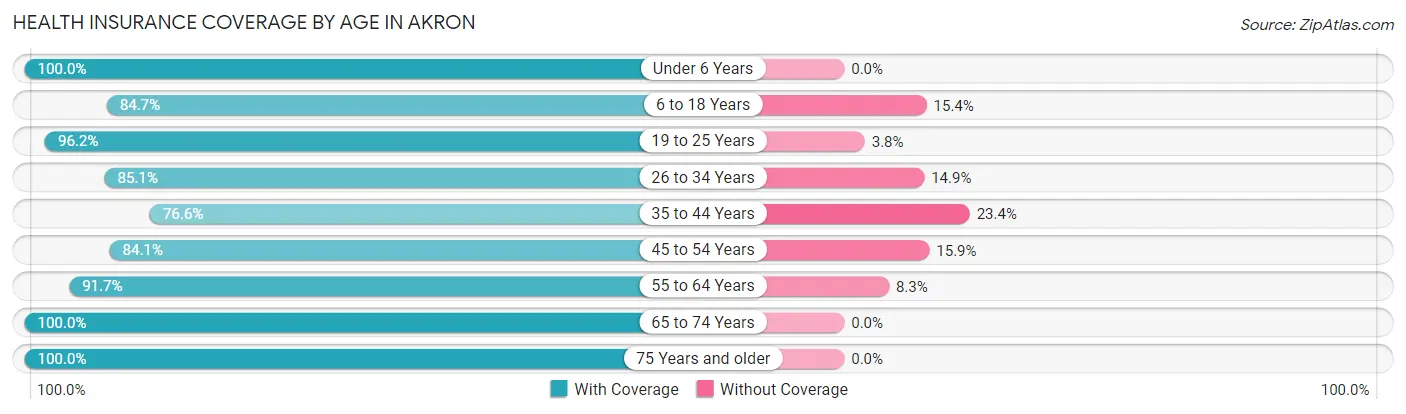
| Age Bracket | With Coverage | Without Coverage |
| Under 6 Years | 100 (100.0%) | 0 (0.0%) |
| 6 to 18 Years | 171 (84.7%) | 31 (15.3%) |
| 19 to 25 Years | 126 (96.2%) | 5 (3.8%) |
| 26 to 34 Years | 97 (85.1%) | 17 (14.9%) |
| 35 to 44 Years | 95 (76.6%) | 29 (23.4%) |
| 45 to 54 Years | 122 (84.1%) | 23 (15.9%) |
| 55 to 64 Years | 99 (91.7%) | 9 (8.3%) |
| 65 to 74 Years | 106 (100.0%) | 0 (0.0%) |
| 75 Years and older | 32 (100.0%) | 0 (0.0%) |
| Total | 948 (89.3%) | 114 (10.7%) |
Health Insurance Coverage by Citizenship Status in Akron
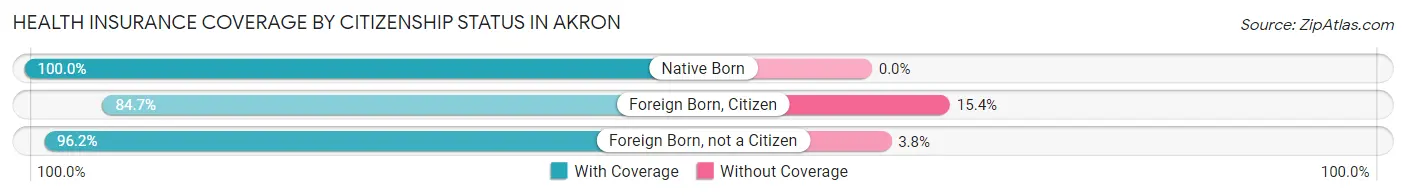
| Citizenship Status | With Coverage | Without Coverage |
| Native Born | 100 (100.0%) | 0 (0.0%) |
| Foreign Born, Citizen | 171 (84.7%) | 31 (15.3%) |
| Foreign Born, not a Citizen | 126 (96.2%) | 5 (3.8%) |
Health Insurance Coverage by Household Income in Akron
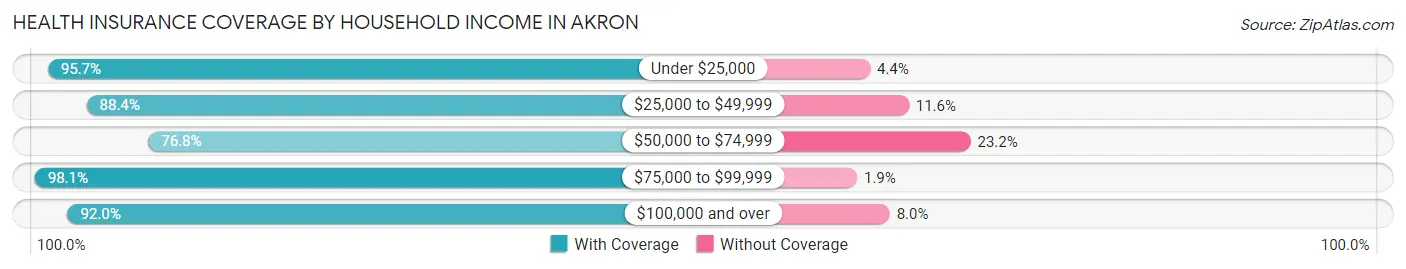
| Household Income | With Coverage | Without Coverage |
| Under $25,000 | 66 (95.7%) | 3 (4.3%) |
| $25,000 to $49,999 | 213 (88.4%) | 28 (11.6%) |
| $50,000 to $74,999 | 179 (76.8%) | 54 (23.2%) |
| $75,000 to $99,999 | 204 (98.1%) | 4 (1.9%) |
| $100,000 and over | 286 (92.0%) | 25 (8.0%) |
Public vs Private Health Insurance Coverage by Age in Akron
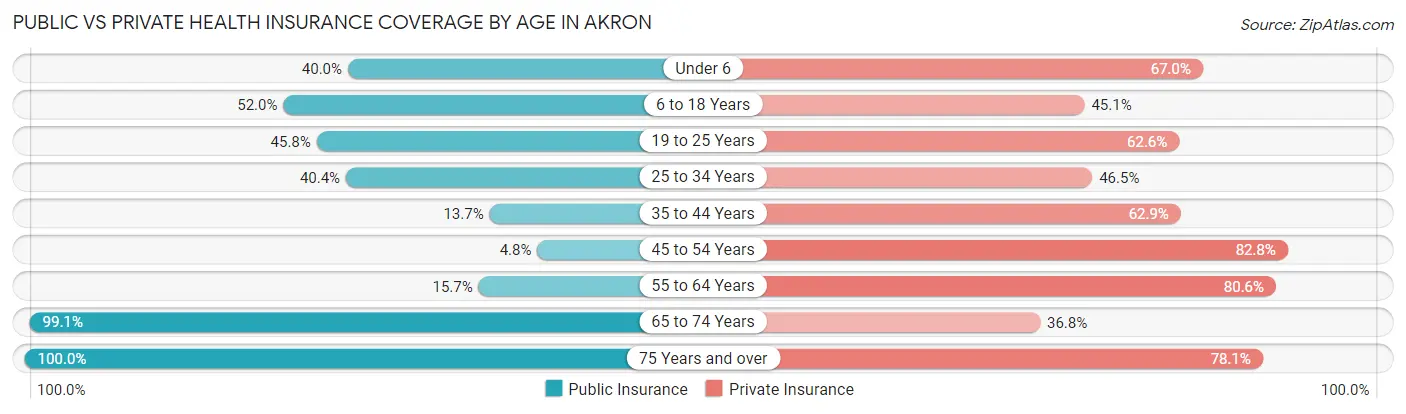
| Age Bracket | Public Insurance | Private Insurance |
| Under 6 | 40 (40.0%) | 67 (67.0%) |
| 6 to 18 Years | 105 (52.0%) | 91 (45.1%) |
| 19 to 25 Years | 60 (45.8%) | 82 (62.6%) |
| 25 to 34 Years | 46 (40.4%) | 53 (46.5%) |
| 35 to 44 Years | 17 (13.7%) | 78 (62.9%) |
| 45 to 54 Years | 7 (4.8%) | 120 (82.8%) |
| 55 to 64 Years | 17 (15.7%) | 87 (80.6%) |
| 65 to 74 Years | 105 (99.1%) | 39 (36.8%) |
| 75 Years and over | 32 (100.0%) | 25 (78.1%) |
| Total | 429 (40.4%) | 642 (60.5%) |
Disability Status by Sex by Age in Akron
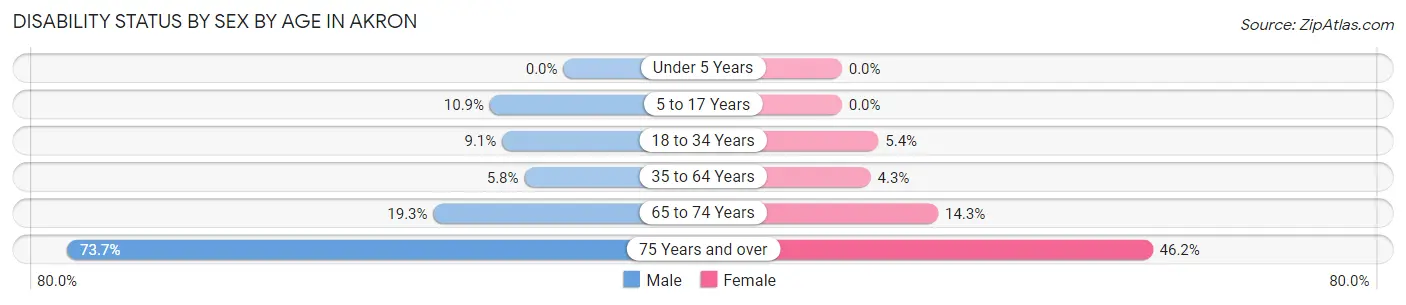
| Age Bracket | Male | Female |
| Under 5 Years | 0 (0.0%) | 0 (0.0%) |
| 5 to 17 Years | 12 (10.9%) | 0 (0.0%) |
| 18 to 34 Years | 11 (9.1%) | 7 (5.4%) |
| 35 to 64 Years | 11 (5.8%) | 8 (4.3%) |
| 65 to 74 Years | 11 (19.3%) | 7 (14.3%) |
| 75 Years and over | 14 (73.7%) | 6 (46.2%) |
Disability Class by Sex by Age in Akron
Disability Class: Hearing Difficulty
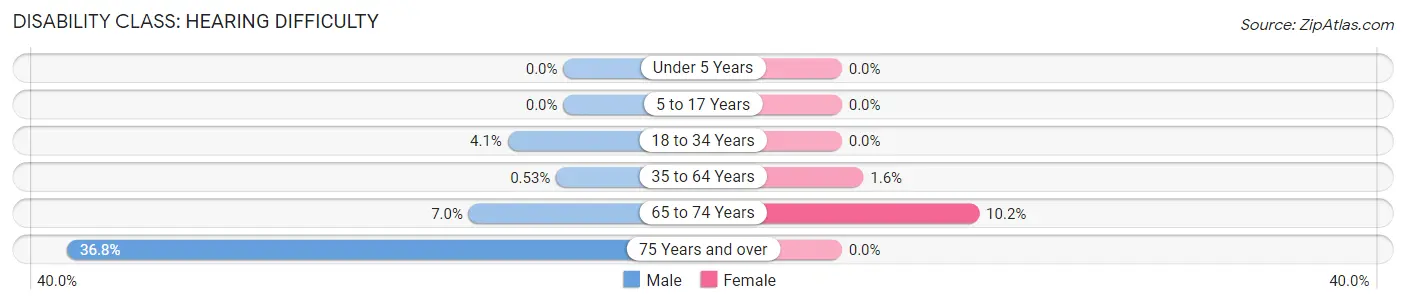
| Age Bracket | Male | Female |
| Under 5 Years | 0 (0.0%) | 0 (0.0%) |
| 5 to 17 Years | 0 (0.0%) | 0 (0.0%) |
| 18 to 34 Years | 5 (4.1%) | 0 (0.0%) |
| 35 to 64 Years | 1 (0.5%) | 3 (1.6%) |
| 65 to 74 Years | 4 (7.0%) | 5 (10.2%) |
| 75 Years and over | 7 (36.8%) | 0 (0.0%) |
Disability Class: Vision Difficulty
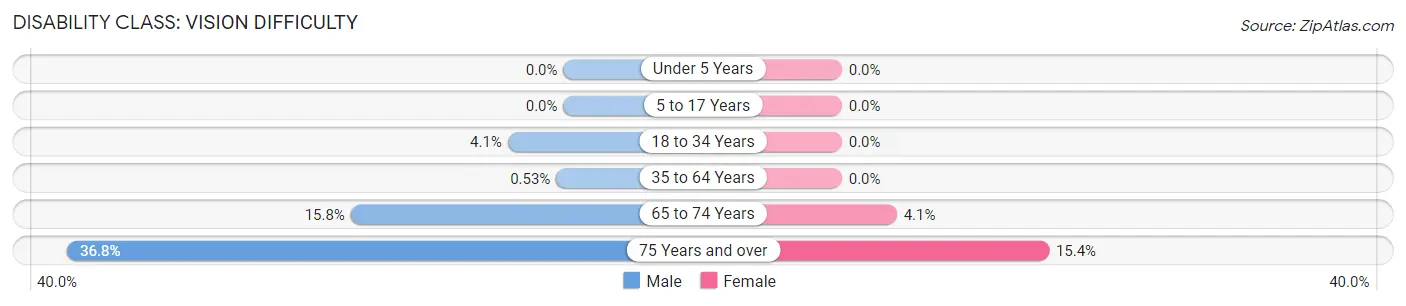
| Age Bracket | Male | Female |
| Under 5 Years | 0 (0.0%) | 0 (0.0%) |
| 5 to 17 Years | 0 (0.0%) | 0 (0.0%) |
| 18 to 34 Years | 5 (4.1%) | 0 (0.0%) |
| 35 to 64 Years | 1 (0.5%) | 0 (0.0%) |
| 65 to 74 Years | 9 (15.8%) | 2 (4.1%) |
| 75 Years and over | 7 (36.8%) | 2 (15.4%) |
Disability Class: Cognitive Difficulty
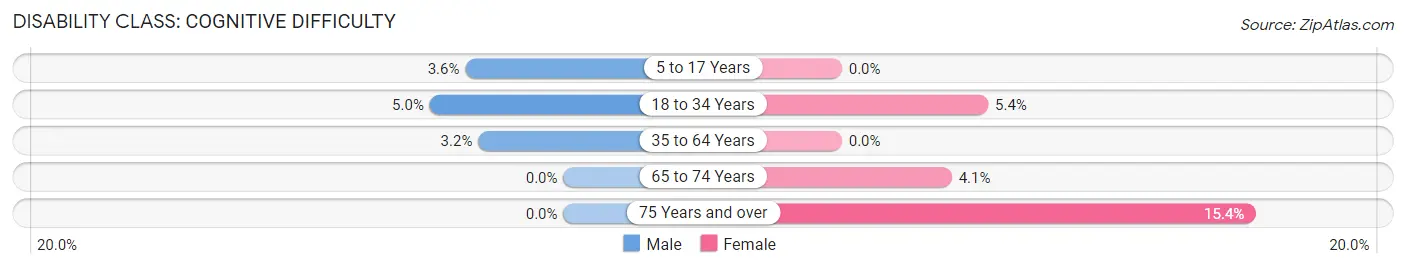
| Age Bracket | Male | Female |
| 5 to 17 Years | 4 (3.6%) | 0 (0.0%) |
| 18 to 34 Years | 6 (5.0%) | 7 (5.4%) |
| 35 to 64 Years | 6 (3.2%) | 0 (0.0%) |
| 65 to 74 Years | 0 (0.0%) | 2 (4.1%) |
| 75 Years and over | 0 (0.0%) | 2 (15.4%) |
Disability Class: Ambulatory Difficulty
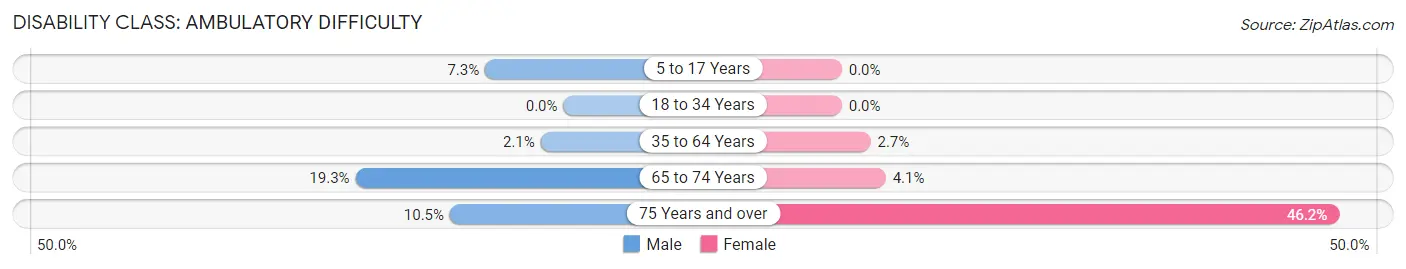
| Age Bracket | Male | Female |
| 5 to 17 Years | 8 (7.3%) | 0 (0.0%) |
| 18 to 34 Years | 0 (0.0%) | 0 (0.0%) |
| 35 to 64 Years | 4 (2.1%) | 5 (2.7%) |
| 65 to 74 Years | 11 (19.3%) | 2 (4.1%) |
| 75 Years and over | 2 (10.5%) | 6 (46.2%) |
Disability Class: Self-Care Difficulty
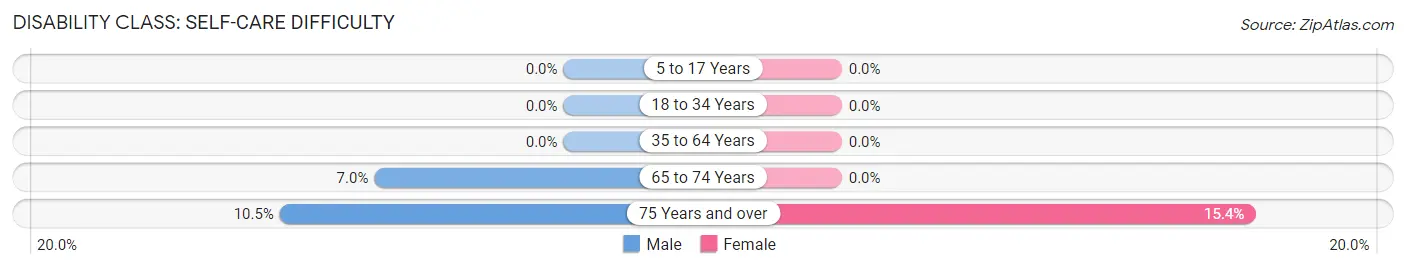
| Age Bracket | Male | Female |
| 5 to 17 Years | 0 (0.0%) | 0 (0.0%) |
| 18 to 34 Years | 0 (0.0%) | 0 (0.0%) |
| 35 to 64 Years | 0 (0.0%) | 0 (0.0%) |
| 65 to 74 Years | 4 (7.0%) | 0 (0.0%) |
| 75 Years and over | 2 (10.5%) | 2 (15.4%) |
Technology Access in Akron
Computing Device Access in Akron
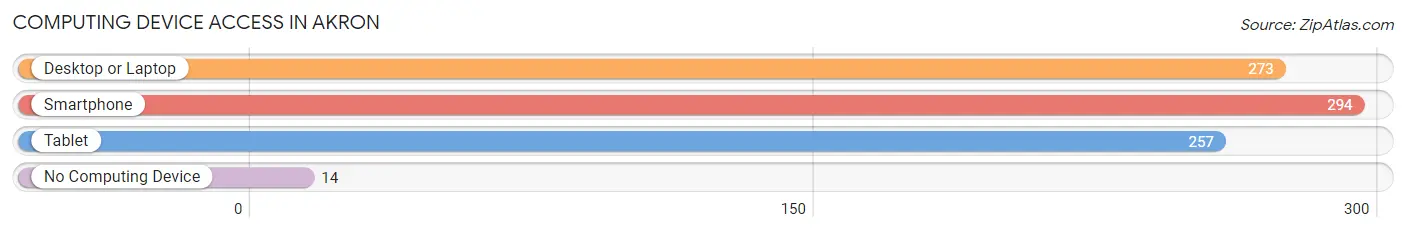
| Device Type | # Households | % Households |
| Desktop or Laptop | 273 | 80.5% |
| Smartphone | 294 | 86.7% |
| Tablet | 257 | 75.8% |
| No Computing Device | 14 | 4.1% |
| Total | 339 | 100.0% |
Internet Access in Akron
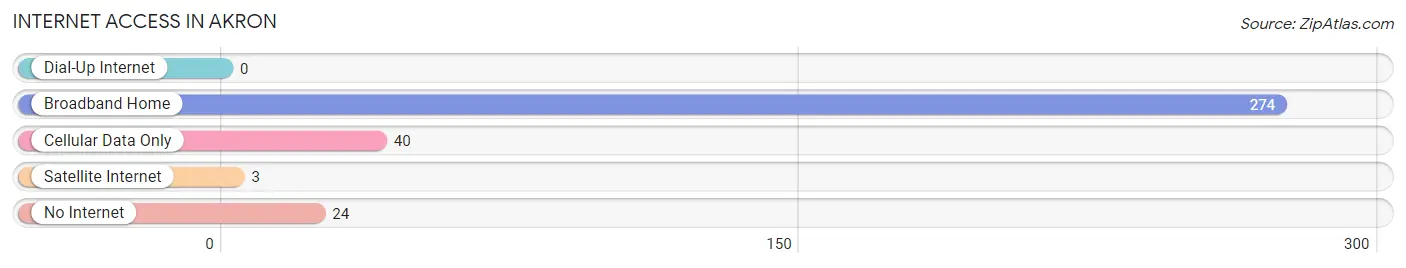
| Internet Type | # Households | % Households |
| Dial-Up Internet | 0 | 0.0% |
| Broadband Home | 274 | 80.8% |
| Cellular Data Only | 40 | 11.8% |
| Satellite Internet | 3 | 0.9% |
| No Internet | 24 | 7.1% |
| Total | 339 | 100.0% |
Akron Summary
Akron, Indiana is a small town located in Fulton County, Indiana. It is situated on the banks of the Tippecanoe River, and is home to a population of approximately 1,000 people. The town was founded in 1837 and has a rich history of industry and agriculture.
Geography
Akron is located in the northwest corner of Fulton County, Indiana. It is situated on the banks of the Tippecanoe River, which flows through the town. The town is surrounded by farmland and is located approximately 20 miles from the nearest major city, Fort Wayne. The town is located at an elevation of 830 feet above sea level.
Economy
The economy of Akron is largely based on agriculture and manufacturing. The town is home to several small businesses, including a grocery store, a hardware store, and a few restaurants. The town also has a few small manufacturing plants, which produce a variety of products, including furniture, automotive parts, and medical supplies.
Demographics
As of the 2010 census, the population of Akron was 1,000 people. The racial makeup of the town was 97.2% White, 0.7% African American, 0.2% Native American, 0.2% Asian, 0.2% from other races, and 1.7% from two or more races. The median household income was $37,500, and the median family income was $45,000.
History
Akron was founded in 1837 by a group of settlers from Ohio. The town was named after Akron, Ohio, and was originally intended to be a trading post. The town quickly grew and became a center of industry and agriculture. In the late 19th century, the town was home to several factories, including a furniture factory, a flour mill, and a sawmill.
In the early 20th century, the town experienced a period of decline as the factories closed and the population decreased. However, in the late 20th century, the town experienced a resurgence as new businesses opened and the population began to grow again. Today, Akron is a small but vibrant town with a strong sense of community.
Conclusion
Akron, Indiana is a small town located in Fulton County, Indiana. It is situated on the banks of the Tippecanoe River, and is home to a population of approximately 1,000 people. The town was founded in 1837 and has a rich history of industry and agriculture. The economy of Akron is largely based on agriculture and manufacturing, and the town is home to several small businesses. The racial makeup of the town is predominantly White, and the median household income is $37,500. Akron is a small but vibrant town with a strong sense of community.
Common Questions
What is Per Capita Income in Akron?
Per Capita income in Akron is $23,970.
What is the Median Family Income in Akron?
Median Family Income in Akron is $58,681.
What is the Median Household income in Akron?
Median Household Income in Akron is $58,958.
What is Income or Wage Gap in Akron?
Income or Wage Gap in Akron is 40.0%.
Women in Akron earn 60.0 cents for every dollar earned by a man.
What is Inequality or Gini Index in Akron?
Inequality or Gini Index in Akron is 0.35.
What is the Total Population of Akron?
Total Population of Akron is 1,062.
What is the Total Male Population of Akron?
Total Male Population of Akron is 513.
What is the Total Female Population of Akron?
Total Female Population of Akron is 549.
What is the Ratio of Males per 100 Females in Akron?
There are 93.44 Males per 100 Females in Akron.
What is the Ratio of Females per 100 Males in Akron?
There are 107.02 Females per 100 Males in Akron.
What is the Median Population Age in Akron?
Median Population Age in Akron is 34.5 Years.
What is the Average Family Size in Akron
Average Family Size in Akron is 3.4 People.
What is the Average Household Size in Akron
Average Household Size in Akron is 3.1 People.
How Large is the Labor Force in Akron?
There are 540 People in the Labor Forcein in Akron.
What is the Percentage of People in the Labor Force in Akron?
66.1% of People are in the Labor Force in Akron.
What is the Unemployment Rate in Akron?
Unemployment Rate in Akron is 10.9%.