Advance, IN Map & Demographics
Advance Map
Advance Overview
$32,850
PER CAPITA INCOME
$87,813
AVG FAMILY INCOME
$71,042
AVG HOUSEHOLD INCOME
27.7%
WAGE / INCOME GAP [ % ]
72.3¢/ $1
WAGE / INCOME GAP [ $ ]
0.34
INEQUALITY / GINI INDEX
412
TOTAL POPULATION
210
MALE POPULATION
202
FEMALE POPULATION
103.96
MALES / 100 FEMALES
96.19
FEMALES / 100 MALES
43.0
MEDIAN AGE
2.9
AVG FAMILY SIZE
2.4
AVG HOUSEHOLD SIZE
232
LABOR FORCE [ PEOPLE ]
69.5%
PERCENT IN LABOR FORCE
1.3%
UNEMPLOYMENT RATE
Advance Zip Codes
Income in Advance
Income Overview in Advance
Per Capita Income in Advance is $32,850, while median incomes of families and households are $87,813 and $71,042 respectively.
| Characteristic | Number | Measure |
| Per Capita Income | 412 | $32,850 |
| Median Family Income | 125 | $87,813 |
| Mean Family Income | 125 | $93,420 |
| Median Household Income | 169 | $71,042 |
| Mean Household Income | 169 | $79,859 |
| Income Deficit | 125 | $0 |
| Wage / Income Gap (%) | 412 | 27.75% |
| Wage / Income Gap ($) | 412 | 72.25¢ per $1 |
| Gini / Inequality Index | 412 | 0.34 |
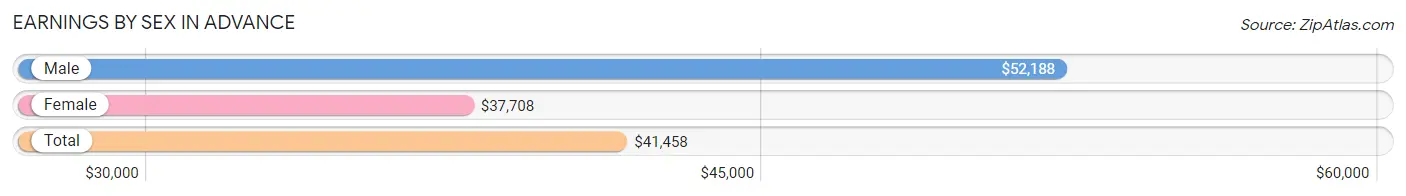
Earnings by Sex in Advance
Average Earnings in Advance are $41,458, $52,188 for men and $37,708 for women, a difference of 27.8%.
| Sex | Number | Average Earnings |
| Male | 109 (43.8%) | $52,188 |
| Female | 140 (56.2%) | $37,708 |
| Total | 249 (100.0%) | $41,458 |
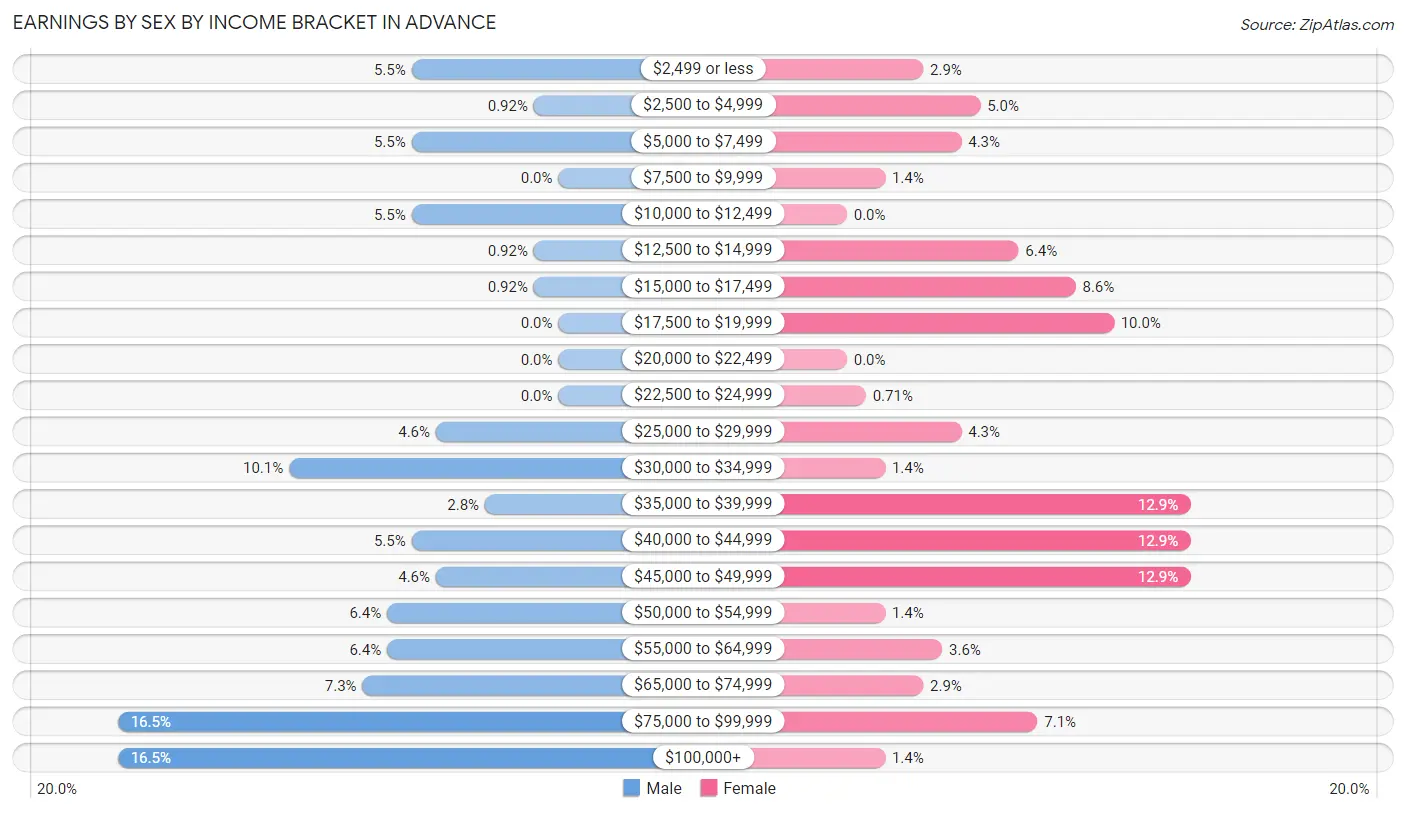
Earnings by Sex by Income Bracket in Advance
The most common earnings brackets in Advance are $75,000 to $99,999 for men (18 | 16.5%) and $35,000 to $39,999 for women (18 | 12.9%).
| Income | Male | Female |
| $2,499 or less | 6 (5.5%) | 4 (2.9%) |
| $2,500 to $4,999 | 1 (0.9%) | 7 (5.0%) |
| $5,000 to $7,499 | 6 (5.5%) | 6 (4.3%) |
| $7,500 to $9,999 | 0 (0.0%) | 2 (1.4%) |
| $10,000 to $12,499 | 6 (5.5%) | 0 (0.0%) |
| $12,500 to $14,999 | 1 (0.9%) | 9 (6.4%) |
| $15,000 to $17,499 | 1 (0.9%) | 12 (8.6%) |
| $17,500 to $19,999 | 0 (0.0%) | 14 (10.0%) |
| $20,000 to $22,499 | 0 (0.0%) | 0 (0.0%) |
| $22,500 to $24,999 | 0 (0.0%) | 1 (0.7%) |
| $25,000 to $29,999 | 5 (4.6%) | 6 (4.3%) |
| $30,000 to $34,999 | 11 (10.1%) | 2 (1.4%) |
| $35,000 to $39,999 | 3 (2.8%) | 18 (12.9%) |
| $40,000 to $44,999 | 6 (5.5%) | 18 (12.9%) |
| $45,000 to $49,999 | 5 (4.6%) | 18 (12.9%) |
| $50,000 to $54,999 | 7 (6.4%) | 2 (1.4%) |
| $55,000 to $64,999 | 7 (6.4%) | 5 (3.6%) |
| $65,000 to $74,999 | 8 (7.3%) | 4 (2.9%) |
| $75,000 to $99,999 | 18 (16.5%) | 10 (7.1%) |
| $100,000+ | 18 (16.5%) | 2 (1.4%) |
| Total | 109 (100.0%) | 140 (100.0%) |
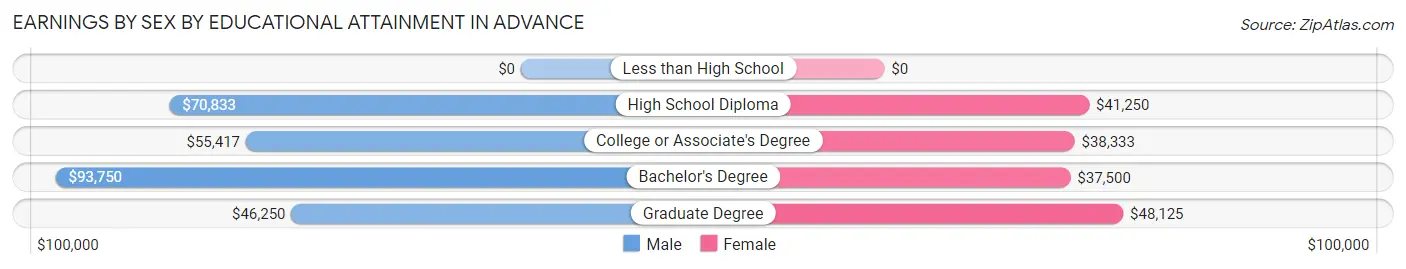
Earnings by Sex by Educational Attainment in Advance
Average earnings in Advance are $55,417 for men and $38,854 for women, a difference of 29.9%. Men with an educational attainment of bachelor's degree enjoy the highest average annual earnings of $93,750, while those with graduate degree education earn the least with $46,250. Women with an educational attainment of graduate degree earn the most with the average annual earnings of $48,125, while those with bachelor's degree education have the smallest earnings of $37,500.
| Educational Attainment | Male Income | Female Income |
| Less than High School | - | - |
| High School Diploma | $70,833 | $41,250 |
| College or Associate's Degree | $55,417 | $38,333 |
| Bachelor's Degree | $93,750 | $37,500 |
| Graduate Degree | $46,250 | $48,125 |
| Total | $55,417 | $38,854 |
Family Income in Advance
Family Income Brackets in Advance
According to the Advance family income data, there are 41 families falling into the $100,000 to $149,999 income range, which is the most common income bracket and makes up 32.8% of all families.
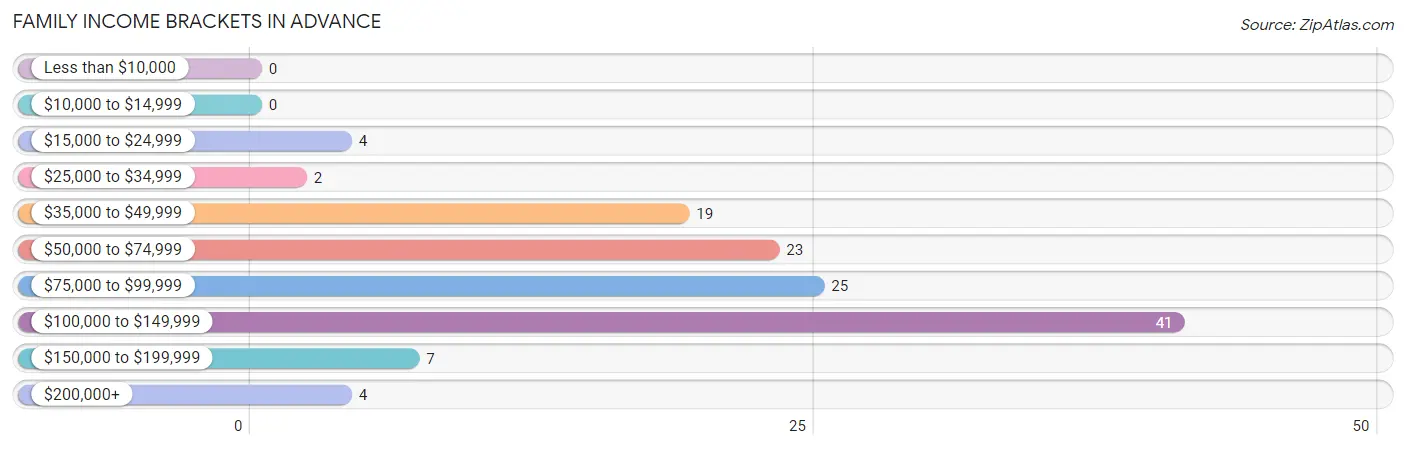
| Income Bracket | # Families | % Families |
| Less than $10,000 | 0 | 0.0% |
| $10,000 to $14,999 | 0 | 0.0% |
| $15,000 to $24,999 | 4 | 3.2% |
| $25,000 to $34,999 | 2 | 1.6% |
| $35,000 to $49,999 | 19 | 15.2% |
| $50,000 to $74,999 | 23 | 18.4% |
| $75,000 to $99,999 | 25 | 20.0% |
| $100,000 to $149,999 | 41 | 32.8% |
| $150,000 to $199,999 | 7 | 5.6% |
| $200,000+ | 4 | 3.2% |
Family Income by Famaliy Size in Advance
4-person families (30 | 24.0%) account for the highest median family income in Advance with $101,250 per family, while 2-person families (63 | 50.4%) have the highest median income of $37,188 per family member.
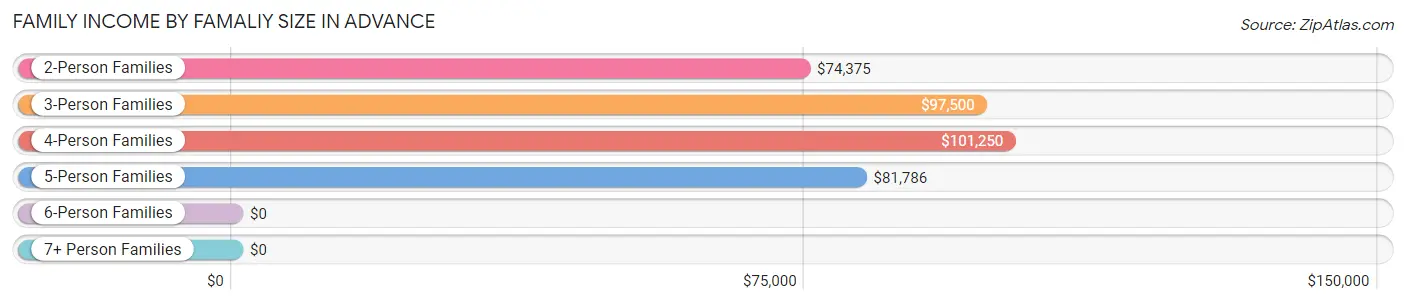
| Income Bracket | # Families | Median Income |
| 2-Person Families | 63 (50.4%) | $74,375 |
| 3-Person Families | 22 (17.6%) | $97,500 |
| 4-Person Families | 30 (24.0%) | $101,250 |
| 5-Person Families | 10 (8.0%) | $81,786 |
| 6-Person Families | 0 (0.0%) | $0 |
| 7+ Person Families | 0 (0.0%) | $0 |
| Total | 125 (100.0%) | $87,813 |
Family Income by Number of Earners in Advance
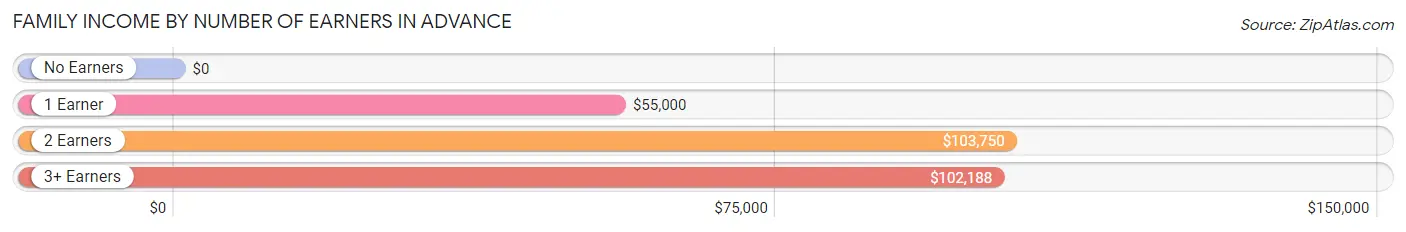
| Number of Earners | # Families | Median Income |
| No Earners | 10 (8.0%) | $0 |
| 1 Earner | 34 (27.2%) | $55,000 |
| 2 Earners | 66 (52.8%) | $103,750 |
| 3+ Earners | 15 (12.0%) | $102,188 |
| Total | 125 (100.0%) | $87,813 |
Household Income in Advance
Household Income Brackets in Advance
With 41 households falling in the category, the $100,000 to $149,999 income range is the most frequent in Advance, accounting for 24.3% of all households.
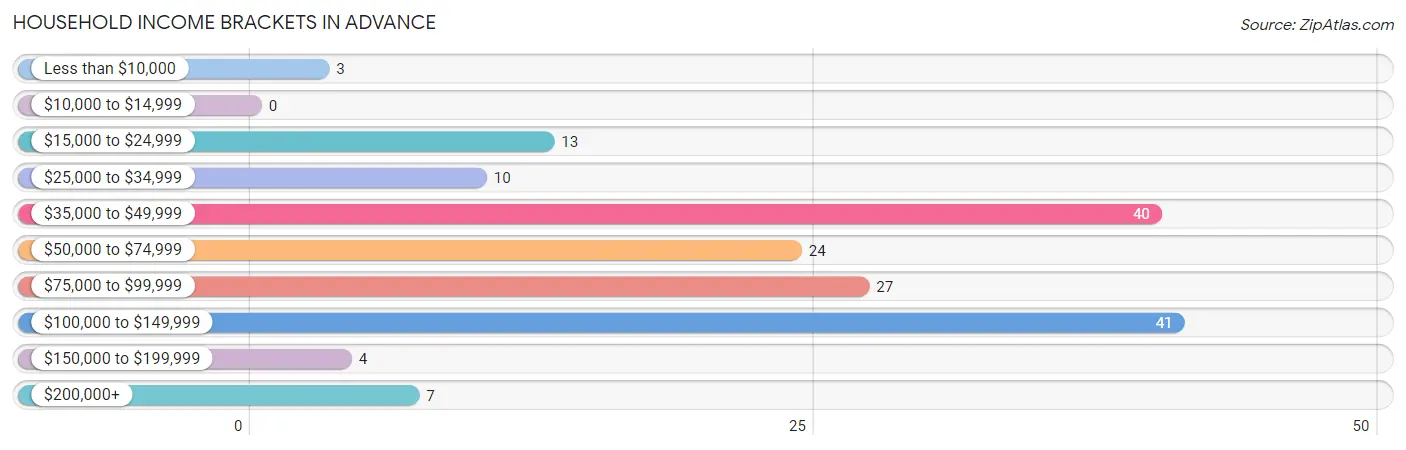
| Income Bracket | # Households | % Households |
| Less than $10,000 | 3 | 1.8% |
| $10,000 to $14,999 | 0 | 0.0% |
| $15,000 to $24,999 | 13 | 7.7% |
| $25,000 to $34,999 | 10 | 5.9% |
| $35,000 to $49,999 | 40 | 23.7% |
| $50,000 to $74,999 | 24 | 14.2% |
| $75,000 to $99,999 | 27 | 16.0% |
| $100,000 to $149,999 | 41 | 24.3% |
| $150,000 to $199,999 | 4 | 2.4% |
| $200,000+ | 7 | 4.1% |
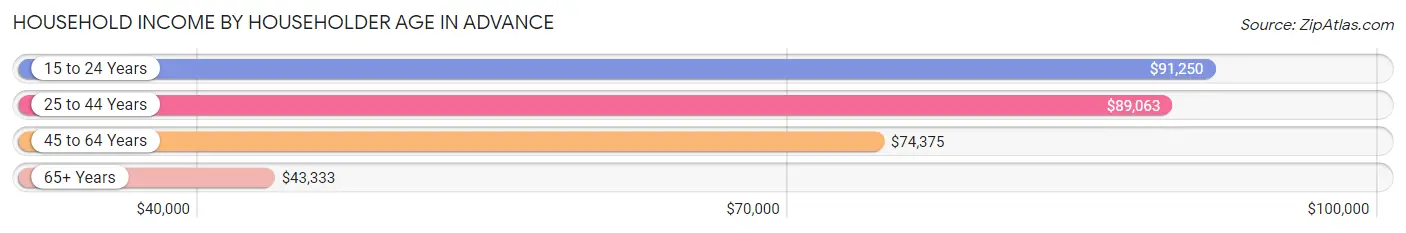
Household Income by Householder Age in Advance
The median household income in Advance is $71,042, with the highest median household income of $91,250 found in the 15 to 24 years age bracket for the primary householder. A total of 5 households (3.0%) fall into this category. Meanwhile, the 65+ years age bracket for the primary householder has the lowest median household income of $43,333, with 38 households (22.5%) in this group.
| Income Bracket | # Households | Median Income |
| 15 to 24 Years | 5 (3.0%) | $91,250 |
| 25 to 44 Years | 45 (26.6%) | $89,063 |
| 45 to 64 Years | 81 (47.9%) | $74,375 |
| 65+ Years | 38 (22.5%) | $43,333 |
| Total | 169 (100.0%) | $71,042 |
Poverty in Advance
Income Below Poverty by Sex and Age in Advance
With 2.4% poverty level for males and 1.0% for females among the residents of Advance, 75 year old and over males and 55 to 64 year old females are the most vulnerable to poverty, with 3 males (27.3%) and 2 females (4.3%) in their respective age groups living below the poverty level.

| Age Bracket | Male | Female |
| Under 5 Years | 0 (0.0%) | 0 (0.0%) |
| 5 Years | 0 (0.0%) | 0 (0.0%) |
| 6 to 11 Years | 0 (0.0%) | 0 (0.0%) |
| 12 to 14 Years | 0 (0.0%) | 0 (0.0%) |
| 15 Years | 0 (0.0%) | 0 (0.0%) |
| 16 and 17 Years | 0 (0.0%) | 0 (0.0%) |
| 18 to 24 Years | 0 (0.0%) | 0 (0.0%) |
| 25 to 34 Years | 0 (0.0%) | 0 (0.0%) |
| 35 to 44 Years | 0 (0.0%) | 0 (0.0%) |
| 45 to 54 Years | 0 (0.0%) | 0 (0.0%) |
| 55 to 64 Years | 2 (6.2%) | 2 (4.3%) |
| 65 to 74 Years | 0 (0.0%) | 0 (0.0%) |
| 75 Years and over | 3 (27.3%) | 0 (0.0%) |
| Total | 5 (2.4%) | 2 (1.0%) |
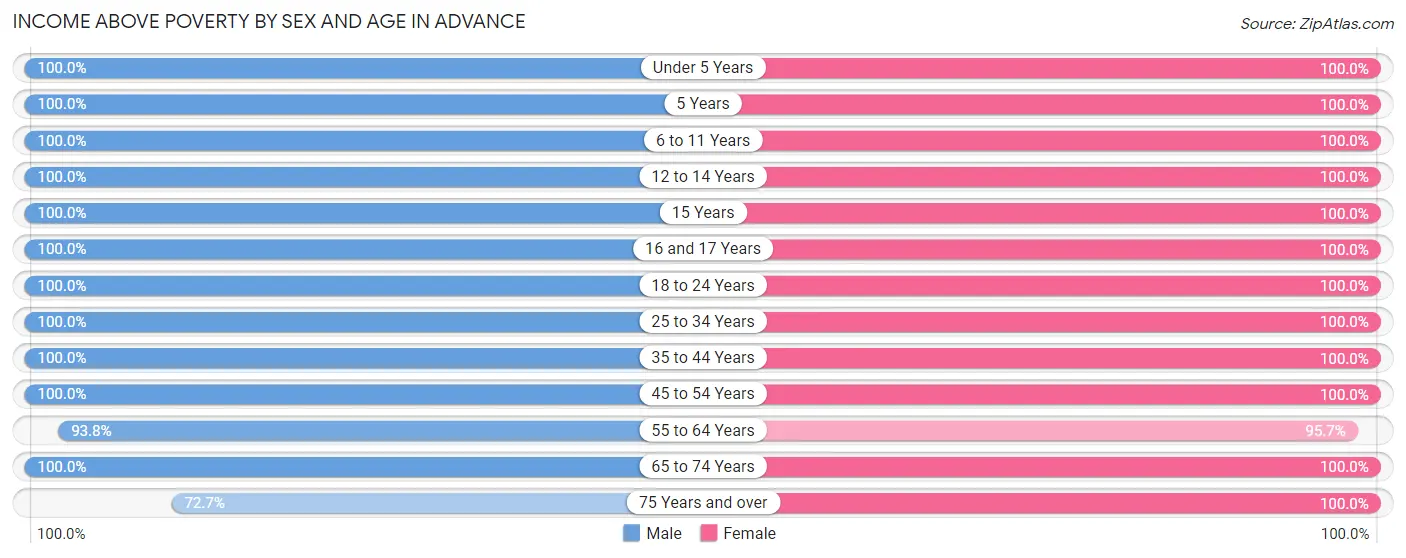
Income Above Poverty by Sex and Age in Advance
According to the poverty statistics in Advance, males aged under 5 years and females aged under 5 years are the age groups that are most secure financially, with 100.0% of males and 100.0% of females in these age groups living above the poverty line.
| Age Bracket | Male | Female |
| Under 5 Years | 7 (100.0%) | 2 (100.0%) |
| 5 Years | 1 (100.0%) | 1 (100.0%) |
| 6 to 11 Years | 5 (100.0%) | 19 (100.0%) |
| 12 to 14 Years | 25 (100.0%) | 8 (100.0%) |
| 15 Years | 9 (100.0%) | 1 (100.0%) |
| 16 and 17 Years | 5 (100.0%) | 2 (100.0%) |
| 18 to 24 Years | 14 (100.0%) | 25 (100.0%) |
| 25 to 34 Years | 29 (100.0%) | 9 (100.0%) |
| 35 to 44 Years | 16 (100.0%) | 41 (100.0%) |
| 45 to 54 Years | 32 (100.0%) | 26 (100.0%) |
| 55 to 64 Years | 30 (93.8%) | 45 (95.7%) |
| 65 to 74 Years | 24 (100.0%) | 9 (100.0%) |
| 75 Years and over | 8 (72.7%) | 12 (100.0%) |
| Total | 205 (97.6%) | 200 (99.0%) |
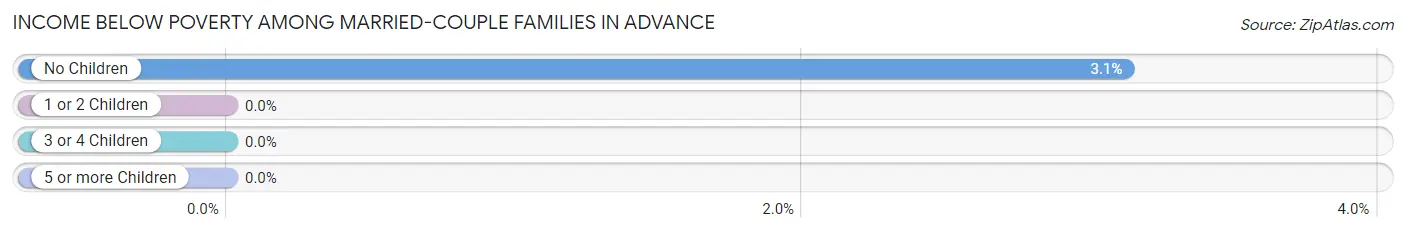
Income Below Poverty Among Married-Couple Families in Advance
The poverty statistics for married-couple families in Advance show that 2.0% or 2 of the total 98 families live below the poverty line. Families with no children have the highest poverty rate of 3.1%, comprising of 2 families. On the other hand, families with 1 or 2 children have the lowest poverty rate of 0.0%, which includes 0 families.
| Children | Above Poverty | Below Poverty |
| No Children | 62 (96.9%) | 2 (3.1%) |
| 1 or 2 Children | 25 (100.0%) | 0 (0.0%) |
| 3 or 4 Children | 9 (100.0%) | 0 (0.0%) |
| 5 or more Children | 0 (0.0%) | 0 (0.0%) |
| Total | 96 (98.0%) | 2 (2.0%) |
Income Below Poverty Among Single-Parent Households in Advance
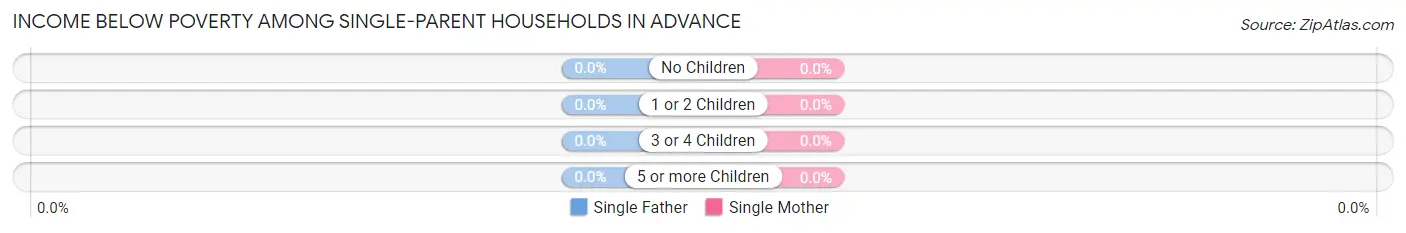
| Children | Single Father | Single Mother |
| No Children | 0 (0.0%) | 0 (0.0%) |
| 1 or 2 Children | 0 (0.0%) | 0 (0.0%) |
| 3 or 4 Children | 0 (0.0%) | 0 (0.0%) |
| 5 or more Children | 0 (0.0%) | 0 (0.0%) |
| Total | 0 (0.0%) | 0 (0.0%) |
Income Below Poverty Among Married-Couple vs Single-Parent Households in Advance
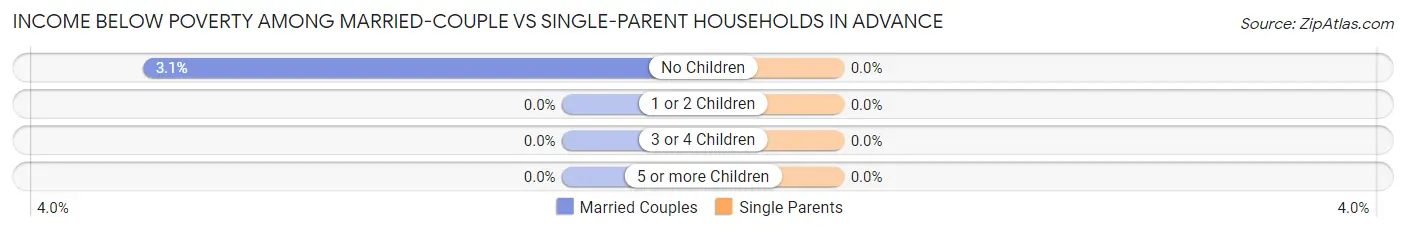
| Children | Married-Couple Families | Single-Parent Households |
| No Children | 2 (3.1%) | 0 (0.0%) |
| 1 or 2 Children | 0 (0.0%) | 0 (0.0%) |
| 3 or 4 Children | 0 (0.0%) | 0 (0.0%) |
| 5 or more Children | 0 (0.0%) | 0 (0.0%) |
| Total | 2 (2.0%) | 0 (0.0%) |
Race in Advance
The most populous races in Advance are White / Caucasian (404 | 98.1%), Two or more Races (6 | 1.5%), and Hispanic or Latino (3 | 0.7%).
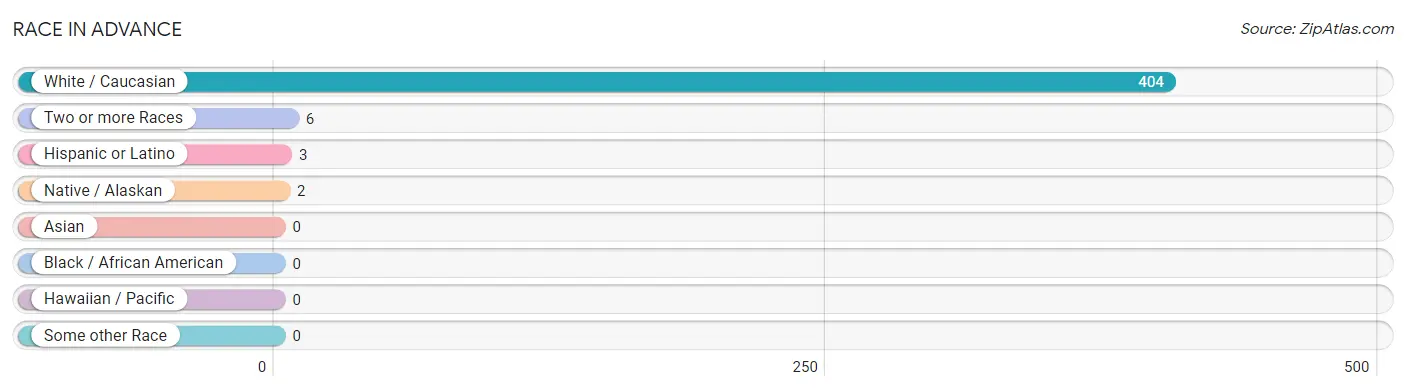
| Race | # Population | % Population |
| Asian | 0 | 0.0% |
| Black / African American | 0 | 0.0% |
| Hawaiian / Pacific | 0 | 0.0% |
| Hispanic or Latino | 3 | 0.7% |
| Native / Alaskan | 2 | 0.5% |
| White / Caucasian | 404 | 98.1% |
| Two or more Races | 6 | 1.5% |
| Some other Race | 0 | 0.0% |
| Total | 412 | 100.0% |
Ancestry in Advance
The most populous ancestries reported in Advance are American (127 | 30.8%), Irish (30 | 7.3%), English (25 | 6.1%), German (25 | 6.1%), and Scandinavian (22 | 5.3%), together accounting for 55.6% of all Advance residents.
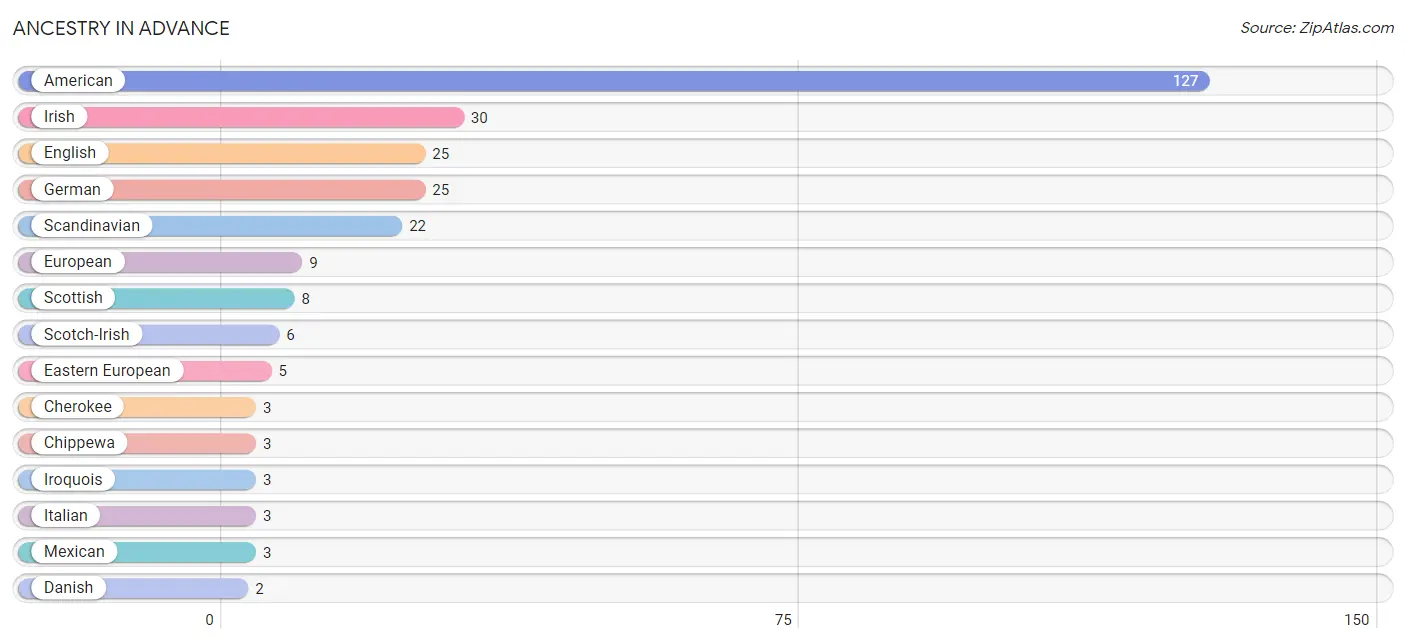
| Ancestry | # Population | % Population |
| American | 127 | 30.8% |
| Cherokee | 3 | 0.7% |
| Chippewa | 3 | 0.7% |
| Danish | 2 | 0.5% |
| Dutch | 1 | 0.2% |
| Eastern European | 5 | 1.2% |
| English | 25 | 6.1% |
| European | 9 | 2.2% |
| German | 25 | 6.1% |
| Greek | 1 | 0.2% |
| Hungarian | 1 | 0.2% |
| Irish | 30 | 7.3% |
| Iroquois | 3 | 0.7% |
| Italian | 3 | 0.7% |
| Mexican | 3 | 0.7% |
| Norwegian | 2 | 0.5% |
| Pennsylvania German | 2 | 0.5% |
| Polish | 1 | 0.2% |
| Scandinavian | 22 | 5.3% |
| Scotch-Irish | 6 | 1.5% |
| Scottish | 8 | 1.9% |
| Swedish | 2 | 0.5% |
| Swiss | 2 | 0.5% |
| Ukrainian | 2 | 0.5% | View All 24 Rows |
Immigrants in Advance

| Immigration Origin | # Population | % Population | View All 0 Rows |
Sex and Age in Advance
Sex and Age in Advance
The most populous age groups in Advance are 10 to 14 Years (30 | 14.3%) for men and 40 to 44 Years (28 | 13.9%) for women.
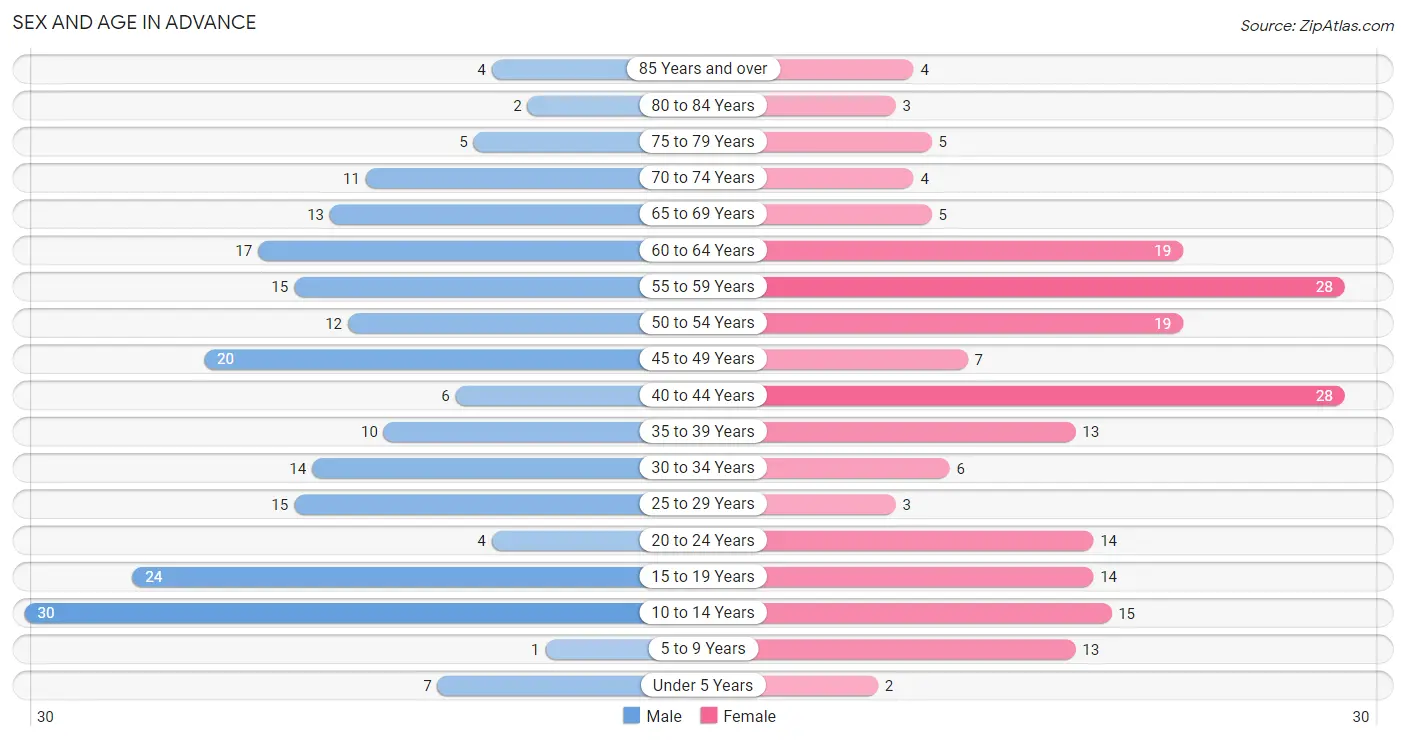
| Age Bracket | Male | Female |
| Under 5 Years | 7 (3.3%) | 2 (1.0%) |
| 5 to 9 Years | 1 (0.5%) | 13 (6.4%) |
| 10 to 14 Years | 30 (14.3%) | 15 (7.4%) |
| 15 to 19 Years | 24 (11.4%) | 14 (6.9%) |
| 20 to 24 Years | 4 (1.9%) | 14 (6.9%) |
| 25 to 29 Years | 15 (7.1%) | 3 (1.5%) |
| 30 to 34 Years | 14 (6.7%) | 6 (3.0%) |
| 35 to 39 Years | 10 (4.8%) | 13 (6.4%) |
| 40 to 44 Years | 6 (2.9%) | 28 (13.9%) |
| 45 to 49 Years | 20 (9.5%) | 7 (3.5%) |
| 50 to 54 Years | 12 (5.7%) | 19 (9.4%) |
| 55 to 59 Years | 15 (7.1%) | 28 (13.9%) |
| 60 to 64 Years | 17 (8.1%) | 19 (9.4%) |
| 65 to 69 Years | 13 (6.2%) | 5 (2.5%) |
| 70 to 74 Years | 11 (5.2%) | 4 (2.0%) |
| 75 to 79 Years | 5 (2.4%) | 5 (2.5%) |
| 80 to 84 Years | 2 (0.9%) | 3 (1.5%) |
| 85 Years and over | 4 (1.9%) | 4 (2.0%) |
| Total | 210 (100.0%) | 202 (100.0%) |
Families and Households in Advance
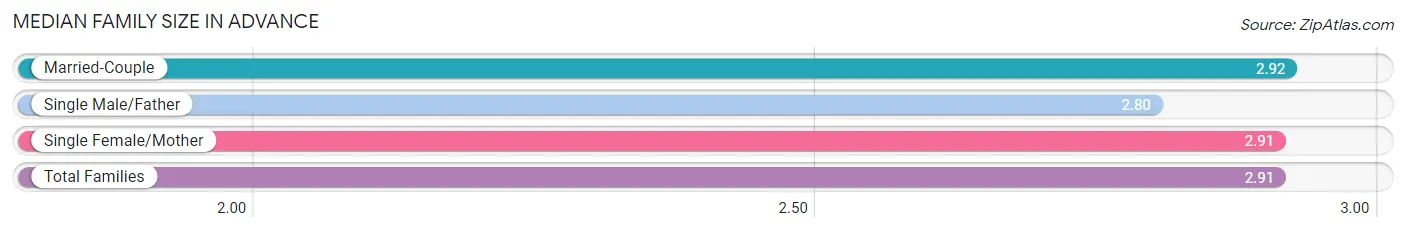
Median Family Size in Advance
The median family size in Advance is 2.91 persons per family, with married-couple families (98 | 78.4%) accounting for the largest median family size of 2.92 persons per family. On the other hand, single male/father families (5 | 4.0%) represent the smallest median family size with 2.80 persons per family.
| Family Type | # Families | Family Size |
| Married-Couple | 98 (78.4%) | 2.92 |
| Single Male/Father | 5 (4.0%) | 2.80 |
| Single Female/Mother | 22 (17.6%) | 2.91 |
| Total Families | 125 (100.0%) | 2.91 |
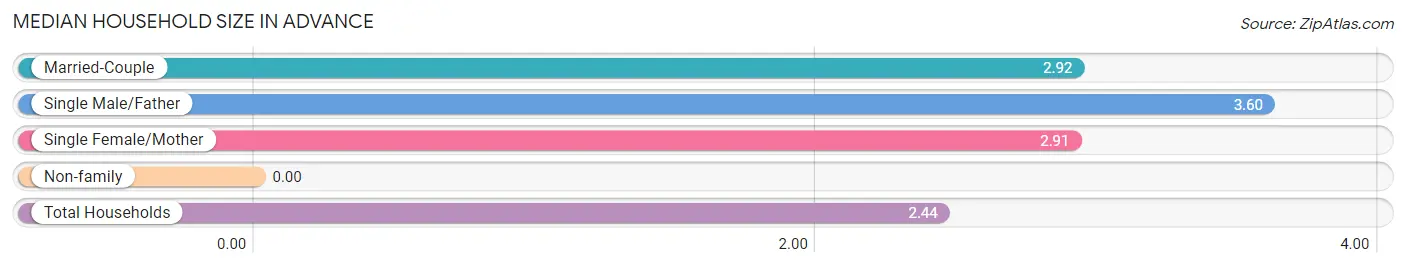
Median Household Size in Advance
| Household Type | # Households | Household Size |
| Married-Couple | 98 (58.0%) | 2.92 |
| Single Male/Father | 5 (3.0%) | 3.60 |
| Single Female/Mother | 22 (13.0%) | 2.91 |
| Non-family | 44 (26.0%) | - |
| Total Households | 169 (100.0%) | 2.44 |
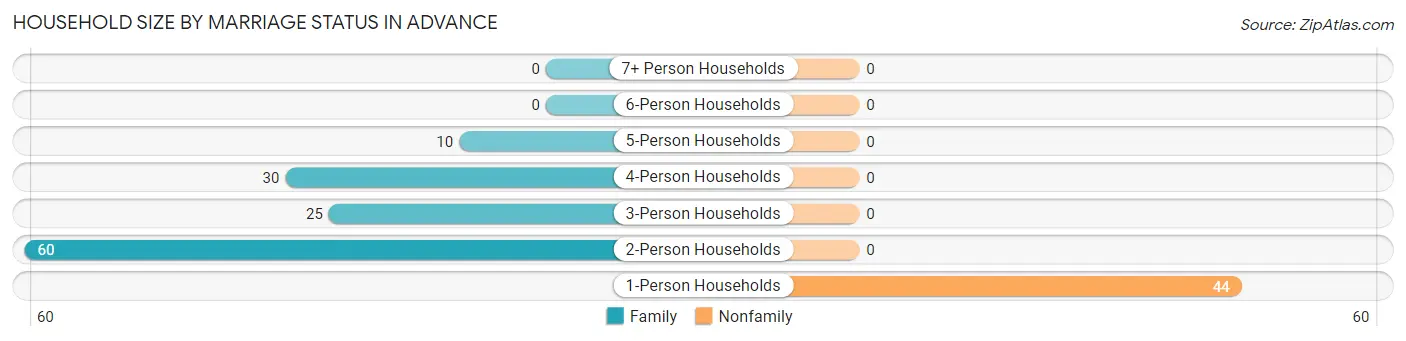
Household Size by Marriage Status in Advance
Out of a total of 169 households in Advance, 125 (74.0%) are family households, while 44 (26.0%) are nonfamily households. The most numerous type of family households are 2-person households, comprising 60, and the most common type of nonfamily households are 1-person households, comprising 44.
| Household Size | Family Households | Nonfamily Households |
| 1-Person Households | - | 44 (26.0%) |
| 2-Person Households | 60 (35.5%) | 0 (0.0%) |
| 3-Person Households | 25 (14.8%) | 0 (0.0%) |
| 4-Person Households | 30 (17.7%) | 0 (0.0%) |
| 5-Person Households | 10 (5.9%) | 0 (0.0%) |
| 6-Person Households | 0 (0.0%) | 0 (0.0%) |
| 7+ Person Households | 0 (0.0%) | 0 (0.0%) |
| Total | 125 (74.0%) | 44 (26.0%) |
Female Fertility in Advance
Fertility by Age in Advance
| Age Bracket | Women with Births | Births / 1,000 Women |
| 15 to 19 years | 0 (0.0%) | 0.0 |
| 20 to 34 years | 0 (0.0%) | 0.0 |
| 35 to 50 years | 0 (0.0%) | 0.0 |
| Total | 0 (0.0%) | 0.0 |
Fertility by Age by Marriage Status in Advance
| Age Bracket | Married | Unmarried |
| 15 to 19 years | 0 (0.0%) | 0 (0.0%) |
| 20 to 34 years | 0 (0.0%) | 0 (0.0%) |
| 35 to 50 years | 0 (0.0%) | 0 (0.0%) |
| Total | 0 (0.0%) | 0 (0.0%) |
Fertility by Education in Advance
| Educational Attainment | Women with Births | Births / 1,000 Women |
| Less than High School | 0 (0.0%) | 0.0 |
| High School Diploma | 0 (0.0%) | 0.0 |
| College or Associate's Degree | 0 (0.0%) | 0.0 |
| Bachelor's Degree | 0 (0.0%) | 0.0 |
| Graduate Degree | 0 (0.0%) | 0.0 |
| Total | 0 (0.0%) | 0.0 |
Fertility by Education by Marriage Status in Advance
| Educational Attainment | Married | Unmarried |
| Less than High School | 0 (0.0%) | 0 (0.0%) |
| High School Diploma | 0 (0.0%) | 0 (0.0%) |
| College or Associate's Degree | 0 (0.0%) | 0 (0.0%) |
| Bachelor's Degree | 0 (0.0%) | 0 (0.0%) |
| Graduate Degree | 0 (0.0%) | 0 (0.0%) |
| Total | 0 (0.0%) | 0 (0.0%) |
Employment Characteristics in Advance
Employment by Class of Employer in Advance
Among the 226 employed individuals in Advance, private company employees (148 | 65.5%), local government employees (27 | 11.9%), and not-for-profit organizations (26 | 11.5%) make up the most common classes of employment.
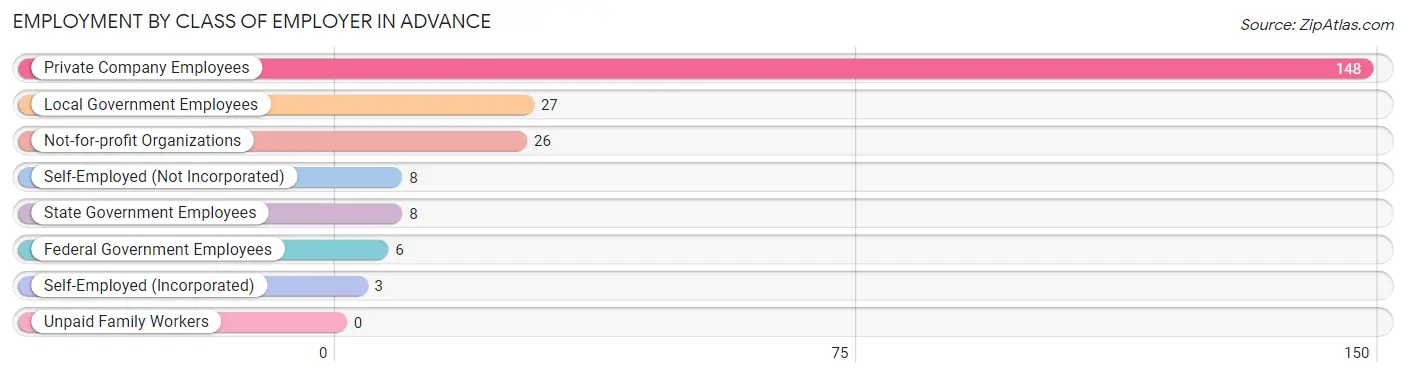
| Employer Class | # Employees | % Employees |
| Private Company Employees | 148 | 65.5% |
| Self-Employed (Incorporated) | 3 | 1.3% |
| Self-Employed (Not Incorporated) | 8 | 3.5% |
| Not-for-profit Organizations | 26 | 11.5% |
| Local Government Employees | 27 | 11.9% |
| State Government Employees | 8 | 3.5% |
| Federal Government Employees | 6 | 2.6% |
| Unpaid Family Workers | 0 | 0.0% |
| Total | 226 | 100.0% |
Employment Status by Age in Advance
According to the labor force statistics for Advance, out of the total population over 16 years of age (334), 69.5% or 232 individuals are in the labor force, with 1.3% or 3 of them unemployed. The age group with the highest labor force participation rate is 20 to 24 years, with 100.0% or 18 individuals in the labor force. Within the labor force, the 16 to 19 years age range has the highest percentage of unemployed individuals, with 22.2% or 2 of them being unemployed.
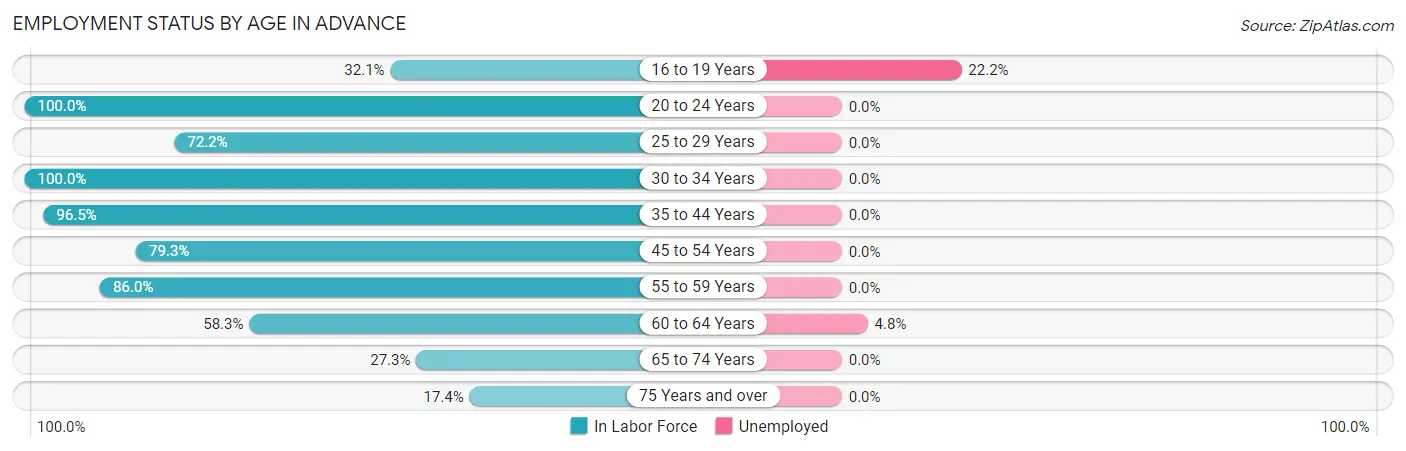
| Age Bracket | In Labor Force | Unemployed |
| 16 to 19 Years | 9 (32.1%) | 2 (22.2%) |
| 20 to 24 Years | 18 (100.0%) | 0 (0.0%) |
| 25 to 29 Years | 13 (72.2%) | 0 (0.0%) |
| 30 to 34 Years | 20 (100.0%) | 0 (0.0%) |
| 35 to 44 Years | 55 (96.5%) | 0 (0.0%) |
| 45 to 54 Years | 46 (79.3%) | 0 (0.0%) |
| 55 to 59 Years | 37 (86.0%) | 0 (0.0%) |
| 60 to 64 Years | 21 (58.3%) | 1 (4.8%) |
| 65 to 74 Years | 9 (27.3%) | 0 (0.0%) |
| 75 Years and over | 4 (17.4%) | 0 (0.0%) |
| Total | 232 (69.5%) | 3 (1.3%) |
Employment Status by Educational Attainment in Advance
According to labor force statistics for Advance, 82.8% of individuals (192) out of the total population between 25 and 64 years of age (232) are in the labor force, with 0.5% or 1 of them being unemployed. The group with the highest labor force participation rate are those with the educational attainment of bachelor's degree or higher, with 88.0% or 66 individuals in the labor force. Within the labor force, individuals with college / associate degree education have the highest percentage of unemployment, with 1.7% or 1 of them being unemployed.
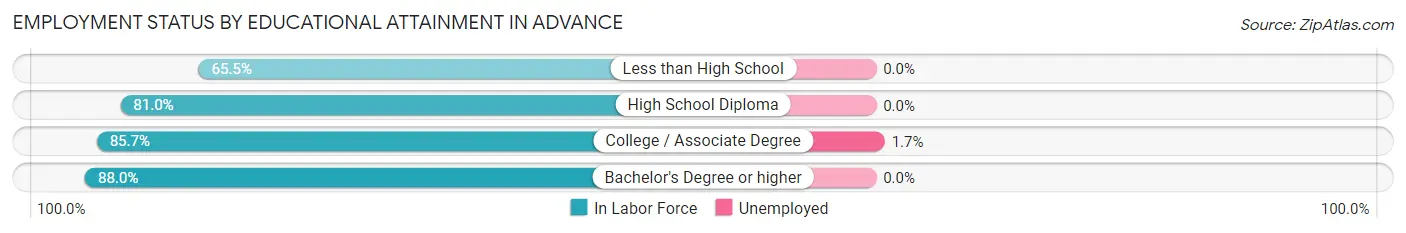
| Educational Attainment | In Labor Force | Unemployed |
| Less than High School | 19 (65.5%) | 0 (0.0%) |
| High School Diploma | 47 (81.0%) | 0 (0.0%) |
| College / Associate Degree | 60 (85.7%) | 1 (1.7%) |
| Bachelor's Degree or higher | 66 (88.0%) | 0 (0.0%) |
| Total | 192 (82.8%) | 1 (0.5%) |
Employment Occupations by Sex in Advance
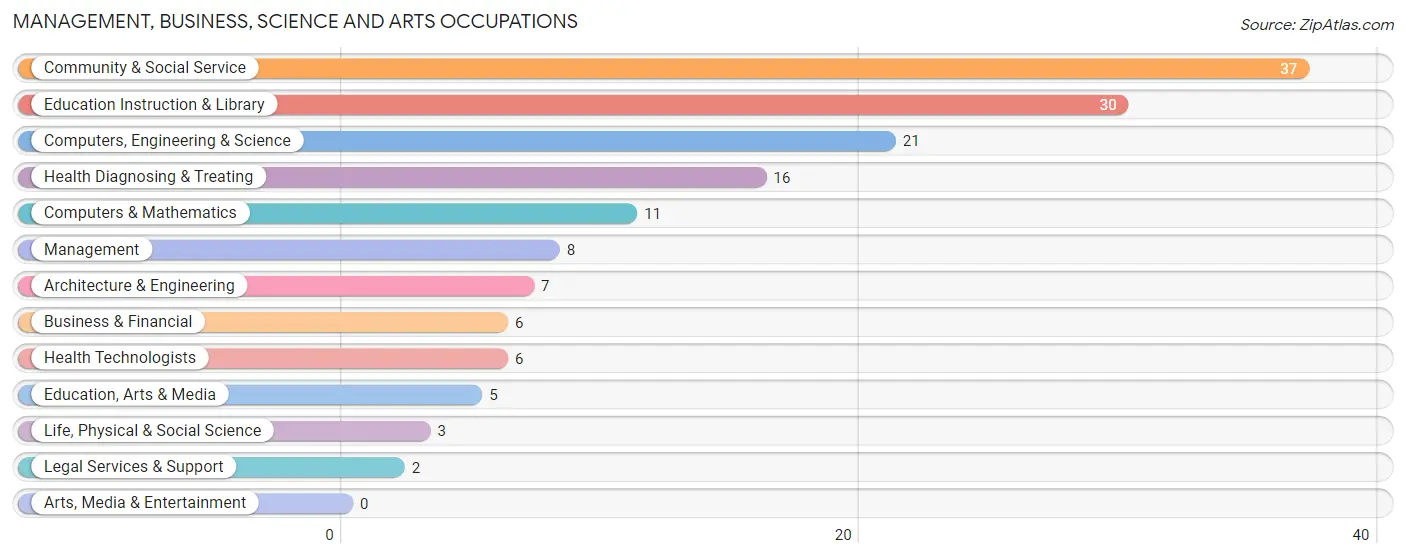
Management, Business, Science and Arts Occupations
The most common Management, Business, Science and Arts occupations in Advance are Community & Social Service (37 | 16.2%), Education Instruction & Library (30 | 13.1%), Computers, Engineering & Science (21 | 9.2%), Health Diagnosing & Treating (16 | 7.0%), and Computers & Mathematics (11 | 4.8%).
Management, Business, Science and Arts Occupations by Sex
Within the Management, Business, Science and Arts occupations in Advance, the most male-oriented occupations are Computers & Mathematics (100.0%), Health Technologists (100.0%), and Computers, Engineering & Science (71.4%), while the most female-oriented occupations are Legal Services & Support (100.0%), Management (87.5%), and Education Instruction & Library (86.7%).
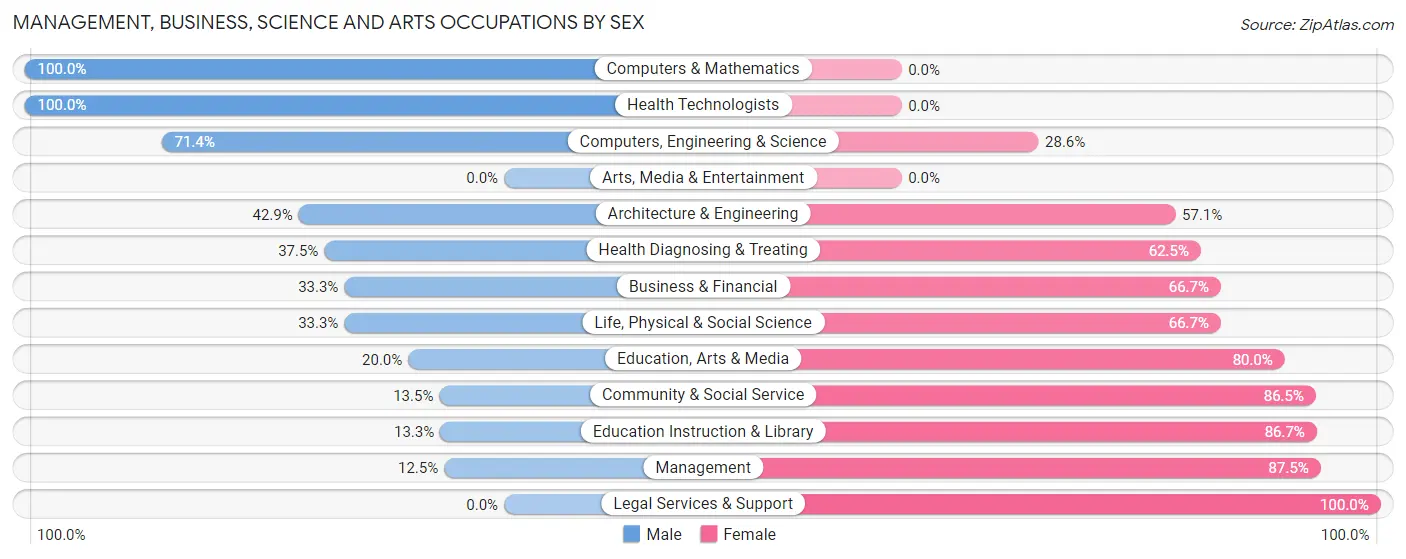
| Occupation | Male | Female |
| Management | 1 (12.5%) | 7 (87.5%) |
| Business & Financial | 2 (33.3%) | 4 (66.7%) |
| Computers, Engineering & Science | 15 (71.4%) | 6 (28.6%) |
| Computers & Mathematics | 11 (100.0%) | 0 (0.0%) |
| Architecture & Engineering | 3 (42.9%) | 4 (57.1%) |
| Life, Physical & Social Science | 1 (33.3%) | 2 (66.7%) |
| Community & Social Service | 5 (13.5%) | 32 (86.5%) |
| Education, Arts & Media | 1 (20.0%) | 4 (80.0%) |
| Legal Services & Support | 0 (0.0%) | 2 (100.0%) |
| Education Instruction & Library | 4 (13.3%) | 26 (86.7%) |
| Arts, Media & Entertainment | 0 (0.0%) | 0 (0.0%) |
| Health Diagnosing & Treating | 6 (37.5%) | 10 (62.5%) |
| Health Technologists | 6 (100.0%) | 0 (0.0%) |
| Total (Category) | 29 (33.0%) | 59 (67.0%) |
| Total (Overall) | 98 (42.8%) | 131 (57.2%) |
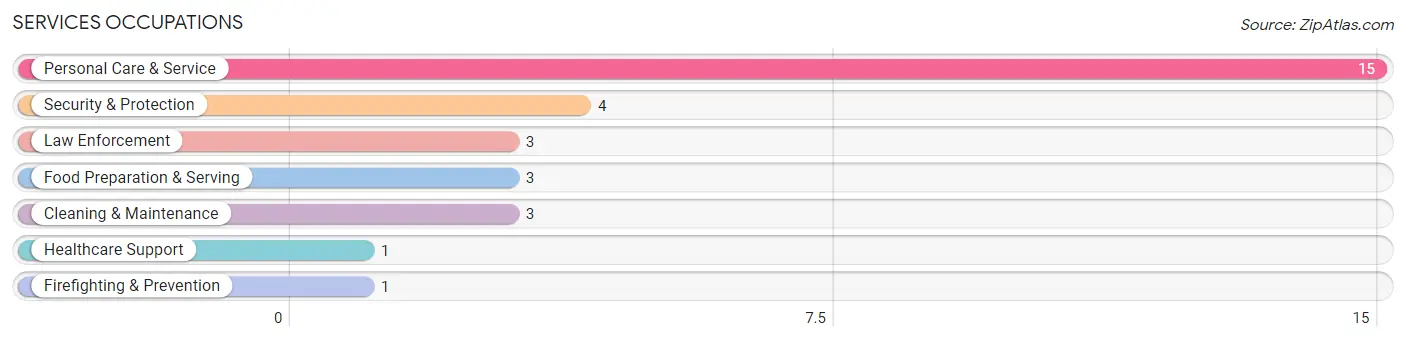
Services Occupations
The most common Services occupations in Advance are Personal Care & Service (15 | 6.6%), Security & Protection (4 | 1.8%), Law Enforcement (3 | 1.3%), Food Preparation & Serving (3 | 1.3%), and Cleaning & Maintenance (3 | 1.3%).
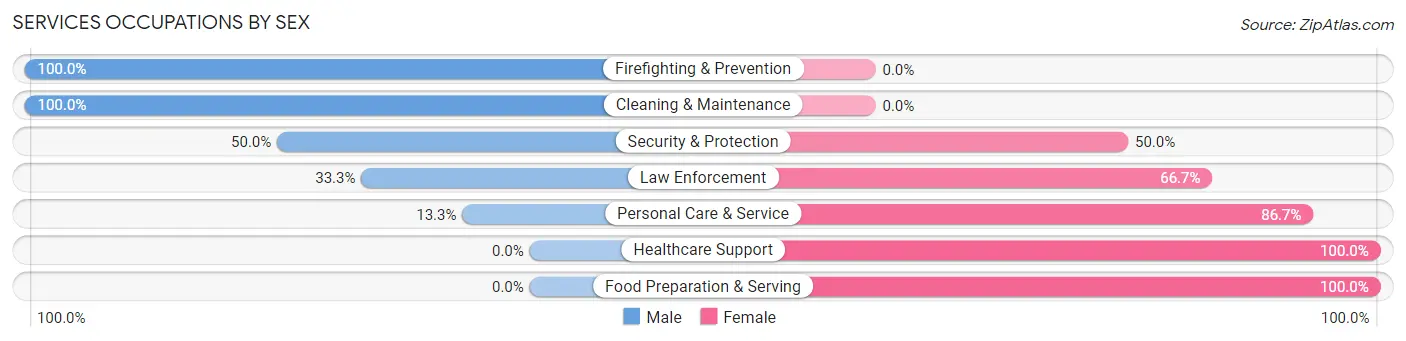
Services Occupations by Sex
Within the Services occupations in Advance, the most male-oriented occupations are Firefighting & Prevention (100.0%), Cleaning & Maintenance (100.0%), and Security & Protection (50.0%), while the most female-oriented occupations are Healthcare Support (100.0%), Food Preparation & Serving (100.0%), and Personal Care & Service (86.7%).
| Occupation | Male | Female |
| Healthcare Support | 0 (0.0%) | 1 (100.0%) |
| Security & Protection | 2 (50.0%) | 2 (50.0%) |
| Firefighting & Prevention | 1 (100.0%) | 0 (0.0%) |
| Law Enforcement | 1 (33.3%) | 2 (66.7%) |
| Food Preparation & Serving | 0 (0.0%) | 3 (100.0%) |
| Cleaning & Maintenance | 3 (100.0%) | 0 (0.0%) |
| Personal Care & Service | 2 (13.3%) | 13 (86.7%) |
| Total (Category) | 7 (26.9%) | 19 (73.1%) |
| Total (Overall) | 98 (42.8%) | 131 (57.2%) |
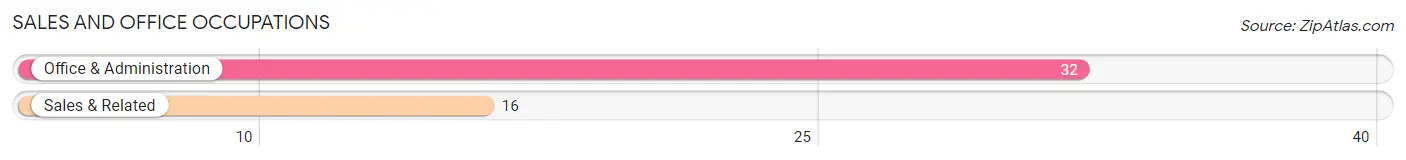
Sales and Office Occupations
The most common Sales and Office occupations in Advance are Office & Administration (32 | 14.0%), and Sales & Related (16 | 7.0%).
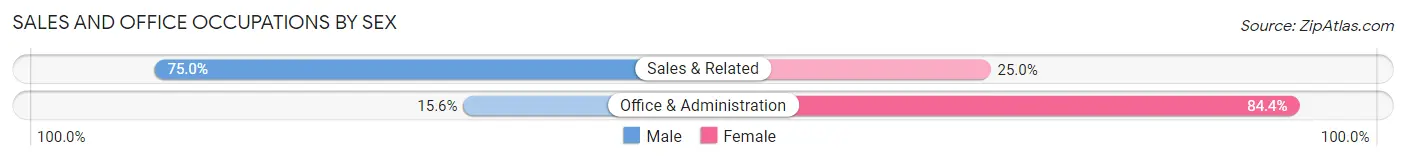
Sales and Office Occupations by Sex
| Occupation | Male | Female |
| Sales & Related | 12 (75.0%) | 4 (25.0%) |
| Office & Administration | 5 (15.6%) | 27 (84.4%) |
| Total (Category) | 17 (35.4%) | 31 (64.6%) |
| Total (Overall) | 98 (42.8%) | 131 (57.2%) |
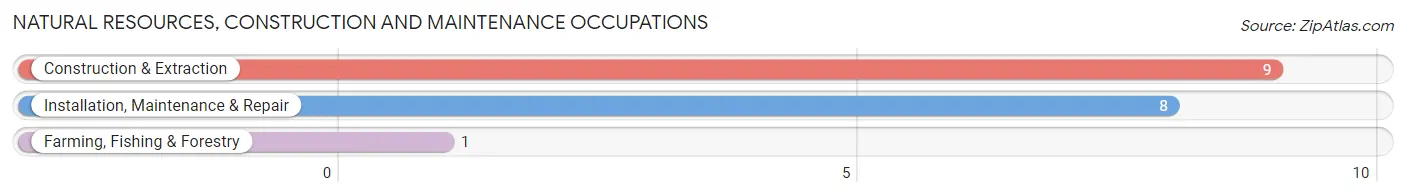
Natural Resources, Construction and Maintenance Occupations
The most common Natural Resources, Construction and Maintenance occupations in Advance are Construction & Extraction (9 | 3.9%), Installation, Maintenance & Repair (8 | 3.5%), and Farming, Fishing & Forestry (1 | 0.4%).
Natural Resources, Construction and Maintenance Occupations by Sex
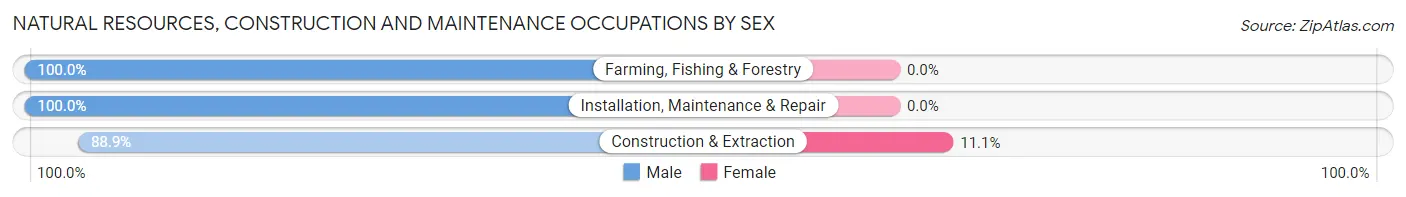
| Occupation | Male | Female |
| Farming, Fishing & Forestry | 1 (100.0%) | 0 (0.0%) |
| Construction & Extraction | 8 (88.9%) | 1 (11.1%) |
| Installation, Maintenance & Repair | 8 (100.0%) | 0 (0.0%) |
| Total (Category) | 17 (94.4%) | 1 (5.6%) |
| Total (Overall) | 98 (42.8%) | 131 (57.2%) |
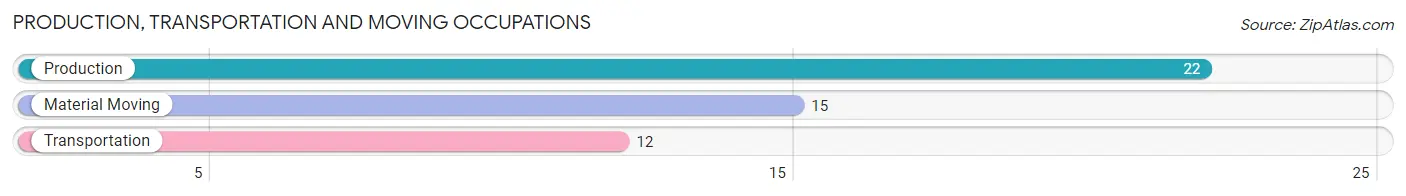
Production, Transportation and Moving Occupations
The most common Production, Transportation and Moving occupations in Advance are Production (22 | 9.6%), Material Moving (15 | 6.6%), and Transportation (12 | 5.2%).
Production, Transportation and Moving Occupations by Sex
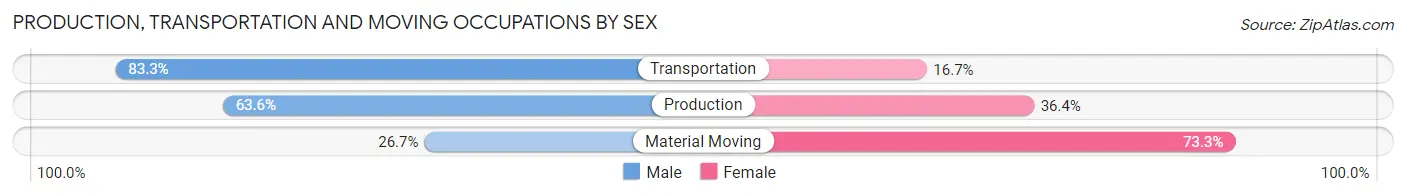
| Occupation | Male | Female |
| Production | 14 (63.6%) | 8 (36.4%) |
| Transportation | 10 (83.3%) | 2 (16.7%) |
| Material Moving | 4 (26.7%) | 11 (73.3%) |
| Total (Category) | 28 (57.1%) | 21 (42.9%) |
| Total (Overall) | 98 (42.8%) | 131 (57.2%) |
Employment Industries by Sex in Advance
Employment Industries in Advance
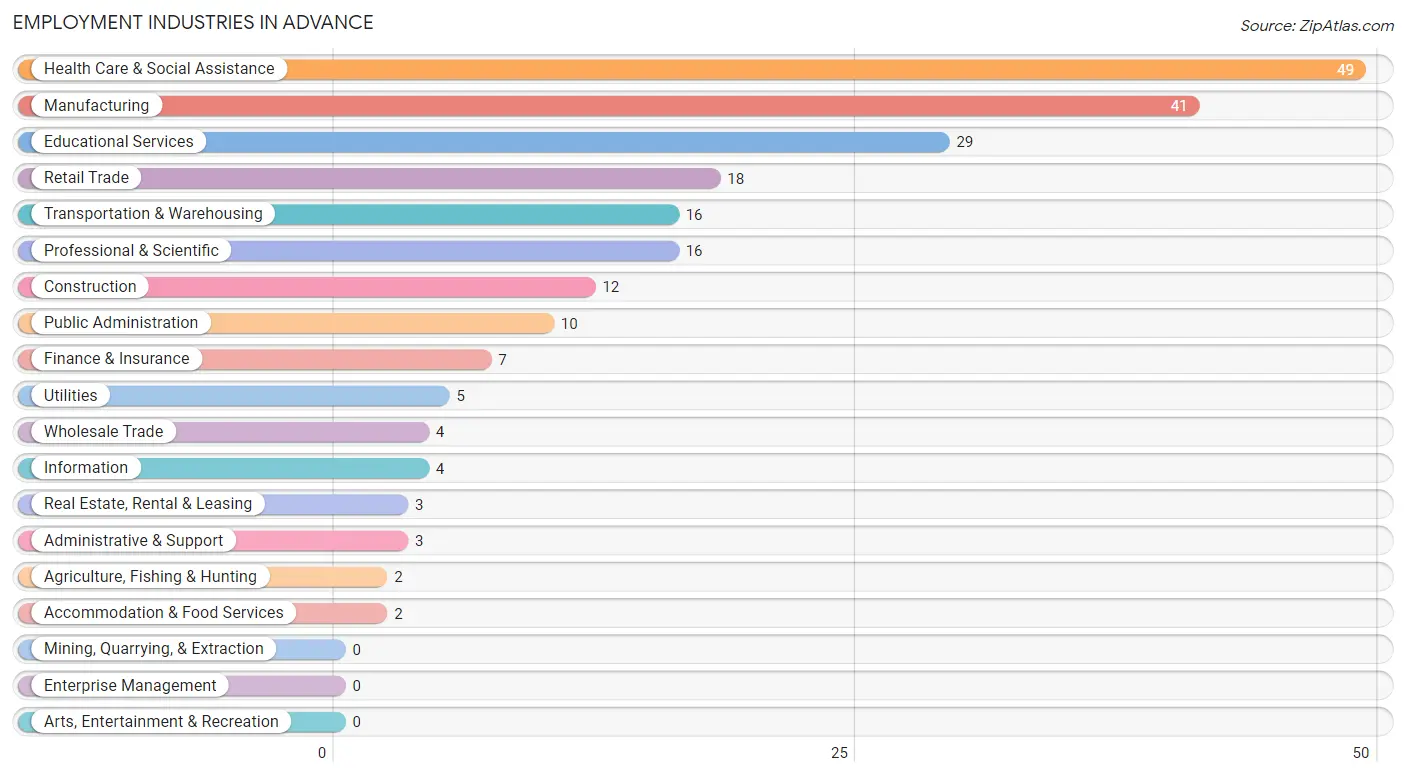
The major employment industries in Advance include Health Care & Social Assistance (49 | 21.4%), Manufacturing (41 | 17.9%), Educational Services (29 | 12.7%), Retail Trade (18 | 7.9%), and Transportation & Warehousing (16 | 7.0%).
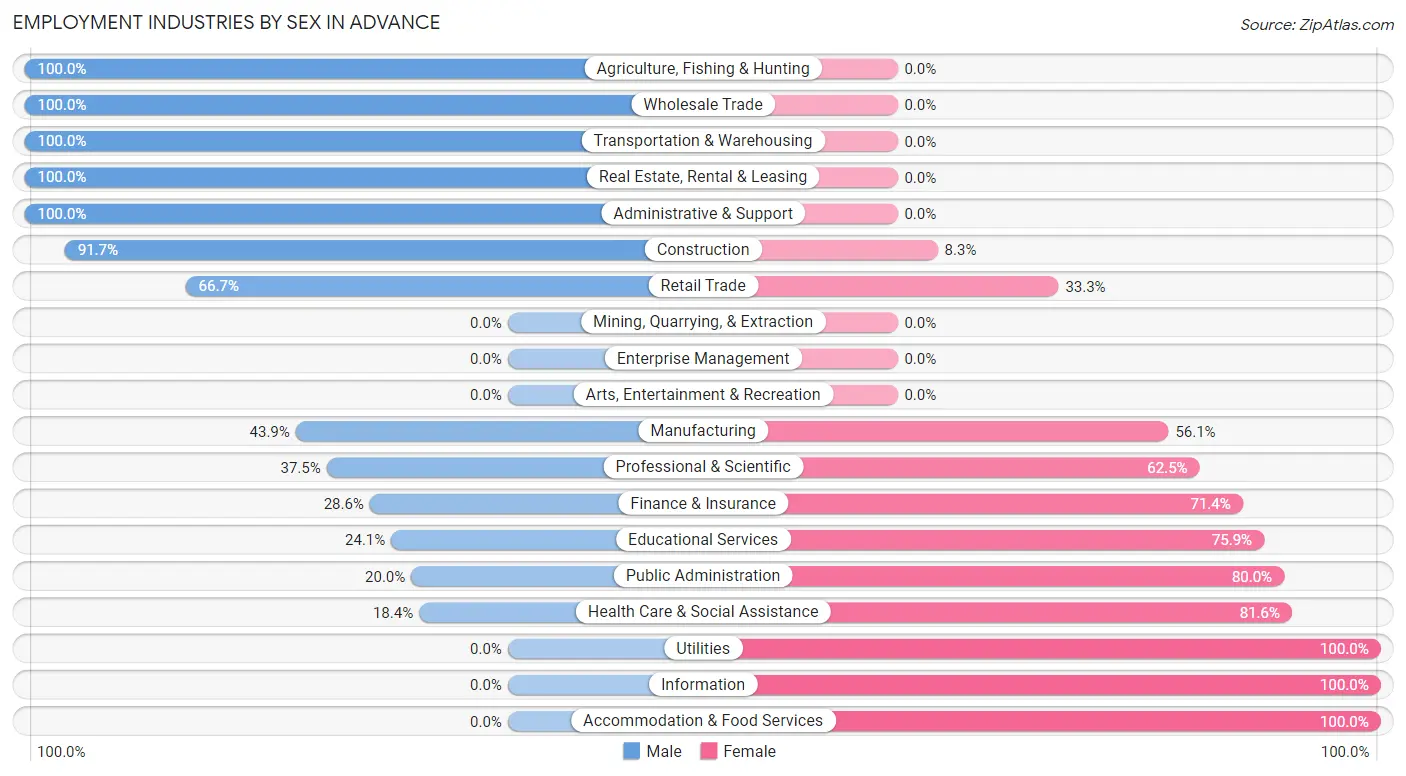
Employment Industries by Sex in Advance
The Advance industries that see more men than women are Agriculture, Fishing & Hunting (100.0%), Wholesale Trade (100.0%), and Transportation & Warehousing (100.0%), whereas the industries that tend to have a higher number of women are Utilities (100.0%), Information (100.0%), and Accommodation & Food Services (100.0%).
| Industry | Male | Female |
| Agriculture, Fishing & Hunting | 2 (100.0%) | 0 (0.0%) |
| Mining, Quarrying, & Extraction | 0 (0.0%) | 0 (0.0%) |
| Construction | 11 (91.7%) | 1 (8.3%) |
| Manufacturing | 18 (43.9%) | 23 (56.1%) |
| Wholesale Trade | 4 (100.0%) | 0 (0.0%) |
| Retail Trade | 12 (66.7%) | 6 (33.3%) |
| Transportation & Warehousing | 16 (100.0%) | 0 (0.0%) |
| Utilities | 0 (0.0%) | 5 (100.0%) |
| Information | 0 (0.0%) | 4 (100.0%) |
| Finance & Insurance | 2 (28.6%) | 5 (71.4%) |
| Real Estate, Rental & Leasing | 3 (100.0%) | 0 (0.0%) |
| Professional & Scientific | 6 (37.5%) | 10 (62.5%) |
| Enterprise Management | 0 (0.0%) | 0 (0.0%) |
| Administrative & Support | 3 (100.0%) | 0 (0.0%) |
| Educational Services | 7 (24.1%) | 22 (75.9%) |
| Health Care & Social Assistance | 9 (18.4%) | 40 (81.6%) |
| Arts, Entertainment & Recreation | 0 (0.0%) | 0 (0.0%) |
| Accommodation & Food Services | 0 (0.0%) | 2 (100.0%) |
| Public Administration | 2 (20.0%) | 8 (80.0%) |
| Total | 98 (42.8%) | 131 (57.2%) |
Education in Advance
School Enrollment in Advance
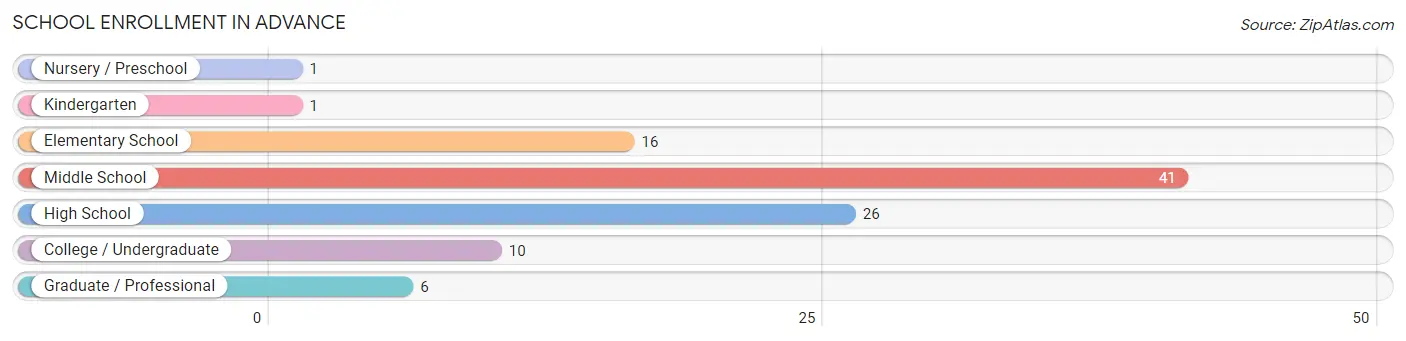
The most common levels of schooling among the 101 students in Advance are middle school (41 | 40.6%), high school (26 | 25.7%), and elementary school (16 | 15.8%).
| School Level | # Students | % Students |
| Nursery / Preschool | 1 | 1.0% |
| Kindergarten | 1 | 1.0% |
| Elementary School | 16 | 15.8% |
| Middle School | 41 | 40.6% |
| High School | 26 | 25.7% |
| College / Undergraduate | 10 | 9.9% |
| Graduate / Professional | 6 | 5.9% |
| Total | 101 | 100.0% |
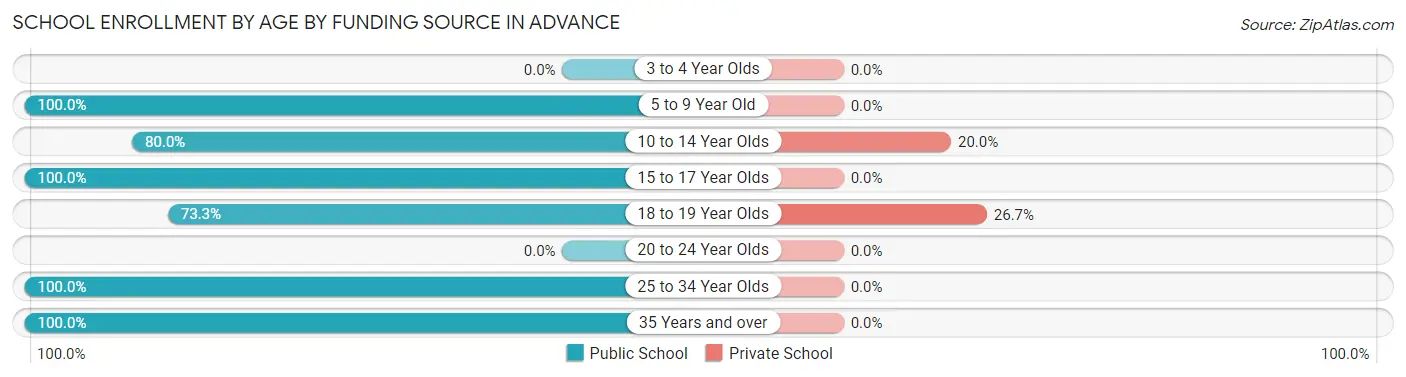
School Enrollment by Age by Funding Source in Advance
Out of a total of 101 students who are enrolled in schools in Advance, 13 (12.9%) attend a private institution, while the remaining 88 (87.1%) are enrolled in public schools. The age group of 18 to 19 year olds has the highest likelihood of being enrolled in private schools, with 4 (26.7% in the age bracket) enrolled. Conversely, the age group of 5 to 9 year old has the lowest likelihood of being enrolled in a private school, with 14 (100.0% in the age bracket) attending a public institution.
| Age Bracket | Public School | Private School |
| 3 to 4 Year Olds | 0 (0.0%) | 0 (0.0%) |
| 5 to 9 Year Old | 14 (100.0%) | 0 (0.0%) |
| 10 to 14 Year Olds | 36 (80.0%) | 9 (20.0%) |
| 15 to 17 Year Olds | 17 (100.0%) | 0 (0.0%) |
| 18 to 19 Year Olds | 11 (73.3%) | 4 (26.7%) |
| 20 to 24 Year Olds | 0 (0.0%) | 0 (0.0%) |
| 25 to 34 Year Olds | 9 (100.0%) | 0 (0.0%) |
| 35 Years and over | 1 (100.0%) | 0 (0.0%) |
| Total | 88 (87.1%) | 13 (12.9%) |
Educational Attainment by Field of Study in Advance
Business (17 | 20.5%), education (15 | 18.1%), liberal arts & history (12 | 14.5%), literature & languages (11 | 13.3%), and science & technology (7 | 8.4%) are the most common fields of study among 83 individuals in Advance who have obtained a bachelor's degree or higher.
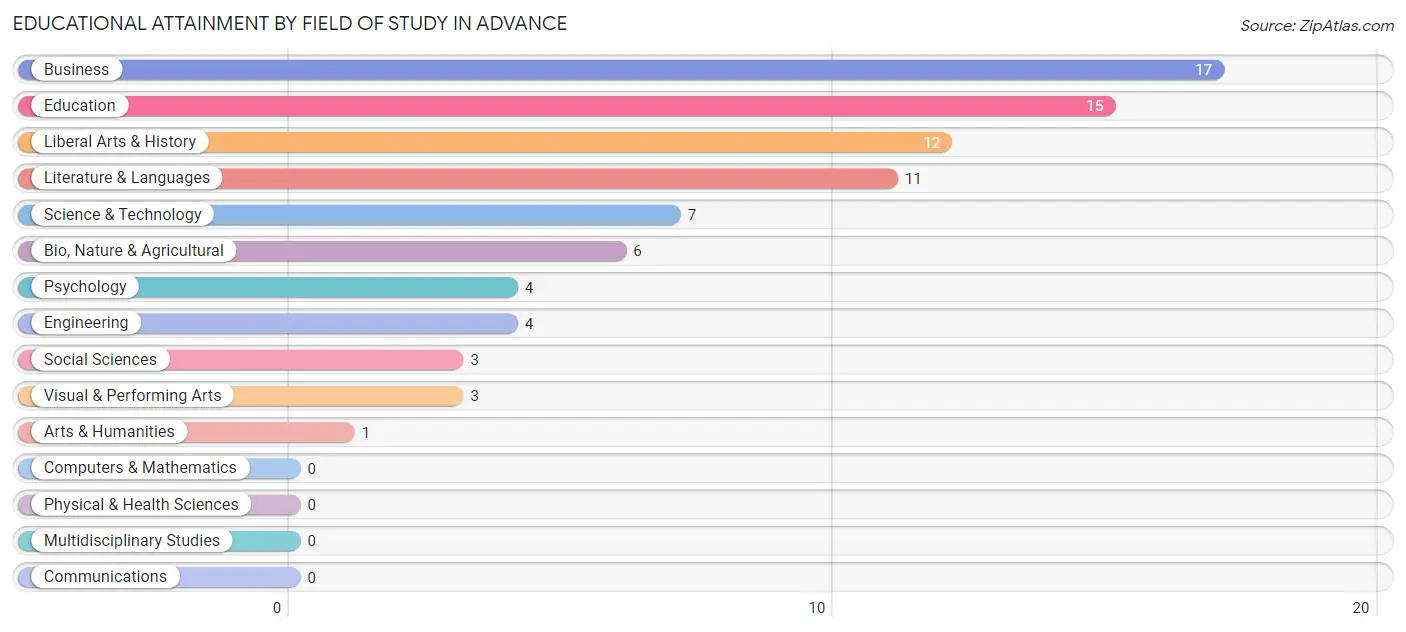
| Field of Study | # Graduates | % Graduates |
| Computers & Mathematics | 0 | 0.0% |
| Bio, Nature & Agricultural | 6 | 7.2% |
| Physical & Health Sciences | 0 | 0.0% |
| Psychology | 4 | 4.8% |
| Social Sciences | 3 | 3.6% |
| Engineering | 4 | 4.8% |
| Multidisciplinary Studies | 0 | 0.0% |
| Science & Technology | 7 | 8.4% |
| Business | 17 | 20.5% |
| Education | 15 | 18.1% |
| Literature & Languages | 11 | 13.3% |
| Liberal Arts & History | 12 | 14.5% |
| Visual & Performing Arts | 3 | 3.6% |
| Communications | 0 | 0.0% |
| Arts & Humanities | 1 | 1.2% |
| Total | 83 | 100.0% |
Transportation & Commute in Advance
Vehicle Availability by Sex in Advance
The most prevalent vehicle ownership categories in Advance are males with 2 vehicles (38, accounting for 38.8%) and females with 2 vehicles (42, making up 29.7%).
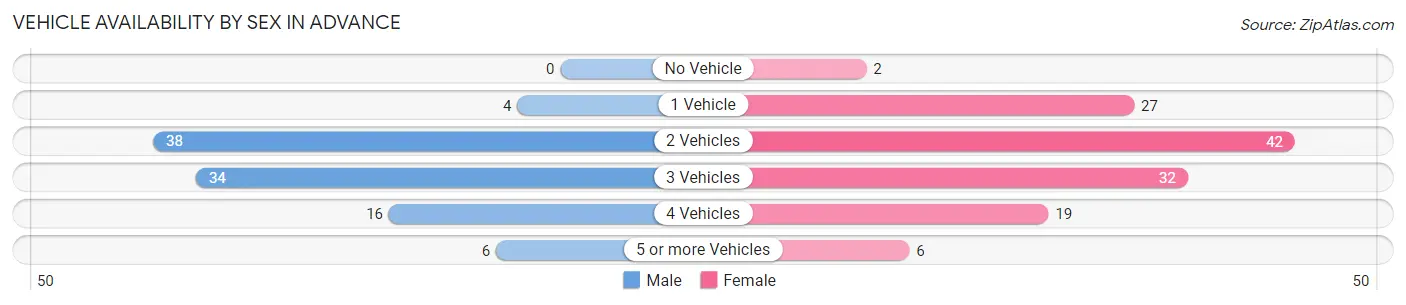
| Vehicles Available | Male | Female |
| No Vehicle | 0 (0.0%) | 2 (1.6%) |
| 1 Vehicle | 4 (4.1%) | 27 (21.1%) |
| 2 Vehicles | 38 (38.8%) | 42 (32.8%) |
| 3 Vehicles | 34 (34.7%) | 32 (25.0%) |
| 4 Vehicles | 16 (16.3%) | 19 (14.8%) |
| 5 or more Vehicles | 6 (6.1%) | 6 (4.7%) |
| Total | 98 (100.0%) | 128 (100.0%) |
Commute Time in Advance
The most frequently occuring commute durations in Advance are 20 to 24 minutes (36 commuters, 16.2%), 25 to 29 minutes (34 commuters, 15.3%), and 15 to 19 minutes (30 commuters, 13.5%).
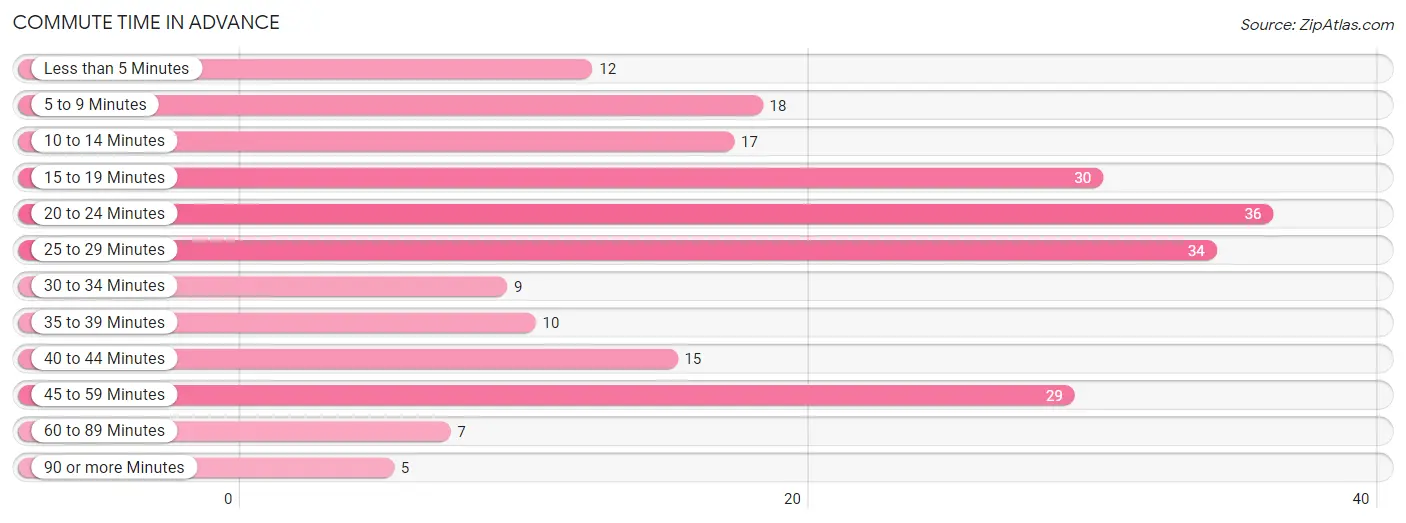
| Commute Time | # Commuters | % Commuters |
| Less than 5 Minutes | 12 | 5.4% |
| 5 to 9 Minutes | 18 | 8.1% |
| 10 to 14 Minutes | 17 | 7.7% |
| 15 to 19 Minutes | 30 | 13.5% |
| 20 to 24 Minutes | 36 | 16.2% |
| 25 to 29 Minutes | 34 | 15.3% |
| 30 to 34 Minutes | 9 | 4.1% |
| 35 to 39 Minutes | 10 | 4.5% |
| 40 to 44 Minutes | 15 | 6.8% |
| 45 to 59 Minutes | 29 | 13.1% |
| 60 to 89 Minutes | 7 | 3.2% |
| 90 or more Minutes | 5 | 2.2% |
Commute Time by Sex in Advance
The most common commute times in Advance are 20 to 24 minutes (18 commuters, 18.4%) for males and 25 to 29 minutes (26 commuters, 21.0%) for females.
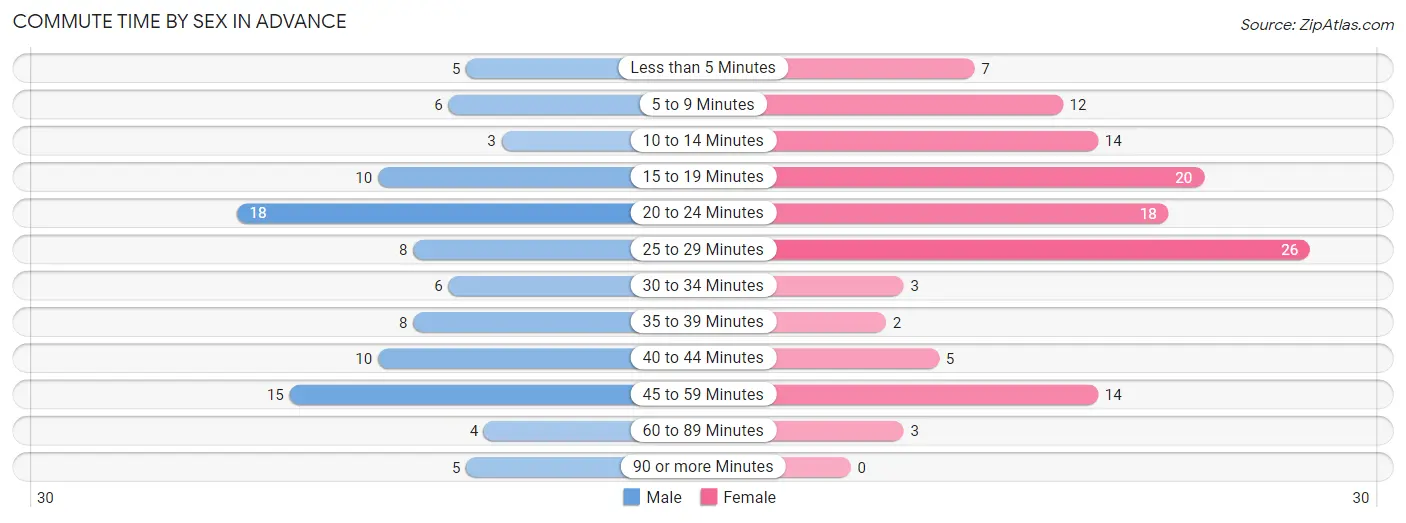
| Commute Time | Male | Female |
| Less than 5 Minutes | 5 (5.1%) | 7 (5.7%) |
| 5 to 9 Minutes | 6 (6.1%) | 12 (9.7%) |
| 10 to 14 Minutes | 3 (3.1%) | 14 (11.3%) |
| 15 to 19 Minutes | 10 (10.2%) | 20 (16.1%) |
| 20 to 24 Minutes | 18 (18.4%) | 18 (14.5%) |
| 25 to 29 Minutes | 8 (8.2%) | 26 (21.0%) |
| 30 to 34 Minutes | 6 (6.1%) | 3 (2.4%) |
| 35 to 39 Minutes | 8 (8.2%) | 2 (1.6%) |
| 40 to 44 Minutes | 10 (10.2%) | 5 (4.0%) |
| 45 to 59 Minutes | 15 (15.3%) | 14 (11.3%) |
| 60 to 89 Minutes | 4 (4.1%) | 3 (2.4%) |
| 90 or more Minutes | 5 (5.1%) | 0 (0.0%) |
Time of Departure to Work by Sex in Advance
The most frequent times of departure to work in Advance are 7:00 AM to 7:29 AM (15, 15.3%) for males and 7:30 AM to 7:59 AM (41, 33.1%) for females.
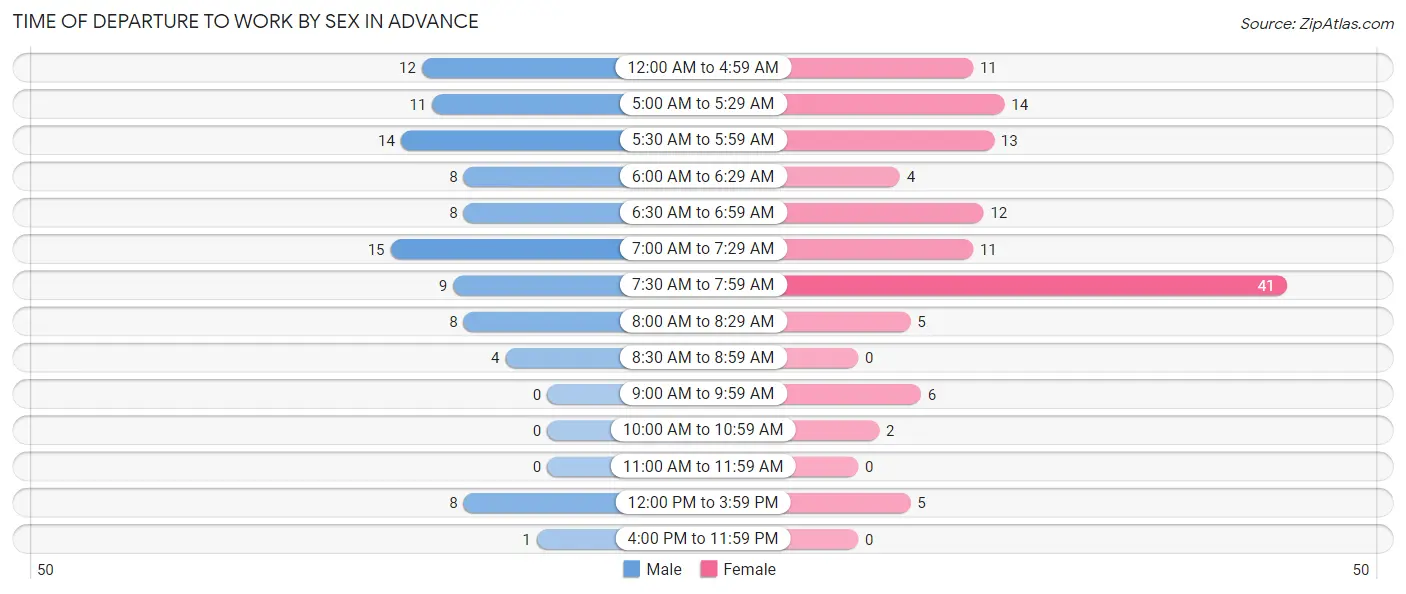
| Time of Departure | Male | Female |
| 12:00 AM to 4:59 AM | 12 (12.2%) | 11 (8.9%) |
| 5:00 AM to 5:29 AM | 11 (11.2%) | 14 (11.3%) |
| 5:30 AM to 5:59 AM | 14 (14.3%) | 13 (10.5%) |
| 6:00 AM to 6:29 AM | 8 (8.2%) | 4 (3.2%) |
| 6:30 AM to 6:59 AM | 8 (8.2%) | 12 (9.7%) |
| 7:00 AM to 7:29 AM | 15 (15.3%) | 11 (8.9%) |
| 7:30 AM to 7:59 AM | 9 (9.2%) | 41 (33.1%) |
| 8:00 AM to 8:29 AM | 8 (8.2%) | 5 (4.0%) |
| 8:30 AM to 8:59 AM | 4 (4.1%) | 0 (0.0%) |
| 9:00 AM to 9:59 AM | 0 (0.0%) | 6 (4.8%) |
| 10:00 AM to 10:59 AM | 0 (0.0%) | 2 (1.6%) |
| 11:00 AM to 11:59 AM | 0 (0.0%) | 0 (0.0%) |
| 12:00 PM to 3:59 PM | 8 (8.2%) | 5 (4.0%) |
| 4:00 PM to 11:59 PM | 1 (1.0%) | 0 (0.0%) |
| Total | 98 (100.0%) | 124 (100.0%) |
Housing Occupancy in Advance
Occupancy by Ownership in Advance
Of the total 169 dwellings in Advance, owner-occupied units account for 135 (79.9%), while renter-occupied units make up 34 (20.1%).
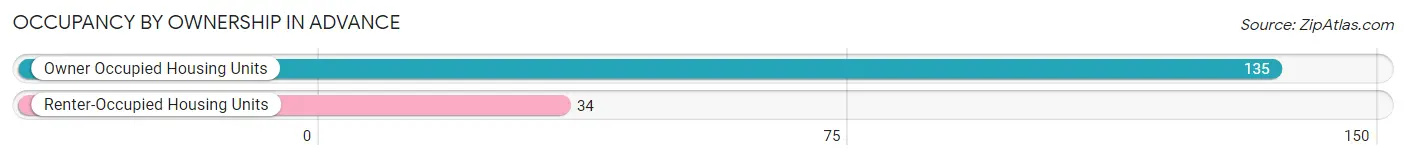
| Occupancy | # Housing Units | % Housing Units |
| Owner Occupied Housing Units | 135 | 79.9% |
| Renter-Occupied Housing Units | 34 | 20.1% |
| Total Occupied Housing Units | 169 | 100.0% |
Occupancy by Household Size in Advance
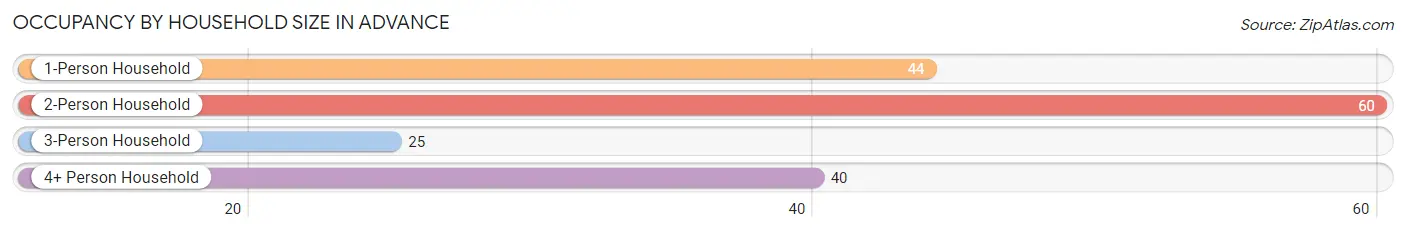
| Household Size | # Housing Units | % Housing Units |
| 1-Person Household | 44 | 26.0% |
| 2-Person Household | 60 | 35.5% |
| 3-Person Household | 25 | 14.8% |
| 4+ Person Household | 40 | 23.7% |
| Total Housing Units | 169 | 100.0% |
Occupancy by Ownership by Household Size in Advance
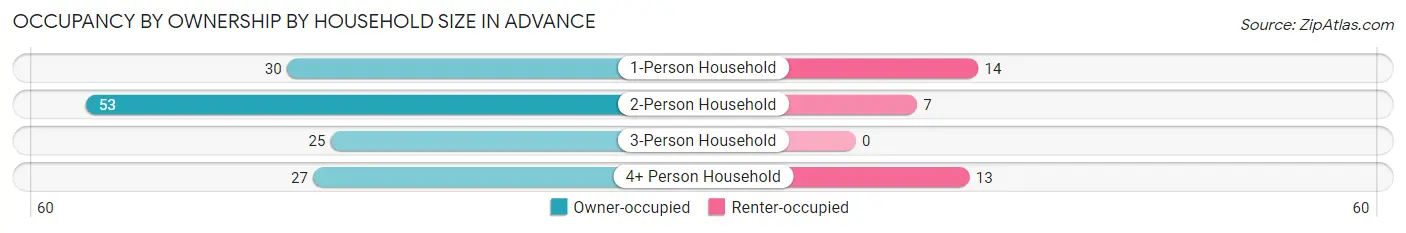
| Household Size | Owner-occupied | Renter-occupied |
| 1-Person Household | 30 (68.2%) | 14 (31.8%) |
| 2-Person Household | 53 (88.3%) | 7 (11.7%) |
| 3-Person Household | 25 (100.0%) | 0 (0.0%) |
| 4+ Person Household | 27 (67.5%) | 13 (32.5%) |
| Total Housing Units | 135 (79.9%) | 34 (20.1%) |
Occupancy by Educational Attainment in Advance
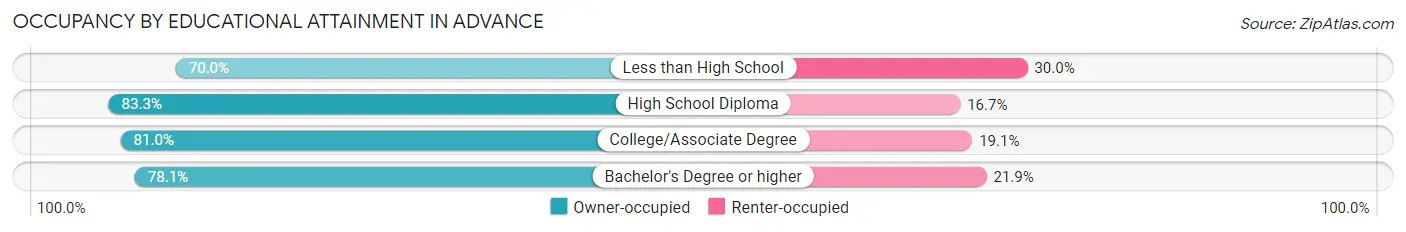
| Household Size | Owner-occupied | Renter-occupied |
| Less than High School | 14 (70.0%) | 6 (30.0%) |
| High School Diploma | 45 (83.3%) | 9 (16.7%) |
| College/Associate Degree | 51 (80.9%) | 12 (19.1%) |
| Bachelor's Degree or higher | 25 (78.1%) | 7 (21.9%) |
Occupancy by Age of Householder in Advance
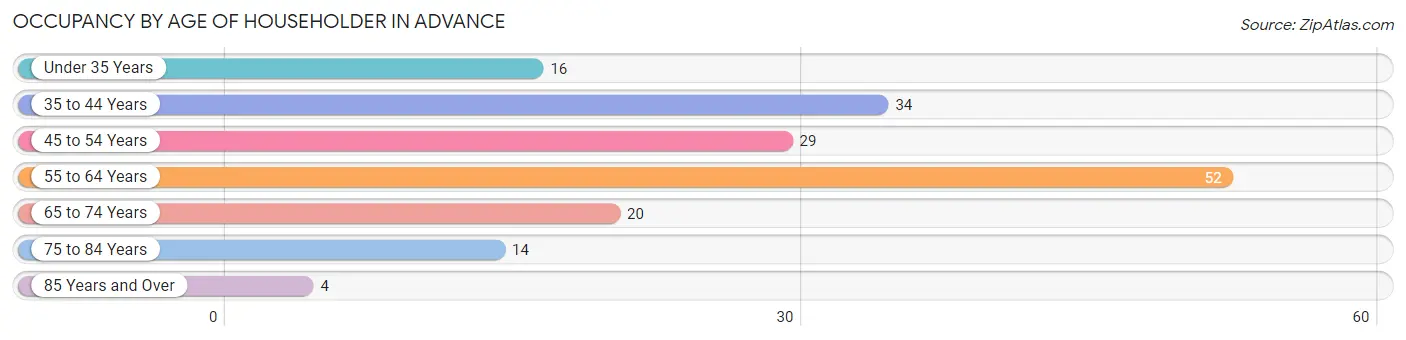
| Age Bracket | # Households | % Households |
| Under 35 Years | 16 | 9.5% |
| 35 to 44 Years | 34 | 20.1% |
| 45 to 54 Years | 29 | 17.2% |
| 55 to 64 Years | 52 | 30.8% |
| 65 to 74 Years | 20 | 11.8% |
| 75 to 84 Years | 14 | 8.3% |
| 85 Years and Over | 4 | 2.4% |
| Total | 169 | 100.0% |
Housing Finances in Advance
Median Income by Occupancy in Advance
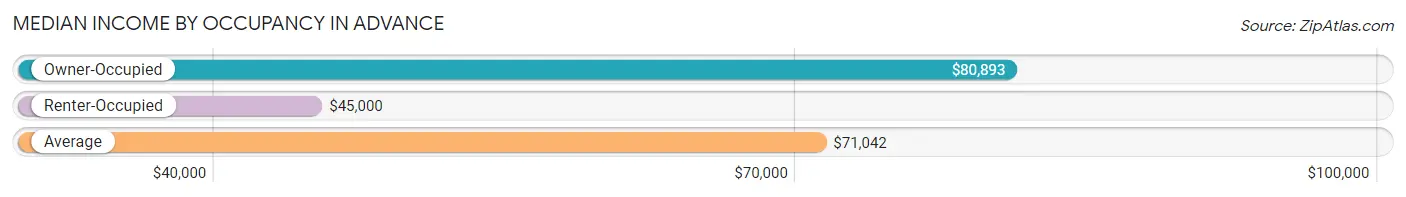
| Occupancy Type | # Households | Median Income |
| Owner-Occupied | 135 (79.9%) | $80,893 |
| Renter-Occupied | 34 (20.1%) | $45,000 |
| Average | 169 (100.0%) | $71,042 |
Occupancy by Householder Income Bracket in Advance
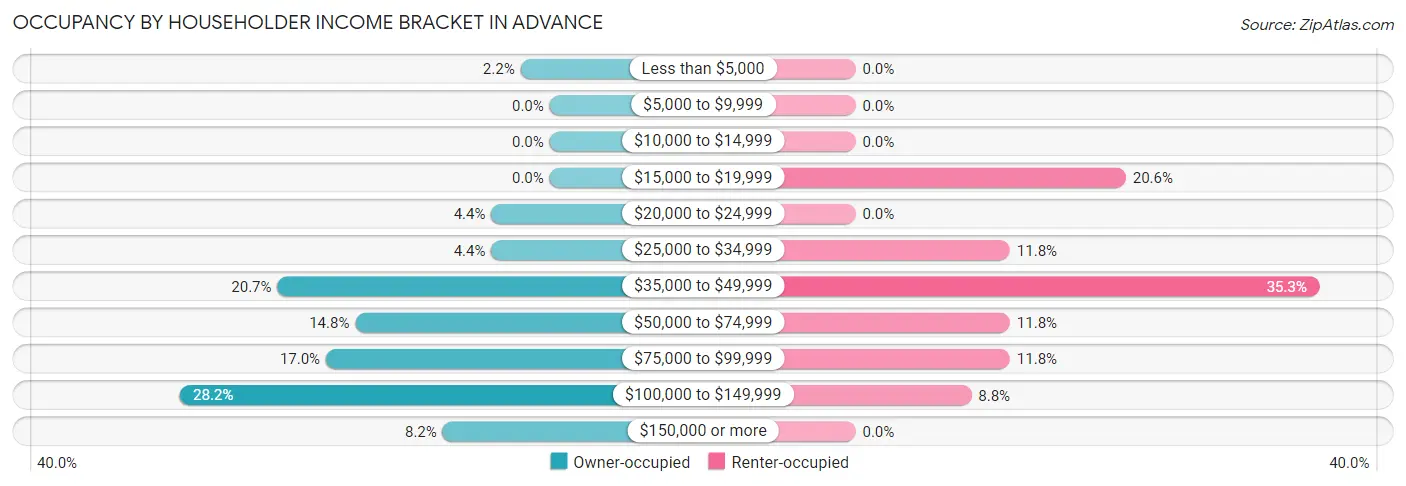
| Income Bracket | Owner-occupied | Renter-occupied |
| Less than $5,000 | 3 (2.2%) | 0 (0.0%) |
| $5,000 to $9,999 | 0 (0.0%) | 0 (0.0%) |
| $10,000 to $14,999 | 0 (0.0%) | 0 (0.0%) |
| $15,000 to $19,999 | 0 (0.0%) | 7 (20.6%) |
| $20,000 to $24,999 | 6 (4.4%) | 0 (0.0%) |
| $25,000 to $34,999 | 6 (4.4%) | 4 (11.8%) |
| $35,000 to $49,999 | 28 (20.7%) | 12 (35.3%) |
| $50,000 to $74,999 | 20 (14.8%) | 4 (11.8%) |
| $75,000 to $99,999 | 23 (17.0%) | 4 (11.8%) |
| $100,000 to $149,999 | 38 (28.1%) | 3 (8.8%) |
| $150,000 or more | 11 (8.2%) | 0 (0.0%) |
| Total | 135 (100.0%) | 34 (100.0%) |
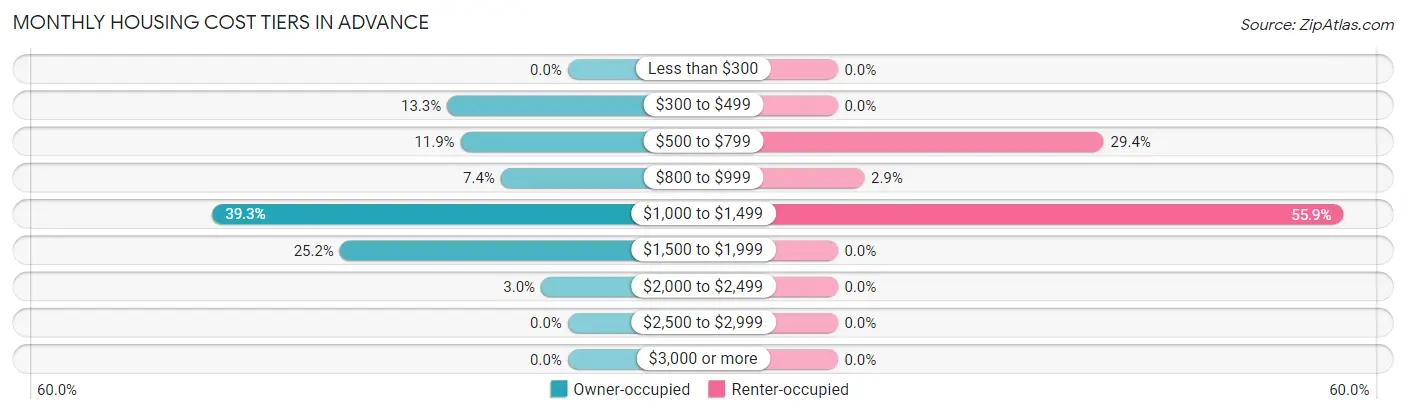
Monthly Housing Cost Tiers in Advance
| Monthly Cost | Owner-occupied | Renter-occupied |
| Less than $300 | 0 (0.0%) | 0 (0.0%) |
| $300 to $499 | 18 (13.3%) | 0 (0.0%) |
| $500 to $799 | 16 (11.8%) | 10 (29.4%) |
| $800 to $999 | 10 (7.4%) | 1 (2.9%) |
| $1,000 to $1,499 | 53 (39.3%) | 19 (55.9%) |
| $1,500 to $1,999 | 34 (25.2%) | 0 (0.0%) |
| $2,000 to $2,499 | 4 (3.0%) | 0 (0.0%) |
| $2,500 to $2,999 | 0 (0.0%) | 0 (0.0%) |
| $3,000 or more | 0 (0.0%) | 0 (0.0%) |
| Total | 135 (100.0%) | 34 (100.0%) |
Physical Housing Characteristics in Advance
Housing Structures in Advance
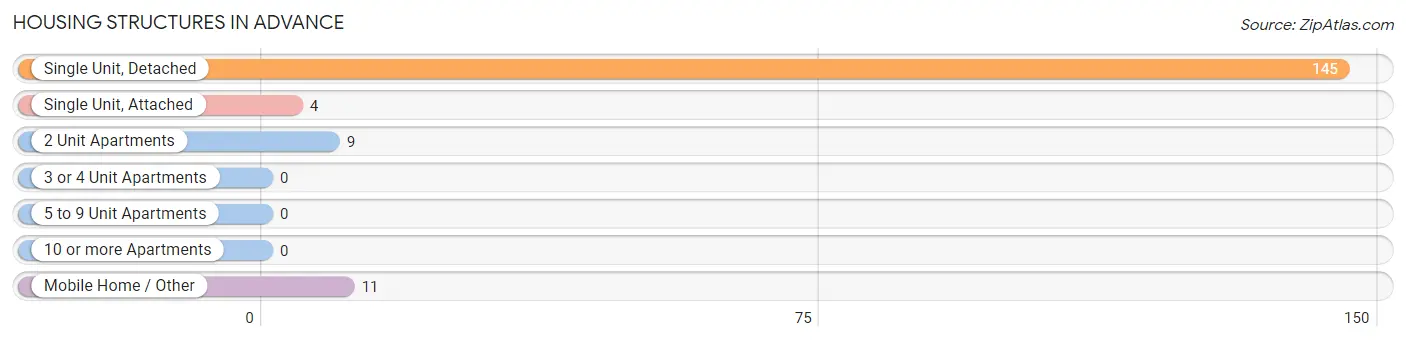
| Structure Type | # Housing Units | % Housing Units |
| Single Unit, Detached | 145 | 85.8% |
| Single Unit, Attached | 4 | 2.4% |
| 2 Unit Apartments | 9 | 5.3% |
| 3 or 4 Unit Apartments | 0 | 0.0% |
| 5 to 9 Unit Apartments | 0 | 0.0% |
| 10 or more Apartments | 0 | 0.0% |
| Mobile Home / Other | 11 | 6.5% |
| Total | 169 | 100.0% |
Housing Structures by Occupancy in Advance
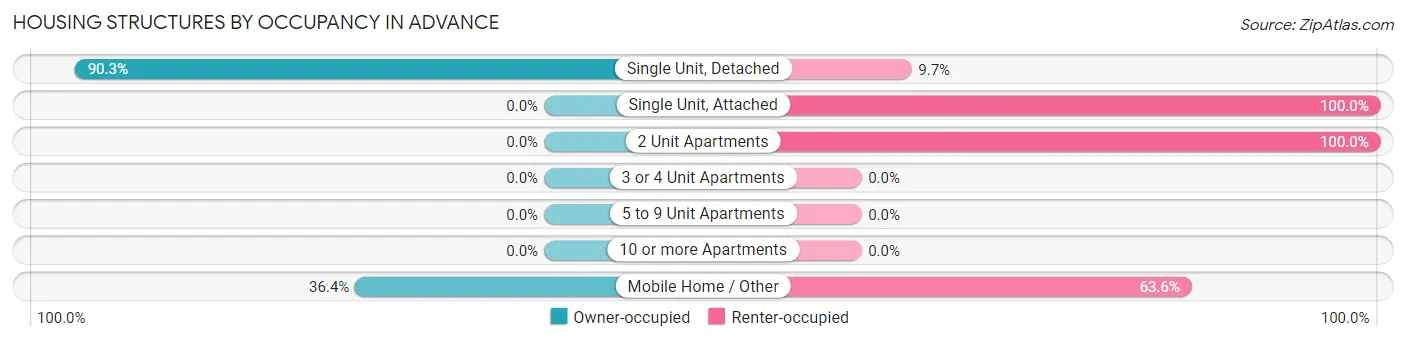
| Structure Type | Owner-occupied | Renter-occupied |
| Single Unit, Detached | 131 (90.3%) | 14 (9.7%) |
| Single Unit, Attached | 0 (0.0%) | 4 (100.0%) |
| 2 Unit Apartments | 0 (0.0%) | 9 (100.0%) |
| 3 or 4 Unit Apartments | 0 (0.0%) | 0 (0.0%) |
| 5 to 9 Unit Apartments | 0 (0.0%) | 0 (0.0%) |
| 10 or more Apartments | 0 (0.0%) | 0 (0.0%) |
| Mobile Home / Other | 4 (36.4%) | 7 (63.6%) |
| Total | 135 (79.9%) | 34 (20.1%) |
Housing Structures by Number of Rooms in Advance
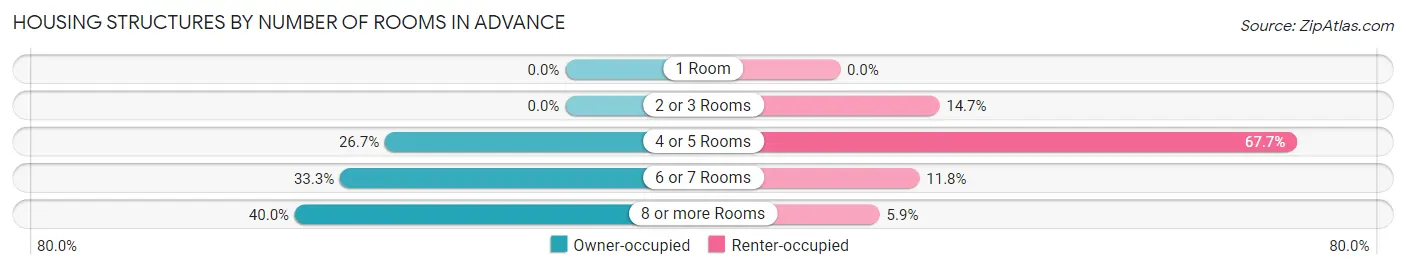
| Number of Rooms | Owner-occupied | Renter-occupied |
| 1 Room | 0 (0.0%) | 0 (0.0%) |
| 2 or 3 Rooms | 0 (0.0%) | 5 (14.7%) |
| 4 or 5 Rooms | 36 (26.7%) | 23 (67.6%) |
| 6 or 7 Rooms | 45 (33.3%) | 4 (11.8%) |
| 8 or more Rooms | 54 (40.0%) | 2 (5.9%) |
| Total | 135 (100.0%) | 34 (100.0%) |
Housing Structure by Heating Type in Advance
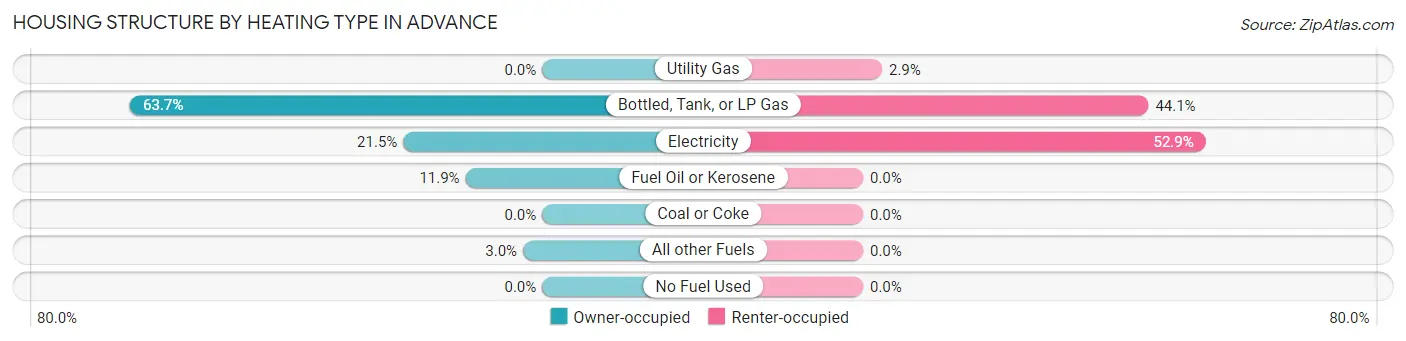
| Heating Type | Owner-occupied | Renter-occupied |
| Utility Gas | 0 (0.0%) | 1 (2.9%) |
| Bottled, Tank, or LP Gas | 86 (63.7%) | 15 (44.1%) |
| Electricity | 29 (21.5%) | 18 (52.9%) |
| Fuel Oil or Kerosene | 16 (11.8%) | 0 (0.0%) |
| Coal or Coke | 0 (0.0%) | 0 (0.0%) |
| All other Fuels | 4 (3.0%) | 0 (0.0%) |
| No Fuel Used | 0 (0.0%) | 0 (0.0%) |
| Total | 135 (100.0%) | 34 (100.0%) |
Household Vehicle Usage in Advance
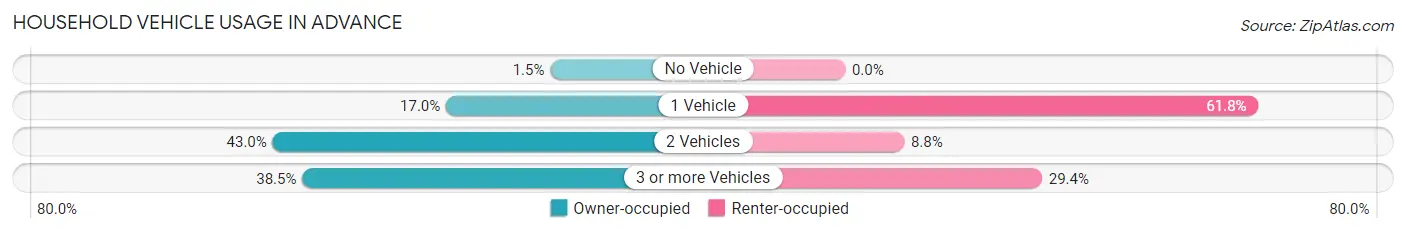
| Vehicles per Household | Owner-occupied | Renter-occupied |
| No Vehicle | 2 (1.5%) | 0 (0.0%) |
| 1 Vehicle | 23 (17.0%) | 21 (61.8%) |
| 2 Vehicles | 58 (43.0%) | 3 (8.8%) |
| 3 or more Vehicles | 52 (38.5%) | 10 (29.4%) |
| Total | 135 (100.0%) | 34 (100.0%) |
Real Estate & Mortgages in Advance
Real Estate and Mortgage Overview in Advance
| Characteristic | Without Mortgage | With Mortgage |
| Housing Units | 41 | 94 |
| Median Property Value | $102,100 | $148,900 |
| Median Household Income | $39,063 | $5 |
| Monthly Housing Costs | $644 | $0 |
| Real Estate Taxes | $582 | $0 |
Property Value by Mortgage Status in Advance
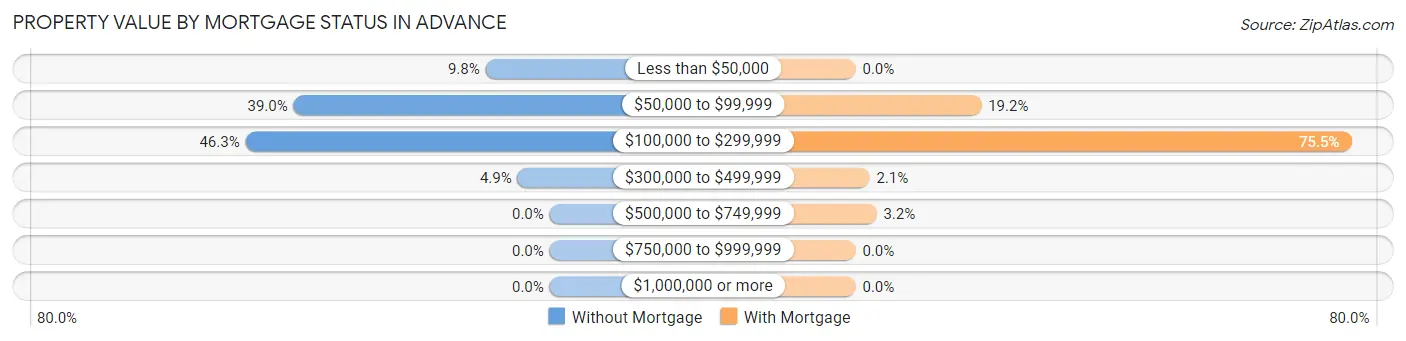
| Property Value | Without Mortgage | With Mortgage |
| Less than $50,000 | 4 (9.8%) | 0 (0.0%) |
| $50,000 to $99,999 | 16 (39.0%) | 18 (19.2%) |
| $100,000 to $299,999 | 19 (46.3%) | 71 (75.5%) |
| $300,000 to $499,999 | 2 (4.9%) | 2 (2.1%) |
| $500,000 to $749,999 | 0 (0.0%) | 3 (3.2%) |
| $750,000 to $999,999 | 0 (0.0%) | 0 (0.0%) |
| $1,000,000 or more | 0 (0.0%) | 0 (0.0%) |
| Total | 41 (100.0%) | 94 (100.0%) |
Household Income by Mortgage Status in Advance
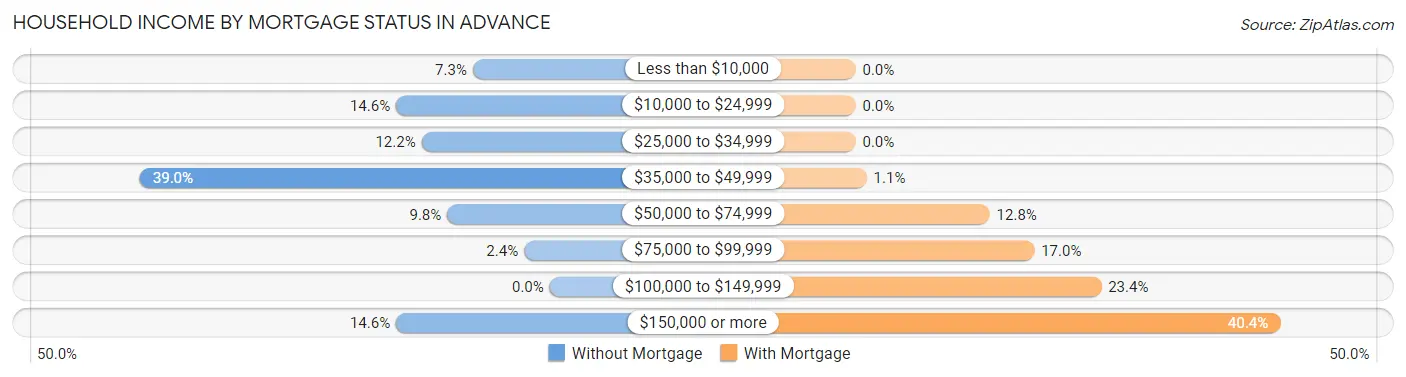
| Household Income | Without Mortgage | With Mortgage |
| Less than $10,000 | 3 (7.3%) | 0 (0.0%) |
| $10,000 to $24,999 | 6 (14.6%) | 0 (0.0%) |
| $25,000 to $34,999 | 5 (12.2%) | 0 (0.0%) |
| $35,000 to $49,999 | 16 (39.0%) | 1 (1.1%) |
| $50,000 to $74,999 | 4 (9.8%) | 12 (12.8%) |
| $75,000 to $99,999 | 1 (2.4%) | 16 (17.0%) |
| $100,000 to $149,999 | 0 (0.0%) | 22 (23.4%) |
| $150,000 or more | 6 (14.6%) | 38 (40.4%) |
| Total | 41 (100.0%) | 94 (100.0%) |
Property Value to Household Income Ratio in Advance
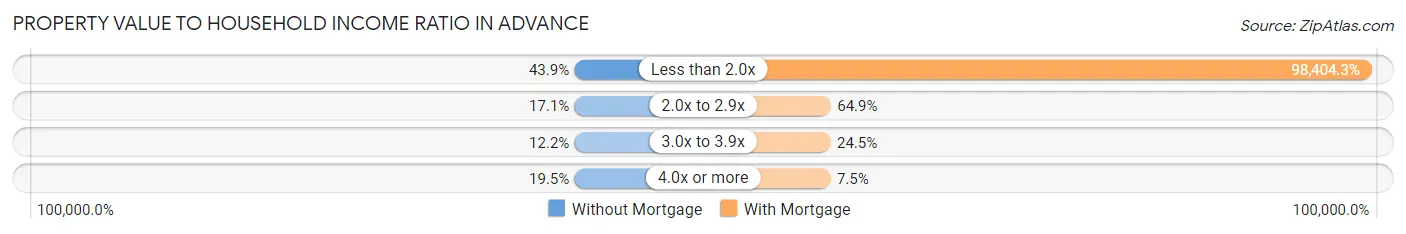
| Value-to-Income Ratio | Without Mortgage | With Mortgage |
| Less than 2.0x | 18 (43.9%) | 92,500 (98,404.3%) |
| 2.0x to 2.9x | 7 (17.1%) | 61 (64.9%) |
| 3.0x to 3.9x | 5 (12.2%) | 23 (24.5%) |
| 4.0x or more | 8 (19.5%) | 7 (7.4%) |
| Total | 41 (100.0%) | 94 (100.0%) |
Real Estate Taxes by Mortgage Status in Advance
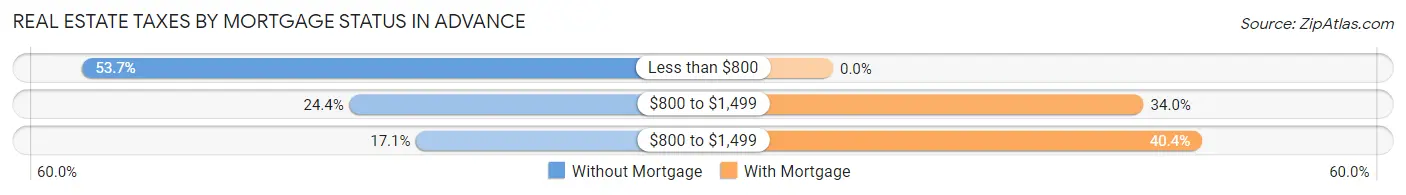
| Property Taxes | Without Mortgage | With Mortgage |
| Less than $800 | 22 (53.7%) | 0 (0.0%) |
| $800 to $1,499 | 10 (24.4%) | 32 (34.0%) |
| $800 to $1,499 | 7 (17.1%) | 38 (40.4%) |
| Total | 41 (100.0%) | 94 (100.0%) |
Health & Disability in Advance
Health Insurance Coverage by Age in Advance
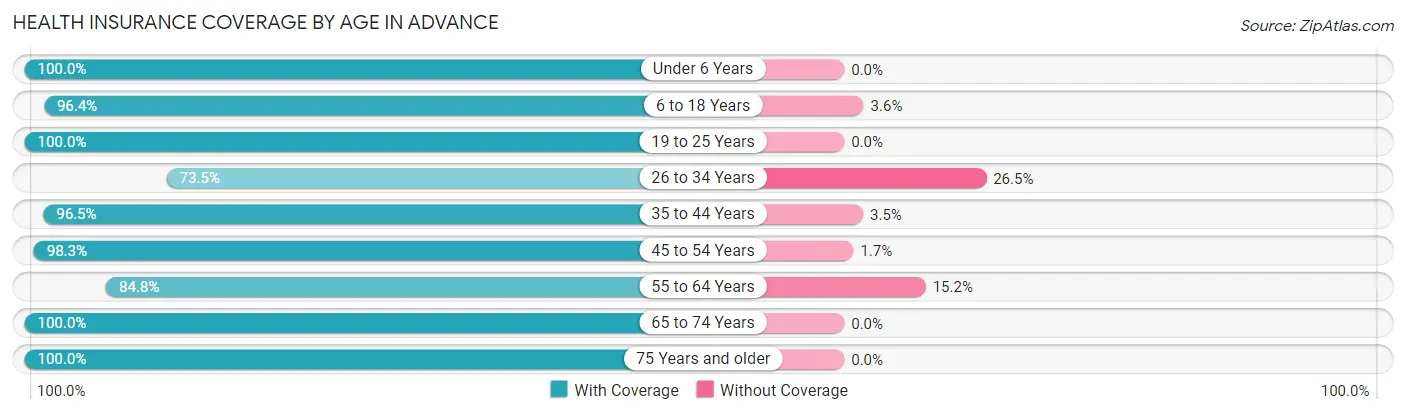
| Age Bracket | With Coverage | Without Coverage |
| Under 6 Years | 11 (100.0%) | 0 (0.0%) |
| 6 to 18 Years | 80 (96.4%) | 3 (3.6%) |
| 19 to 25 Years | 34 (100.0%) | 0 (0.0%) |
| 26 to 34 Years | 25 (73.5%) | 9 (26.5%) |
| 35 to 44 Years | 55 (96.5%) | 2 (3.5%) |
| 45 to 54 Years | 57 (98.3%) | 1 (1.7%) |
| 55 to 64 Years | 67 (84.8%) | 12 (15.2%) |
| 65 to 74 Years | 33 (100.0%) | 0 (0.0%) |
| 75 Years and older | 23 (100.0%) | 0 (0.0%) |
| Total | 385 (93.4%) | 27 (6.6%) |
Health Insurance Coverage by Citizenship Status in Advance
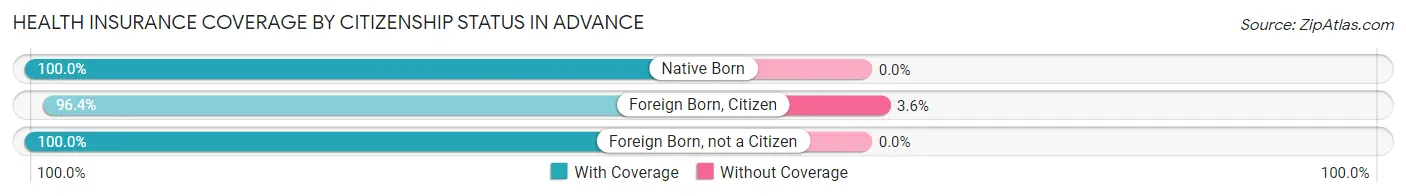
| Citizenship Status | With Coverage | Without Coverage |
| Native Born | 11 (100.0%) | 0 (0.0%) |
| Foreign Born, Citizen | 80 (96.4%) | 3 (3.6%) |
| Foreign Born, not a Citizen | 34 (100.0%) | 0 (0.0%) |
Health Insurance Coverage by Household Income in Advance
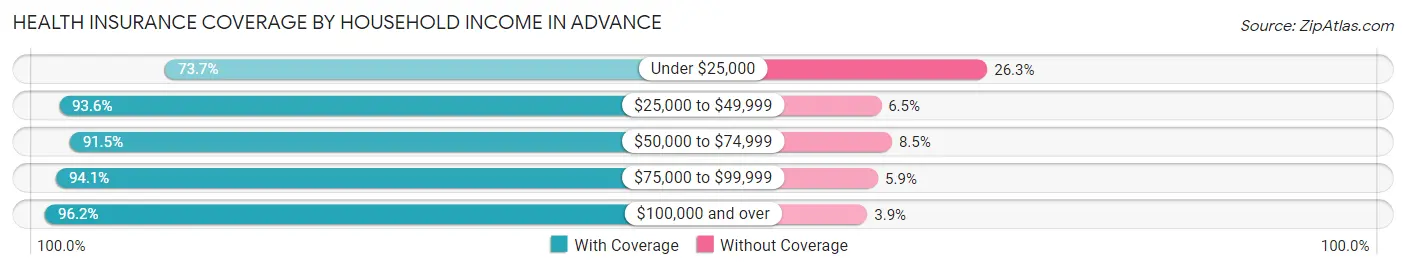
| Household Income | With Coverage | Without Coverage |
| Under $25,000 | 14 (73.7%) | 5 (26.3%) |
| $25,000 to $49,999 | 87 (93.5%) | 6 (6.5%) |
| $50,000 to $74,999 | 54 (91.5%) | 5 (8.5%) |
| $75,000 to $99,999 | 80 (94.1%) | 5 (5.9%) |
| $100,000 and over | 150 (96.2%) | 6 (3.8%) |
Public vs Private Health Insurance Coverage by Age in Advance
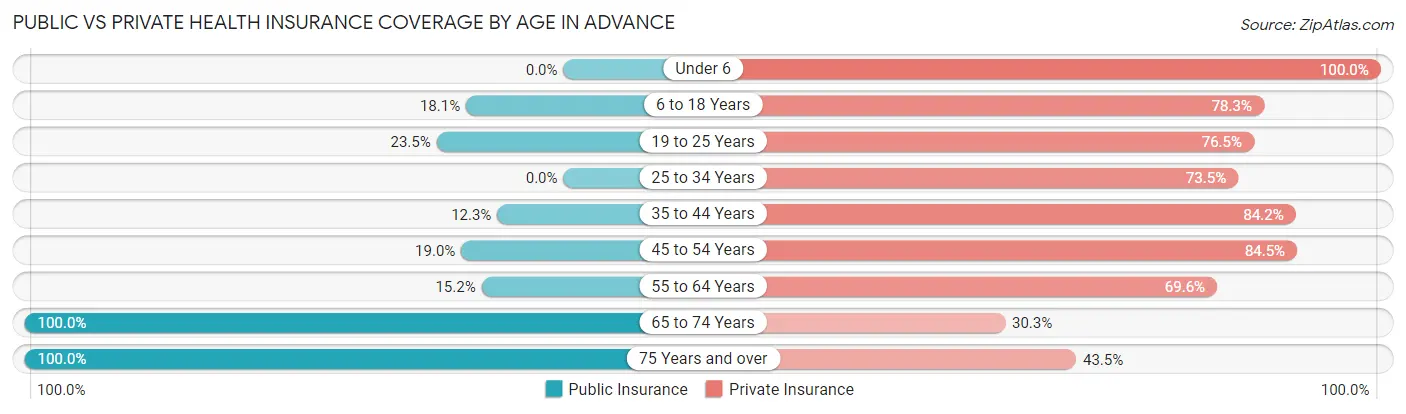
| Age Bracket | Public Insurance | Private Insurance |
| Under 6 | 0 (0.0%) | 11 (100.0%) |
| 6 to 18 Years | 15 (18.1%) | 65 (78.3%) |
| 19 to 25 Years | 8 (23.5%) | 26 (76.5%) |
| 25 to 34 Years | 0 (0.0%) | 25 (73.5%) |
| 35 to 44 Years | 7 (12.3%) | 48 (84.2%) |
| 45 to 54 Years | 11 (19.0%) | 49 (84.5%) |
| 55 to 64 Years | 12 (15.2%) | 55 (69.6%) |
| 65 to 74 Years | 33 (100.0%) | 10 (30.3%) |
| 75 Years and over | 23 (100.0%) | 10 (43.5%) |
| Total | 109 (26.5%) | 299 (72.6%) |
Disability Status by Sex by Age in Advance
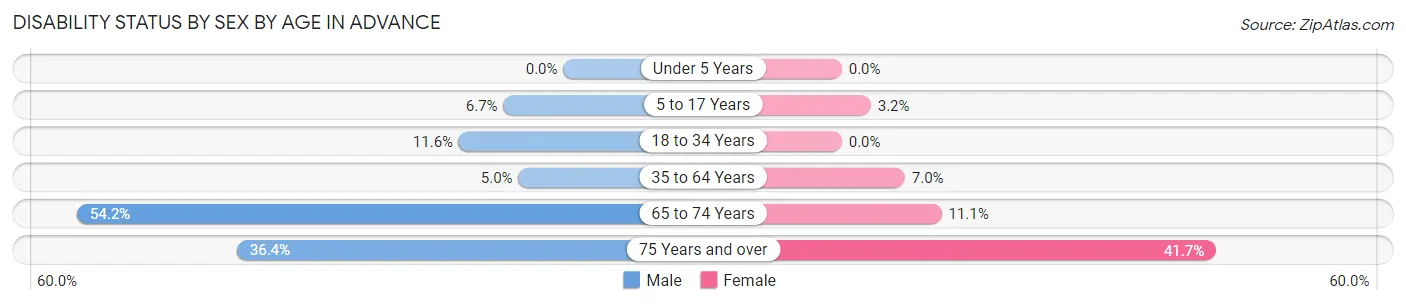
| Age Bracket | Male | Female |
| Under 5 Years | 0 (0.0%) | 0 (0.0%) |
| 5 to 17 Years | 3 (6.7%) | 1 (3.2%) |
| 18 to 34 Years | 5 (11.6%) | 0 (0.0%) |
| 35 to 64 Years | 4 (5.0%) | 8 (7.0%) |
| 65 to 74 Years | 13 (54.2%) | 1 (11.1%) |
| 75 Years and over | 4 (36.4%) | 5 (41.7%) |
Disability Class by Sex by Age in Advance
Disability Class: Hearing Difficulty
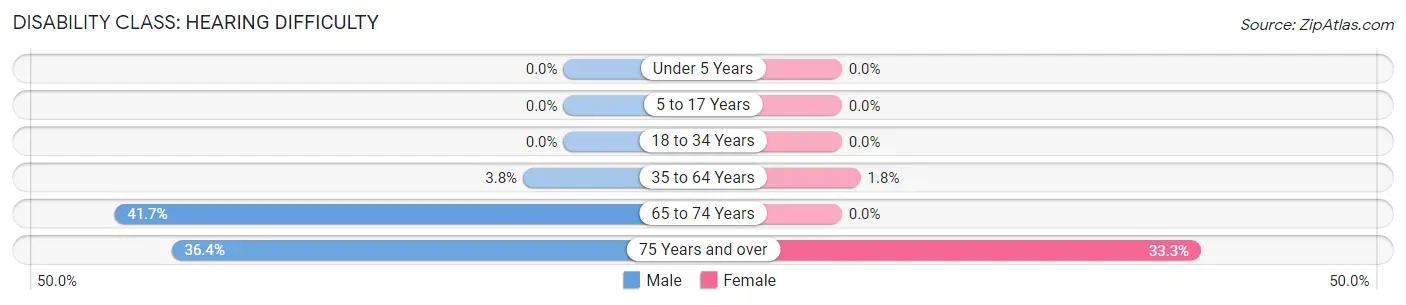
| Age Bracket | Male | Female |
| Under 5 Years | 0 (0.0%) | 0 (0.0%) |
| 5 to 17 Years | 0 (0.0%) | 0 (0.0%) |
| 18 to 34 Years | 0 (0.0%) | 0 (0.0%) |
| 35 to 64 Years | 3 (3.7%) | 2 (1.8%) |
| 65 to 74 Years | 10 (41.7%) | 0 (0.0%) |
| 75 Years and over | 4 (36.4%) | 4 (33.3%) |
Disability Class: Vision Difficulty
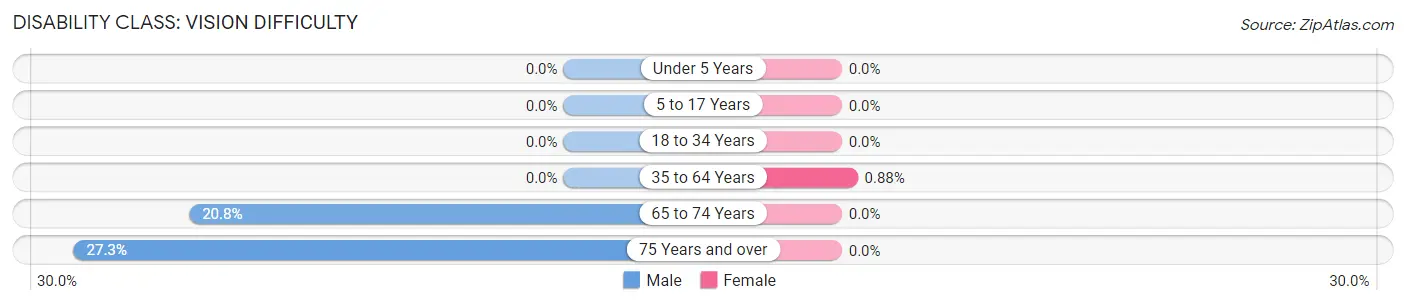
| Age Bracket | Male | Female |
| Under 5 Years | 0 (0.0%) | 0 (0.0%) |
| 5 to 17 Years | 0 (0.0%) | 0 (0.0%) |
| 18 to 34 Years | 0 (0.0%) | 0 (0.0%) |
| 35 to 64 Years | 0 (0.0%) | 1 (0.9%) |
| 65 to 74 Years | 5 (20.8%) | 0 (0.0%) |
| 75 Years and over | 3 (27.3%) | 0 (0.0%) |
Disability Class: Cognitive Difficulty
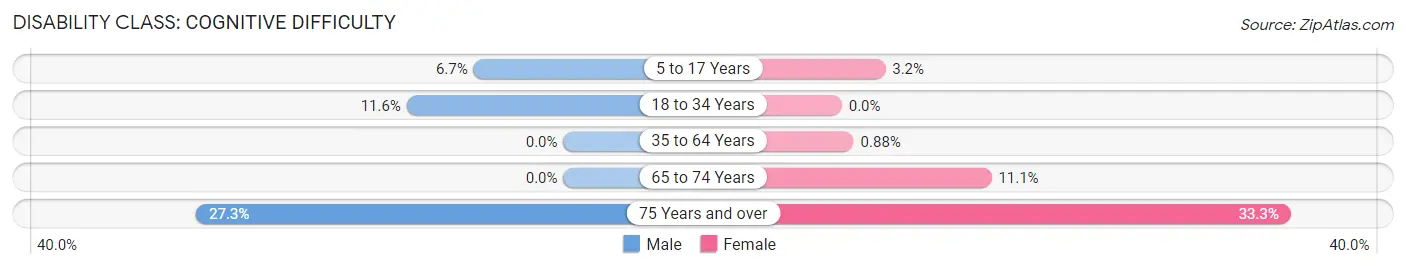
| Age Bracket | Male | Female |
| 5 to 17 Years | 3 (6.7%) | 1 (3.2%) |
| 18 to 34 Years | 5 (11.6%) | 0 (0.0%) |
| 35 to 64 Years | 0 (0.0%) | 1 (0.9%) |
| 65 to 74 Years | 0 (0.0%) | 1 (11.1%) |
| 75 Years and over | 3 (27.3%) | 4 (33.3%) |
Disability Class: Ambulatory Difficulty
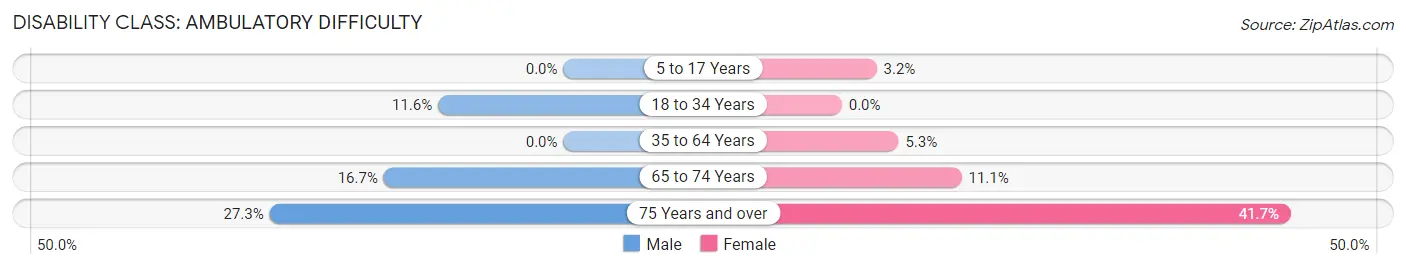
| Age Bracket | Male | Female |
| 5 to 17 Years | 0 (0.0%) | 1 (3.2%) |
| 18 to 34 Years | 5 (11.6%) | 0 (0.0%) |
| 35 to 64 Years | 0 (0.0%) | 6 (5.3%) |
| 65 to 74 Years | 4 (16.7%) | 1 (11.1%) |
| 75 Years and over | 3 (27.3%) | 5 (41.7%) |
Disability Class: Self-Care Difficulty
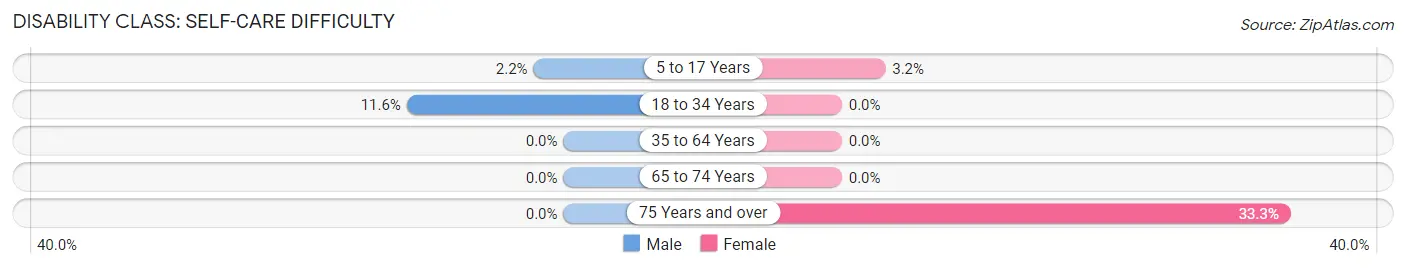
| Age Bracket | Male | Female |
| 5 to 17 Years | 1 (2.2%) | 1 (3.2%) |
| 18 to 34 Years | 5 (11.6%) | 0 (0.0%) |
| 35 to 64 Years | 0 (0.0%) | 0 (0.0%) |
| 65 to 74 Years | 0 (0.0%) | 0 (0.0%) |
| 75 Years and over | 0 (0.0%) | 4 (33.3%) |
Technology Access in Advance
Computing Device Access in Advance
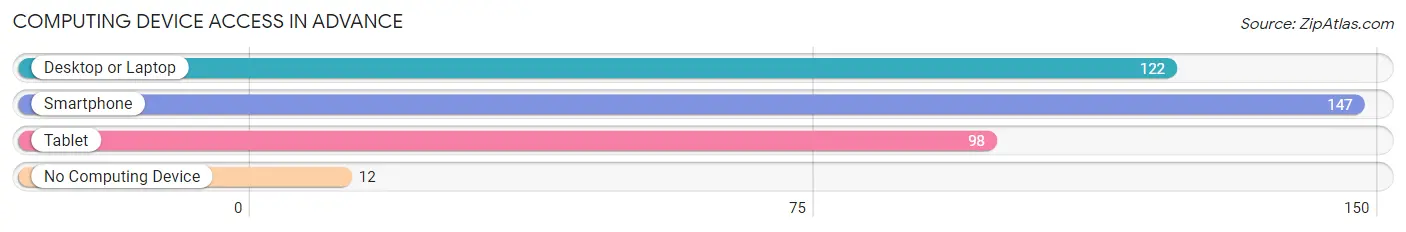
| Device Type | # Households | % Households |
| Desktop or Laptop | 122 | 72.2% |
| Smartphone | 147 | 87.0% |
| Tablet | 98 | 58.0% |
| No Computing Device | 12 | 7.1% |
| Total | 169 | 100.0% |
Internet Access in Advance
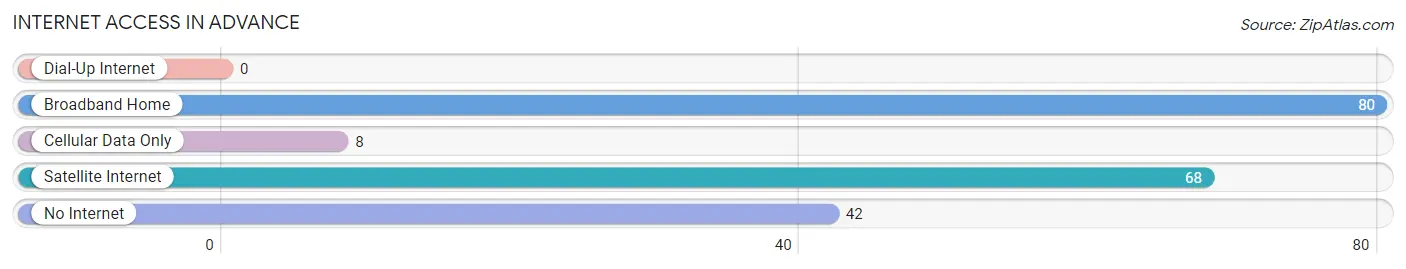
| Internet Type | # Households | % Households |
| Dial-Up Internet | 0 | 0.0% |
| Broadband Home | 80 | 47.3% |
| Cellular Data Only | 8 | 4.7% |
| Satellite Internet | 68 | 40.2% |
| No Internet | 42 | 24.8% |
| Total | 169 | 100.0% |
Advance Summary
History
Indiana is a state located in the Midwestern United States. It was admitted to the Union as the 19th state on December 11, 1816. Indiana was the first state to be admitted to the Union after the original 13 colonies. The state's name is derived from the Native American tribe that inhabited the area, the Miami Indians.
The first Europeans to explore Indiana were French explorers in the late 1600s. The French established trading posts and forts in the area, but they were eventually abandoned. In the late 1700s, the British took control of the area and it became part of the Northwest Territory.
In 1800, Indiana became part of the Indiana Territory. In 1809, the Indiana Territory was divided and the eastern portion became the state of Indiana. The state was divided into two parts, the northern part was called the Indiana Territory and the southern part was called the Illinois Territory.
In 1816, Indiana was admitted to the Union as the 19th state. During the 19th century, Indiana experienced rapid growth and development. The state was a major producer of agricultural products and was home to a number of industries, including steel production.
In the 20th century, Indiana continued to experience growth and development. The state was a major contributor to the war effort during World War II and was home to a number of military bases. In the late 20th century, Indiana experienced a decline in manufacturing and the state's economy shifted to a service-based economy.
Geography
Indiana is located in the Midwestern United States. It is bordered by Michigan to the north, Ohio to the east, Kentucky to the south, and Illinois to the west. The state has a total area of 36,418 square miles, making it the 38th largest state in the country.
The state is divided into two distinct regions, the Central Lowlands and the Interior Low Plateaus. The Central Lowlands region is located in the northern part of the state and is characterized by rolling hills and fertile farmland. The Interior Low Plateaus region is located in the southern part of the state and is characterized by flat plains and rolling hills.
The state is home to a number of rivers, including the Wabash, White, and Ohio Rivers. The Wabash River is the longest river in the state and is the state's official river. The state is also home to a number of lakes, including Lake Michigan, Lake Monroe, and Lake Wawasee.
Economy
Indiana has a diverse economy that is driven by manufacturing, agriculture, and services. The state is home to a number of major corporations, including Eli Lilly and Company, Cummins, and Steel Dynamics.
Manufacturing is the largest sector of the state's economy, accounting for nearly 20% of the state's GDP. The state is home to a number of major manufacturing companies, including automotive, pharmaceutical, and steel production.
Agriculture is also an important part of the state's economy. The state is a major producer of corn, soybeans, and hogs. The state is also home to a number of wineries and breweries.
The service sector is also an important part of the state's economy. The state is home to a number of major universities, including Indiana University, Purdue University, and the University of Notre Dame. The state is also home to a number of major hospitals and medical centers.
Demographics
As of 2019, the population of Indiana was estimated to be 6.7 million. The state has a population density of 181 people per square mile, making it the 16th most densely populated state in the country.
The largest city in the state is Indianapolis, with a population of 876,000. Other major cities in the state include Fort Wayne, Evansville, South Bend, and Gary.
The state is home to a number of ethnic and racial groups. The largest racial group in the state is white, accounting for 81.3% of the population. The second largest racial group is black, accounting for 9.2% of the population. Other racial groups in the state include Asian (3.2%), Hispanic (2.9%), and Native American (0.7%).
The state is also home to a number of religious groups. The largest religious group in the state is Christian, accounting for 78.2% of the population. Other religious groups in the state include Jewish (1.2%), Muslim (0.5%), and Buddhist (0.2%).
Common Questions
What is Per Capita Income in Advance?
Per Capita income in Advance is $32,850.
What is the Median Family Income in Advance?
Median Family Income in Advance is $87,813.
What is the Median Household income in Advance?
Median Household Income in Advance is $71,042.
What is Income or Wage Gap in Advance?
Income or Wage Gap in Advance is 27.7%.
Women in Advance earn 72.3 cents for every dollar earned by a man.
What is Inequality or Gini Index in Advance?
Inequality or Gini Index in Advance is 0.34.
What is the Total Population of Advance?
Total Population of Advance is 412.
What is the Total Male Population of Advance?
Total Male Population of Advance is 210.
What is the Total Female Population of Advance?
Total Female Population of Advance is 202.
What is the Ratio of Males per 100 Females in Advance?
There are 103.96 Males per 100 Females in Advance.
What is the Ratio of Females per 100 Males in Advance?
There are 96.19 Females per 100 Males in Advance.
What is the Median Population Age in Advance?
Median Population Age in Advance is 43.0 Years.
What is the Average Family Size in Advance
Average Family Size in Advance is 2.9 People.
What is the Average Household Size in Advance
Average Household Size in Advance is 2.4 People.
How Large is the Labor Force in Advance?
There are 232 People in the Labor Forcein in Advance.
What is the Percentage of People in the Labor Force in Advance?
69.5% of People are in the Labor Force in Advance.
What is the Unemployment Rate in Advance?
Unemployment Rate in Advance is 1.3%.