Zip Codes with the Highest Percentage of Black / African American Population in Orland Park, IL
RELATED REPORTS & OPTIONS
Black / African American
Orland Park
Compare Zip Codes
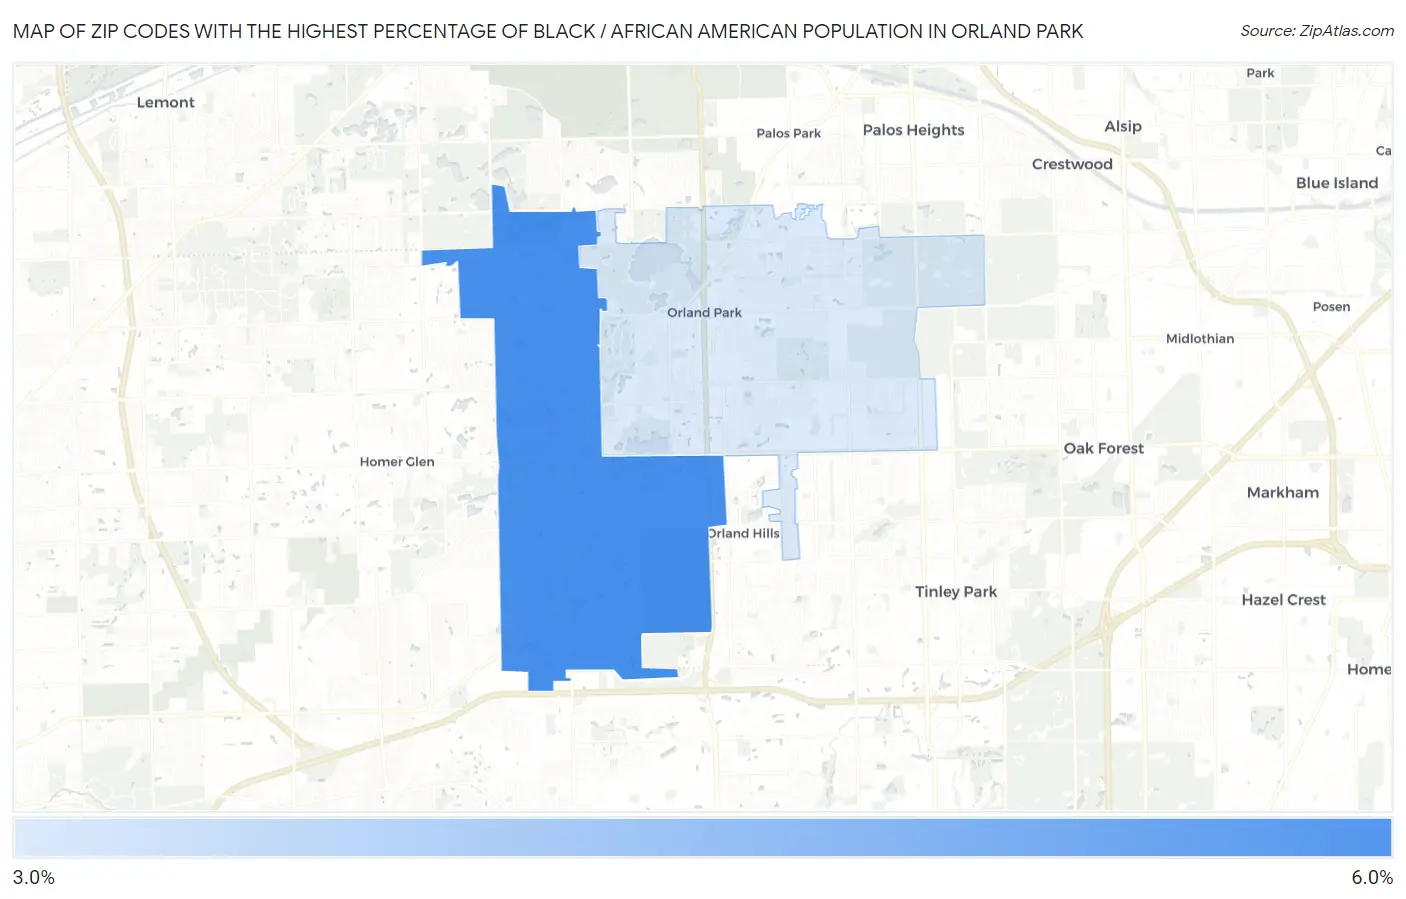
Map of Zip Codes with the Highest Percentage of Black / African American Population in Orland Park
0.0%
6.0%
Zip Codes with the Highest Percentage of Black / African American Population in Orland Park, IL
| Zip Code | Black / African American | vs State | vs National | |
| 1. | 60467 | 5.1% | 13.9%(-8.85)#295 | 12.5%(-7.41)#9,506 |
| 2. | 60462 | 3.2% | 13.9%(-10.7)#374 | 12.5%(-9.25)#11,458 |
1
Common Questions
What are the Top Zip Codes with the Highest Percentage of Black / African American Population in Orland Park, IL?
Top Zip Codes with the Highest Percentage of Black / African American Population in Orland Park, IL are:
What zip code has the Highest Percentage of Black / African American Population in Orland Park, IL?
60467 has the Highest Percentage of Black / African American Population in Orland Park, IL with 5.1%.
What is the Percentage of Black / African American Population in Orland Park, IL?
Percentage of Black / African American Population in Orland Park is 4.3%.
What is the Percentage of Black / African American Population in Illinois?
Percentage of Black / African American Population in Illinois is 13.9%.
What is the Percentage of Black / African American Population in the United States?
Percentage of Black / African American Population in the United States is 12.5%.