Zip Codes with the Highest Percentage of Population Employed in Farming, Fishing & Forestry in Champaign, IL
RELATED REPORTS & OPTIONS
Farming, Fishing & Forestry
Champaign
Compare Zip Codes
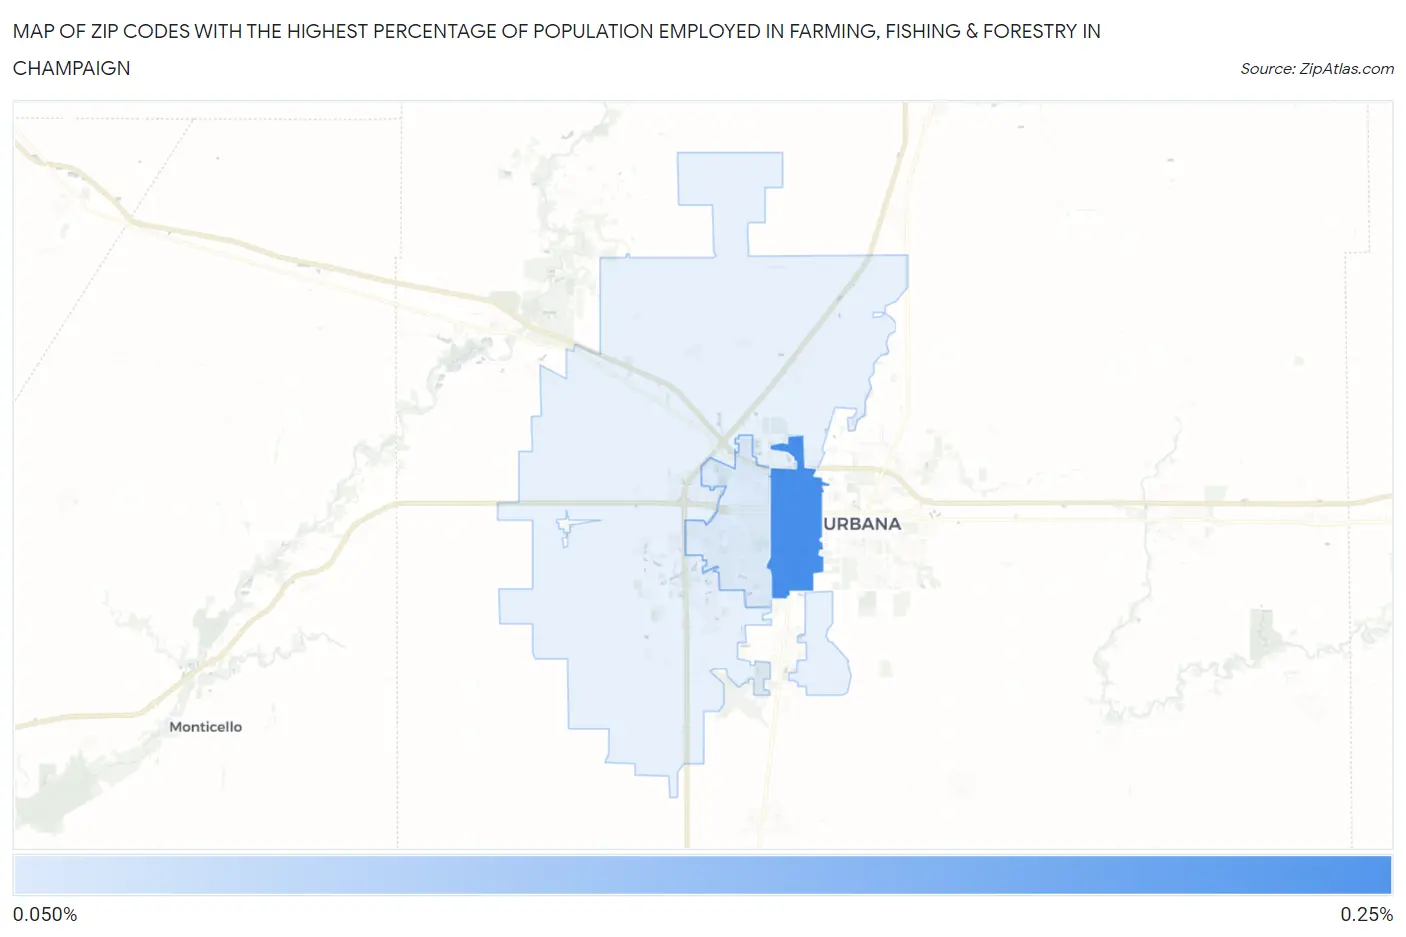
Map of Zip Codes with the Highest Percentage of Population Employed in Farming, Fishing & Forestry in Champaign
0.0%
0.25%
Zip Codes with the Highest Percentage of Population Employed in Farming, Fishing & Forestry in Champaign, IL
| Zip Code | % Employed | vs State | vs National | |
| 1. | 61820 | 0.21% | 0.31%(-0.104)#714 | 0.61%(-0.399)#16,044 |
| 2. | 61821 | 0.083% | 0.31%(-0.227)#785 | 0.61%(-0.522)#18,050 |
1
Common Questions
What are the Top Zip Codes with the Highest Percentage of Population Employed in Farming, Fishing & Forestry in Champaign, IL?
Top Zip Codes with the Highest Percentage of Population Employed in Farming, Fishing & Forestry in Champaign, IL are:
What zip code has the Highest Percentage of Population Employed in Farming, Fishing & Forestry in Champaign, IL?
61820 has the Highest Percentage of Population Employed in Farming, Fishing & Forestry in Champaign, IL with 0.21%.
What is the Percentage of Population Employed in Farming, Fishing & Forestry in Champaign, IL?
Percentage of Population Employed in Farming, Fishing & Forestry in Champaign is 0.11%.
What is the Percentage of Population Employed in Farming, Fishing & Forestry in Illinois?
Percentage of Population Employed in Farming, Fishing & Forestry in Illinois is 0.31%.
What is the Percentage of Population Employed in Farming, Fishing & Forestry in the United States?
Percentage of Population Employed in Farming, Fishing & Forestry in the United States is 0.61%.