Zip Codes with the Highest Percentage of Households Without a Vehicle in Caldwell, ID
RELATED REPORTS & OPTIONS
Households without a Cars
Caldwell
Compare Zip Codes
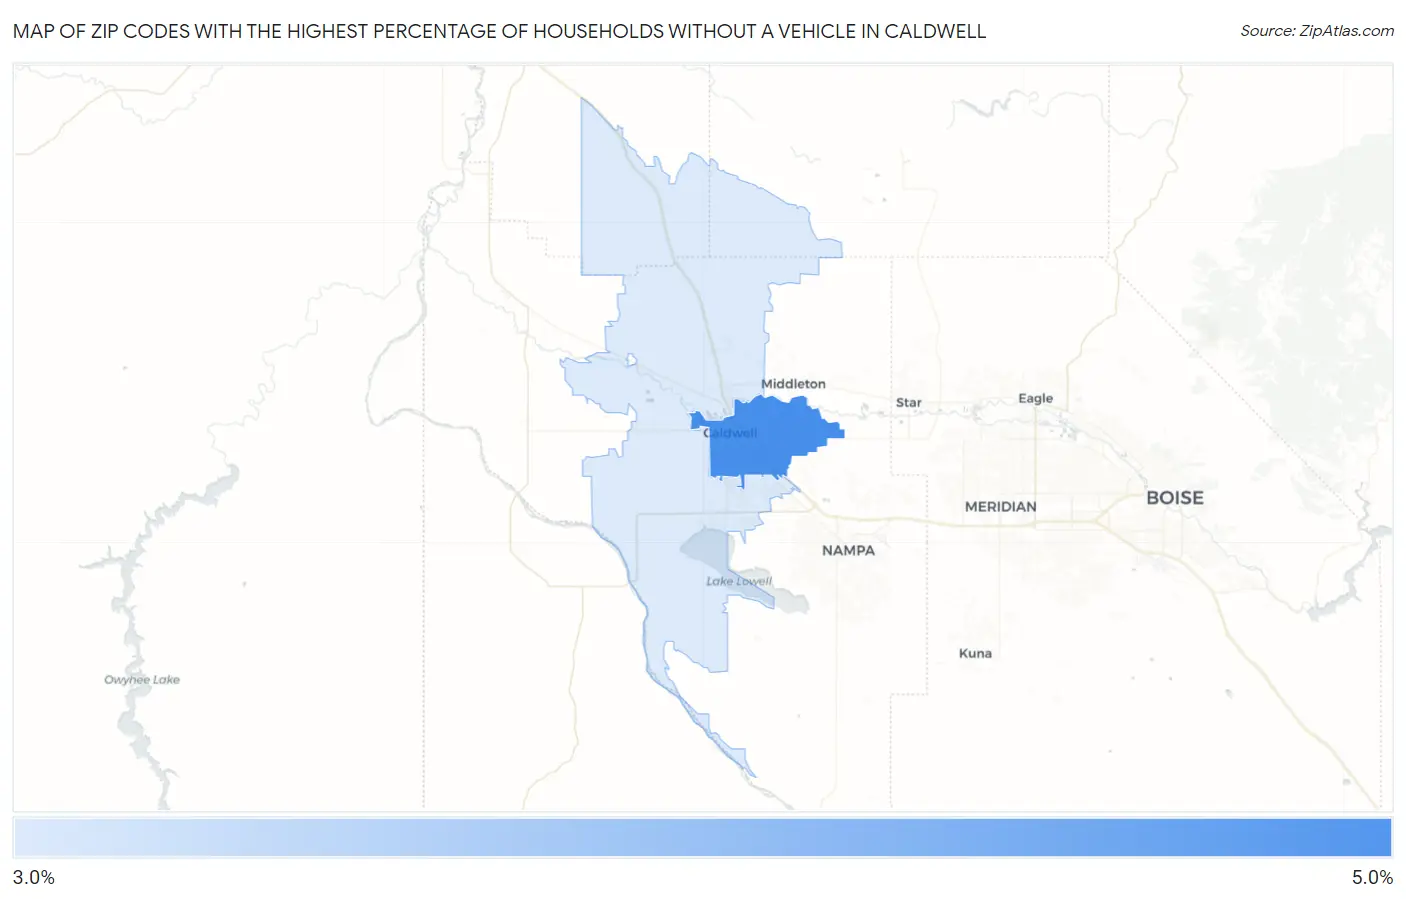
Map of Zip Codes with the Highest Percentage of Households Without a Vehicle in Caldwell
3.2%
4.4%
Zip Codes with the Highest Percentage of Households Without a Vehicle in Caldwell, ID
| Zip Code | Housholds Without a Car | vs State | vs National | |
| 1. | 83605 | 4.4% | 3.8%(+0.600)#61 | 8.3%(-3.90)#14,473 |
| 2. | 83607 | 3.2% | 3.8%(-0.600)#92 | 8.3%(-5.10)#18,341 |
1
Common Questions
What are the Top Zip Codes with the Highest Percentage of Households Without a Vehicle in Caldwell, ID?
Top Zip Codes with the Highest Percentage of Households Without a Vehicle in Caldwell, ID are:
What zip code has the Highest Percentage of Households Without a Vehicle in Caldwell, ID?
83605 has the Highest Percentage of Households Without a Vehicle in Caldwell, ID with 4.4%.
What is the Percentage of Households Without a Vehicle in Caldwell, ID?
Percentage of Households Without a Vehicle in Caldwell is 3.9%.
What is the Percentage of Households Without a Vehicle in Idaho?
Percentage of Households Without a Vehicle in Idaho is 3.8%.
What is the Percentage of Households Without a Vehicle in the United States?
Percentage of Households Without a Vehicle in the United States is 8.3%.