Zip Codes with the Highest Percentage of Population Employed in Construction & Extraction in Georgia
RELATED REPORTS & OPTIONS
Construction & Extraction
Georgia
Compare Zip Codes
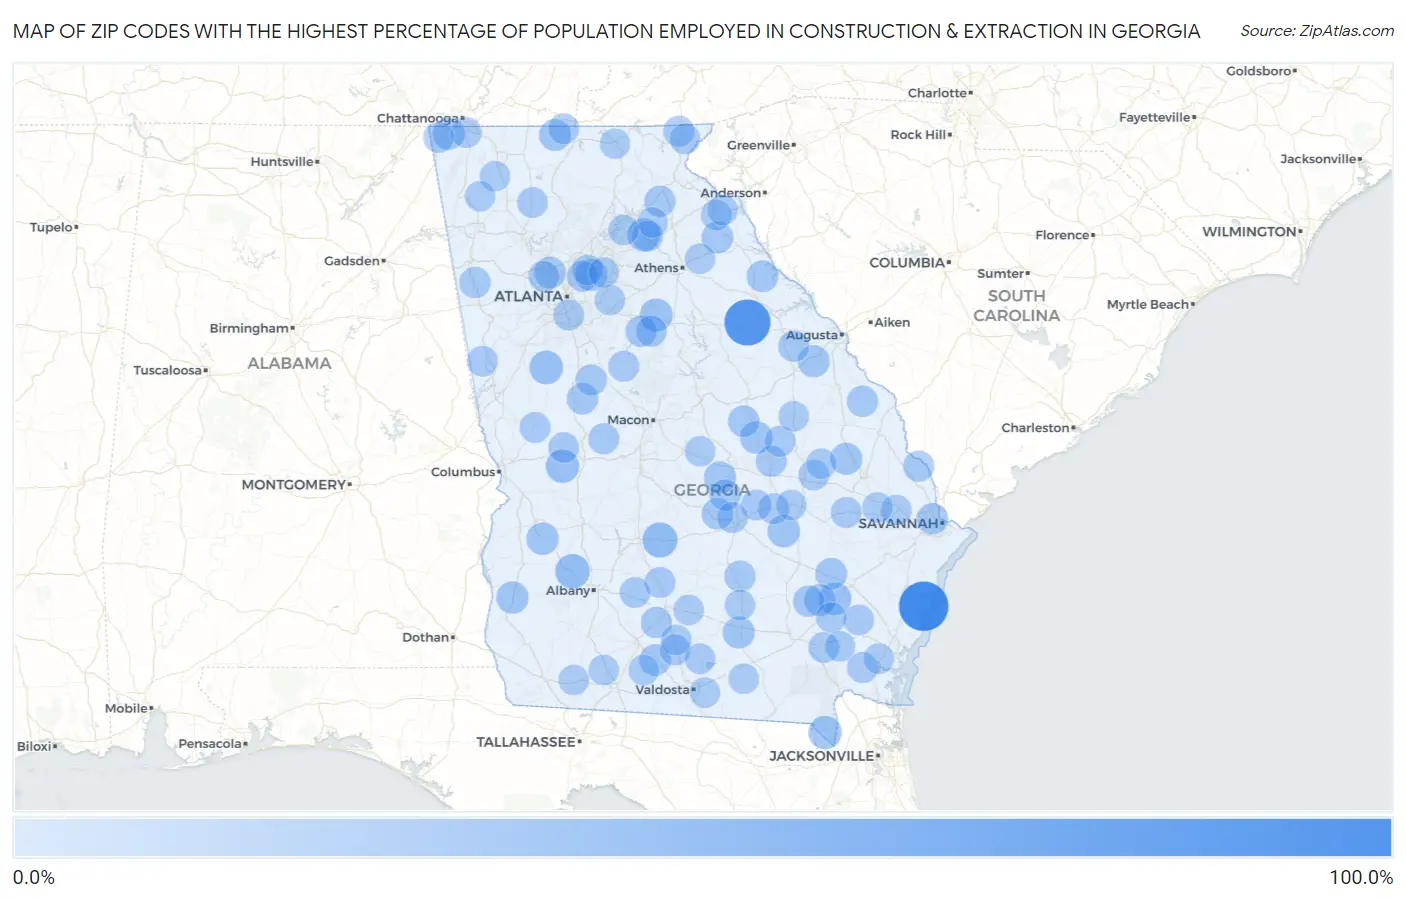
Map of Zip Codes with the Highest Percentage of Population Employed in Construction & Extraction in Georgia
0.0%
100.0%
Zip Codes with the Highest Percentage of Population Employed in Construction & Extraction in Georgia
| Zip Code | % Employed | vs State | vs National | |
| 1. | 31327 | 100.0% | 4.7%(+95.3)#1 | 5.0%(+95.0)#34 |
| 2. | 30664 | 83.3% | 4.7%(+78.6)#2 | 5.0%(+78.3)#44 |
| 3. | 31072 | 30.7% | 4.7%(+26.0)#3 | 5.0%(+25.7)#378 |
| 4. | 39885 | 28.6% | 4.7%(+23.8)#4 | 5.0%(+23.6)#441 |
| 5. | 30229 | 25.0% | 4.7%(+20.3)#5 | 5.0%(+20.0)#599 |
| 6. | 31058 | 23.7% | 4.7%(+19.0)#6 | 5.0%(+18.7)#668 |
| 7. | 31562 | 22.7% | 4.7%(+18.0)#7 | 5.0%(+17.7)#740 |
| 8. | 30575 | 21.5% | 4.7%(+16.7)#8 | 5.0%(+16.5)#842 |
| 9. | 30663 | 21.4% | 4.7%(+16.7)#9 | 5.0%(+16.4)#849 |
| 10. | 31560 | 20.0% | 4.7%(+15.2)#10 | 5.0%(+15.0)#1,005 |
| 11. | 31096 | 19.7% | 4.7%(+14.9)#11 | 5.0%(+14.7)#1,042 |
| 12. | 30473 | 19.3% | 4.7%(+14.6)#12 | 5.0%(+14.3)#1,087 |
| 13. | 31832 | 19.0% | 4.7%(+14.3)#13 | 5.0%(+14.1)#1,126 |
| 14. | 39824 | 18.8% | 4.7%(+14.1)#14 | 5.0%(+13.8)#1,162 |
| 15. | 30093 | 18.4% | 4.7%(+13.7)#15 | 5.0%(+13.4)#1,228 |
| 16. | 31019 | 17.7% | 4.7%(+13.0)#16 | 5.0%(+12.7)#1,339 |
| 17. | 30757 | 17.6% | 4.7%(+12.8)#17 | 5.0%(+12.6)#1,372 |
| 18. | 31642 | 17.5% | 4.7%(+12.7)#18 | 5.0%(+12.5)#1,391 |
| 19. | 30450 | 17.2% | 4.7%(+12.4)#19 | 5.0%(+12.2)#1,433 |
| 20. | 30805 | 17.2% | 4.7%(+12.4)#20 | 5.0%(+12.2)#1,440 |
| 21. | 30541 | 16.5% | 4.7%(+11.8)#21 | 5.0%(+11.5)#1,582 |
| 22. | 30624 | 16.1% | 4.7%(+11.3)#22 | 5.0%(+11.1)#1,700 |
| 23. | 31722 | 15.8% | 4.7%(+11.1)#23 | 5.0%(+10.8)#1,759 |
| 24. | 30060 | 15.8% | 4.7%(+11.0)#24 | 5.0%(+10.8)#1,775 |
| 25. | 31555 | 15.7% | 4.7%(+10.9)#25 | 5.0%(+10.7)#1,806 |
| 26. | 30668 | 15.6% | 4.7%(+10.8)#26 | 5.0%(+10.6)#1,839 |
| 27. | 31089 | 15.4% | 4.7%(+10.6)#27 | 5.0%(+10.4)#1,889 |
| 28. | 31518 | 15.2% | 4.7%(+10.4)#28 | 5.0%(+10.2)#1,963 |
| 29. | 31011 | 15.0% | 4.7%(+10.2)#29 | 5.0%(+9.98)#2,035 |
| 30. | 31551 | 14.6% | 4.7%(+9.88)#30 | 5.0%(+9.62)#2,192 |
| 31. | 31408 | 14.6% | 4.7%(+9.85)#31 | 5.0%(+9.59)#2,207 |
| 32. | 30285 | 14.5% | 4.7%(+9.73)#32 | 5.0%(+9.47)#2,254 |
| 33. | 30055 | 14.5% | 4.7%(+9.72)#33 | 5.0%(+9.46)#2,260 |
| 34. | 31519 | 14.3% | 4.7%(+9.59)#34 | 5.0%(+9.34)#2,298 |
| 35. | 30113 | 14.1% | 4.7%(+9.32)#35 | 5.0%(+9.07)#2,431 |
| 36. | 31009 | 14.0% | 4.7%(+9.31)#36 | 5.0%(+9.05)#2,438 |
| 37. | 31775 | 14.0% | 4.7%(+9.22)#37 | 5.0%(+8.96)#2,479 |
| 38. | 30510 | 13.9% | 4.7%(+9.21)#38 | 5.0%(+8.95)#2,488 |
| 39. | 30808 | 13.5% | 4.7%(+8.77)#39 | 5.0%(+8.51)#2,706 |
| 40. | 30056 | 13.4% | 4.7%(+8.68)#40 | 5.0%(+8.43)#2,745 |
| 41. | 30456 | 13.4% | 4.7%(+8.66)#41 | 5.0%(+8.41)#2,753 |
| 42. | 30257 | 13.1% | 4.7%(+8.39)#42 | 5.0%(+8.14)#2,868 |
| 43. | 31303 | 13.0% | 4.7%(+8.29)#43 | 5.0%(+8.04)#2,921 |
| 44. | 31078 | 12.7% | 4.7%(+7.98)#44 | 5.0%(+7.72)#3,099 |
| 45. | 31002 | 12.7% | 4.7%(+7.92)#45 | 5.0%(+7.66)#3,151 |
| 46. | 30340 | 12.6% | 4.7%(+7.83)#46 | 5.0%(+7.57)#3,208 |
| 47. | 30445 | 12.5% | 4.7%(+7.80)#47 | 5.0%(+7.54)#3,225 |
| 48. | 30429 | 12.5% | 4.7%(+7.76)#48 | 5.0%(+7.51)#3,267 |
| 49. | 31568 | 12.4% | 4.7%(+7.71)#49 | 5.0%(+7.45)#3,308 |
| 50. | 30568 | 12.4% | 4.7%(+7.68)#50 | 5.0%(+7.42)#3,335 |
| 51. | 31049 | 12.4% | 4.7%(+7.67)#51 | 5.0%(+7.41)#3,341 |
| 52. | 31790 | 12.3% | 4.7%(+7.56)#52 | 5.0%(+7.30)#3,406 |
| 53. | 30297 | 12.2% | 4.7%(+7.50)#53 | 5.0%(+7.24)#3,431 |
| 54. | 30428 | 12.2% | 4.7%(+7.48)#54 | 5.0%(+7.23)#3,441 |
| 55. | 30216 | 12.1% | 4.7%(+7.40)#55 | 5.0%(+7.14)#3,504 |
| 56. | 31037 | 12.1% | 4.7%(+7.33)#56 | 5.0%(+7.07)#3,549 |
| 57. | 30008 | 12.1% | 4.7%(+7.32)#57 | 5.0%(+7.06)#3,554 |
| 58. | 30071 | 12.0% | 4.7%(+7.27)#58 | 5.0%(+7.02)#3,579 |
| 59. | 30567 | 12.0% | 4.7%(+7.27)#59 | 5.0%(+7.01)#3,583 |
| 60. | 30741 | 12.0% | 4.7%(+7.26)#60 | 5.0%(+7.01)#3,584 |
| 61. | 31542 | 12.0% | 4.7%(+7.24)#61 | 5.0%(+6.98)#3,606 |
| 62. | 31826 | 12.0% | 4.7%(+7.21)#62 | 5.0%(+6.96)#3,619 |
| 63. | 30555 | 11.8% | 4.7%(+7.02)#63 | 5.0%(+6.76)#3,758 |
| 64. | 31781 | 11.6% | 4.7%(+6.90)#64 | 5.0%(+6.64)#3,860 |
| 65. | 30217 | 11.6% | 4.7%(+6.85)#65 | 5.0%(+6.60)#3,893 |
| 66. | 31543 | 11.5% | 4.7%(+6.75)#66 | 5.0%(+6.50)#3,966 |
| 67. | 30752 | 11.4% | 4.7%(+6.70)#67 | 5.0%(+6.44)#4,008 |
| 68. | 30525 | 11.4% | 4.7%(+6.62)#68 | 5.0%(+6.36)#4,066 |
| 69. | 30139 | 11.3% | 4.7%(+6.60)#69 | 5.0%(+6.34)#4,082 |
| 70. | 30464 | 11.3% | 4.7%(+6.51)#70 | 5.0%(+6.26)#4,149 |
| 71. | 31620 | 11.2% | 4.7%(+6.50)#71 | 5.0%(+6.24)#4,165 |
| 72. | 30520 | 11.2% | 4.7%(+6.44)#72 | 5.0%(+6.18)#4,218 |
| 73. | 31645 | 11.2% | 4.7%(+6.42)#73 | 5.0%(+6.16)#4,235 |
| 74. | 31812 | 11.1% | 4.7%(+6.32)#74 | 5.0%(+6.06)#4,321 |
| 75. | 31647 | 11.0% | 4.7%(+6.30)#75 | 5.0%(+6.05)#4,332 |
| 76. | 31778 | 11.0% | 4.7%(+6.24)#76 | 5.0%(+5.98)#4,390 |
| 77. | 31749 | 10.8% | 4.7%(+6.04)#77 | 5.0%(+5.78)#4,581 |
| 78. | 31535 | 10.7% | 4.7%(+5.93)#78 | 5.0%(+5.67)#4,681 |
| 79. | 31565 | 10.6% | 4.7%(+5.89)#79 | 5.0%(+5.64)#4,723 |
| 80. | 30628 | 10.6% | 4.7%(+5.88)#80 | 5.0%(+5.63)#4,737 |
| 81. | 30471 | 10.6% | 4.7%(+5.88)#81 | 5.0%(+5.63)#4,739 |
| 82. | 30543 | 10.6% | 4.7%(+5.84)#82 | 5.0%(+5.58)#4,775 |
| 83. | 31773 | 10.5% | 4.7%(+5.80)#83 | 5.0%(+5.54)#4,816 |
| 84. | 31308 | 10.5% | 4.7%(+5.79)#84 | 5.0%(+5.53)#4,822 |
| 85. | 31557 | 10.5% | 4.7%(+5.79)#85 | 5.0%(+5.53)#4,824 |
| 86. | 31630 | 10.5% | 4.7%(+5.75)#86 | 5.0%(+5.50)#4,865 |
| 87. | 31606 | 10.4% | 4.7%(+5.62)#87 | 5.0%(+5.37)#5,014 |
| 88. | 30746 | 10.4% | 4.7%(+5.61)#88 | 5.0%(+5.36)#5,025 |
| 89. | 30012 | 10.2% | 4.7%(+5.51)#89 | 5.0%(+5.25)#5,139 |
| 90. | 30474 | 10.2% | 4.7%(+5.51)#90 | 5.0%(+5.25)#5,143 |
| 91. | 31553 | 10.2% | 4.7%(+5.50)#91 | 5.0%(+5.24)#5,147 |
| 92. | 30105 | 10.2% | 4.7%(+5.46)#92 | 5.0%(+5.21)#5,182 |
| 93. | 31321 | 10.2% | 4.7%(+5.45)#93 | 5.0%(+5.19)#5,198 |
| 94. | 30477 | 10.2% | 4.7%(+5.42)#94 | 5.0%(+5.17)#5,216 |
| 95. | 30516 | 10.2% | 4.7%(+5.42)#95 | 5.0%(+5.16)#5,223 |
| 96. | 39897 | 10.1% | 4.7%(+5.32)#96 | 5.0%(+5.06)#5,335 |
| 97. | 31017 | 10.0% | 4.7%(+5.28)#97 | 5.0%(+5.02)#5,382 |
| 98. | 30044 | 10.0% | 4.7%(+5.28)#98 | 5.0%(+5.02)#5,385 |
| 99. | 30512 | 10.0% | 4.7%(+5.23)#99 | 5.0%(+4.97)#5,445 |
| 100. | 30566 | 9.9% | 4.7%(+5.17)#100 | 5.0%(+4.92)#5,515 |
Common Questions
What are the Top 10 Zip Codes with the Highest Percentage of Population Employed in Construction & Extraction in Georgia?
Top 10 Zip Codes with the Highest Percentage of Population Employed in Construction & Extraction in Georgia are:
What zip code has the Highest Percentage of Population Employed in Construction & Extraction in Georgia?
31327 has the Highest Percentage of Population Employed in Construction & Extraction in Georgia with 100.0%.
What is the Percentage of Population Employed in Construction & Extraction in the State of Georgia?
Percentage of Population Employed in Construction & Extraction in Georgia is 4.7%.
What is the Percentage of Population Employed in Construction & Extraction in the United States?
Percentage of Population Employed in Construction & Extraction in the United States is 5.0%.