Zip Codes with the Highest Percentage of Population Taking Taxi / Cab to Work in Lagrange, GA
RELATED REPORTS & OPTIONS
Taxi / Cab
Lagrange
Compare Zip Codes
Map of Zip Codes with the Highest Percentage of Population Taking Taxi / Cab to Work in Lagrange
21.1%
23.8%
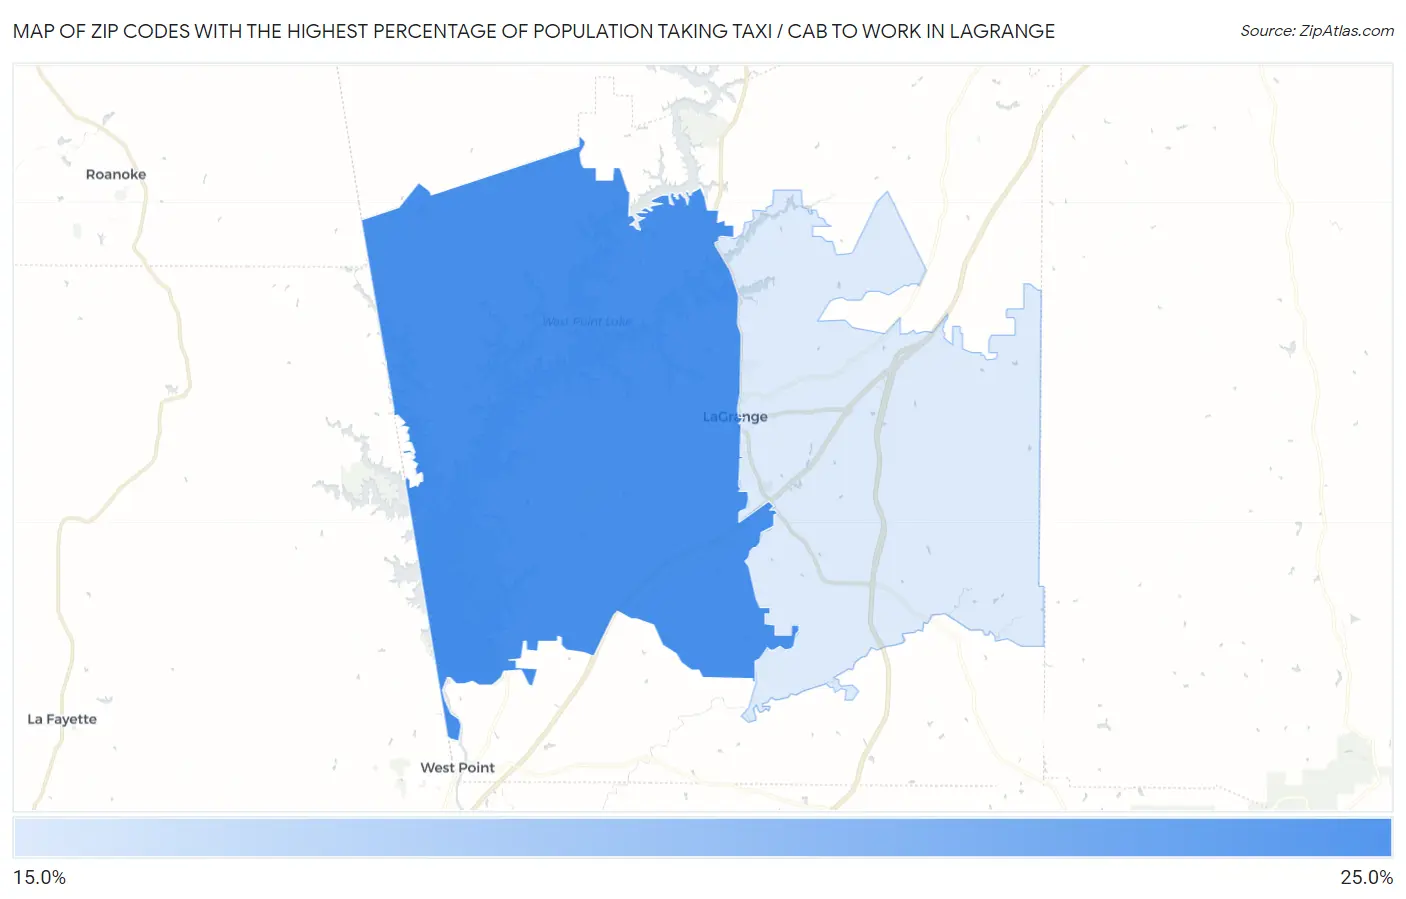
Zip Codes with the Highest Percentage of Population Taking Taxi / Cab to Work in Lagrange, GA
| Zip Code | % Take Taxi / Cab | vs State | vs National | |
| 1. | 30240 | 23.8% | 37.1%(-13.3)#325 | 38.2%(-14.4)#12,483 |
| 2. | 30241 | 21.1% | 37.1%(-16.0)#340 | 38.2%(-17.1)#12,869 |
1
Common Questions
What are the Top Zip Codes with the Highest Percentage of Population Taking Taxi / Cab to Work in Lagrange, GA?
Top Zip Codes with the Highest Percentage of Population Taking Taxi / Cab to Work in Lagrange, GA are:
What zip code has the Highest Percentage of Population Taking Taxi / Cab to Work in Lagrange, GA?
30240 has the Highest Percentage of Population Taking Taxi / Cab to Work in Lagrange, GA with 23.8%.
What is the Percentage of Population Taking Taxi / Cab to Work in Lagrange, GA?
Percentage of Population Taking Taxi / Cab to Work in Lagrange is 23.6%.
What is the Percentage of Population Taking Taxi / Cab to Work in Georgia?
Percentage of Population Taking Taxi / Cab to Work in Georgia is 37.1%.
What is the Percentage of Population Taking Taxi / Cab to Work in the United States?
Percentage of Population Taking Taxi / Cab to Work in the United States is 38.2%.