Zip Codes with the Highest Percentage of Households Heated by Bottled Gas / Liquid Propane in Griffin, GA
RELATED REPORTS & OPTIONS
Bottled Gas / LP Heating
Griffin
Compare Zip Codes
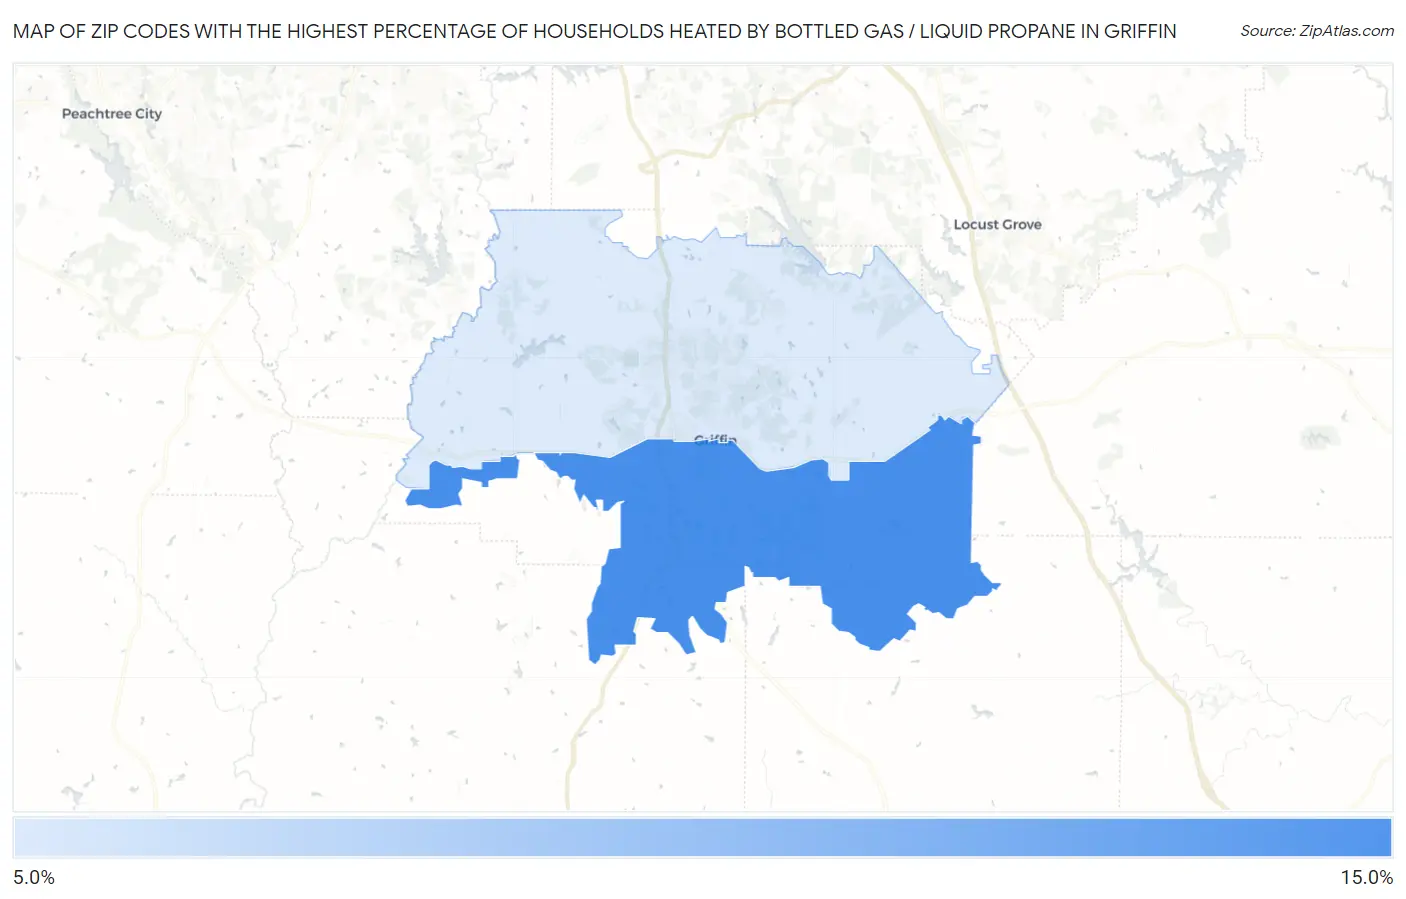
Map of Zip Codes with the Highest Percentage of Households Heated by Bottled Gas / Liquid Propane in Griffin
0.0%
15.0%
Zip Codes with the Highest Percentage of Households Heated by Bottled Gas / Liquid Propane in Griffin, GA
| Zip Code | Bottled Gas / LP Heating | vs State | vs National | |
| 1. | 30224 | 11.9% | 4.4%(+7.50)#199 | 4.9%(+7.00)#13,133 |
| 2. | 30223 | 9.6% | 4.4%(+5.20)#242 | 4.9%(+4.70)#14,729 |
1
Common Questions
What are the Top Zip Codes with the Highest Percentage of Households Heated by Bottled Gas / Liquid Propane in Griffin, GA?
Top Zip Codes with the Highest Percentage of Households Heated by Bottled Gas / Liquid Propane in Griffin, GA are:
What zip code has the Highest Percentage of Households Heated by Bottled Gas / Liquid Propane in Griffin, GA?
30224 has the Highest Percentage of Households Heated by Bottled Gas / Liquid Propane in Griffin, GA with 11.9%.
What is the Percentage of Households Heated by Bottled Gas / Liquid Propane in Griffin, GA?
Percentage of Households Heated by Bottled Gas / Liquid Propane in Griffin is 1.3%.
What is the Percentage of Households Heated by Bottled Gas / Liquid Propane in Georgia?
Percentage of Households Heated by Bottled Gas / Liquid Propane in Georgia is 4.4%.
What is the Percentage of Households Heated by Bottled Gas / Liquid Propane in the United States?
Percentage of Households Heated by Bottled Gas / Liquid Propane in the United States is 4.9%.