Zip Codes with the Highest Percentage of Population Employed in Farming, Fishing & Forestry in Griffin, GA
RELATED REPORTS & OPTIONS
Farming, Fishing & Forestry
Griffin
Compare Zip Codes
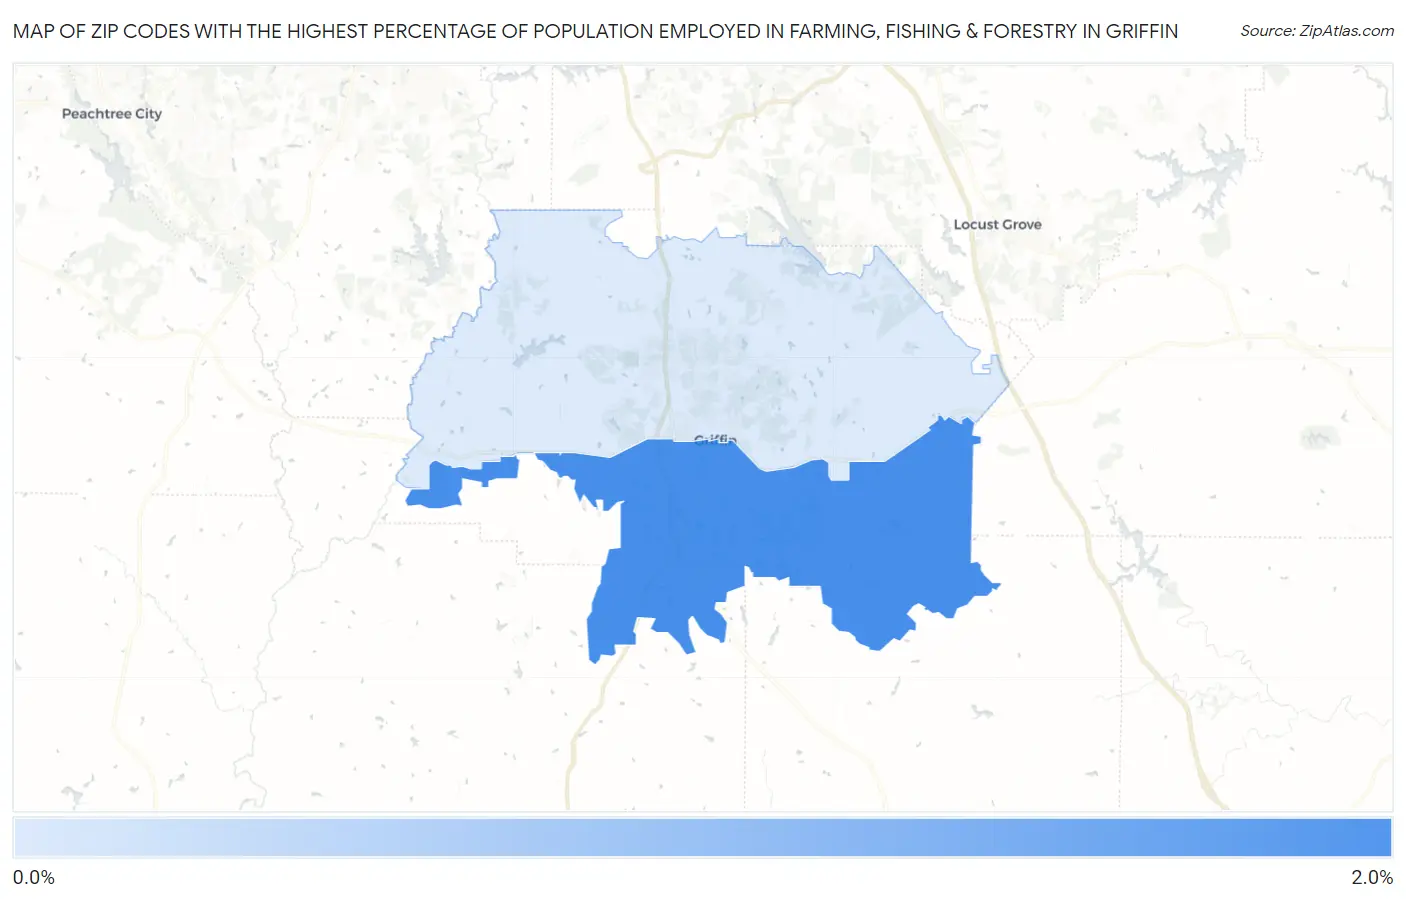
Map of Zip Codes with the Highest Percentage of Population Employed in Farming, Fishing & Forestry in Griffin
0.0%
2.0%
Zip Codes with the Highest Percentage of Population Employed in Farming, Fishing & Forestry in Griffin, GA
| Zip Code | % Employed | vs State | vs National | |
| 1. | 30224 | 1.7% | 0.45%(+1.28)#135 | 0.61%(+1.13)#7,215 |
| 2. | 30223 | 0.12% | 0.45%(-0.333)#392 | 0.61%(-0.487)#17,471 |
1
Common Questions
What are the Top Zip Codes with the Highest Percentage of Population Employed in Farming, Fishing & Forestry in Griffin, GA?
Top Zip Codes with the Highest Percentage of Population Employed in Farming, Fishing & Forestry in Griffin, GA are:
What zip code has the Highest Percentage of Population Employed in Farming, Fishing & Forestry in Griffin, GA?
30224 has the Highest Percentage of Population Employed in Farming, Fishing & Forestry in Griffin, GA with 1.7%.
What is the Percentage of Population Employed in Farming, Fishing & Forestry in Griffin, GA?
Percentage of Population Employed in Farming, Fishing & Forestry in Griffin is 0.58%.
What is the Percentage of Population Employed in Farming, Fishing & Forestry in Georgia?
Percentage of Population Employed in Farming, Fishing & Forestry in Georgia is 0.45%.
What is the Percentage of Population Employed in Farming, Fishing & Forestry in the United States?
Percentage of Population Employed in Farming, Fishing & Forestry in the United States is 0.61%.