Zip Codes with the Highest Percentage of Households Residing in Detached Homes in Griffin, GA
RELATED REPORTS & OPTIONS
Detached Home Residency
Griffin
Compare Zip Codes
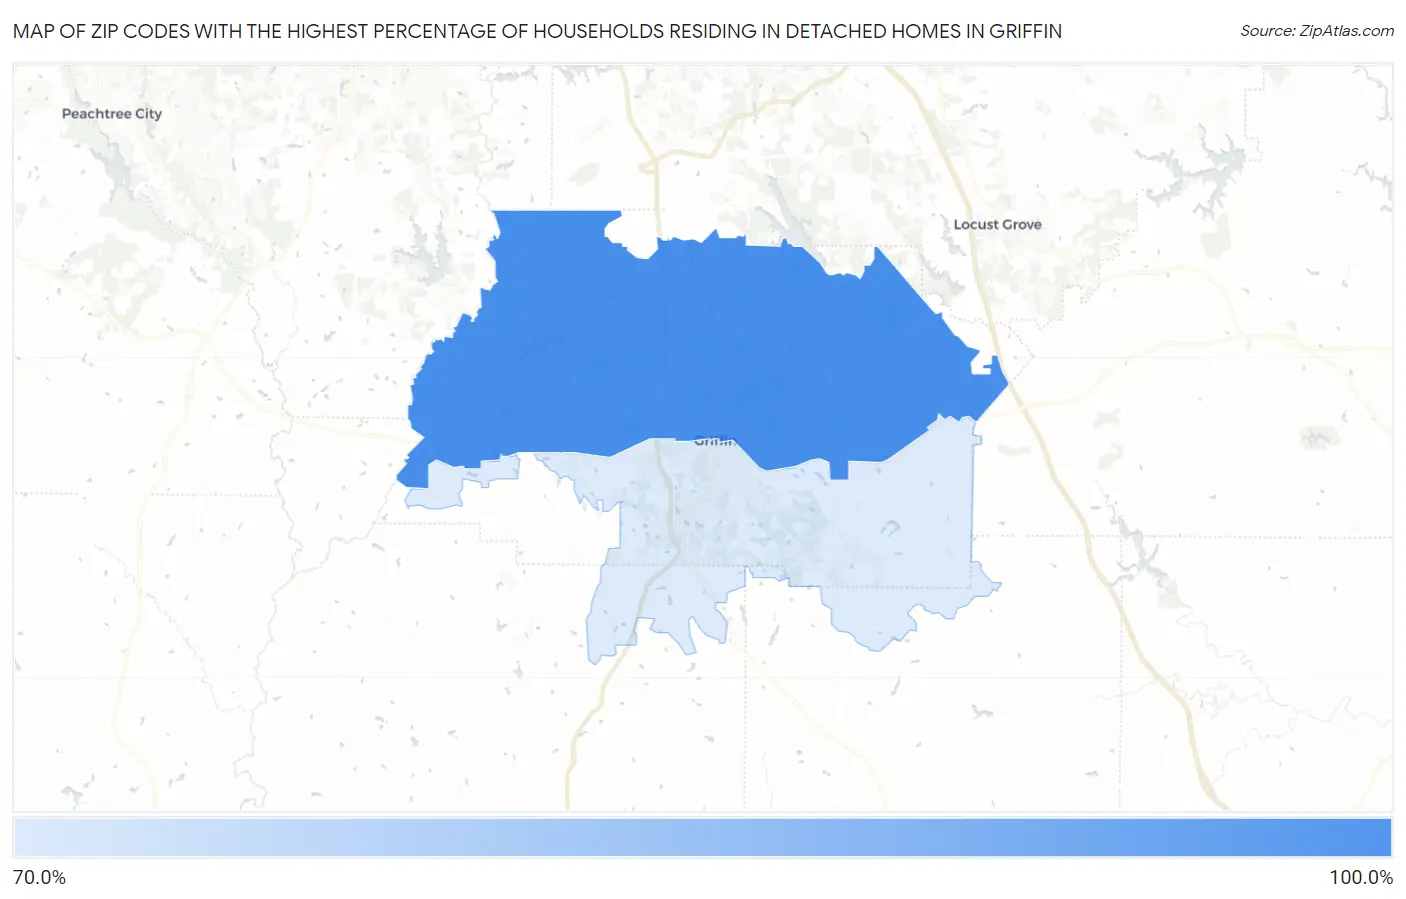
Map of Zip Codes with the Highest Percentage of Households Residing in Detached Homes in Griffin
0.0%
100.0%
Zip Codes with the Highest Percentage of Households Residing in Detached Homes in Griffin, GA
| Zip Code | Detached Home Residency | vs State | vs National | |
| 1. | 30223 | 82.2% | 68.0%(+14.2)#150 | 62.5%(+19.7)#12,439 |
| 2. | 30224 | 79.4% | 68.0%(+11.4)#181 | 62.5%(+16.9)#14,665 |
1
Common Questions
What are the Top Zip Codes with the Highest Percentage of Households Residing in Detached Homes in Griffin, GA?
Top Zip Codes with the Highest Percentage of Households Residing in Detached Homes in Griffin, GA are:
What zip code has the Highest Percentage of Households Residing in Detached Homes in Griffin, GA?
30223 has the Highest Percentage of Households Residing in Detached Homes in Griffin, GA with 82.2%.
What is the Percentage of Households Residing in Detached Homes in Griffin, GA?
Percentage of Households Residing in Detached Homes in Griffin is 67.2%.
What is the Percentage of Households Residing in Detached Homes in Georgia?
Percentage of Households Residing in Detached Homes in Georgia is 68.0%.
What is the Percentage of Households Residing in Detached Homes in the United States?
Percentage of Households Residing in Detached Homes in the United States is 62.5%.