Zip Codes with the Highest Percentage of Population with a Degree in Liberal Arts and History in Englewood, FL
RELATED REPORTS & OPTIONS
Liberal Arts and History
Englewood
Compare Zip Codes
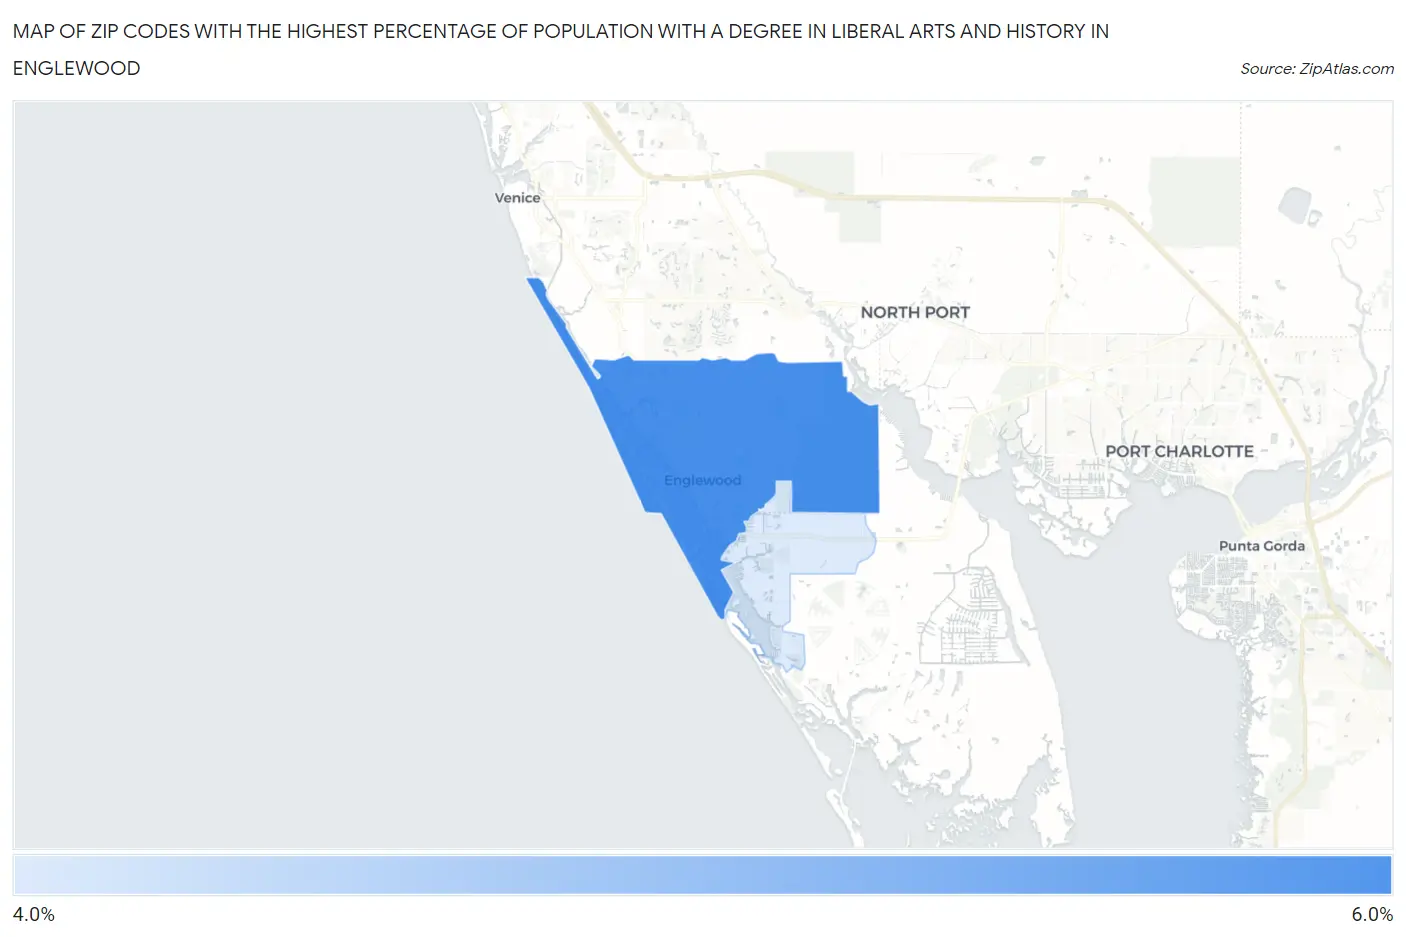
Map of Zip Codes with the Highest Percentage of Population with a Degree in Liberal Arts and History in Englewood
4.4%
5.6%
Zip Codes with the Highest Percentage of Population with a Degree in Liberal Arts and History in Englewood, FL
| Zip Code | % Graduates | vs State | vs National | |
| 1. | 34223 | 5.6% | 3.9%(+1.66)#199 | 4.9%(+0.706)#9,628 |
| 2. | 34224 | 4.4% | 3.9%(+0.462)#345 | 4.9%(-0.493)#13,361 |
1
Common Questions
What are the Top Zip Codes with the Highest Percentage of Population with a Degree in Liberal Arts and History in Englewood, FL?
Top Zip Codes with the Highest Percentage of Population with a Degree in Liberal Arts and History in Englewood, FL are:
What zip code has the Highest Percentage of Population with a Degree in Liberal Arts and History in Englewood, FL?
34223 has the Highest Percentage of Population with a Degree in Liberal Arts and History in Englewood, FL with 5.6%.
What is the Percentage of Population with a Degree in Liberal Arts and History in Englewood, FL?
Percentage of Population with a Degree in Liberal Arts and History in Englewood is 5.3%.
What is the Percentage of Population with a Degree in Liberal Arts and History in Florida?
Percentage of Population with a Degree in Liberal Arts and History in Florida is 3.9%.
What is the Percentage of Population with a Degree in Liberal Arts and History in the United States?
Percentage of Population with a Degree in Liberal Arts and History in the United States is 4.9%.