Trenton, FL Map & Demographics
Trenton Map
Trenton Overview
$21,866
PER CAPITA INCOME
$44,432
AVG FAMILY INCOME
$45,486
AVG HOUSEHOLD INCOME
29.0%
WAGE / INCOME GAP [ % ]
71.0¢/ $1
WAGE / INCOME GAP [ $ ]
$14,218
FAMILY INCOME DEFICIT
0.41
INEQUALITY / GINI INDEX
1,843
TOTAL POPULATION
857
MALE POPULATION
986
FEMALE POPULATION
86.92
MALES / 100 FEMALES
115.05
FEMALES / 100 MALES
37.6
MEDIAN AGE
2.9
AVG FAMILY SIZE
2.5
AVG HOUSEHOLD SIZE
779
LABOR FORCE [ PEOPLE ]
54.8%
PERCENT IN LABOR FORCE
4.7%
UNEMPLOYMENT RATE
Trenton Zip Codes
Trenton Area Codes
Income in Trenton
Income Overview in Trenton
Per Capita Income in Trenton is $21,866, while median incomes of families and households are $44,432 and $45,486 respectively.
| Characteristic | Number | Measure |
| Per Capita Income | 1,843 | $21,866 |
| Median Family Income | 445 | $44,432 |
| Mean Family Income | 445 | $52,828 |
| Median Household Income | 660 | $45,486 |
| Mean Household Income | 660 | $58,450 |
| Income Deficit | 445 | $14,218 |
| Wage / Income Gap (%) | 1,843 | 29.05% |
| Wage / Income Gap ($) | 1,843 | 70.95¢ per $1 |
| Gini / Inequality Index | 1,843 | 0.41 |
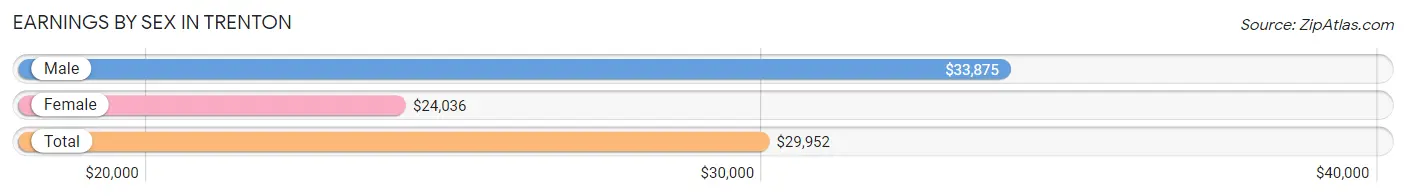
Earnings by Sex in Trenton
Average Earnings in Trenton are $29,952, $33,875 for men and $24,036 for women, a difference of 29.0%.
| Sex | Number | Average Earnings |
| Male | 440 (53.7%) | $33,875 |
| Female | 379 (46.3%) | $24,036 |
| Total | 819 (100.0%) | $29,952 |
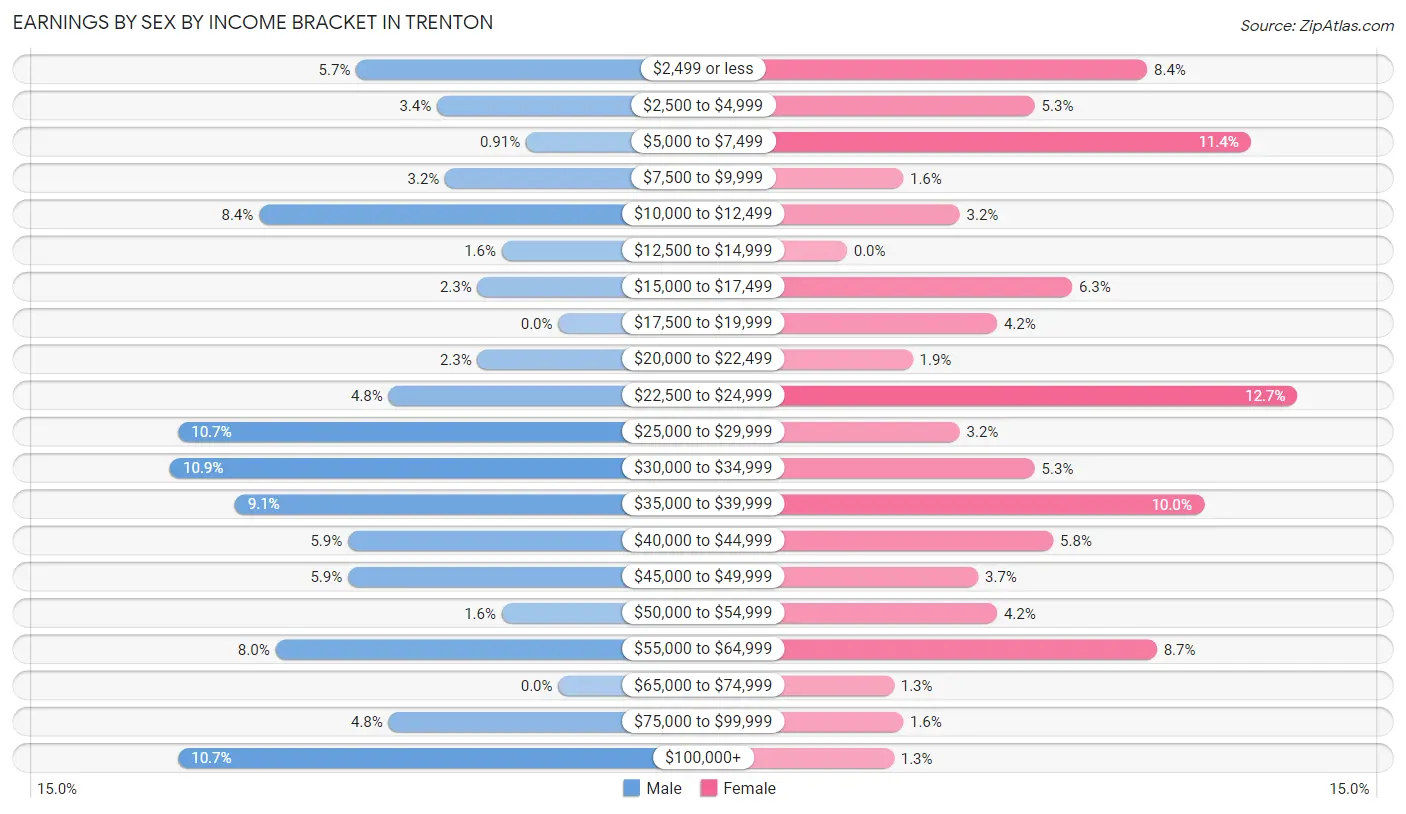
Earnings by Sex by Income Bracket in Trenton
The most common earnings brackets in Trenton are $30,000 to $34,999 for men (48 | 10.9%) and $22,500 to $24,999 for women (48 | 12.7%).
| Income | Male | Female |
| $2,499 or less | 25 (5.7%) | 32 (8.4%) |
| $2,500 to $4,999 | 15 (3.4%) | 20 (5.3%) |
| $5,000 to $7,499 | 4 (0.9%) | 43 (11.4%) |
| $7,500 to $9,999 | 14 (3.2%) | 6 (1.6%) |
| $10,000 to $12,499 | 37 (8.4%) | 12 (3.2%) |
| $12,500 to $14,999 | 7 (1.6%) | 0 (0.0%) |
| $15,000 to $17,499 | 10 (2.3%) | 24 (6.3%) |
| $17,500 to $19,999 | 0 (0.0%) | 16 (4.2%) |
| $20,000 to $22,499 | 10 (2.3%) | 7 (1.8%) |
| $22,500 to $24,999 | 21 (4.8%) | 48 (12.7%) |
| $25,000 to $29,999 | 47 (10.7%) | 12 (3.2%) |
| $30,000 to $34,999 | 48 (10.9%) | 20 (5.3%) |
| $35,000 to $39,999 | 40 (9.1%) | 38 (10.0%) |
| $40,000 to $44,999 | 26 (5.9%) | 22 (5.8%) |
| $45,000 to $49,999 | 26 (5.9%) | 14 (3.7%) |
| $50,000 to $54,999 | 7 (1.6%) | 16 (4.2%) |
| $55,000 to $64,999 | 35 (8.0%) | 33 (8.7%) |
| $65,000 to $74,999 | 0 (0.0%) | 5 (1.3%) |
| $75,000 to $99,999 | 21 (4.8%) | 6 (1.6%) |
| $100,000+ | 47 (10.7%) | 5 (1.3%) |
| Total | 440 (100.0%) | 379 (100.0%) |
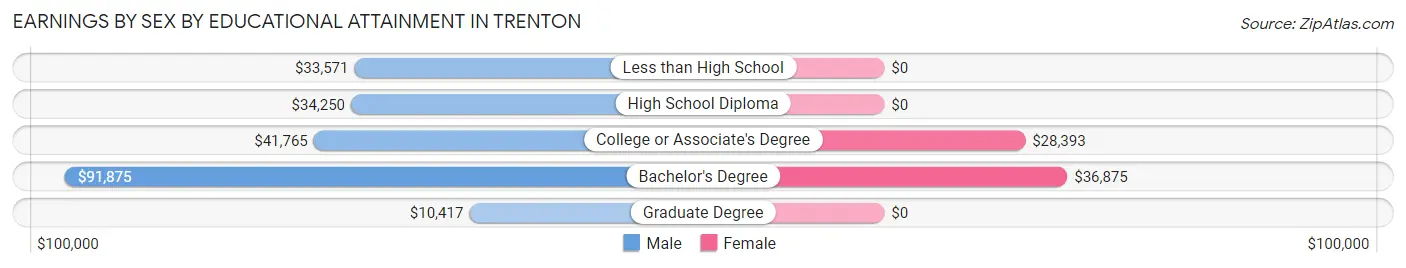
Earnings by Sex by Educational Attainment in Trenton
Average earnings in Trenton are $35,724 for men and $24,476 for women, a difference of 31.5%. Men with an educational attainment of bachelor's degree enjoy the highest average annual earnings of $91,875, while those with graduate degree education earn the least with $10,417. Women with an educational attainment of bachelor's degree earn the most with the average annual earnings of $36,875, while those with college or associate's degree education have the smallest earnings of $28,393.
| Educational Attainment | Male Income | Female Income |
| Less than High School | $33,571 | $0 |
| High School Diploma | $34,250 | $0 |
| College or Associate's Degree | $41,765 | $28,393 |
| Bachelor's Degree | $91,875 | $36,875 |
| Graduate Degree | $10,417 | $0 |
| Total | $35,724 | $24,476 |
Family Income in Trenton
Family Income Brackets in Trenton
According to the Trenton family income data, there are 100 families falling into the $35,000 to $49,999 income range, which is the most common income bracket and makes up 22.5% of all families.
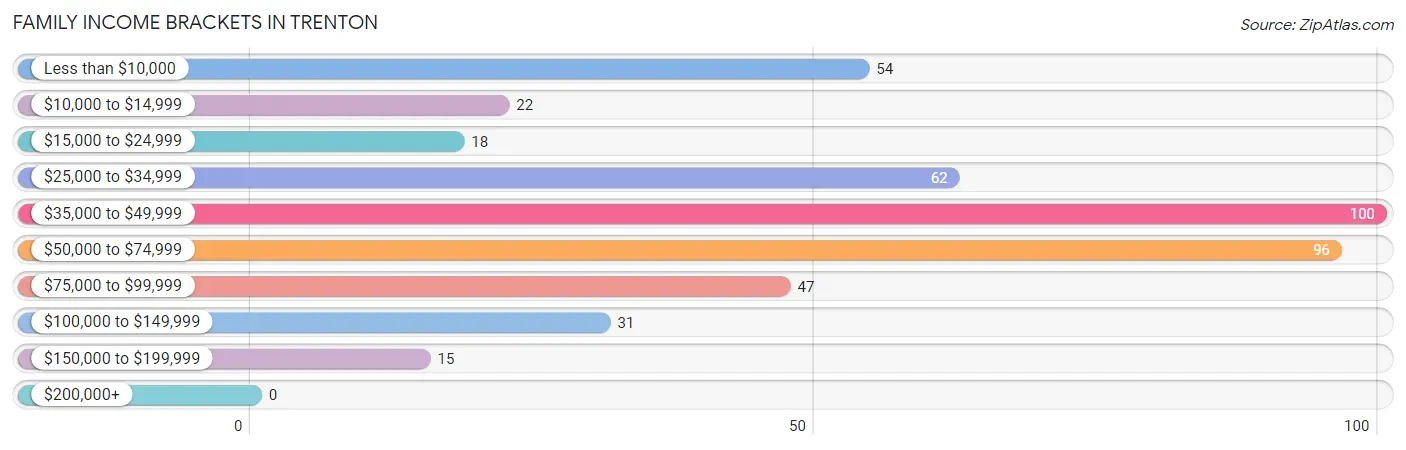
| Income Bracket | # Families | % Families |
| Less than $10,000 | 54 | 12.1% |
| $10,000 to $14,999 | 22 | 4.9% |
| $15,000 to $24,999 | 18 | 4.0% |
| $25,000 to $34,999 | 62 | 13.9% |
| $35,000 to $49,999 | 100 | 22.5% |
| $50,000 to $74,999 | 96 | 21.6% |
| $75,000 to $99,999 | 47 | 10.6% |
| $100,000 to $149,999 | 31 | 7.0% |
| $150,000 to $199,999 | 15 | 3.4% |
| $200,000+ | 0 | 0.0% |
Family Income by Famaliy Size in Trenton
4-person families (83 | 18.6%) account for the highest median family income in Trenton with $60,625 per family, while 2-person families (211 | 47.4%) have the highest median income of $21,771 per family member.
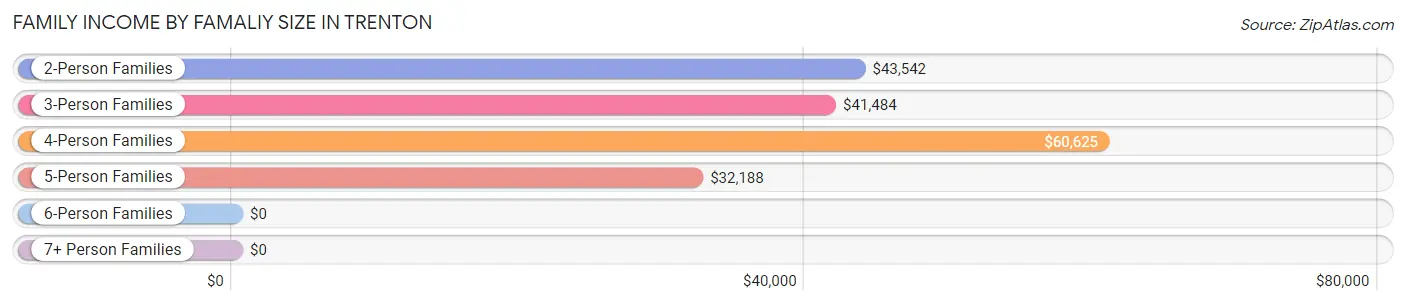
| Income Bracket | # Families | Median Income |
| 2-Person Families | 211 (47.4%) | $43,542 |
| 3-Person Families | 109 (24.5%) | $41,484 |
| 4-Person Families | 83 (18.6%) | $60,625 |
| 5-Person Families | 37 (8.3%) | $32,188 |
| 6-Person Families | 5 (1.1%) | $0 |
| 7+ Person Families | 0 (0.0%) | $0 |
| Total | 445 (100.0%) | $44,432 |
Family Income by Number of Earners in Trenton
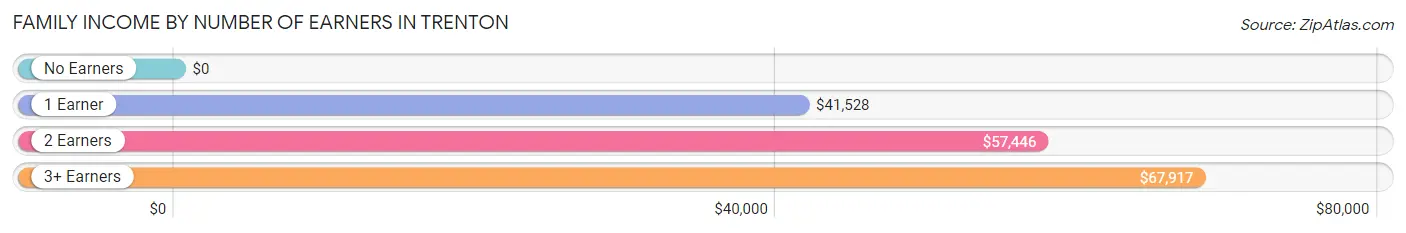
| Number of Earners | # Families | Median Income |
| No Earners | 91 (20.4%) | $0 |
| 1 Earner | 195 (43.8%) | $41,528 |
| 2 Earners | 131 (29.4%) | $57,446 |
| 3+ Earners | 28 (6.3%) | $67,917 |
| Total | 445 (100.0%) | $44,432 |
Household Income in Trenton
Household Income Brackets in Trenton
With 134 households falling in the category, the $35,000 to $49,999 income range is the most frequent in Trenton, accounting for 20.3% of all households. In contrast, only 4 households (0.6%) fall into the $200,000+ income bracket, making it the least populous group.
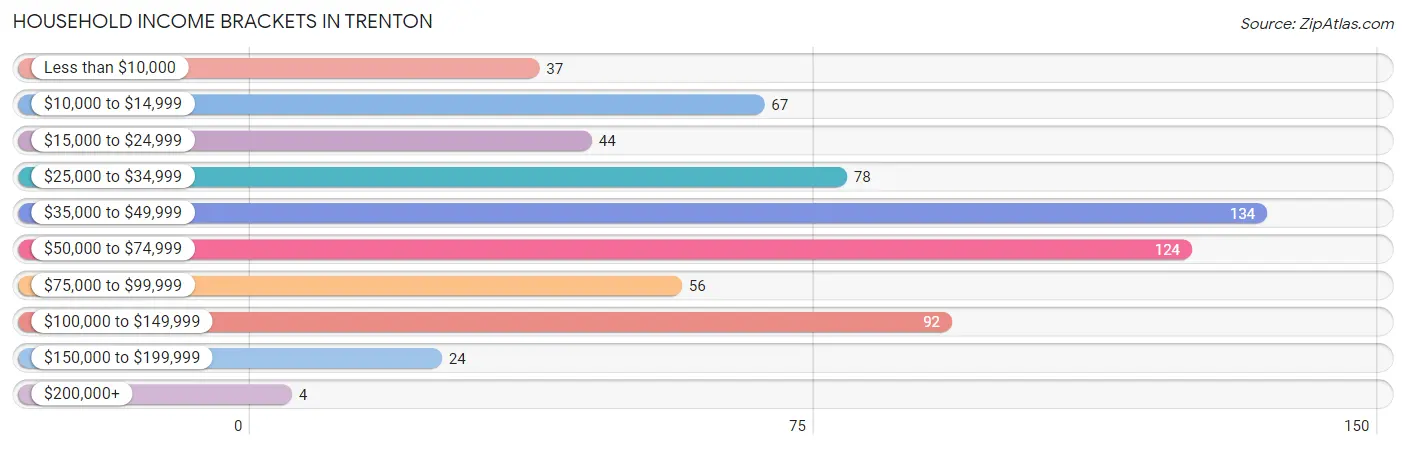
| Income Bracket | # Households | % Households |
| Less than $10,000 | 37 | 5.6% |
| $10,000 to $14,999 | 67 | 10.2% |
| $15,000 to $24,999 | 44 | 6.7% |
| $25,000 to $34,999 | 78 | 11.8% |
| $35,000 to $49,999 | 134 | 20.3% |
| $50,000 to $74,999 | 124 | 18.8% |
| $75,000 to $99,999 | 56 | 8.5% |
| $100,000 to $149,999 | 92 | 13.9% |
| $150,000 to $199,999 | 24 | 3.6% |
| $200,000+ | 4 | 0.6% |
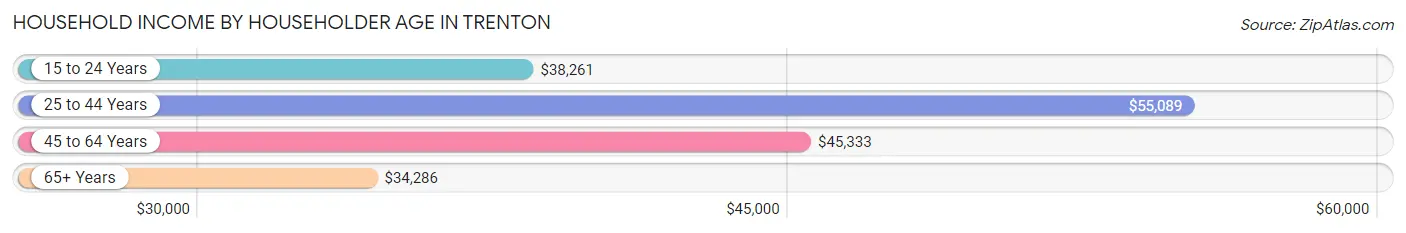
Household Income by Householder Age in Trenton
The median household income in Trenton is $45,486, with the highest median household income of $55,089 found in the 25 to 44 years age bracket for the primary householder. A total of 242 households (36.7%) fall into this category. Meanwhile, the 65+ years age bracket for the primary householder has the lowest median household income of $34,286, with 96 households (14.5%) in this group.
| Income Bracket | # Households | Median Income |
| 15 to 24 Years | 32 (4.9%) | $38,261 |
| 25 to 44 Years | 242 (36.7%) | $55,089 |
| 45 to 64 Years | 290 (43.9%) | $45,333 |
| 65+ Years | 96 (14.5%) | $34,286 |
| Total | 660 (100.0%) | $45,486 |
Poverty in Trenton
Income Below Poverty by Sex and Age in Trenton
With 20.5% poverty level for males and 34.9% for females among the residents of Trenton, 12 to 14 year old males and 6 to 11 year old females are the most vulnerable to poverty, with 15 males (75.0%) and 33 females (58.9%) in their respective age groups living below the poverty level.
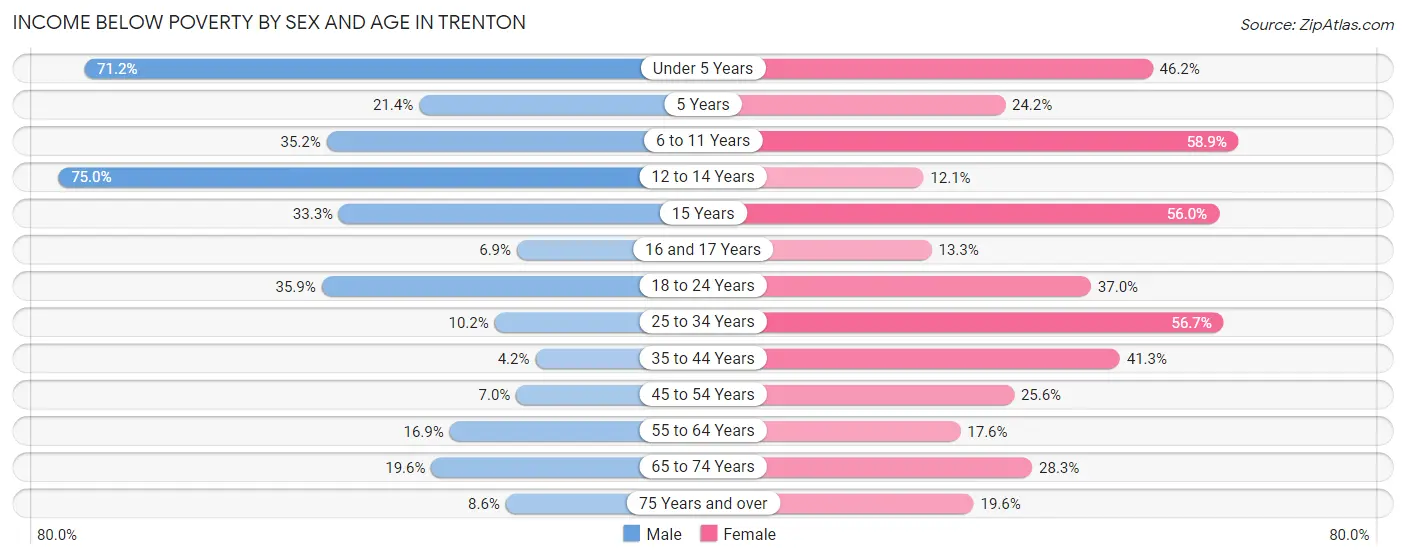
| Age Bracket | Male | Female |
| Under 5 Years | 37 (71.2%) | 24 (46.2%) |
| 5 Years | 3 (21.4%) | 8 (24.2%) |
| 6 to 11 Years | 32 (35.2%) | 33 (58.9%) |
| 12 to 14 Years | 15 (75.0%) | 4 (12.1%) |
| 15 Years | 4 (33.3%) | 14 (56.0%) |
| 16 and 17 Years | 4 (6.9%) | 4 (13.3%) |
| 18 to 24 Years | 14 (35.9%) | 27 (37.0%) |
| 25 to 34 Years | 14 (10.2%) | 72 (56.7%) |
| 35 to 44 Years | 4 (4.2%) | 45 (41.3%) |
| 45 to 54 Years | 7 (7.0%) | 23 (25.6%) |
| 55 to 64 Years | 12 (16.9%) | 25 (17.6%) |
| 65 to 74 Years | 10 (19.6%) | 13 (28.3%) |
| 75 Years and over | 3 (8.6%) | 9 (19.6%) |
| Total | 159 (20.5%) | 301 (34.9%) |
Income Above Poverty by Sex and Age in Trenton
According to the poverty statistics in Trenton, males aged 35 to 44 years and females aged 12 to 14 years are the age groups that are most secure financially, with 95.8% of males and 87.9% of females in these age groups living above the poverty line.
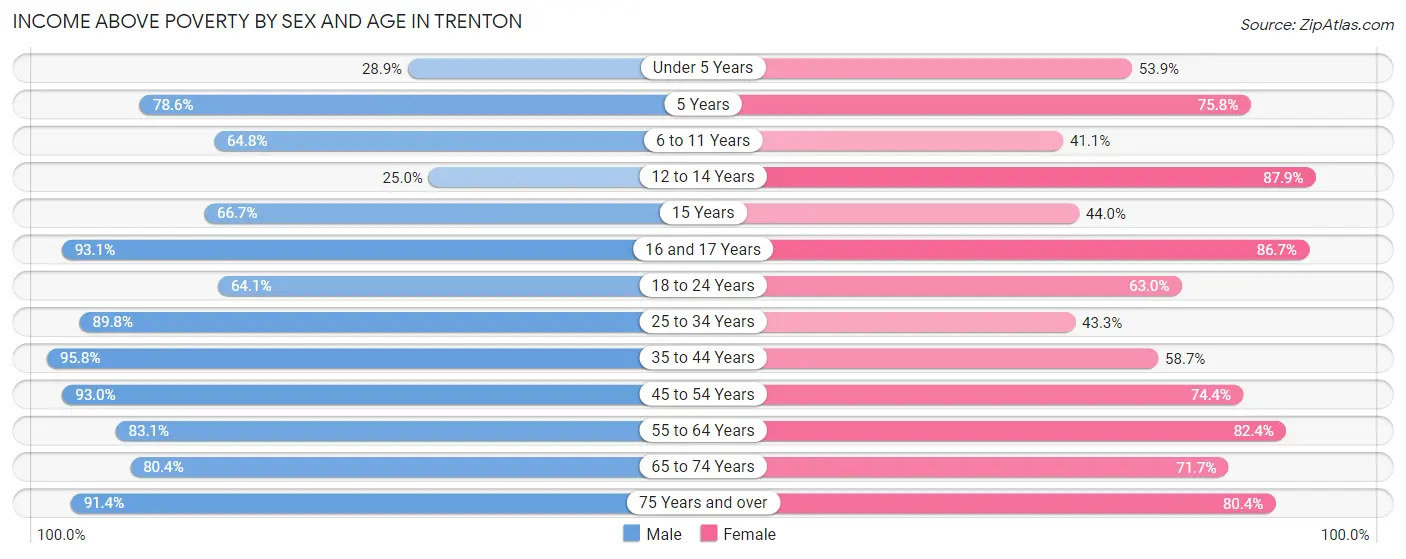
| Age Bracket | Male | Female |
| Under 5 Years | 15 (28.8%) | 28 (53.8%) |
| 5 Years | 11 (78.6%) | 25 (75.8%) |
| 6 to 11 Years | 59 (64.8%) | 23 (41.1%) |
| 12 to 14 Years | 5 (25.0%) | 29 (87.9%) |
| 15 Years | 8 (66.7%) | 11 (44.0%) |
| 16 and 17 Years | 54 (93.1%) | 26 (86.7%) |
| 18 to 24 Years | 25 (64.1%) | 46 (63.0%) |
| 25 to 34 Years | 123 (89.8%) | 55 (43.3%) |
| 35 to 44 Years | 92 (95.8%) | 64 (58.7%) |
| 45 to 54 Years | 93 (93.0%) | 67 (74.4%) |
| 55 to 64 Years | 59 (83.1%) | 117 (82.4%) |
| 65 to 74 Years | 41 (80.4%) | 33 (71.7%) |
| 75 Years and over | 32 (91.4%) | 37 (80.4%) |
| Total | 617 (79.5%) | 561 (65.1%) |
Income Below Poverty Among Married-Couple Families in Trenton
The poverty statistics for married-couple families in Trenton show that 19.1% or 35 of the total 183 families live below the poverty line. Families with 3 or 4 children have the highest poverty rate of 35.7%, comprising of 10 families. On the other hand, families with no children have the lowest poverty rate of 9.5%, which includes 10 families.
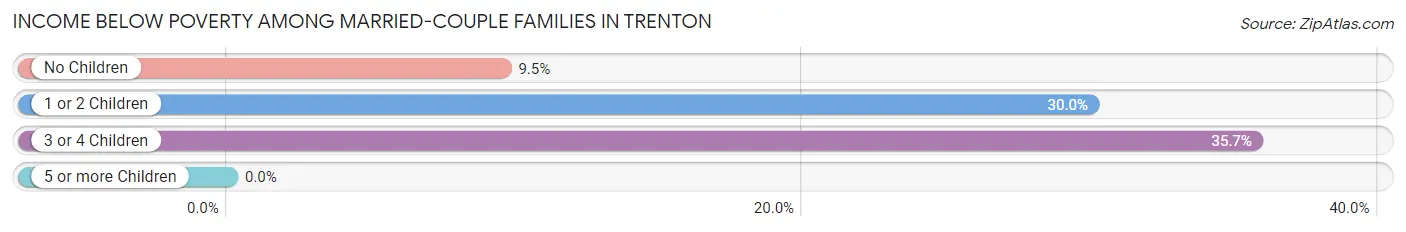
| Children | Above Poverty | Below Poverty |
| No Children | 95 (90.5%) | 10 (9.5%) |
| 1 or 2 Children | 35 (70.0%) | 15 (30.0%) |
| 3 or 4 Children | 18 (64.3%) | 10 (35.7%) |
| 5 or more Children | 0 (0.0%) | 0 (0.0%) |
| Total | 148 (80.9%) | 35 (19.1%) |
Income Below Poverty Among Single-Parent Households in Trenton
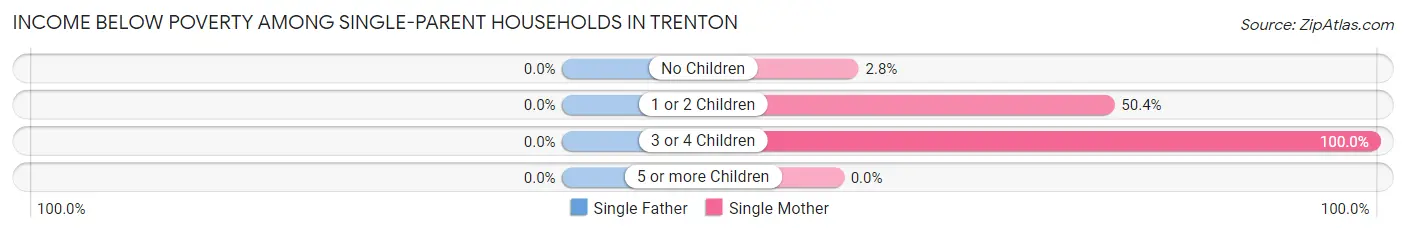
| Children | Single Father | Single Mother |
| No Children | 0 (0.0%) | 1 (2.8%) |
| 1 or 2 Children | 0 (0.0%) | 58 (50.4%) |
| 3 or 4 Children | 0 (0.0%) | 12 (100.0%) |
| 5 or more Children | 0 (0.0%) | 0 (0.0%) |
| Total | 0 (0.0%) | 71 (43.6%) |
Income Below Poverty Among Married-Couple vs Single-Parent Households in Trenton
The poverty data for Trenton shows that 35 of the married-couple family households (19.1%) and 71 of the single-parent households (27.1%) are living below the poverty level. Within the married-couple family households, those with 3 or 4 children have the highest poverty rate, with 10 households (35.7%) falling below the poverty line. Among the single-parent households, those with 3 or 4 children have the highest poverty rate, with 12 household (42.9%) living below poverty.
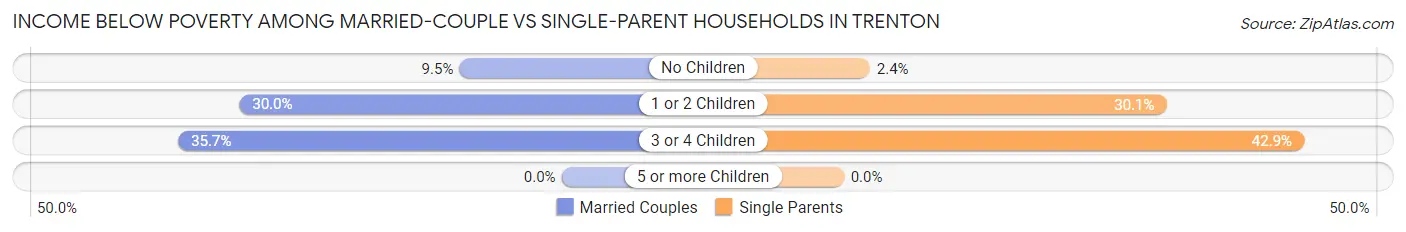
| Children | Married-Couple Families | Single-Parent Households |
| No Children | 10 (9.5%) | 1 (2.4%) |
| 1 or 2 Children | 15 (30.0%) | 58 (30.0%) |
| 3 or 4 Children | 10 (35.7%) | 12 (42.9%) |
| 5 or more Children | 0 (0.0%) | 0 (0.0%) |
| Total | 35 (19.1%) | 71 (27.1%) |
Race in Trenton
The most populous races in Trenton are White / Caucasian (1,436 | 77.9%), Hispanic or Latino (291 | 15.8%), and Black / African American (175 | 9.5%).
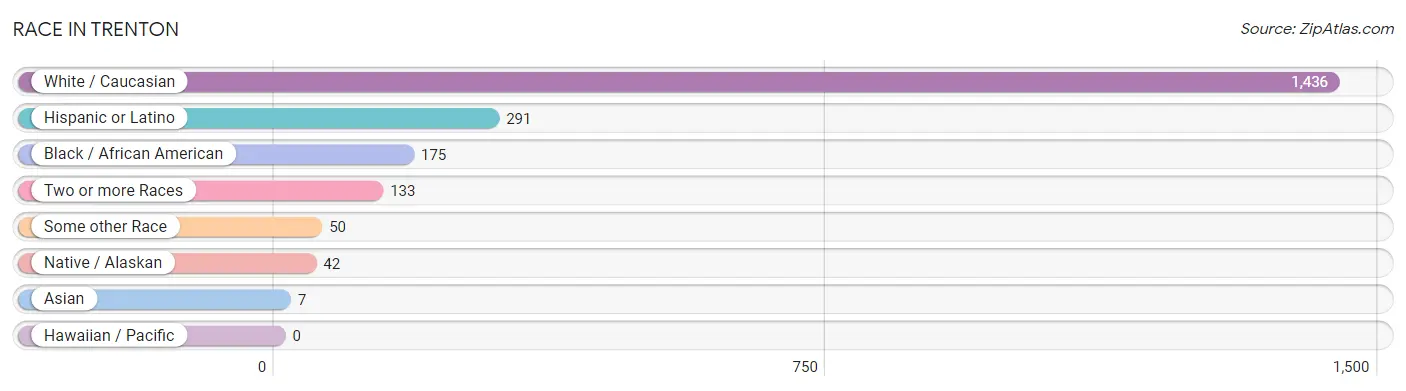
| Race | # Population | % Population |
| Asian | 7 | 0.4% |
| Black / African American | 175 | 9.5% |
| Hawaiian / Pacific | 0 | 0.0% |
| Hispanic or Latino | 291 | 15.8% |
| Native / Alaskan | 42 | 2.3% |
| White / Caucasian | 1,436 | 77.9% |
| Two or more Races | 133 | 7.2% |
| Some other Race | 50 | 2.7% |
| Total | 1,843 | 100.0% |
Ancestry in Trenton
The most populous ancestries reported in Trenton are German (278 | 15.1%), American (145 | 7.9%), English (122 | 6.6%), Mexican (110 | 6.0%), and Irish (106 | 5.8%), together accounting for 41.3% of all Trenton residents.
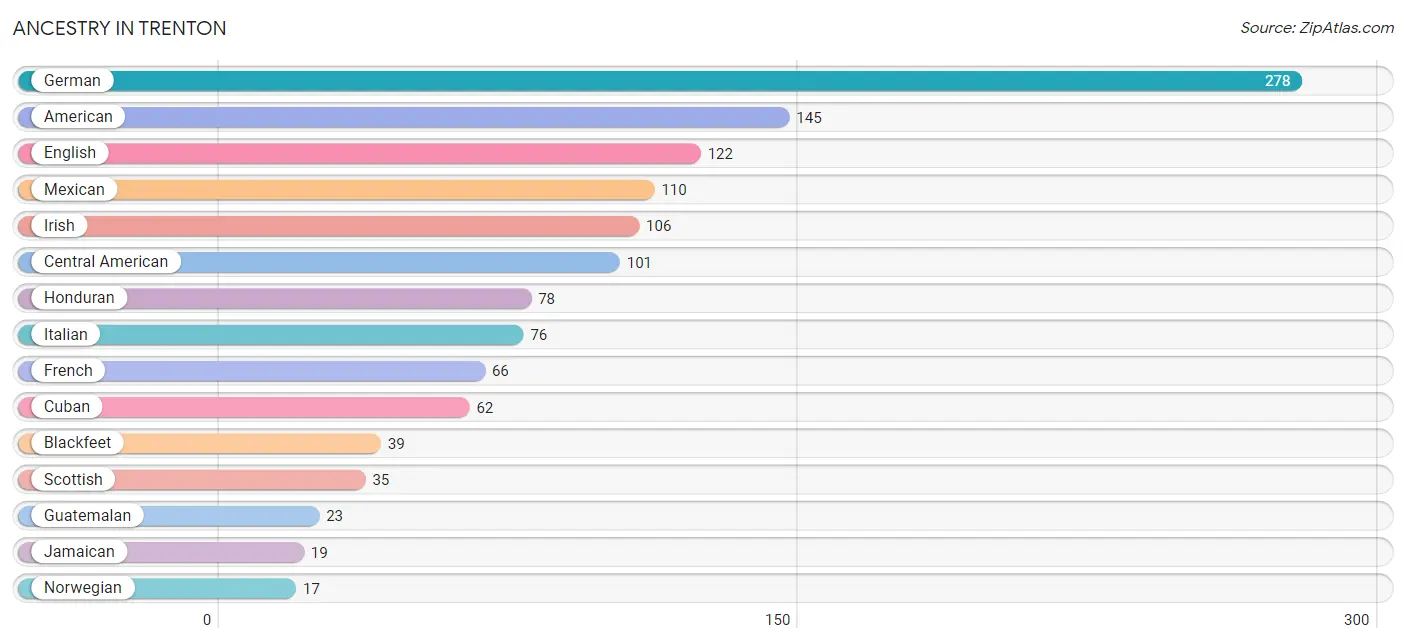
| Ancestry | # Population | % Population |
| African | 2 | 0.1% |
| American | 145 | 7.9% |
| Argentinean | 6 | 0.3% |
| Armenian | 2 | 0.1% |
| Austrian | 3 | 0.2% |
| Blackfeet | 39 | 2.1% |
| Brazilian | 8 | 0.4% |
| Central American | 101 | 5.5% |
| Cherokee | 10 | 0.5% |
| Cuban | 62 | 3.4% |
| Dutch | 3 | 0.2% |
| English | 122 | 6.6% |
| European | 7 | 0.4% |
| Finnish | 5 | 0.3% |
| French | 66 | 3.6% |
| German | 278 | 15.1% |
| Greek | 3 | 0.2% |
| Guatemalan | 23 | 1.3% |
| Honduran | 78 | 4.2% |
| Hungarian | 3 | 0.2% |
| Irish | 106 | 5.8% |
| Italian | 76 | 4.1% |
| Jamaican | 19 | 1.0% |
| Korean | 10 | 0.5% |
| Mexican | 110 | 6.0% |
| Northern European | 3 | 0.2% |
| Norwegian | 17 | 0.9% |
| Polish | 17 | 0.9% |
| Puerto Rican | 3 | 0.2% |
| Russian | 4 | 0.2% |
| Scandinavian | 2 | 0.1% |
| Scotch-Irish | 16 | 0.9% |
| Scottish | 35 | 1.9% |
| Seminole | 2 | 0.1% |
| Sioux | 1 | 0.1% |
| South American | 6 | 0.3% |
| Spanish | 9 | 0.5% |
| Subsaharan African | 2 | 0.1% |
| Swedish | 3 | 0.2% |
| Welsh | 9 | 0.5% | View All 40 Rows |
Immigrants in Trenton
The most numerous immigrant groups reported in Trenton came from Latin America (196 | 10.6%), Central America (155 | 8.4%), Honduras (78 | 4.2%), Mexico (59 | 3.2%), and Caribbean (27 | 1.5%), together accounting for 27.9% of all Trenton residents.
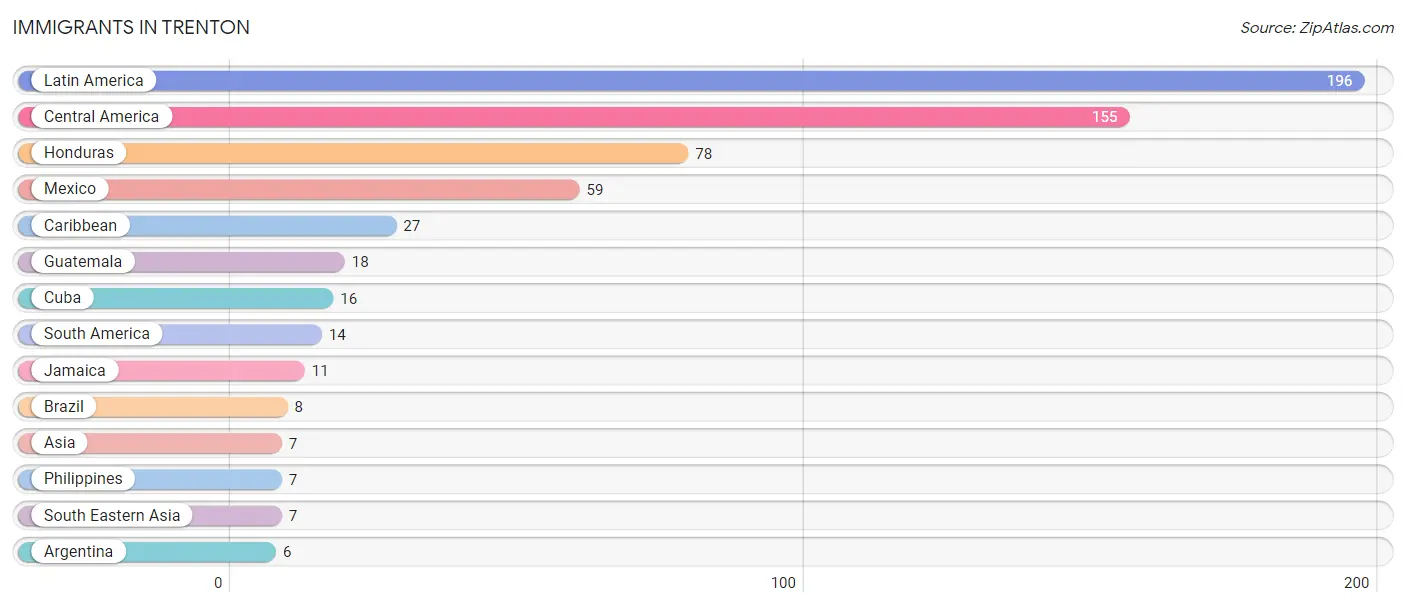
| Immigration Origin | # Population | % Population |
| Argentina | 6 | 0.3% |
| Asia | 7 | 0.4% |
| Brazil | 8 | 0.4% |
| Caribbean | 27 | 1.5% |
| Central America | 155 | 8.4% |
| Cuba | 16 | 0.9% |
| Guatemala | 18 | 1.0% |
| Honduras | 78 | 4.2% |
| Jamaica | 11 | 0.6% |
| Latin America | 196 | 10.6% |
| Mexico | 59 | 3.2% |
| Philippines | 7 | 0.4% |
| South America | 14 | 0.8% |
| South Eastern Asia | 7 | 0.4% | View All 14 Rows |
Sex and Age in Trenton
Sex and Age in Trenton
The most populous age groups in Trenton are 30 to 34 Years (81 | 9.5%) for men and 5 to 9 Years (89 | 9.0%) for women.
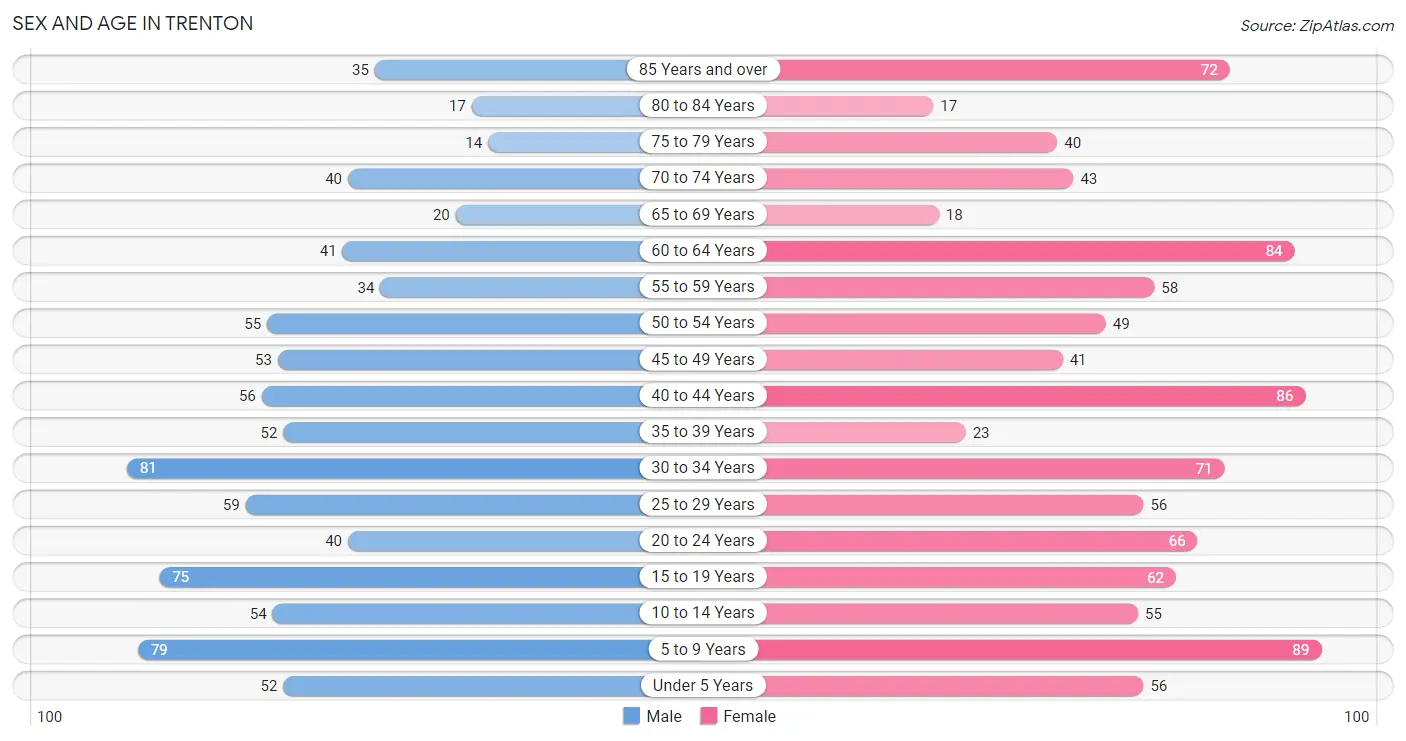
| Age Bracket | Male | Female |
| Under 5 Years | 52 (6.1%) | 56 (5.7%) |
| 5 to 9 Years | 79 (9.2%) | 89 (9.0%) |
| 10 to 14 Years | 54 (6.3%) | 55 (5.6%) |
| 15 to 19 Years | 75 (8.7%) | 62 (6.3%) |
| 20 to 24 Years | 40 (4.7%) | 66 (6.7%) |
| 25 to 29 Years | 59 (6.9%) | 56 (5.7%) |
| 30 to 34 Years | 81 (9.5%) | 71 (7.2%) |
| 35 to 39 Years | 52 (6.1%) | 23 (2.3%) |
| 40 to 44 Years | 56 (6.5%) | 86 (8.7%) |
| 45 to 49 Years | 53 (6.2%) | 41 (4.2%) |
| 50 to 54 Years | 55 (6.4%) | 49 (5.0%) |
| 55 to 59 Years | 34 (4.0%) | 58 (5.9%) |
| 60 to 64 Years | 41 (4.8%) | 84 (8.5%) |
| 65 to 69 Years | 20 (2.3%) | 18 (1.8%) |
| 70 to 74 Years | 40 (4.7%) | 43 (4.4%) |
| 75 to 79 Years | 14 (1.6%) | 40 (4.1%) |
| 80 to 84 Years | 17 (2.0%) | 17 (1.7%) |
| 85 Years and over | 35 (4.1%) | 72 (7.3%) |
| Total | 857 (100.0%) | 986 (100.0%) |
Families and Households in Trenton
Median Family Size in Trenton
The median family size in Trenton is 2.88 persons per family, with married-couple families (183 | 41.1%) accounting for the largest median family size of 3.26 persons per family. On the other hand, single female/mother families (163 | 36.6%) represent the smallest median family size with 2.46 persons per family.
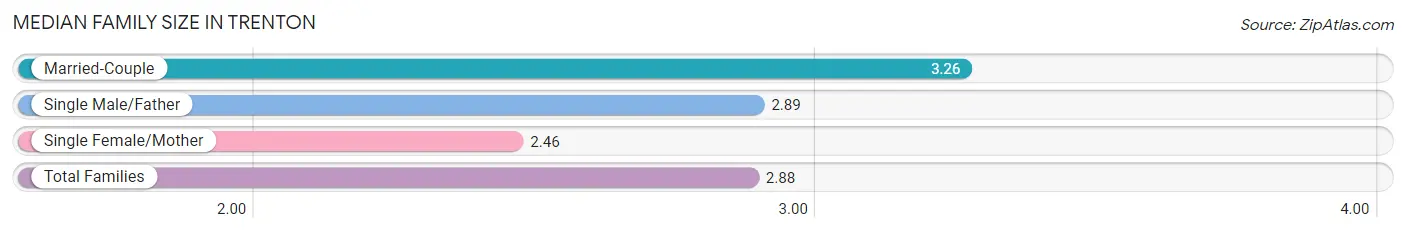
| Family Type | # Families | Family Size |
| Married-Couple | 183 (41.1%) | 3.26 |
| Single Male/Father | 99 (22.3%) | 2.89 |
| Single Female/Mother | 163 (36.6%) | 2.46 |
| Total Families | 445 (100.0%) | 2.88 |
Median Household Size in Trenton
The median household size in Trenton is 2.53 persons per household, with single male/father households (99 | 15.0%) accounting for the largest median household size of 3.62 persons per household. non-family households (215 | 32.6%) represent the smallest median household size with 1.27 persons per household.
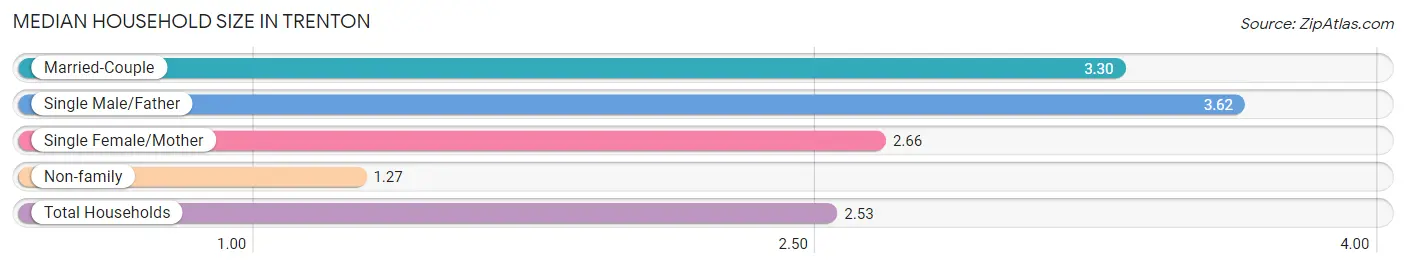
| Household Type | # Households | Household Size |
| Married-Couple | 183 (27.7%) | 3.30 |
| Single Male/Father | 99 (15.0%) | 3.62 |
| Single Female/Mother | 163 (24.7%) | 2.66 |
| Non-family | 215 (32.6%) | 1.27 |
| Total Households | 660 (100.0%) | 2.53 |
Household Size by Marriage Status in Trenton
Out of a total of 660 households in Trenton, 445 (67.4%) are family households, while 215 (32.6%) are nonfamily households. The most numerous type of family households are 2-person households, comprising 170, and the most common type of nonfamily households are 1-person households, comprising 167.
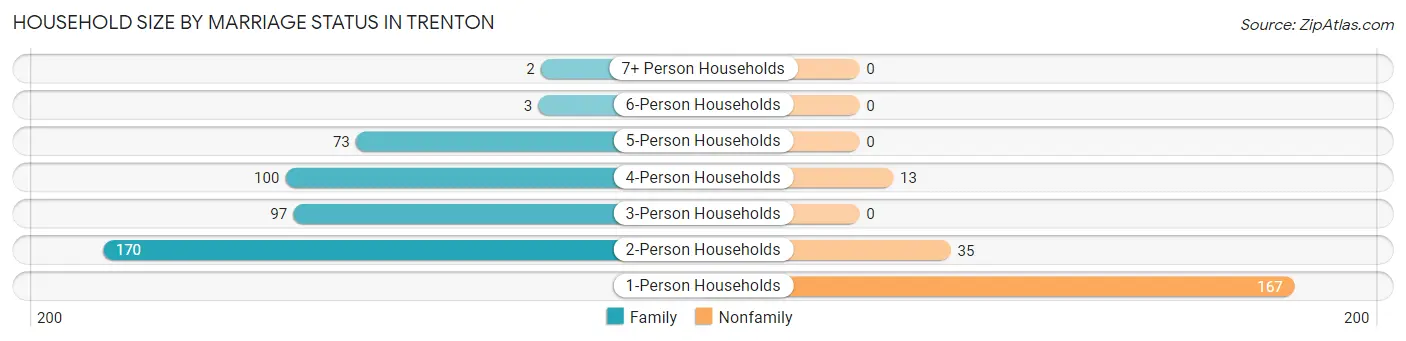
| Household Size | Family Households | Nonfamily Households |
| 1-Person Households | - | 167 (25.3%) |
| 2-Person Households | 170 (25.8%) | 35 (5.3%) |
| 3-Person Households | 97 (14.7%) | 0 (0.0%) |
| 4-Person Households | 100 (15.1%) | 13 (2.0%) |
| 5-Person Households | 73 (11.1%) | 0 (0.0%) |
| 6-Person Households | 3 (0.4%) | 0 (0.0%) |
| 7+ Person Households | 2 (0.3%) | 0 (0.0%) |
| Total | 445 (67.4%) | 215 (32.6%) |
Female Fertility in Trenton
Fertility by Age in Trenton
Average fertility rate in Trenton is 98.0 births per 1,000 women. Women in the age bracket of 20 to 34 years have the highest fertility rate with 207.0 births per 1,000 women. Women in the age bracket of 20 to 34 years acount for 100.0% of all women with births.
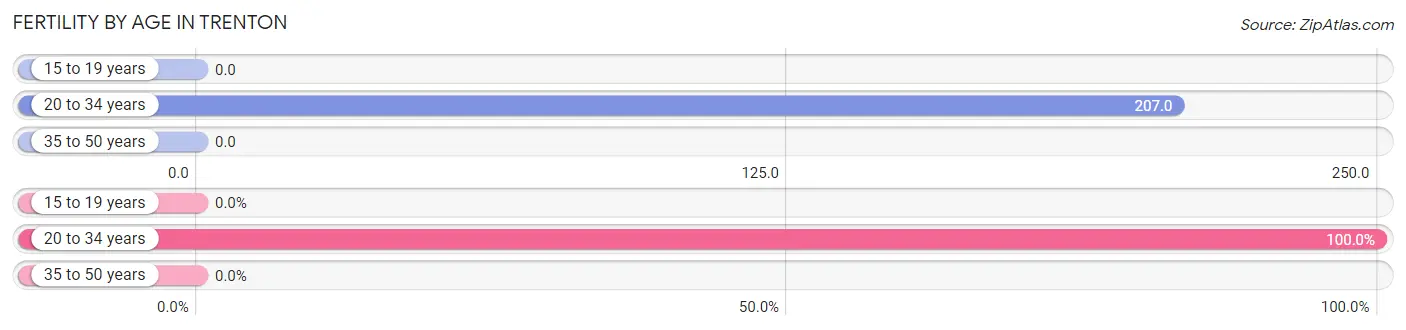
| Age Bracket | Women with Births | Births / 1,000 Women |
| 15 to 19 years | 0 (0.0%) | 0.0 |
| 20 to 34 years | 40 (100.0%) | 207.0 |
| 35 to 50 years | 0 (0.0%) | 0.0 |
| Total | 40 (100.0%) | 98.0 |
Fertility by Age by Marriage Status in Trenton
80.0% of women with births (40) in Trenton are married. The highest percentage of unmarried women with births falls into 20 to 34 years age bracket with 20.0% of them unmarried at the time of birth, while the lowest percentage of unmarried women with births belong to 20 to 34 years age bracket with 20.0% of them unmarried.
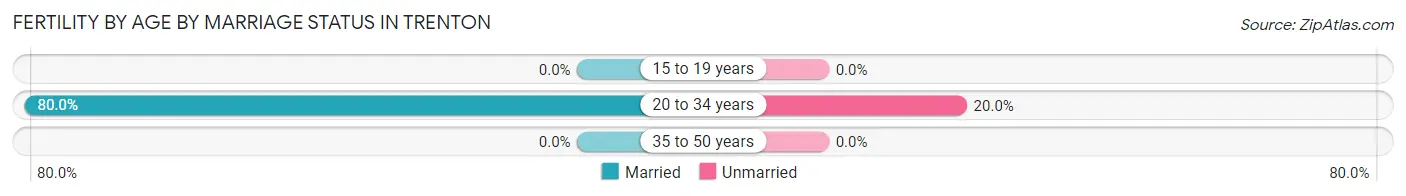
| Age Bracket | Married | Unmarried |
| 15 to 19 years | 0 (0.0%) | 0 (0.0%) |
| 20 to 34 years | 32 (80.0%) | 8 (20.0%) |
| 35 to 50 years | 0 (0.0%) | 0 (0.0%) |
| Total | 32 (80.0%) | 8 (20.0%) |
Fertility by Education in Trenton
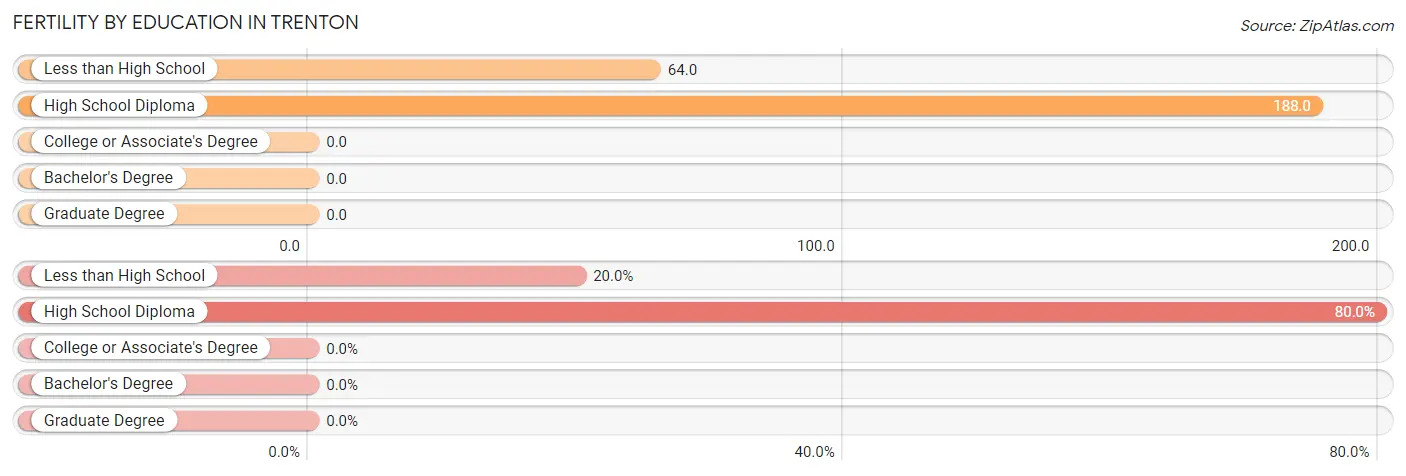
| Educational Attainment | Women with Births | Births / 1,000 Women |
| Less than High School | 8 (20.0%) | 64.0 |
| High School Diploma | 32 (80.0%) | 188.0 |
| College or Associate's Degree | 0 (0.0%) | 0.0 |
| Bachelor's Degree | 0 (0.0%) | 0.0 |
| Graduate Degree | 0 (0.0%) | 0.0 |
| Total | 40 (100.0%) | 98.0 |
Fertility by Education by Marriage Status in Trenton
20.0% of women with births in Trenton are unmarried. Women with the educational attainment of high school diploma are most likely to be married with 100.0% of them married at childbirth, while women with the educational attainment of less than high school are least likely to be married with 100.0% of them unmarried at childbirth.
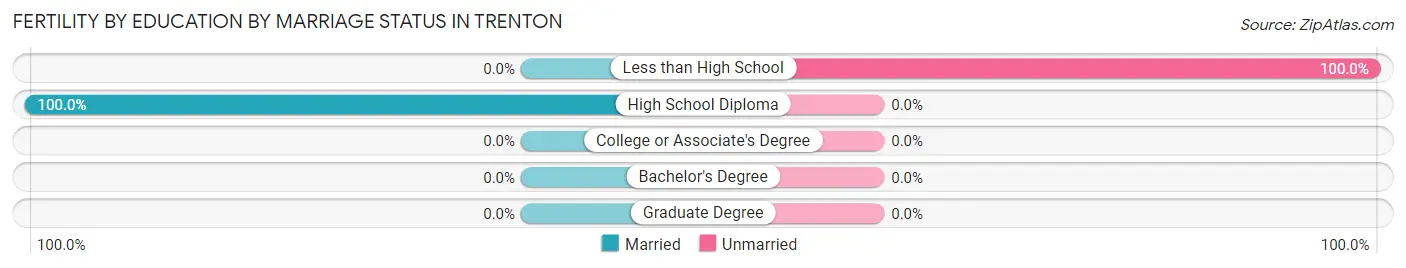
| Educational Attainment | Married | Unmarried |
| Less than High School | 0 (0.0%) | 8 (100.0%) |
| High School Diploma | 32 (100.0%) | 0 (0.0%) |
| College or Associate's Degree | 0 (0.0%) | 0 (0.0%) |
| Bachelor's Degree | 0 (0.0%) | 0 (0.0%) |
| Graduate Degree | 0 (0.0%) | 0 (0.0%) |
| Total | 32 (80.0%) | 8 (20.0%) |
Employment Characteristics in Trenton
Employment by Class of Employer in Trenton
Among the 703 employed individuals in Trenton, private company employees (424 | 60.3%), local government employees (91 | 12.9%), and self-employed (not incorporated) (84 | 11.9%) make up the most common classes of employment.
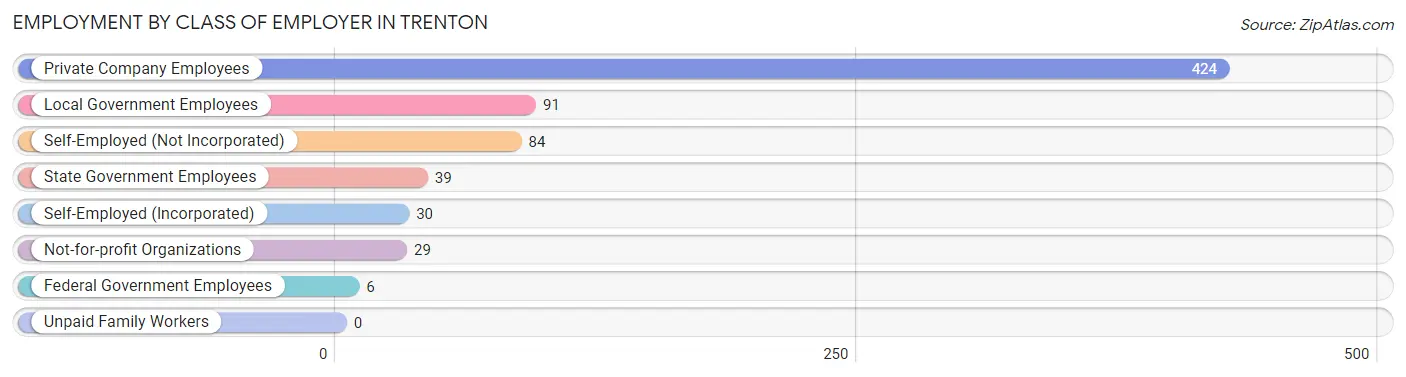
| Employer Class | # Employees | % Employees |
| Private Company Employees | 424 | 60.3% |
| Self-Employed (Incorporated) | 30 | 4.3% |
| Self-Employed (Not Incorporated) | 84 | 11.9% |
| Not-for-profit Organizations | 29 | 4.1% |
| Local Government Employees | 91 | 12.9% |
| State Government Employees | 39 | 5.6% |
| Federal Government Employees | 6 | 0.9% |
| Unpaid Family Workers | 0 | 0.0% |
| Total | 703 | 100.0% |
Employment Status by Age in Trenton
According to the labor force statistics for Trenton, out of the total population over 16 years of age (1,421), 54.8% or 779 individuals are in the labor force, with 4.7% or 37 of them unemployed. The age group with the highest labor force participation rate is 30 to 34 years, with 88.2% or 134 individuals in the labor force. Within the labor force, the 45 to 54 years age range has the highest percentage of unemployed individuals, with 14.1% or 23 of them being unemployed.
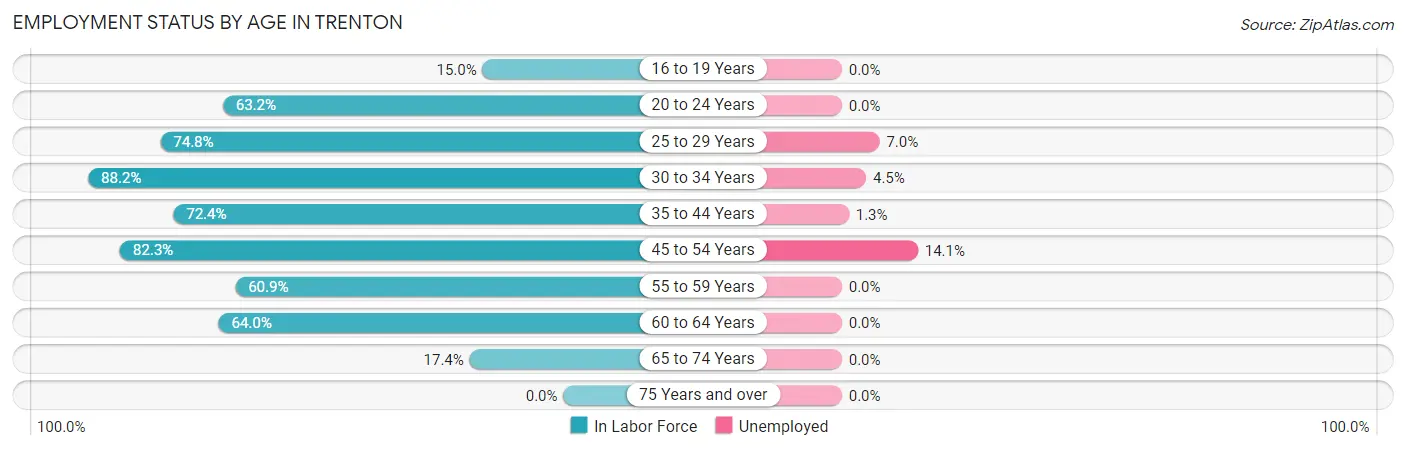
| Age Bracket | In Labor Force | Unemployed |
| 16 to 19 Years | 15 (15.0%) | 0 (0.0%) |
| 20 to 24 Years | 67 (63.2%) | 0 (0.0%) |
| 25 to 29 Years | 86 (74.8%) | 6 (7.0%) |
| 30 to 34 Years | 134 (88.2%) | 6 (4.5%) |
| 35 to 44 Years | 157 (72.4%) | 2 (1.3%) |
| 45 to 54 Years | 163 (82.3%) | 23 (14.1%) |
| 55 to 59 Years | 56 (60.9%) | 0 (0.0%) |
| 60 to 64 Years | 80 (64.0%) | 0 (0.0%) |
| 65 to 74 Years | 21 (17.4%) | 0 (0.0%) |
| 75 Years and over | 0 (0.0%) | 0 (0.0%) |
| Total | 779 (54.8%) | 37 (4.7%) |
Employment Status by Educational Attainment in Trenton
According to labor force statistics for Trenton, 75.2% of individuals (676) out of the total population between 25 and 64 years of age (899) are in the labor force, with 5.5% or 37 of them being unemployed. The group with the highest labor force participation rate are those with the educational attainment of bachelor's degree or higher, with 84.2% or 80 individuals in the labor force. Within the labor force, individuals with less than high school education have the highest percentage of unemployment, with 12.3% or 8 of them being unemployed.
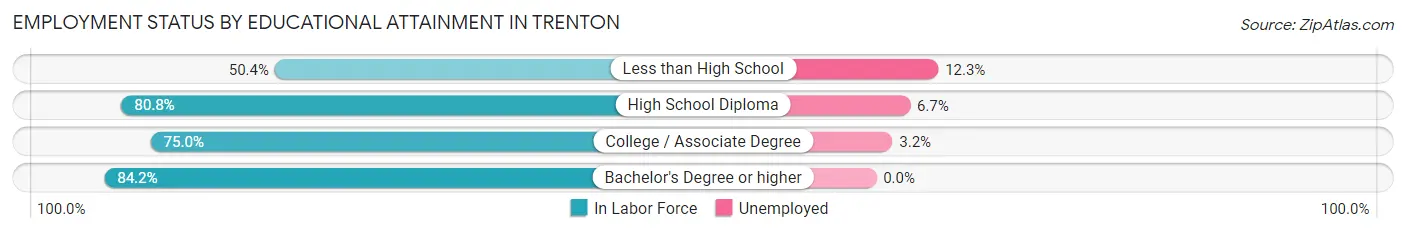
| Educational Attainment | In Labor Force | Unemployed |
| Less than High School | 65 (50.4%) | 16 (12.3%) |
| High School Diploma | 345 (80.8%) | 29 (6.7%) |
| College / Associate Degree | 186 (75.0%) | 8 (3.2%) |
| Bachelor's Degree or higher | 80 (84.2%) | 0 (0.0%) |
| Total | 676 (75.2%) | 49 (5.5%) |
Employment Occupations by Sex in Trenton
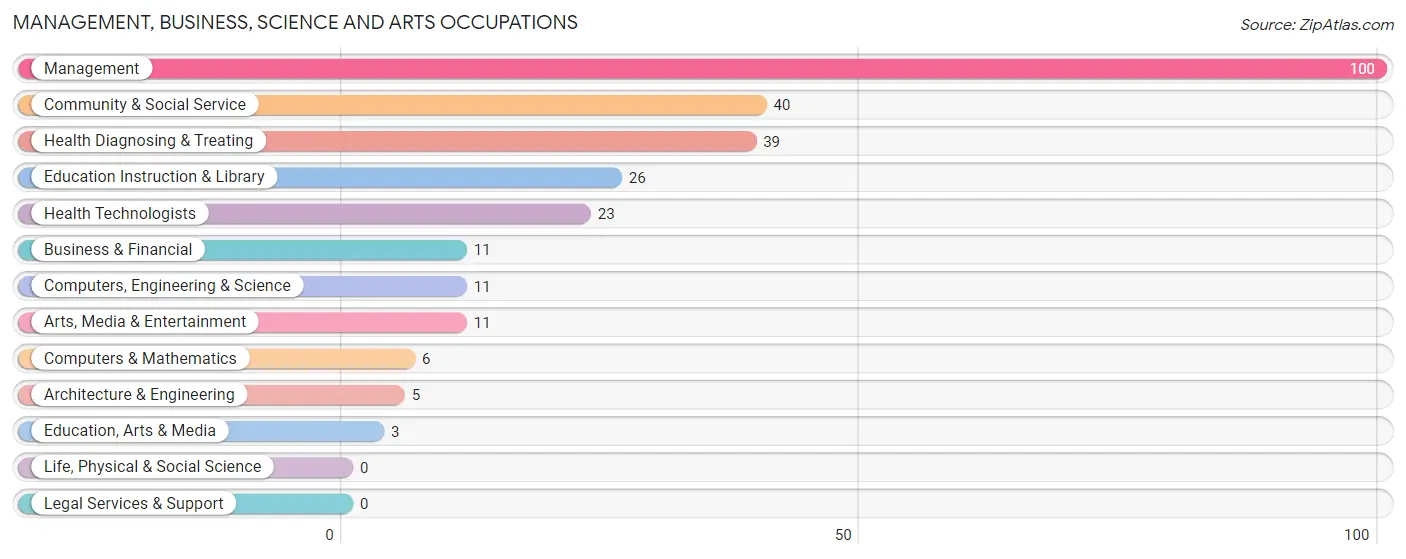
Management, Business, Science and Arts Occupations
The most common Management, Business, Science and Arts occupations in Trenton are Management (100 | 13.5%), Community & Social Service (40 | 5.4%), Health Diagnosing & Treating (39 | 5.3%), Education Instruction & Library (26 | 3.5%), and Health Technologists (23 | 3.1%).
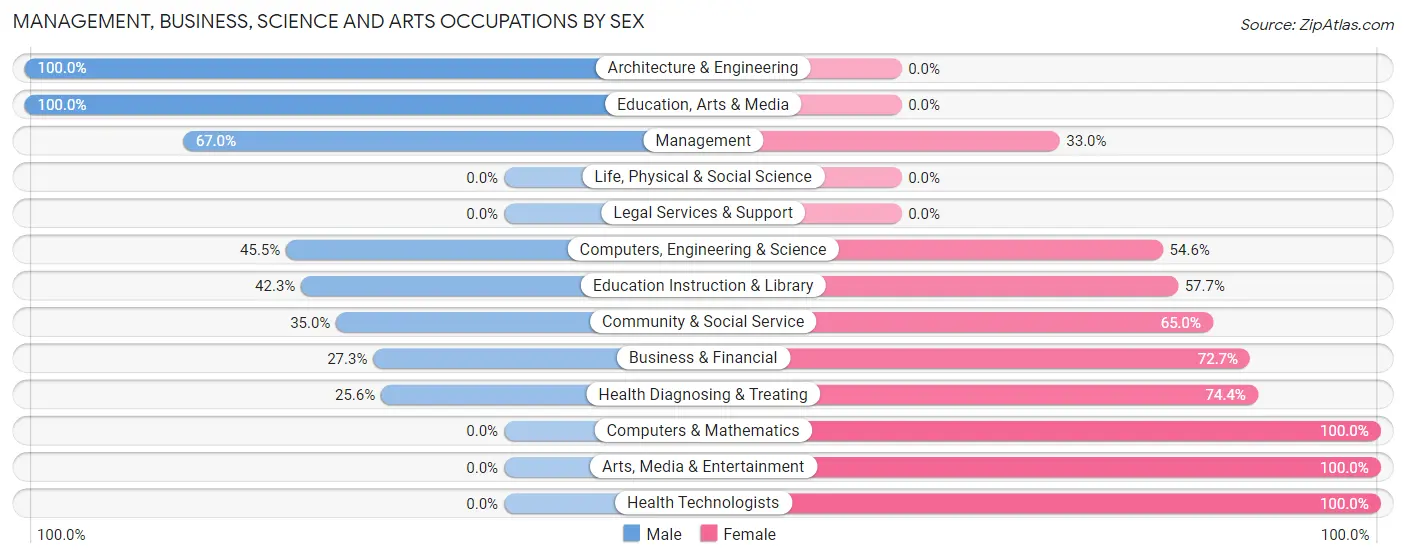
Management, Business, Science and Arts Occupations by Sex
Within the Management, Business, Science and Arts occupations in Trenton, the most male-oriented occupations are Architecture & Engineering (100.0%), Education, Arts & Media (100.0%), and Management (67.0%), while the most female-oriented occupations are Computers & Mathematics (100.0%), Arts, Media & Entertainment (100.0%), and Health Technologists (100.0%).
| Occupation | Male | Female |
| Management | 67 (67.0%) | 33 (33.0%) |
| Business & Financial | 3 (27.3%) | 8 (72.7%) |
| Computers, Engineering & Science | 5 (45.5%) | 6 (54.5%) |
| Computers & Mathematics | 0 (0.0%) | 6 (100.0%) |
| Architecture & Engineering | 5 (100.0%) | 0 (0.0%) |
| Life, Physical & Social Science | 0 (0.0%) | 0 (0.0%) |
| Community & Social Service | 14 (35.0%) | 26 (65.0%) |
| Education, Arts & Media | 3 (100.0%) | 0 (0.0%) |
| Legal Services & Support | 0 (0.0%) | 0 (0.0%) |
| Education Instruction & Library | 11 (42.3%) | 15 (57.7%) |
| Arts, Media & Entertainment | 0 (0.0%) | 11 (100.0%) |
| Health Diagnosing & Treating | 10 (25.6%) | 29 (74.4%) |
| Health Technologists | 0 (0.0%) | 23 (100.0%) |
| Total (Category) | 99 (49.2%) | 102 (50.7%) |
| Total (Overall) | 403 (54.3%) | 339 (45.7%) |
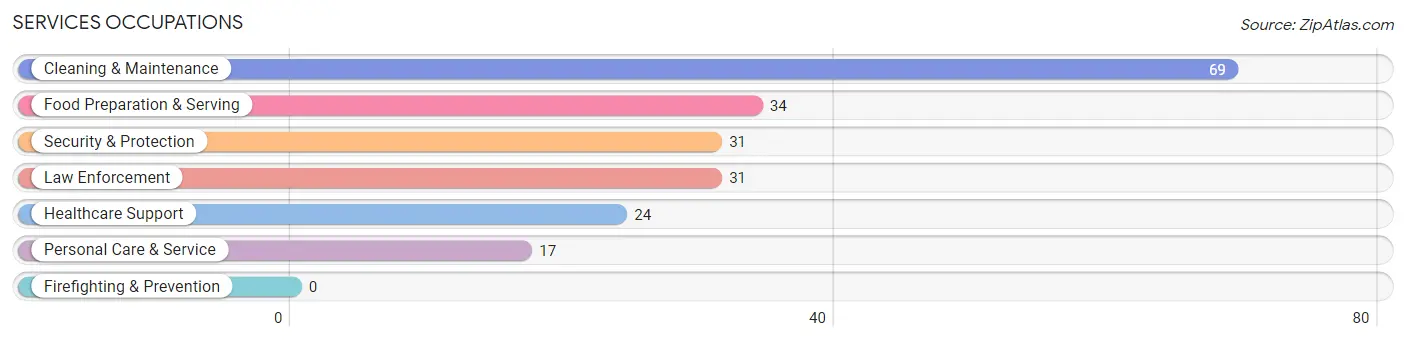
Services Occupations
The most common Services occupations in Trenton are Cleaning & Maintenance (69 | 9.3%), Food Preparation & Serving (34 | 4.6%), Security & Protection (31 | 4.2%), Law Enforcement (31 | 4.2%), and Healthcare Support (24 | 3.2%).
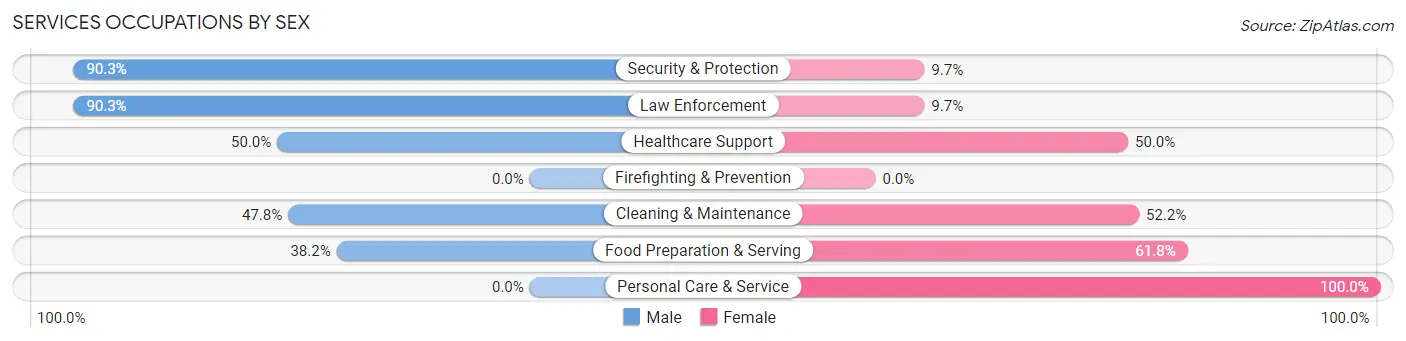
Services Occupations by Sex
Within the Services occupations in Trenton, the most male-oriented occupations are Security & Protection (90.3%), Law Enforcement (90.3%), and Healthcare Support (50.0%), while the most female-oriented occupations are Personal Care & Service (100.0%), Food Preparation & Serving (61.8%), and Cleaning & Maintenance (52.2%).
| Occupation | Male | Female |
| Healthcare Support | 12 (50.0%) | 12 (50.0%) |
| Security & Protection | 28 (90.3%) | 3 (9.7%) |
| Firefighting & Prevention | 0 (0.0%) | 0 (0.0%) |
| Law Enforcement | 28 (90.3%) | 3 (9.7%) |
| Food Preparation & Serving | 13 (38.2%) | 21 (61.8%) |
| Cleaning & Maintenance | 33 (47.8%) | 36 (52.2%) |
| Personal Care & Service | 0 (0.0%) | 17 (100.0%) |
| Total (Category) | 86 (49.1%) | 89 (50.9%) |
| Total (Overall) | 403 (54.3%) | 339 (45.7%) |
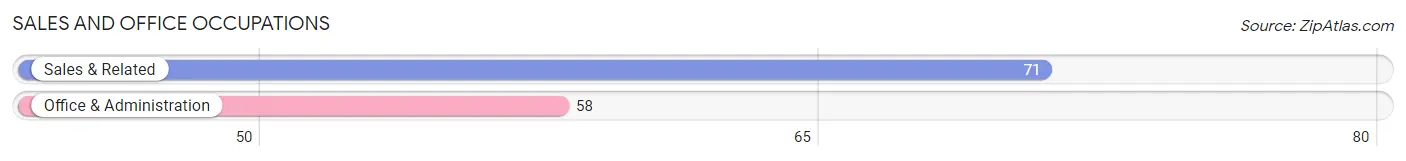
Sales and Office Occupations
The most common Sales and Office occupations in Trenton are Sales & Related (71 | 9.6%), and Office & Administration (58 | 7.8%).
Sales and Office Occupations by Sex
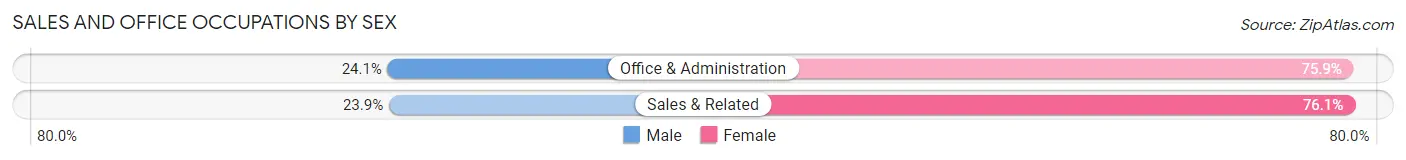
| Occupation | Male | Female |
| Sales & Related | 17 (23.9%) | 54 (76.1%) |
| Office & Administration | 14 (24.1%) | 44 (75.9%) |
| Total (Category) | 31 (24.0%) | 98 (76.0%) |
| Total (Overall) | 403 (54.3%) | 339 (45.7%) |
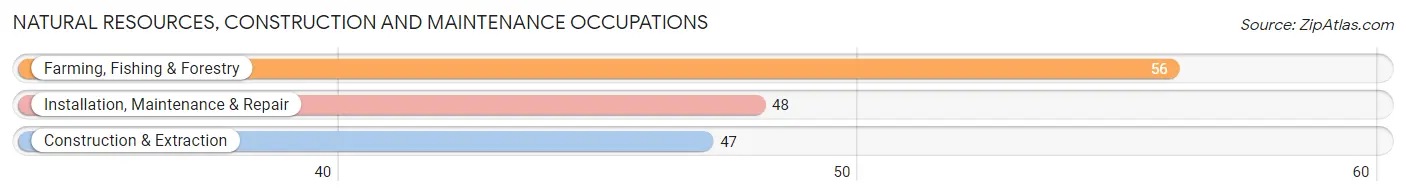
Natural Resources, Construction and Maintenance Occupations
The most common Natural Resources, Construction and Maintenance occupations in Trenton are Farming, Fishing & Forestry (56 | 7.5%), Installation, Maintenance & Repair (48 | 6.5%), and Construction & Extraction (47 | 6.3%).
Natural Resources, Construction and Maintenance Occupations by Sex
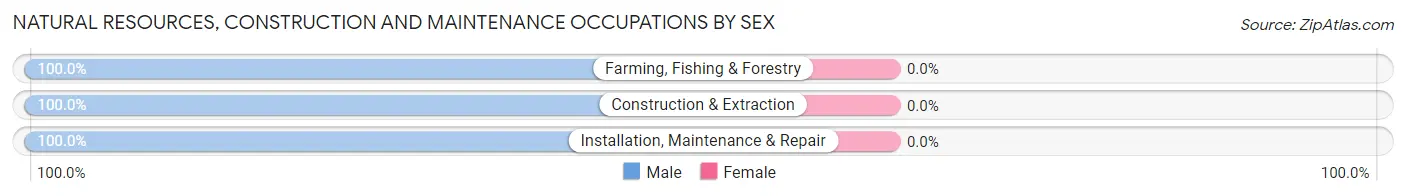
| Occupation | Male | Female |
| Farming, Fishing & Forestry | 56 (100.0%) | 0 (0.0%) |
| Construction & Extraction | 47 (100.0%) | 0 (0.0%) |
| Installation, Maintenance & Repair | 48 (100.0%) | 0 (0.0%) |
| Total (Category) | 151 (100.0%) | 0 (0.0%) |
| Total (Overall) | 403 (54.3%) | 339 (45.7%) |
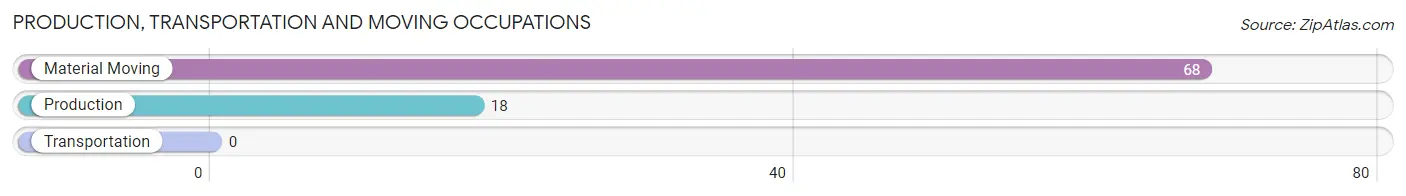
Production, Transportation and Moving Occupations
The most common Production, Transportation and Moving occupations in Trenton are Material Moving (68 | 9.2%), and Production (18 | 2.4%).
Production, Transportation and Moving Occupations by Sex
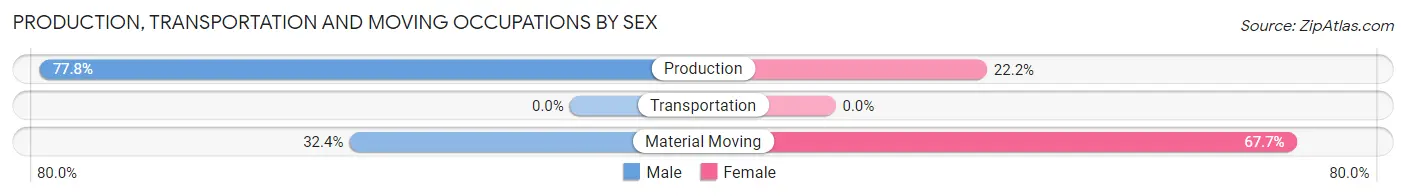
| Occupation | Male | Female |
| Production | 14 (77.8%) | 4 (22.2%) |
| Transportation | 0 (0.0%) | 0 (0.0%) |
| Material Moving | 22 (32.4%) | 46 (67.6%) |
| Total (Category) | 36 (41.9%) | 50 (58.1%) |
| Total (Overall) | 403 (54.3%) | 339 (45.7%) |
Employment Industries by Sex in Trenton
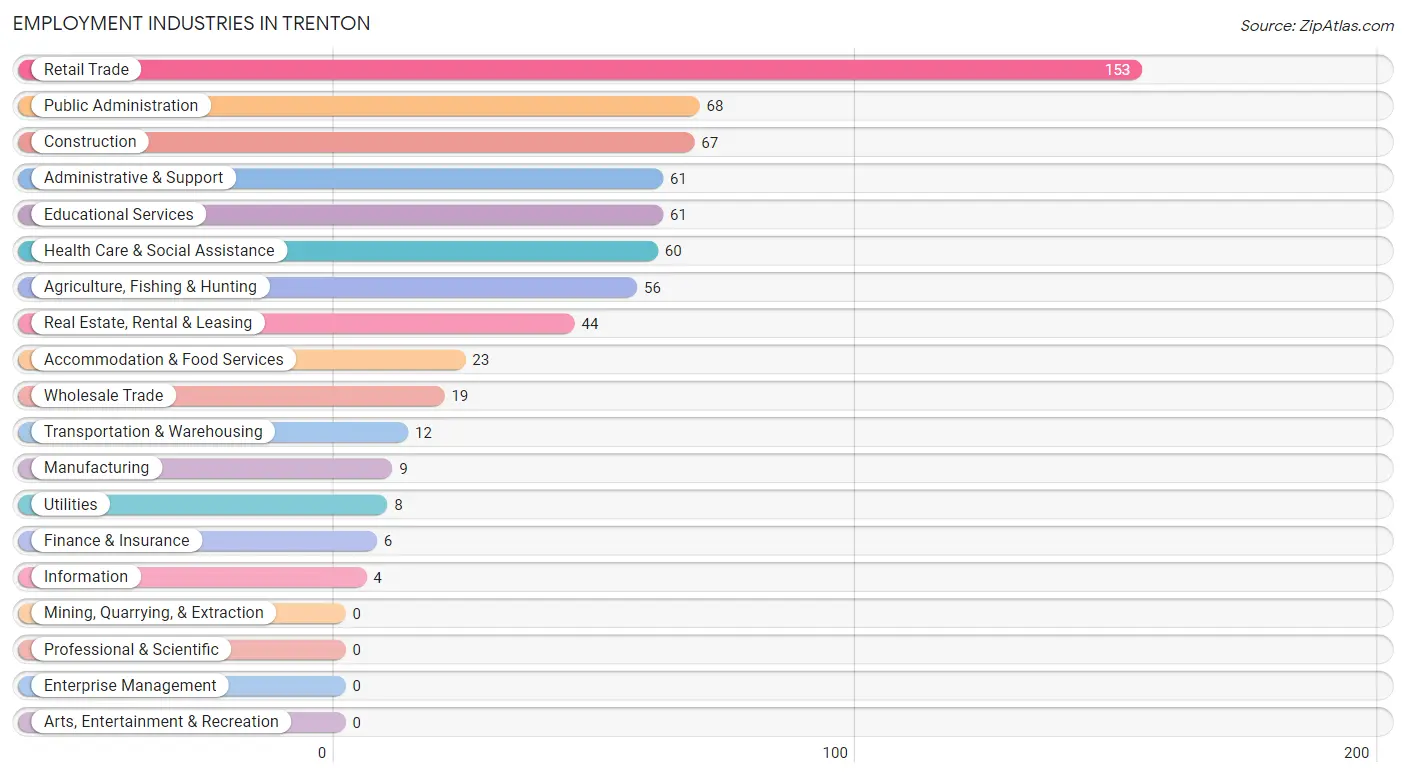
Employment Industries in Trenton
The major employment industries in Trenton include Retail Trade (153 | 20.6%), Public Administration (68 | 9.2%), Construction (67 | 9.0%), Administrative & Support (61 | 8.2%), and Educational Services (61 | 8.2%).
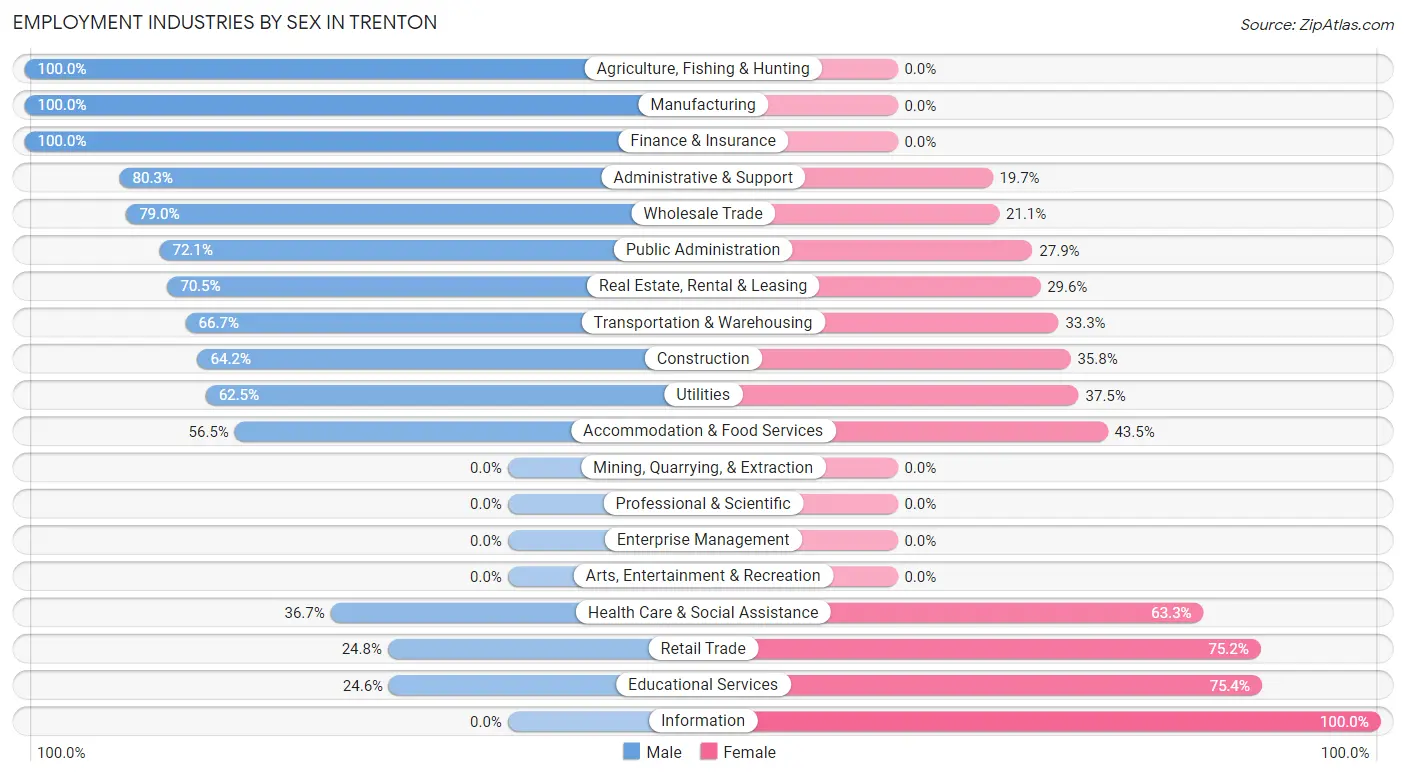
Employment Industries by Sex in Trenton
The Trenton industries that see more men than women are Agriculture, Fishing & Hunting (100.0%), Manufacturing (100.0%), and Finance & Insurance (100.0%), whereas the industries that tend to have a higher number of women are Information (100.0%), Educational Services (75.4%), and Retail Trade (75.2%).
| Industry | Male | Female |
| Agriculture, Fishing & Hunting | 56 (100.0%) | 0 (0.0%) |
| Mining, Quarrying, & Extraction | 0 (0.0%) | 0 (0.0%) |
| Construction | 43 (64.2%) | 24 (35.8%) |
| Manufacturing | 9 (100.0%) | 0 (0.0%) |
| Wholesale Trade | 15 (78.9%) | 4 (21.0%) |
| Retail Trade | 38 (24.8%) | 115 (75.2%) |
| Transportation & Warehousing | 8 (66.7%) | 4 (33.3%) |
| Utilities | 5 (62.5%) | 3 (37.5%) |
| Information | 0 (0.0%) | 4 (100.0%) |
| Finance & Insurance | 6 (100.0%) | 0 (0.0%) |
| Real Estate, Rental & Leasing | 31 (70.5%) | 13 (29.5%) |
| Professional & Scientific | 0 (0.0%) | 0 (0.0%) |
| Enterprise Management | 0 (0.0%) | 0 (0.0%) |
| Administrative & Support | 49 (80.3%) | 12 (19.7%) |
| Educational Services | 15 (24.6%) | 46 (75.4%) |
| Health Care & Social Assistance | 22 (36.7%) | 38 (63.3%) |
| Arts, Entertainment & Recreation | 0 (0.0%) | 0 (0.0%) |
| Accommodation & Food Services | 13 (56.5%) | 10 (43.5%) |
| Public Administration | 49 (72.1%) | 19 (27.9%) |
| Total | 403 (54.3%) | 339 (45.7%) |
Education in Trenton
School Enrollment in Trenton
The most common levels of schooling among the 435 students in Trenton are high school (119 | 27.4%), middle school (103 | 23.7%), and elementary school (102 | 23.4%).
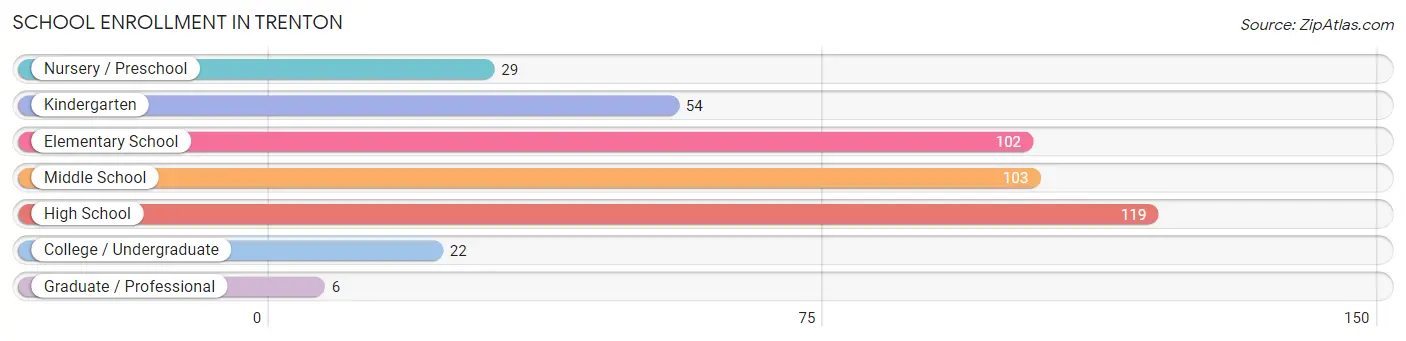
| School Level | # Students | % Students |
| Nursery / Preschool | 29 | 6.7% |
| Kindergarten | 54 | 12.4% |
| Elementary School | 102 | 23.4% |
| Middle School | 103 | 23.7% |
| High School | 119 | 27.4% |
| College / Undergraduate | 22 | 5.1% |
| Graduate / Professional | 6 | 1.4% |
| Total | 435 | 100.0% |
School Enrollment by Age by Funding Source in Trenton
Out of a total of 435 students who are enrolled in schools in Trenton, 62 (14.3%) attend a private institution, while the remaining 373 (85.7%) are enrolled in public schools. The age group of 15 to 17 year olds has the highest likelihood of being enrolled in private schools, with 37 (29.8% in the age bracket) enrolled. Conversely, the age group of 18 to 19 year olds has the lowest likelihood of being enrolled in a private school, with 8 (100.0% in the age bracket) attending a public institution.
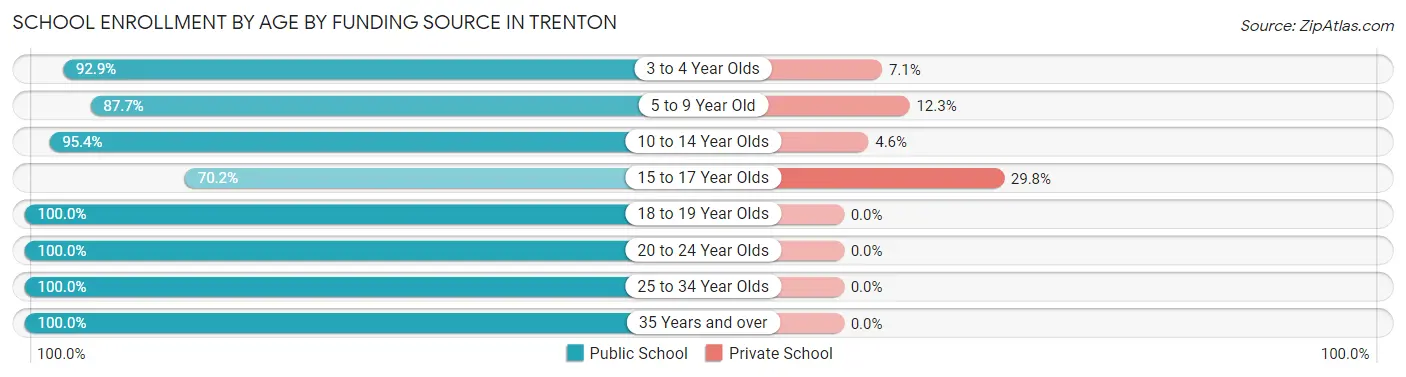
| Age Bracket | Public School | Private School |
| 3 to 4 Year Olds | 13 (92.9%) | 1 (7.1%) |
| 5 to 9 Year Old | 136 (87.7%) | 19 (12.3%) |
| 10 to 14 Year Olds | 104 (95.4%) | 5 (4.6%) |
| 15 to 17 Year Olds | 87 (70.2%) | 37 (29.8%) |
| 18 to 19 Year Olds | 8 (100.0%) | 0 (0.0%) |
| 20 to 24 Year Olds | 5 (100.0%) | 0 (0.0%) |
| 25 to 34 Year Olds | 11 (100.0%) | 0 (0.0%) |
| 35 Years and over | 9 (100.0%) | 0 (0.0%) |
| Total | 373 (85.7%) | 62 (14.3%) |
Educational Attainment by Field of Study in Trenton
Education (45 | 34.1%), business (29 | 22.0%), liberal arts & history (12 | 9.1%), arts & humanities (12 | 9.1%), and science & technology (10 | 7.6%) are the most common fields of study among 132 individuals in Trenton who have obtained a bachelor's degree or higher.
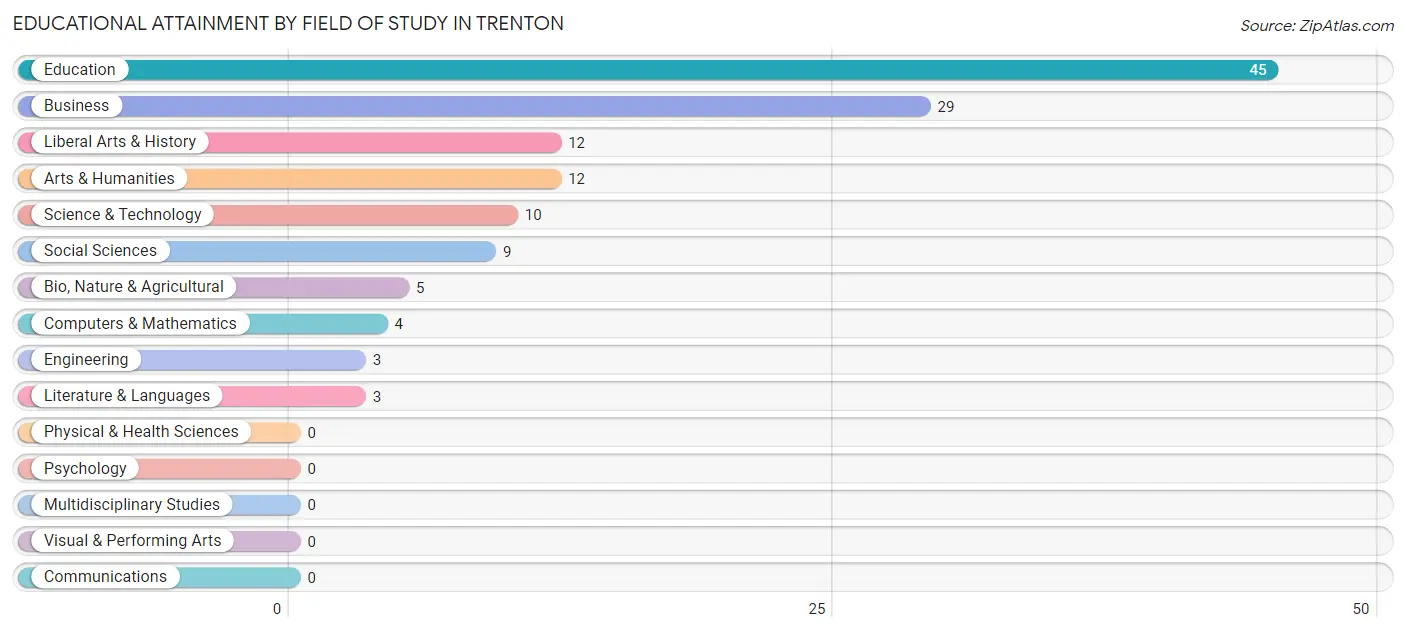
| Field of Study | # Graduates | % Graduates |
| Computers & Mathematics | 4 | 3.0% |
| Bio, Nature & Agricultural | 5 | 3.8% |
| Physical & Health Sciences | 0 | 0.0% |
| Psychology | 0 | 0.0% |
| Social Sciences | 9 | 6.8% |
| Engineering | 3 | 2.3% |
| Multidisciplinary Studies | 0 | 0.0% |
| Science & Technology | 10 | 7.6% |
| Business | 29 | 22.0% |
| Education | 45 | 34.1% |
| Literature & Languages | 3 | 2.3% |
| Liberal Arts & History | 12 | 9.1% |
| Visual & Performing Arts | 0 | 0.0% |
| Communications | 0 | 0.0% |
| Arts & Humanities | 12 | 9.1% |
| Total | 132 | 100.0% |
Transportation & Commute in Trenton
Vehicle Availability by Sex in Trenton
The most prevalent vehicle ownership categories in Trenton are males with 2 vehicles (177, accounting for 44.4%) and females with 2 vehicles (96, making up 58.2%).
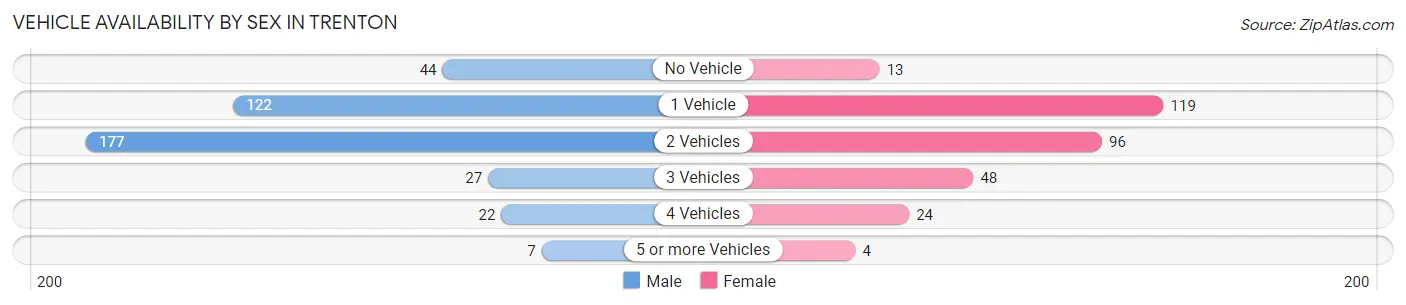
| Vehicles Available | Male | Female |
| No Vehicle | 44 (11.0%) | 13 (4.3%) |
| 1 Vehicle | 122 (30.6%) | 119 (39.1%) |
| 2 Vehicles | 177 (44.4%) | 96 (31.6%) |
| 3 Vehicles | 27 (6.8%) | 48 (15.8%) |
| 4 Vehicles | 22 (5.5%) | 24 (7.9%) |
| 5 or more Vehicles | 7 (1.8%) | 4 (1.3%) |
| Total | 399 (100.0%) | 304 (100.0%) |
Commute Time in Trenton
The most frequently occuring commute durations in Trenton are 10 to 14 minutes (144 commuters, 21.7%), 15 to 19 minutes (133 commuters, 20.0%), and 45 to 59 minutes (96 commuters, 14.5%).
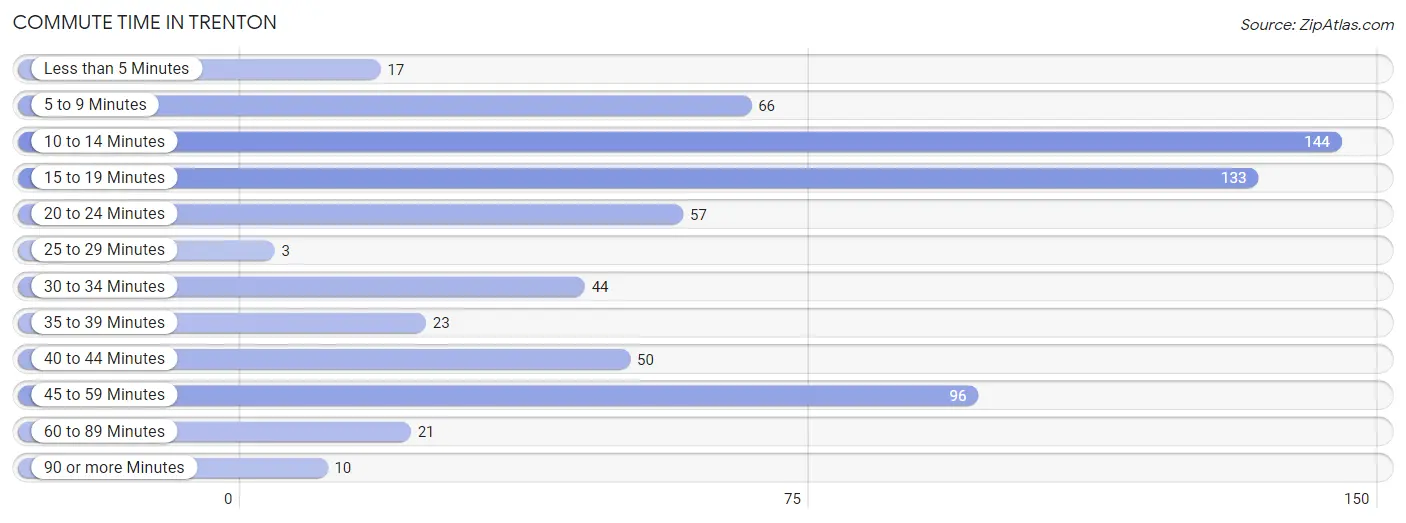
| Commute Time | # Commuters | % Commuters |
| Less than 5 Minutes | 17 | 2.6% |
| 5 to 9 Minutes | 66 | 9.9% |
| 10 to 14 Minutes | 144 | 21.7% |
| 15 to 19 Minutes | 133 | 20.0% |
| 20 to 24 Minutes | 57 | 8.6% |
| 25 to 29 Minutes | 3 | 0.4% |
| 30 to 34 Minutes | 44 | 6.6% |
| 35 to 39 Minutes | 23 | 3.5% |
| 40 to 44 Minutes | 50 | 7.5% |
| 45 to 59 Minutes | 96 | 14.5% |
| 60 to 89 Minutes | 21 | 3.2% |
| 90 or more Minutes | 10 | 1.5% |
Commute Time by Sex in Trenton
The most common commute times in Trenton are 10 to 14 minutes (102 commuters, 26.4%) for males and 15 to 19 minutes (78 commuters, 28.1%) for females.
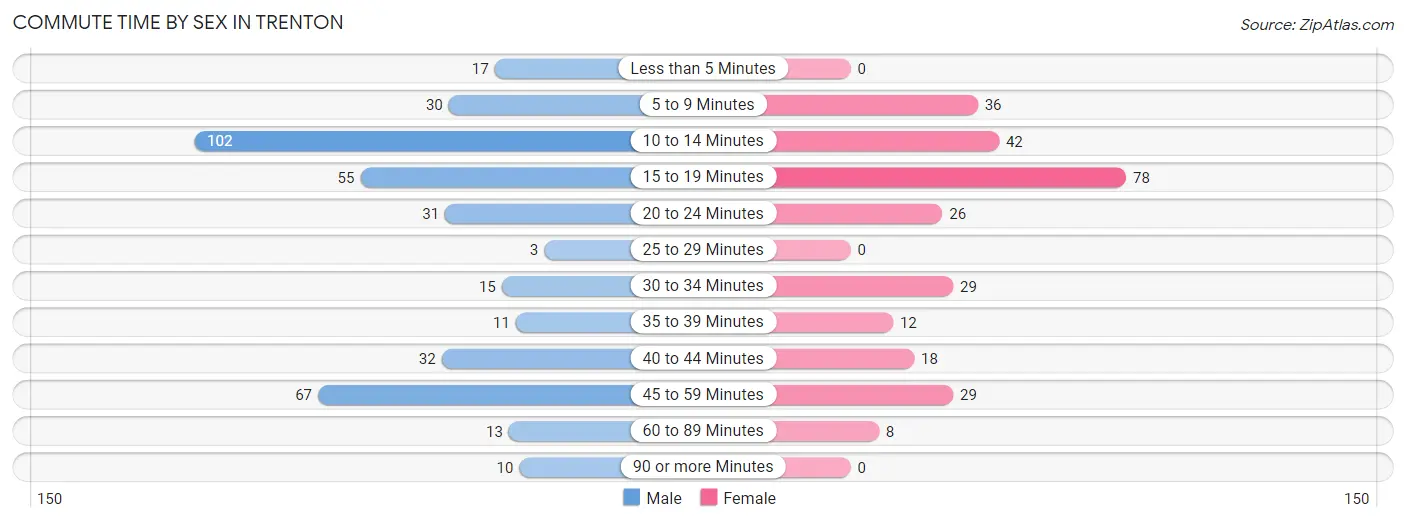
| Commute Time | Male | Female |
| Less than 5 Minutes | 17 (4.4%) | 0 (0.0%) |
| 5 to 9 Minutes | 30 (7.8%) | 36 (13.0%) |
| 10 to 14 Minutes | 102 (26.4%) | 42 (15.1%) |
| 15 to 19 Minutes | 55 (14.2%) | 78 (28.1%) |
| 20 to 24 Minutes | 31 (8.0%) | 26 (9.3%) |
| 25 to 29 Minutes | 3 (0.8%) | 0 (0.0%) |
| 30 to 34 Minutes | 15 (3.9%) | 29 (10.4%) |
| 35 to 39 Minutes | 11 (2.9%) | 12 (4.3%) |
| 40 to 44 Minutes | 32 (8.3%) | 18 (6.5%) |
| 45 to 59 Minutes | 67 (17.4%) | 29 (10.4%) |
| 60 to 89 Minutes | 13 (3.4%) | 8 (2.9%) |
| 90 or more Minutes | 10 (2.6%) | 0 (0.0%) |
Time of Departure to Work by Sex in Trenton
The most frequent times of departure to work in Trenton are 6:00 AM to 6:29 AM (126, 32.6%) for males and 7:00 AM to 7:29 AM (55, 19.8%) for females.
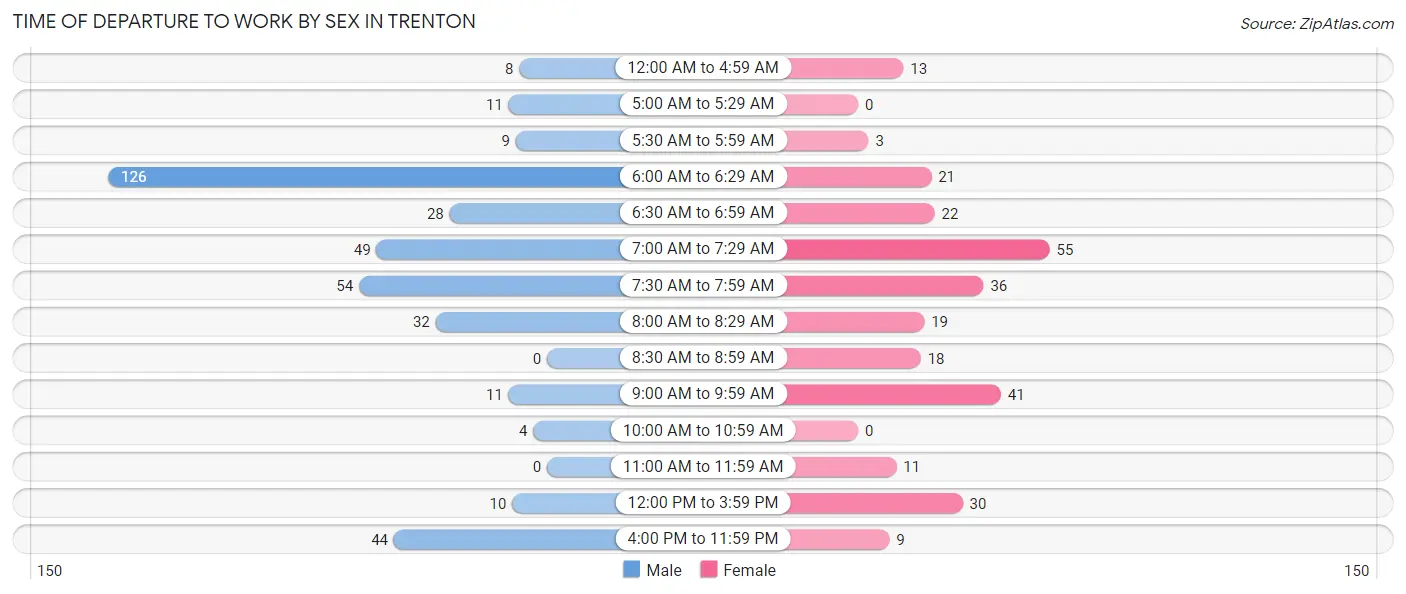
| Time of Departure | Male | Female |
| 12:00 AM to 4:59 AM | 8 (2.1%) | 13 (4.7%) |
| 5:00 AM to 5:29 AM | 11 (2.9%) | 0 (0.0%) |
| 5:30 AM to 5:59 AM | 9 (2.3%) | 3 (1.1%) |
| 6:00 AM to 6:29 AM | 126 (32.6%) | 21 (7.5%) |
| 6:30 AM to 6:59 AM | 28 (7.2%) | 22 (7.9%) |
| 7:00 AM to 7:29 AM | 49 (12.7%) | 55 (19.8%) |
| 7:30 AM to 7:59 AM | 54 (14.0%) | 36 (13.0%) |
| 8:00 AM to 8:29 AM | 32 (8.3%) | 19 (6.8%) |
| 8:30 AM to 8:59 AM | 0 (0.0%) | 18 (6.5%) |
| 9:00 AM to 9:59 AM | 11 (2.9%) | 41 (14.7%) |
| 10:00 AM to 10:59 AM | 4 (1.0%) | 0 (0.0%) |
| 11:00 AM to 11:59 AM | 0 (0.0%) | 11 (4.0%) |
| 12:00 PM to 3:59 PM | 10 (2.6%) | 30 (10.8%) |
| 4:00 PM to 11:59 PM | 44 (11.4%) | 9 (3.2%) |
| Total | 386 (100.0%) | 278 (100.0%) |
Housing Occupancy in Trenton
Occupancy by Ownership in Trenton
Of the total 660 dwellings in Trenton, owner-occupied units account for 394 (59.7%), while renter-occupied units make up 266 (40.3%).
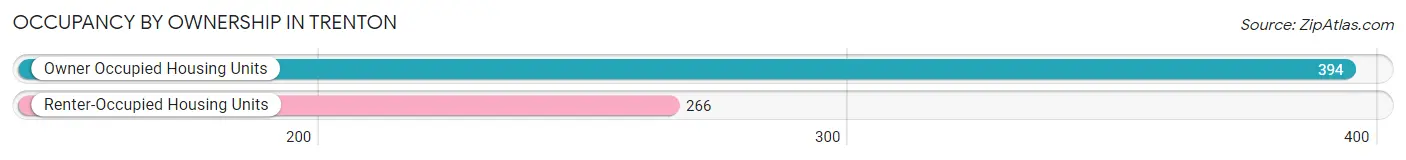
| Occupancy | # Housing Units | % Housing Units |
| Owner Occupied Housing Units | 394 | 59.7% |
| Renter-Occupied Housing Units | 266 | 40.3% |
| Total Occupied Housing Units | 660 | 100.0% |
Occupancy by Household Size in Trenton
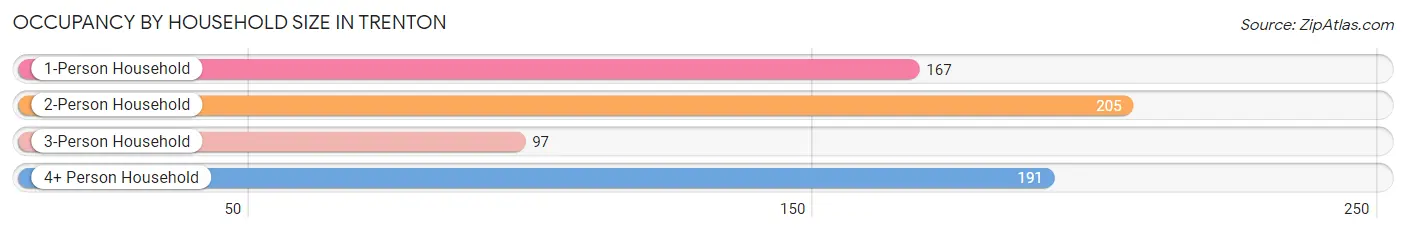
| Household Size | # Housing Units | % Housing Units |
| 1-Person Household | 167 | 25.3% |
| 2-Person Household | 205 | 31.1% |
| 3-Person Household | 97 | 14.7% |
| 4+ Person Household | 191 | 28.9% |
| Total Housing Units | 660 | 100.0% |
Occupancy by Ownership by Household Size in Trenton
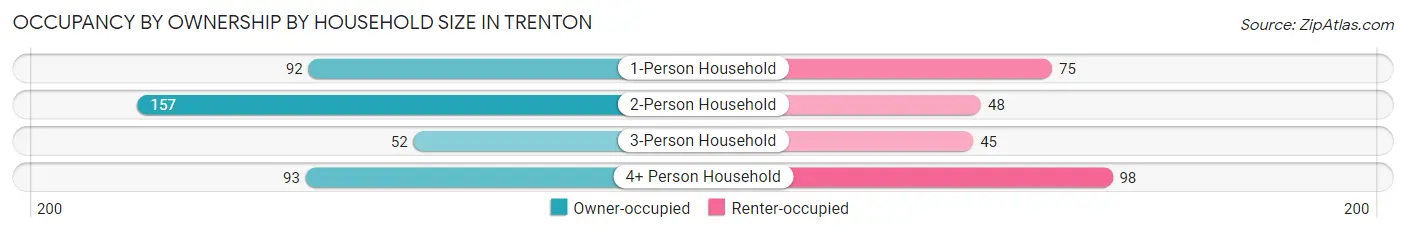
| Household Size | Owner-occupied | Renter-occupied |
| 1-Person Household | 92 (55.1%) | 75 (44.9%) |
| 2-Person Household | 157 (76.6%) | 48 (23.4%) |
| 3-Person Household | 52 (53.6%) | 45 (46.4%) |
| 4+ Person Household | 93 (48.7%) | 98 (51.3%) |
| Total Housing Units | 394 (59.7%) | 266 (40.3%) |
Occupancy by Educational Attainment in Trenton
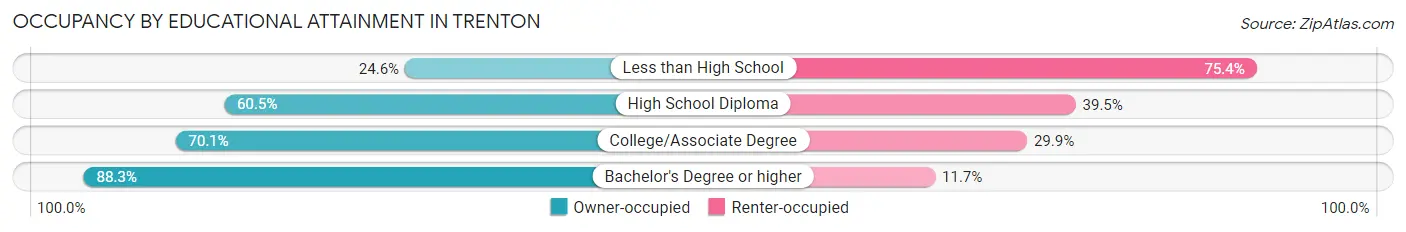
| Household Size | Owner-occupied | Renter-occupied |
| Less than High School | 31 (24.6%) | 95 (75.4%) |
| High School Diploma | 159 (60.5%) | 104 (39.5%) |
| College/Associate Degree | 136 (70.1%) | 58 (29.9%) |
| Bachelor's Degree or higher | 68 (88.3%) | 9 (11.7%) |
Occupancy by Age of Householder in Trenton
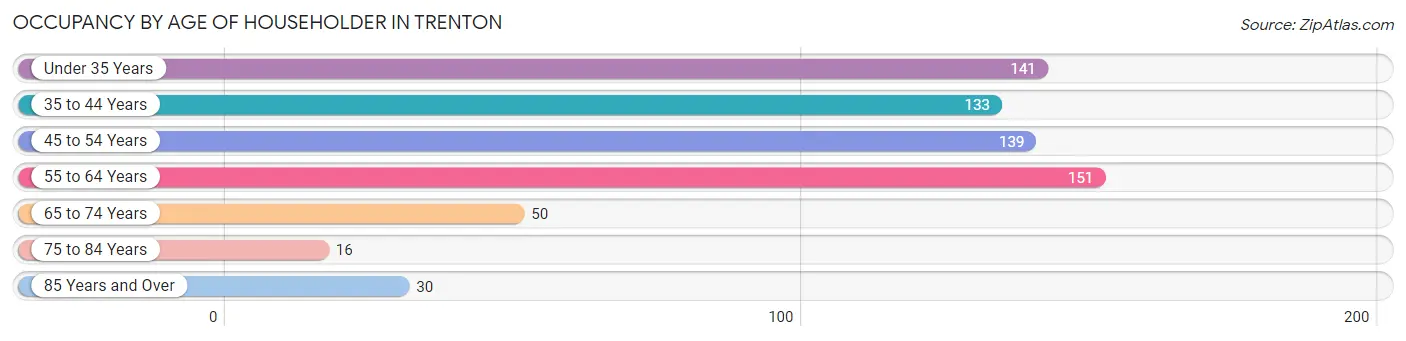
| Age Bracket | # Households | % Households |
| Under 35 Years | 141 | 21.4% |
| 35 to 44 Years | 133 | 20.2% |
| 45 to 54 Years | 139 | 21.1% |
| 55 to 64 Years | 151 | 22.9% |
| 65 to 74 Years | 50 | 7.6% |
| 75 to 84 Years | 16 | 2.4% |
| 85 Years and Over | 30 | 4.5% |
| Total | 660 | 100.0% |
Housing Finances in Trenton
Median Income by Occupancy in Trenton
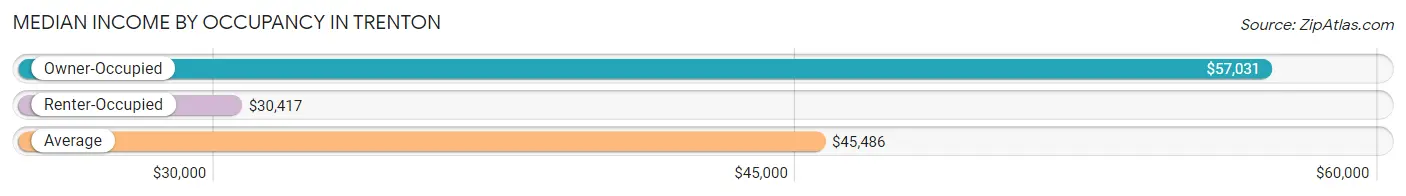
| Occupancy Type | # Households | Median Income |
| Owner-Occupied | 394 (59.7%) | $57,031 |
| Renter-Occupied | 266 (40.3%) | $30,417 |
| Average | 660 (100.0%) | $45,486 |
Occupancy by Householder Income Bracket in Trenton
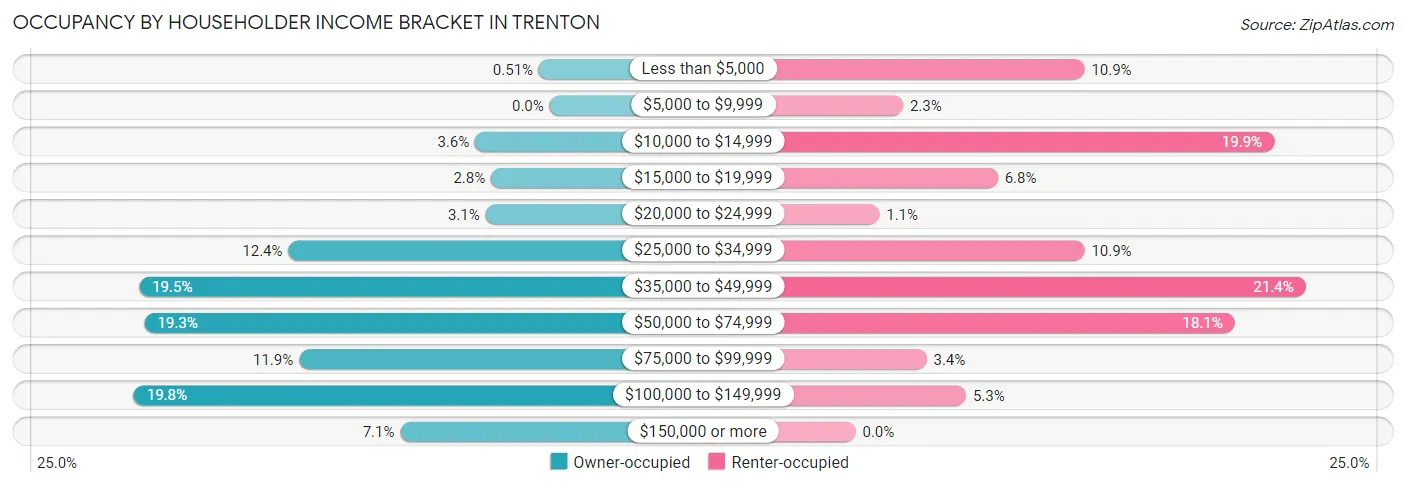
| Income Bracket | Owner-occupied | Renter-occupied |
| Less than $5,000 | 2 (0.5%) | 29 (10.9%) |
| $5,000 to $9,999 | 0 (0.0%) | 6 (2.3%) |
| $10,000 to $14,999 | 14 (3.5%) | 53 (19.9%) |
| $15,000 to $19,999 | 11 (2.8%) | 18 (6.8%) |
| $20,000 to $24,999 | 12 (3.0%) | 3 (1.1%) |
| $25,000 to $34,999 | 49 (12.4%) | 29 (10.9%) |
| $35,000 to $49,999 | 77 (19.5%) | 57 (21.4%) |
| $50,000 to $74,999 | 76 (19.3%) | 48 (18.0%) |
| $75,000 to $99,999 | 47 (11.9%) | 9 (3.4%) |
| $100,000 to $149,999 | 78 (19.8%) | 14 (5.3%) |
| $150,000 or more | 28 (7.1%) | 0 (0.0%) |
| Total | 394 (100.0%) | 266 (100.0%) |
Monthly Housing Cost Tiers in Trenton
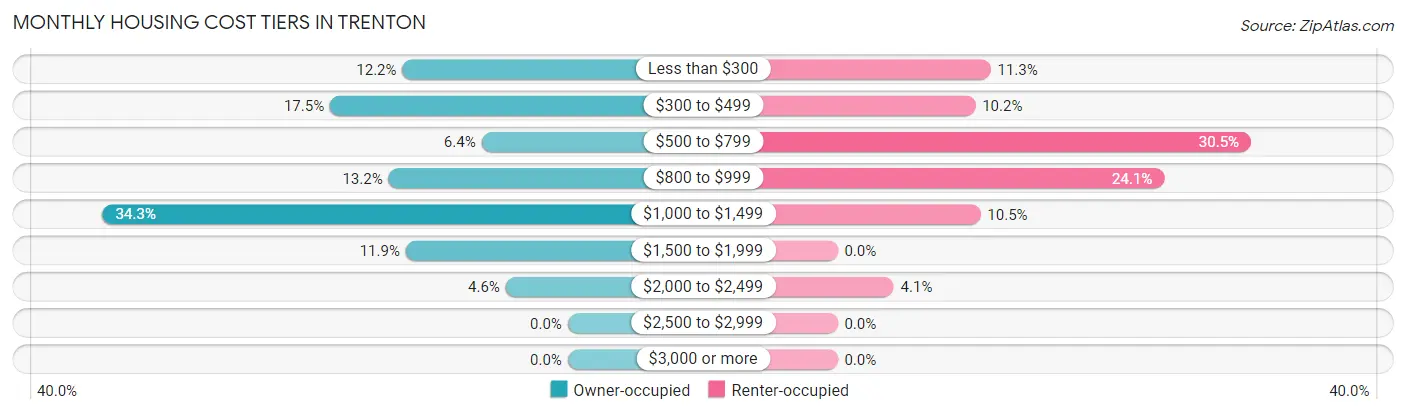
| Monthly Cost | Owner-occupied | Renter-occupied |
| Less than $300 | 48 (12.2%) | 30 (11.3%) |
| $300 to $499 | 69 (17.5%) | 27 (10.2%) |
| $500 to $799 | 25 (6.4%) | 81 (30.4%) |
| $800 to $999 | 52 (13.2%) | 64 (24.1%) |
| $1,000 to $1,499 | 135 (34.3%) | 28 (10.5%) |
| $1,500 to $1,999 | 47 (11.9%) | 0 (0.0%) |
| $2,000 to $2,499 | 18 (4.6%) | 11 (4.1%) |
| $2,500 to $2,999 | 0 (0.0%) | 0 (0.0%) |
| $3,000 or more | 0 (0.0%) | 0 (0.0%) |
| Total | 394 (100.0%) | 266 (100.0%) |
Physical Housing Characteristics in Trenton
Housing Structures in Trenton
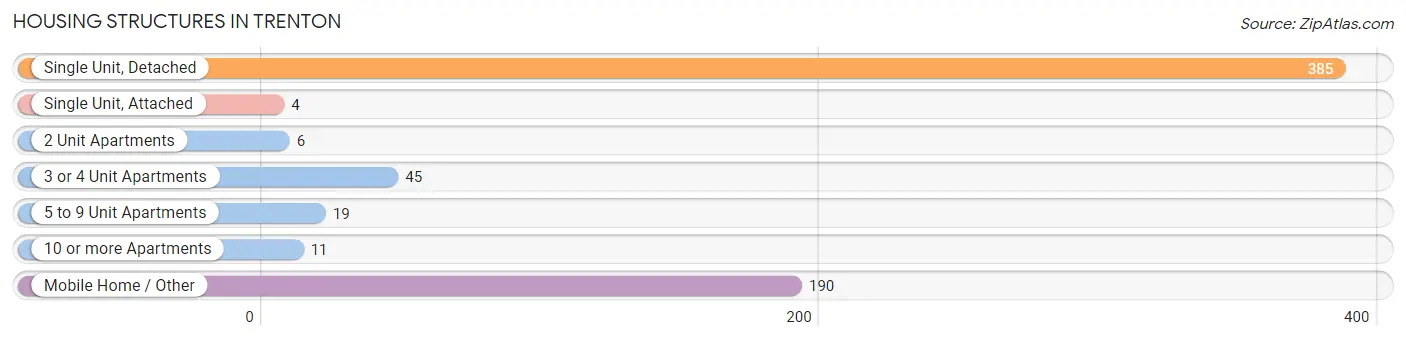
| Structure Type | # Housing Units | % Housing Units |
| Single Unit, Detached | 385 | 58.3% |
| Single Unit, Attached | 4 | 0.6% |
| 2 Unit Apartments | 6 | 0.9% |
| 3 or 4 Unit Apartments | 45 | 6.8% |
| 5 to 9 Unit Apartments | 19 | 2.9% |
| 10 or more Apartments | 11 | 1.7% |
| Mobile Home / Other | 190 | 28.8% |
| Total | 660 | 100.0% |
Housing Structures by Occupancy in Trenton
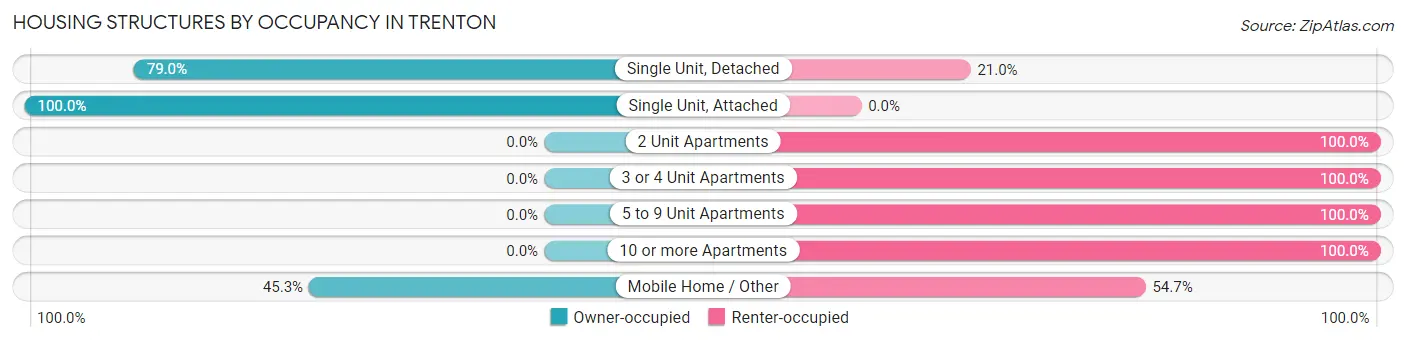
| Structure Type | Owner-occupied | Renter-occupied |
| Single Unit, Detached | 304 (79.0%) | 81 (21.0%) |
| Single Unit, Attached | 4 (100.0%) | 0 (0.0%) |
| 2 Unit Apartments | 0 (0.0%) | 6 (100.0%) |
| 3 or 4 Unit Apartments | 0 (0.0%) | 45 (100.0%) |
| 5 to 9 Unit Apartments | 0 (0.0%) | 19 (100.0%) |
| 10 or more Apartments | 0 (0.0%) | 11 (100.0%) |
| Mobile Home / Other | 86 (45.3%) | 104 (54.7%) |
| Total | 394 (59.7%) | 266 (40.3%) |
Housing Structures by Number of Rooms in Trenton
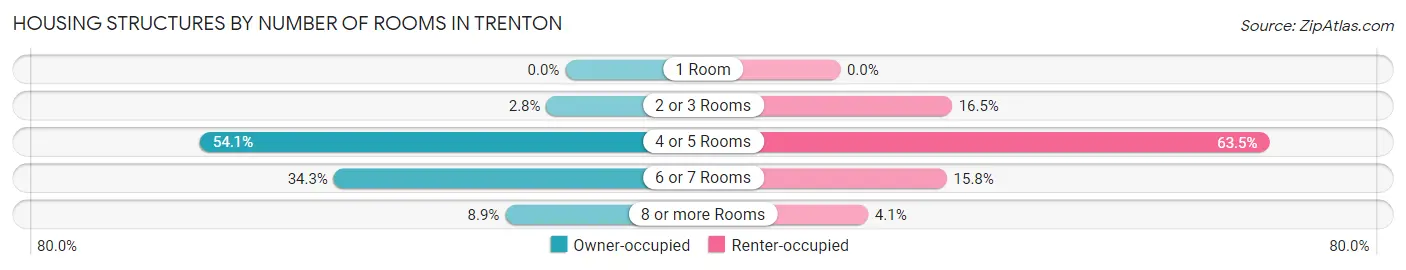
| Number of Rooms | Owner-occupied | Renter-occupied |
| 1 Room | 0 (0.0%) | 0 (0.0%) |
| 2 or 3 Rooms | 11 (2.8%) | 44 (16.5%) |
| 4 or 5 Rooms | 213 (54.1%) | 169 (63.5%) |
| 6 or 7 Rooms | 135 (34.3%) | 42 (15.8%) |
| 8 or more Rooms | 35 (8.9%) | 11 (4.1%) |
| Total | 394 (100.0%) | 266 (100.0%) |
Housing Structure by Heating Type in Trenton
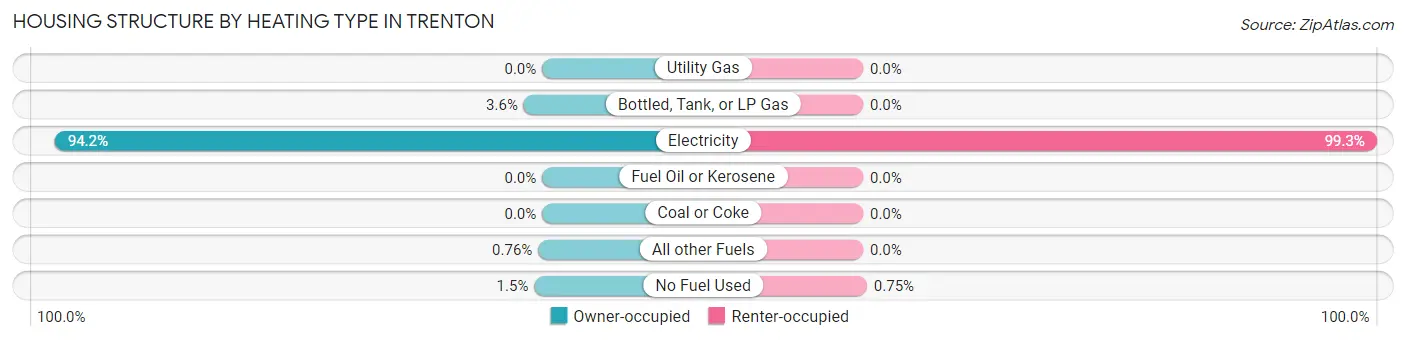
| Heating Type | Owner-occupied | Renter-occupied |
| Utility Gas | 0 (0.0%) | 0 (0.0%) |
| Bottled, Tank, or LP Gas | 14 (3.5%) | 0 (0.0%) |
| Electricity | 371 (94.2%) | 264 (99.3%) |
| Fuel Oil or Kerosene | 0 (0.0%) | 0 (0.0%) |
| Coal or Coke | 0 (0.0%) | 0 (0.0%) |
| All other Fuels | 3 (0.8%) | 0 (0.0%) |
| No Fuel Used | 6 (1.5%) | 2 (0.7%) |
| Total | 394 (100.0%) | 266 (100.0%) |
Household Vehicle Usage in Trenton
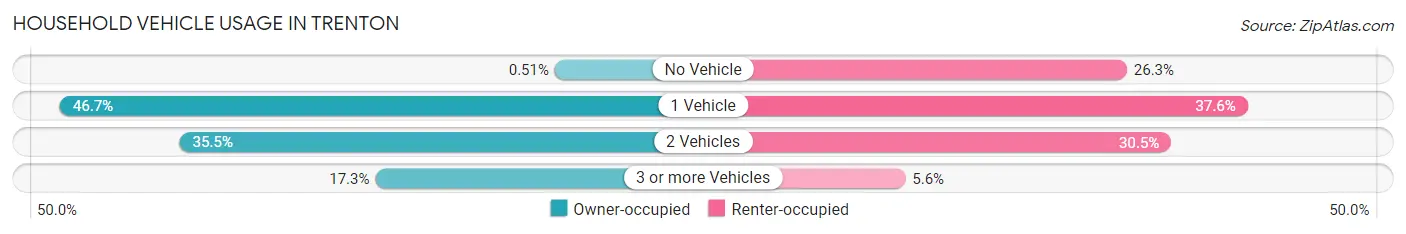
| Vehicles per Household | Owner-occupied | Renter-occupied |
| No Vehicle | 2 (0.5%) | 70 (26.3%) |
| 1 Vehicle | 184 (46.7%) | 100 (37.6%) |
| 2 Vehicles | 140 (35.5%) | 81 (30.4%) |
| 3 or more Vehicles | 68 (17.3%) | 15 (5.6%) |
| Total | 394 (100.0%) | 266 (100.0%) |
Real Estate & Mortgages in Trenton
Real Estate and Mortgage Overview in Trenton
| Characteristic | Without Mortgage | With Mortgage |
| Housing Units | 150 | 244 |
| Median Property Value | $103,200 | $168,400 |
| Median Household Income | $57,500 | $15 |
| Monthly Housing Costs | $364 | $0 |
| Real Estate Taxes | $700 | $5 |
Property Value by Mortgage Status in Trenton
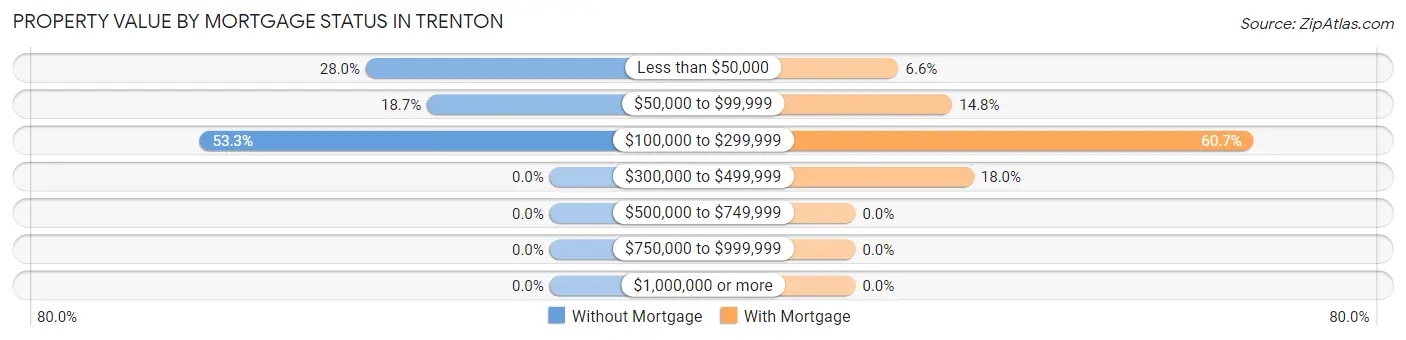
| Property Value | Without Mortgage | With Mortgage |
| Less than $50,000 | 42 (28.0%) | 16 (6.6%) |
| $50,000 to $99,999 | 28 (18.7%) | 36 (14.7%) |
| $100,000 to $299,999 | 80 (53.3%) | 148 (60.7%) |
| $300,000 to $499,999 | 0 (0.0%) | 44 (18.0%) |
| $500,000 to $749,999 | 0 (0.0%) | 0 (0.0%) |
| $750,000 to $999,999 | 0 (0.0%) | 0 (0.0%) |
| $1,000,000 or more | 0 (0.0%) | 0 (0.0%) |
| Total | 150 (100.0%) | 244 (100.0%) |
Household Income by Mortgage Status in Trenton
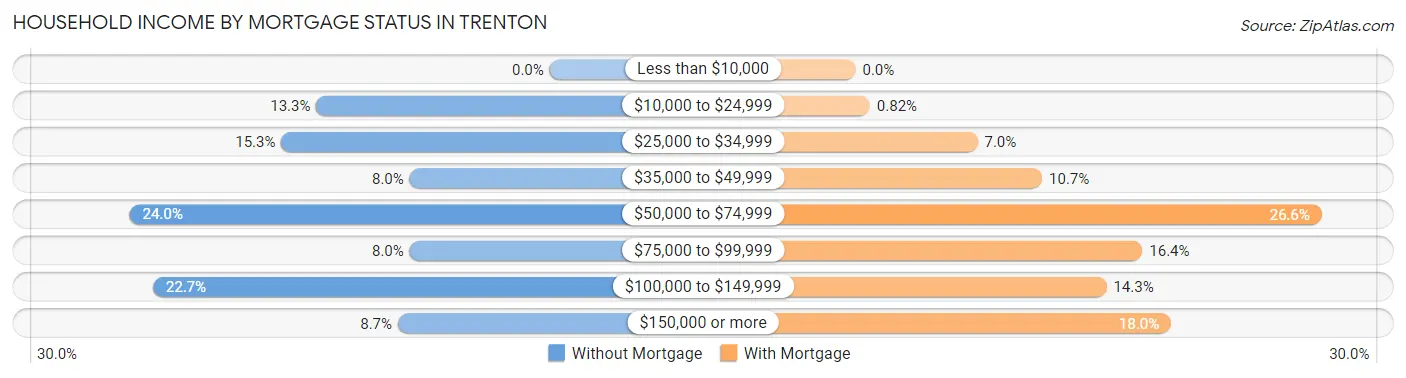
| Household Income | Without Mortgage | With Mortgage |
| Less than $10,000 | 0 (0.0%) | 0 (0.0%) |
| $10,000 to $24,999 | 20 (13.3%) | 2 (0.8%) |
| $25,000 to $34,999 | 23 (15.3%) | 17 (7.0%) |
| $35,000 to $49,999 | 12 (8.0%) | 26 (10.7%) |
| $50,000 to $74,999 | 36 (24.0%) | 65 (26.6%) |
| $75,000 to $99,999 | 12 (8.0%) | 40 (16.4%) |
| $100,000 to $149,999 | 34 (22.7%) | 35 (14.3%) |
| $150,000 or more | 13 (8.7%) | 44 (18.0%) |
| Total | 150 (100.0%) | 244 (100.0%) |
Property Value to Household Income Ratio in Trenton
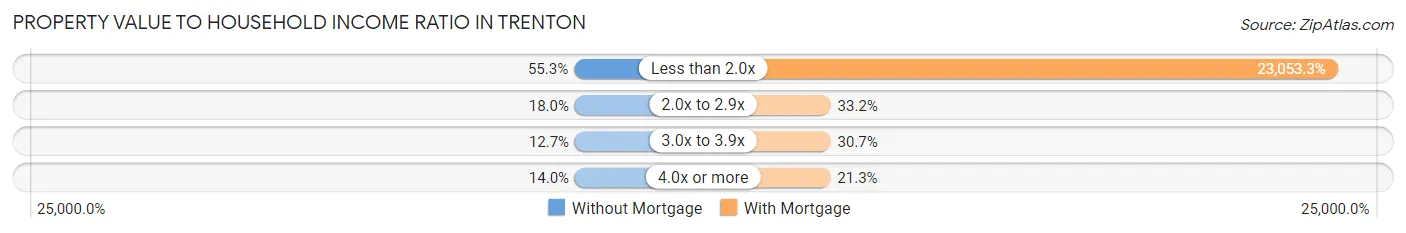
| Value-to-Income Ratio | Without Mortgage | With Mortgage |
| Less than 2.0x | 83 (55.3%) | 56,250 (23,053.3%) |
| 2.0x to 2.9x | 27 (18.0%) | 81 (33.2%) |
| 3.0x to 3.9x | 19 (12.7%) | 75 (30.7%) |
| 4.0x or more | 21 (14.0%) | 52 (21.3%) |
| Total | 150 (100.0%) | 244 (100.0%) |
Real Estate Taxes by Mortgage Status in Trenton
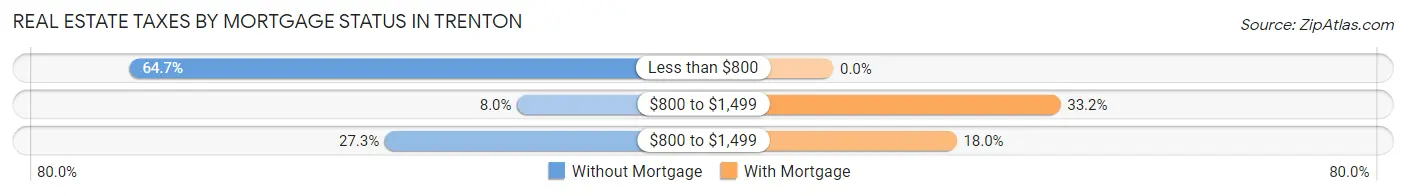
| Property Taxes | Without Mortgage | With Mortgage |
| Less than $800 | 97 (64.7%) | 0 (0.0%) |
| $800 to $1,499 | 12 (8.0%) | 81 (33.2%) |
| $800 to $1,499 | 41 (27.3%) | 44 (18.0%) |
| Total | 150 (100.0%) | 244 (100.0%) |
Health & Disability in Trenton
Health Insurance Coverage by Age in Trenton
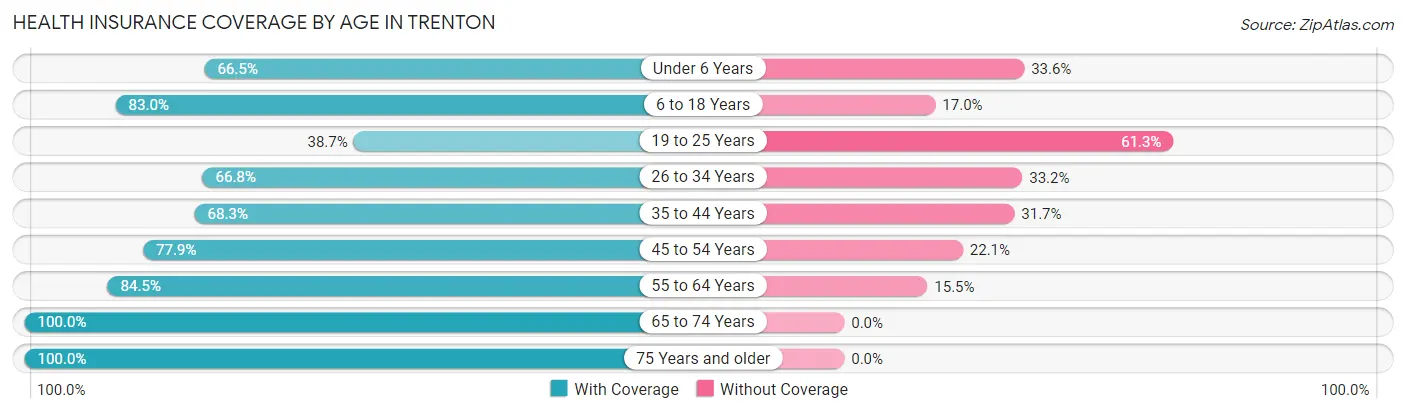
| Age Bracket | With Coverage | Without Coverage |
| Under 6 Years | 103 (66.4%) | 52 (33.6%) |
| 6 to 18 Years | 303 (83.0%) | 62 (17.0%) |
| 19 to 25 Years | 46 (38.7%) | 73 (61.3%) |
| 26 to 34 Years | 165 (66.8%) | 82 (33.2%) |
| 35 to 44 Years | 140 (68.3%) | 65 (31.7%) |
| 45 to 54 Years | 148 (77.9%) | 42 (22.1%) |
| 55 to 64 Years | 180 (84.5%) | 33 (15.5%) |
| 65 to 74 Years | 97 (100.0%) | 0 (0.0%) |
| 75 Years and older | 81 (100.0%) | 0 (0.0%) |
| Total | 1,263 (75.5%) | 409 (24.5%) |
Health Insurance Coverage by Citizenship Status in Trenton
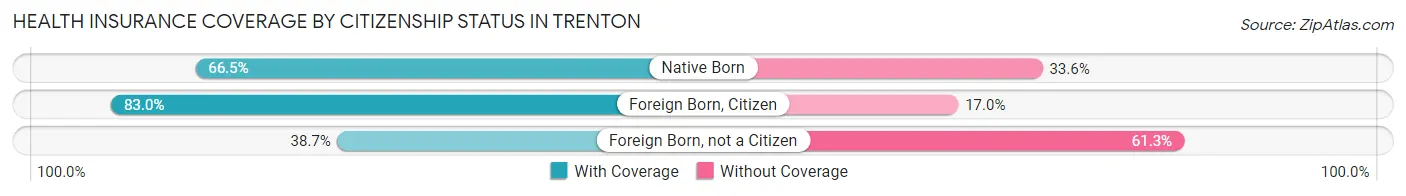
| Citizenship Status | With Coverage | Without Coverage |
| Native Born | 103 (66.4%) | 52 (33.6%) |
| Foreign Born, Citizen | 303 (83.0%) | 62 (17.0%) |
| Foreign Born, not a Citizen | 46 (38.7%) | 73 (61.3%) |
Health Insurance Coverage by Household Income in Trenton
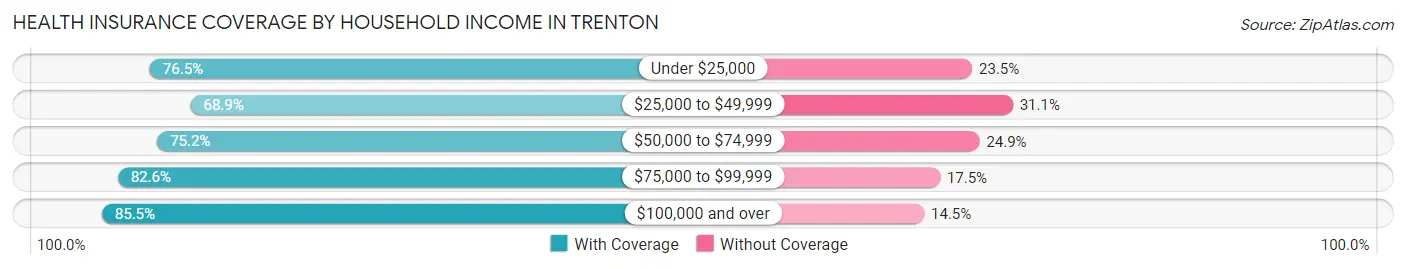
| Household Income | With Coverage | Without Coverage |
| Under $25,000 | 189 (76.5%) | 58 (23.5%) |
| $25,000 to $49,999 | 441 (68.9%) | 199 (31.1%) |
| $50,000 to $74,999 | 251 (75.1%) | 83 (24.8%) |
| $75,000 to $99,999 | 123 (82.6%) | 26 (17.4%) |
| $100,000 and over | 254 (85.5%) | 43 (14.5%) |
Public vs Private Health Insurance Coverage by Age in Trenton
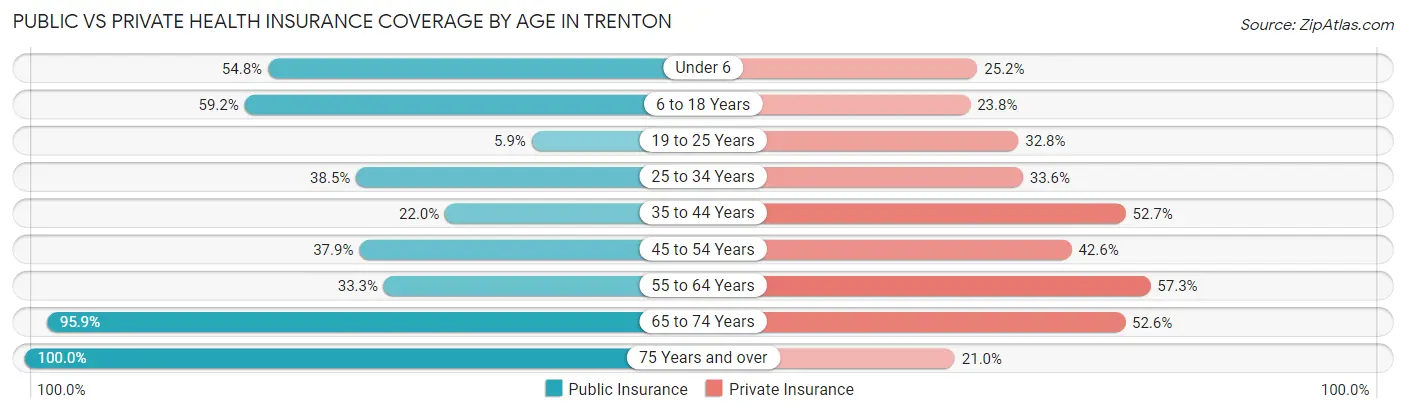
| Age Bracket | Public Insurance | Private Insurance |
| Under 6 | 85 (54.8%) | 39 (25.2%) |
| 6 to 18 Years | 216 (59.2%) | 87 (23.8%) |
| 19 to 25 Years | 7 (5.9%) | 39 (32.8%) |
| 25 to 34 Years | 95 (38.5%) | 83 (33.6%) |
| 35 to 44 Years | 45 (22.0%) | 108 (52.7%) |
| 45 to 54 Years | 72 (37.9%) | 81 (42.6%) |
| 55 to 64 Years | 71 (33.3%) | 122 (57.3%) |
| 65 to 74 Years | 93 (95.9%) | 51 (52.6%) |
| 75 Years and over | 81 (100.0%) | 17 (21.0%) |
| Total | 765 (45.8%) | 627 (37.5%) |
Disability Status by Sex by Age in Trenton
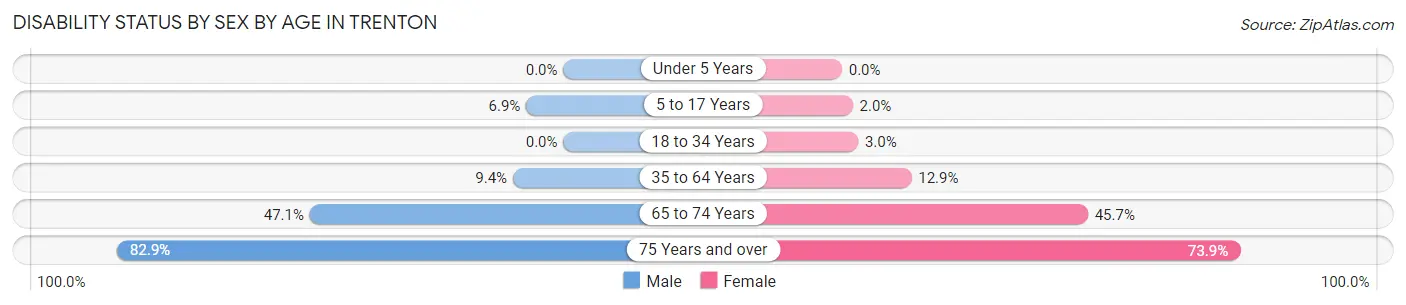
| Age Bracket | Male | Female |
| Under 5 Years | 0 (0.0%) | 0 (0.0%) |
| 5 to 17 Years | 14 (6.9%) | 4 (2.0%) |
| 18 to 34 Years | 0 (0.0%) | 6 (3.0%) |
| 35 to 64 Years | 25 (9.4%) | 44 (12.9%) |
| 65 to 74 Years | 24 (47.1%) | 21 (45.7%) |
| 75 Years and over | 29 (82.9%) | 34 (73.9%) |
Disability Class by Sex by Age in Trenton
Disability Class: Hearing Difficulty
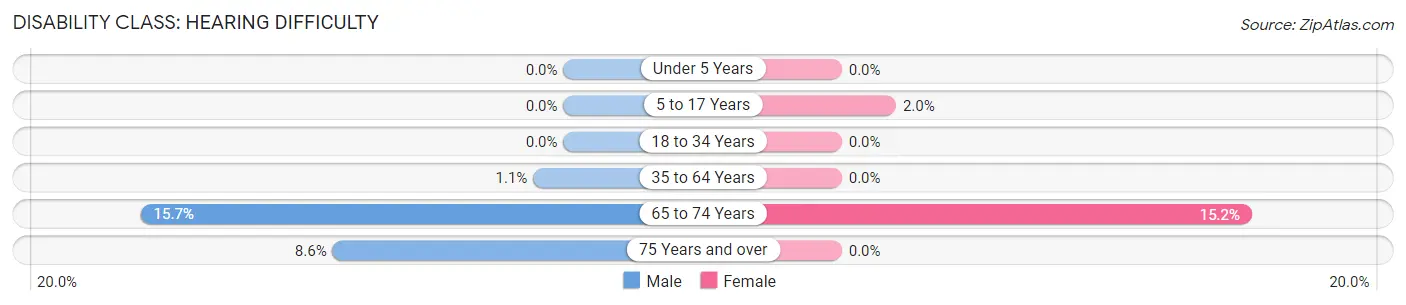
| Age Bracket | Male | Female |
| Under 5 Years | 0 (0.0%) | 0 (0.0%) |
| 5 to 17 Years | 0 (0.0%) | 4 (2.0%) |
| 18 to 34 Years | 0 (0.0%) | 0 (0.0%) |
| 35 to 64 Years | 3 (1.1%) | 0 (0.0%) |
| 65 to 74 Years | 8 (15.7%) | 7 (15.2%) |
| 75 Years and over | 3 (8.6%) | 0 (0.0%) |
Disability Class: Vision Difficulty
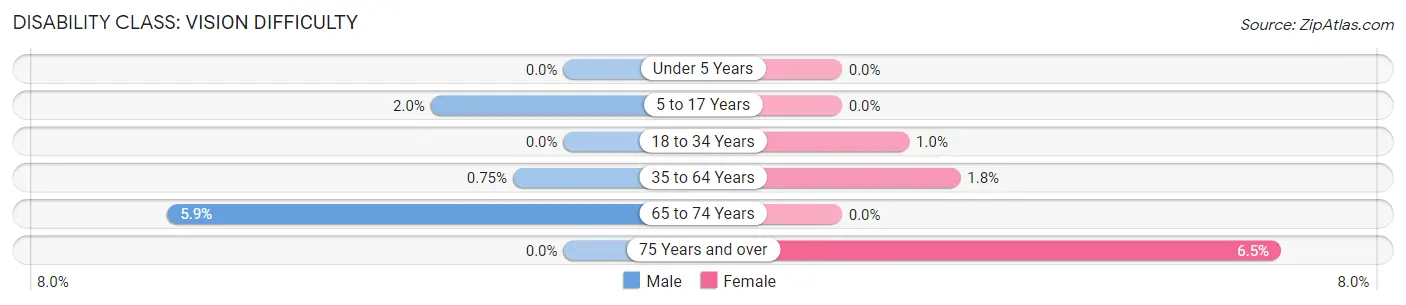
| Age Bracket | Male | Female |
| Under 5 Years | 0 (0.0%) | 0 (0.0%) |
| 5 to 17 Years | 4 (2.0%) | 0 (0.0%) |
| 18 to 34 Years | 0 (0.0%) | 2 (1.0%) |
| 35 to 64 Years | 2 (0.7%) | 6 (1.8%) |
| 65 to 74 Years | 3 (5.9%) | 0 (0.0%) |
| 75 Years and over | 0 (0.0%) | 3 (6.5%) |
Disability Class: Cognitive Difficulty
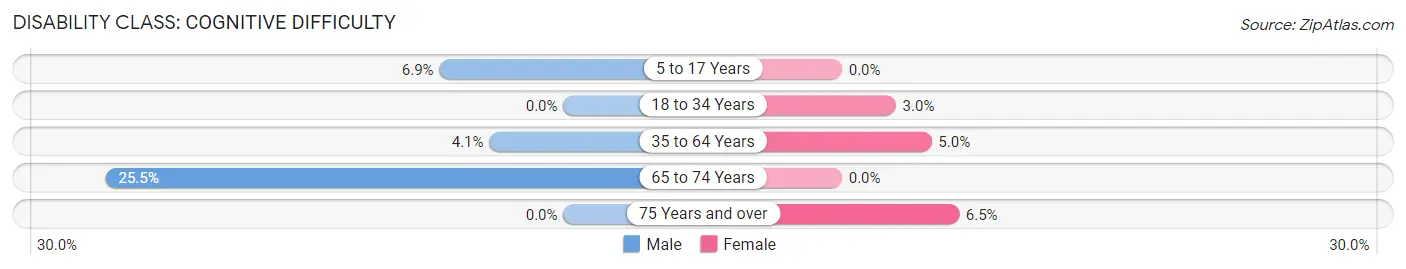
| Age Bracket | Male | Female |
| 5 to 17 Years | 14 (6.9%) | 0 (0.0%) |
| 18 to 34 Years | 0 (0.0%) | 6 (3.0%) |
| 35 to 64 Years | 11 (4.1%) | 17 (5.0%) |
| 65 to 74 Years | 13 (25.5%) | 0 (0.0%) |
| 75 Years and over | 0 (0.0%) | 3 (6.5%) |
Disability Class: Ambulatory Difficulty
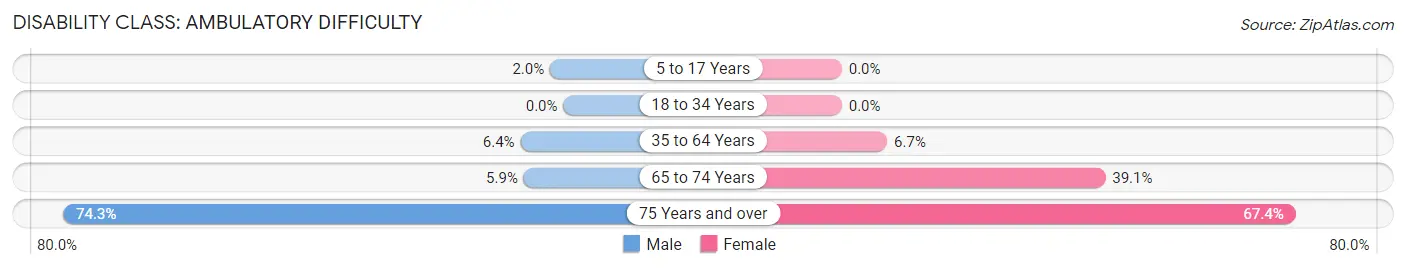
| Age Bracket | Male | Female |
| 5 to 17 Years | 4 (2.0%) | 0 (0.0%) |
| 18 to 34 Years | 0 (0.0%) | 0 (0.0%) |
| 35 to 64 Years | 17 (6.4%) | 23 (6.7%) |
| 65 to 74 Years | 3 (5.9%) | 18 (39.1%) |
| 75 Years and over | 26 (74.3%) | 31 (67.4%) |
Disability Class: Self-Care Difficulty
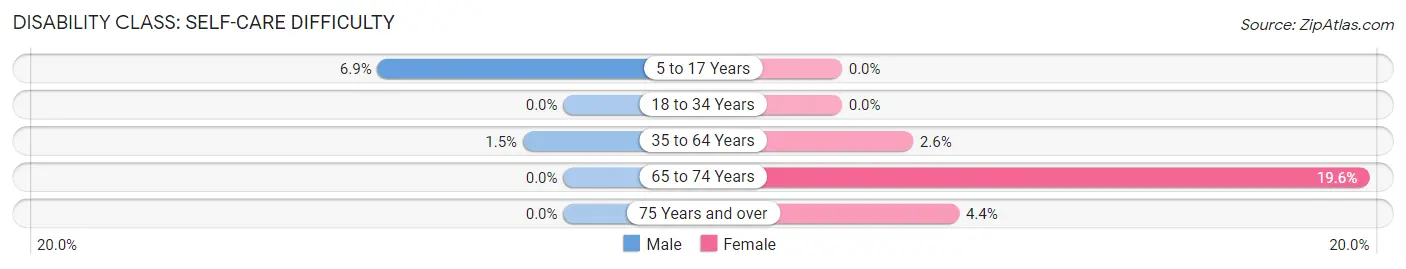
| Age Bracket | Male | Female |
| 5 to 17 Years | 14 (6.9%) | 0 (0.0%) |
| 18 to 34 Years | 0 (0.0%) | 0 (0.0%) |
| 35 to 64 Years | 4 (1.5%) | 9 (2.6%) |
| 65 to 74 Years | 0 (0.0%) | 9 (19.6%) |
| 75 Years and over | 0 (0.0%) | 2 (4.3%) |
Technology Access in Trenton
Computing Device Access in Trenton
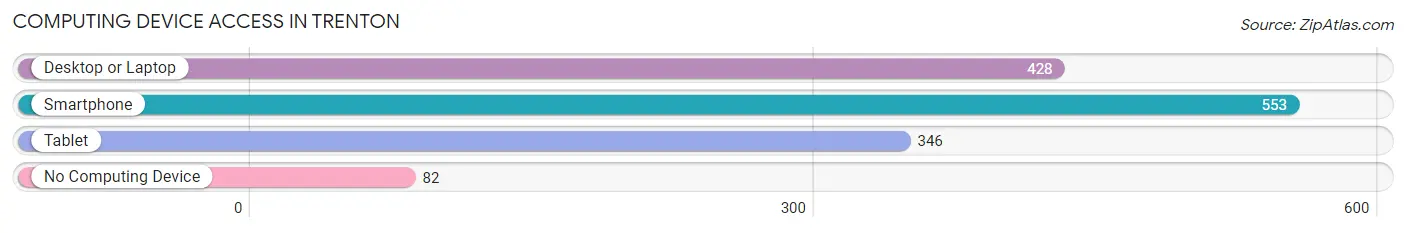
| Device Type | # Households | % Households |
| Desktop or Laptop | 428 | 64.8% |
| Smartphone | 553 | 83.8% |
| Tablet | 346 | 52.4% |
| No Computing Device | 82 | 12.4% |
| Total | 660 | 100.0% |
Internet Access in Trenton
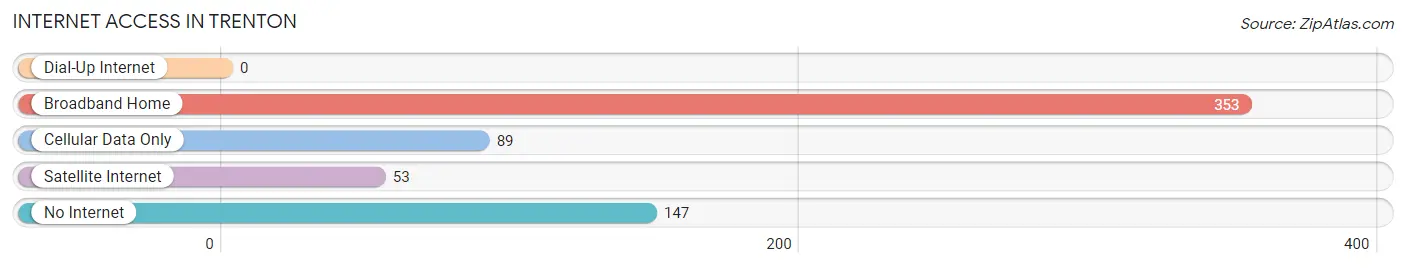
| Internet Type | # Households | % Households |
| Dial-Up Internet | 0 | 0.0% |
| Broadband Home | 353 | 53.5% |
| Cellular Data Only | 89 | 13.5% |
| Satellite Internet | 53 | 8.0% |
| No Internet | 147 | 22.3% |
| Total | 660 | 100.0% |
Trenton Summary
Trenton is a small city located in Gilchrist County, Florida. It is situated in the north-central part of the state, about 30 miles west of Gainesville. The city is part of the Gainesville Metropolitan Statistical Area and has a population of 1,845 as of the 2010 census.
History
Trenton was founded in 1858 by settlers from Georgia and South Carolina. The city was named after the town of Trenton, Georgia, which was the hometown of many of the settlers. The city was incorporated in 1887 and was the county seat of Gilchrist County until the county seat was moved to Trenton in 1925.
Trenton was an important center of the turpentine industry in the late 19th and early 20th centuries. The city was also home to a large sawmill and a number of other businesses.
Geography
Trenton is located at 29°41'N 82°41'W (29.68, -82.68). The city is situated in the north-central part of the state, about 30 miles west of Gainesville. The city is part of the Gainesville Metropolitan Statistical Area and has a population of 1,845 as of the 2010 census.
The city is located in the Suwannee River Valley, which is part of the larger Okefenokee Swamp region. The city is surrounded by rolling hills and is located near the Santa Fe River.
Economy
Trenton is a small city with a limited economy. The city is home to a number of small businesses, including a few restaurants, a grocery store, and a few retail stores. The city is also home to a number of small manufacturing companies, including a furniture manufacturer and a plastics manufacturer.
The city is also home to a number of agricultural businesses, including a number of farms and nurseries. The city is also home to a number of timber companies, which harvest timber from the surrounding forests.
Demographics
As of the 2010 census, the population of Trenton was 1,845. The racial makeup of the city was 79.3% White, 16.2% African American, 0.3% Native American, 0.7% Asian, 0.1% Pacific Islander, 1.2% from other races, and 2.4% from two or more races. Hispanic or Latino of any race were 4.2% of the population.
The median income for a household in the city was $30,938, and the median income for a family was $37,813. The per capita income for the city was $15,945. About 17.2% of families and 20.3% of the population were below the poverty line, including 28.3% of those under age 18 and 11.2% of those age 65 or over.
Common Questions
What is Per Capita Income in Trenton?
Per Capita income in Trenton is $21,866.
What is the Median Family Income in Trenton?
Median Family Income in Trenton is $44,432.
What is the Median Household income in Trenton?
Median Household Income in Trenton is $45,486.
What is Income or Wage Gap in Trenton?
Income or Wage Gap in Trenton is 29.0%.
Women in Trenton earn 71.0 cents for every dollar earned by a man.
What is Family Income Deficit in Trenton?
Family Income Deficit in Trenton is $14,218.
Families that are below poverty line in Trenton earn $14,218 less on average than the poverty threshold level.
What is Inequality or Gini Index in Trenton?
Inequality or Gini Index in Trenton is 0.41.
What is the Total Population of Trenton?
Total Population of Trenton is 1,843.
What is the Total Male Population of Trenton?
Total Male Population of Trenton is 857.
What is the Total Female Population of Trenton?
Total Female Population of Trenton is 986.
What is the Ratio of Males per 100 Females in Trenton?
There are 86.92 Males per 100 Females in Trenton.
What is the Ratio of Females per 100 Males in Trenton?
There are 115.05 Females per 100 Males in Trenton.
What is the Median Population Age in Trenton?
Median Population Age in Trenton is 37.6 Years.
What is the Average Family Size in Trenton
Average Family Size in Trenton is 2.9 People.
What is the Average Household Size in Trenton
Average Household Size in Trenton is 2.5 People.
How Large is the Labor Force in Trenton?
There are 779 People in the Labor Forcein in Trenton.
What is the Percentage of People in the Labor Force in Trenton?
54.8% of People are in the Labor Force in Trenton.
What is the Unemployment Rate in Trenton?
Unemployment Rate in Trenton is 4.7%.