Shady Hills, FL Map & Demographics
Shady Hills Map
Shady Hills Overview
$29,579
PER CAPITA INCOME
$69,792
AVG FAMILY INCOME
$60,538
AVG HOUSEHOLD INCOME
36.5%
WAGE / INCOME GAP [ % ]
63.5¢/ $1
WAGE / INCOME GAP [ $ ]
0.43
INEQUALITY / GINI INDEX
11,724
TOTAL POPULATION
6,105
MALE POPULATION
5,619
FEMALE POPULATION
108.65
MALES / 100 FEMALES
92.04
FEMALES / 100 MALES
44.3
MEDIAN AGE
3.4
AVG FAMILY SIZE
2.9
AVG HOUSEHOLD SIZE
5,092
LABOR FORCE [ PEOPLE ]
53.3%
PERCENT IN LABOR FORCE
5.7%
UNEMPLOYMENT RATE
Income in Shady Hills
Income Overview in Shady Hills
Per Capita Income in Shady Hills is $29,579, while median incomes of families and households are $69,792 and $60,538 respectively.
| Characteristic | Number | Measure |
| Per Capita Income | 11,724 | $29,579 |
| Median Family Income | 2,865 | $69,792 |
| Mean Family Income | 2,865 | $91,836 |
| Median Household Income | 4,023 | $60,538 |
| Mean Household Income | 4,023 | $80,417 |
| Income Deficit | 2,865 | $0 |
| Wage / Income Gap (%) | 11,724 | 36.54% |
| Wage / Income Gap ($) | 11,724 | 63.46¢ per $1 |
| Gini / Inequality Index | 11,724 | 0.43 |
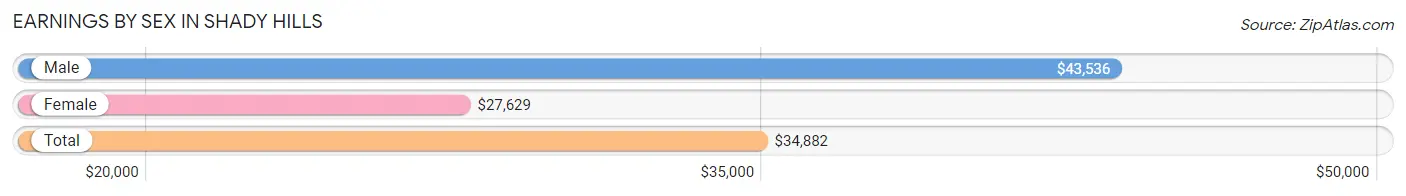
Earnings by Sex in Shady Hills
Average Earnings in Shady Hills are $34,882, $43,536 for men and $27,629 for women, a difference of 36.5%.
| Sex | Number | Average Earnings |
| Male | 3,015 (56.9%) | $43,536 |
| Female | 2,280 (43.1%) | $27,629 |
| Total | 5,295 (100.0%) | $34,882 |
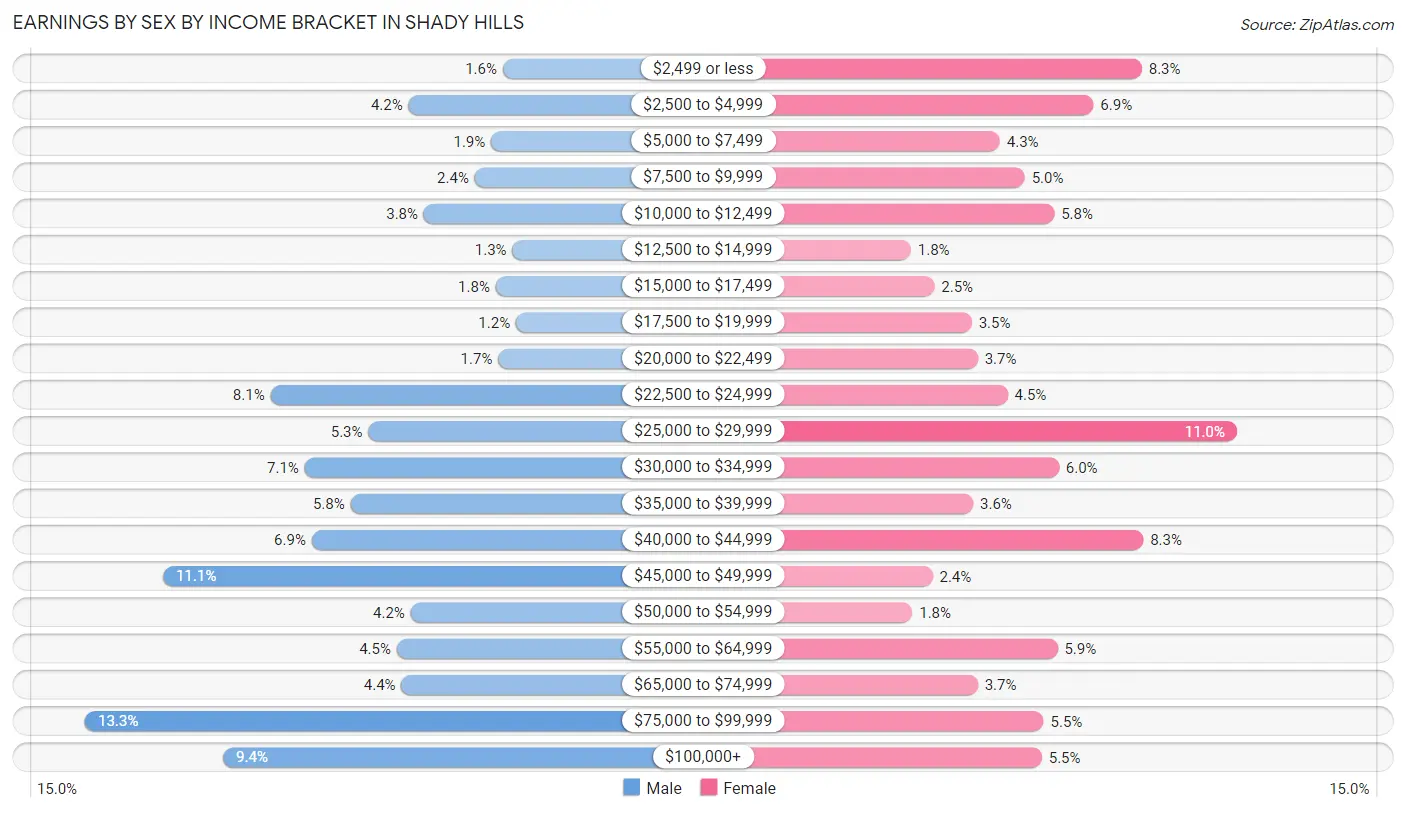
Earnings by Sex by Income Bracket in Shady Hills
The most common earnings brackets in Shady Hills are $75,000 to $99,999 for men (401 | 13.3%) and $25,000 to $29,999 for women (250 | 11.0%).
| Income | Male | Female |
| $2,499 or less | 47 (1.6%) | 189 (8.3%) |
| $2,500 to $4,999 | 127 (4.2%) | 158 (6.9%) |
| $5,000 to $7,499 | 57 (1.9%) | 98 (4.3%) |
| $7,500 to $9,999 | 71 (2.4%) | 114 (5.0%) |
| $10,000 to $12,499 | 114 (3.8%) | 133 (5.8%) |
| $12,500 to $14,999 | 39 (1.3%) | 41 (1.8%) |
| $15,000 to $17,499 | 53 (1.8%) | 56 (2.5%) |
| $17,500 to $19,999 | 36 (1.2%) | 80 (3.5%) |
| $20,000 to $22,499 | 51 (1.7%) | 84 (3.7%) |
| $22,500 to $24,999 | 244 (8.1%) | 103 (4.5%) |
| $25,000 to $29,999 | 161 (5.3%) | 250 (11.0%) |
| $30,000 to $34,999 | 215 (7.1%) | 136 (6.0%) |
| $35,000 to $39,999 | 176 (5.8%) | 81 (3.5%) |
| $40,000 to $44,999 | 209 (6.9%) | 190 (8.3%) |
| $45,000 to $49,999 | 335 (11.1%) | 55 (2.4%) |
| $50,000 to $54,999 | 125 (4.2%) | 42 (1.8%) |
| $55,000 to $64,999 | 137 (4.5%) | 135 (5.9%) |
| $65,000 to $74,999 | 133 (4.4%) | 84 (3.7%) |
| $75,000 to $99,999 | 401 (13.3%) | 126 (5.5%) |
| $100,000+ | 284 (9.4%) | 125 (5.5%) |
| Total | 3,015 (100.0%) | 2,280 (100.0%) |
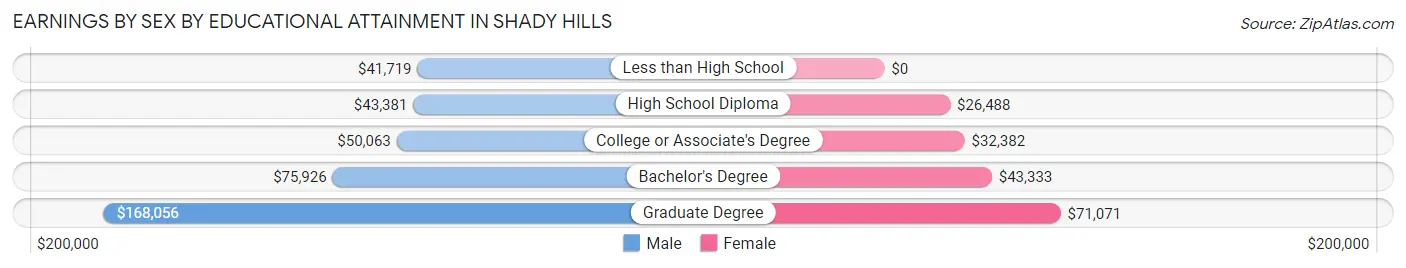
Earnings by Sex by Educational Attainment in Shady Hills
Average earnings in Shady Hills are $45,979 for men and $31,439 for women, a difference of 31.6%. Men with an educational attainment of graduate degree enjoy the highest average annual earnings of $168,056, while those with less than high school education earn the least with $41,719. Women with an educational attainment of graduate degree earn the most with the average annual earnings of $71,071, while those with high school diploma education have the smallest earnings of $26,488.
| Educational Attainment | Male Income | Female Income |
| Less than High School | $41,719 | $0 |
| High School Diploma | $43,381 | $26,488 |
| College or Associate's Degree | $50,063 | $32,382 |
| Bachelor's Degree | $75,926 | $43,333 |
| Graduate Degree | $168,056 | $71,071 |
| Total | $45,979 | $31,439 |
Family Income in Shady Hills
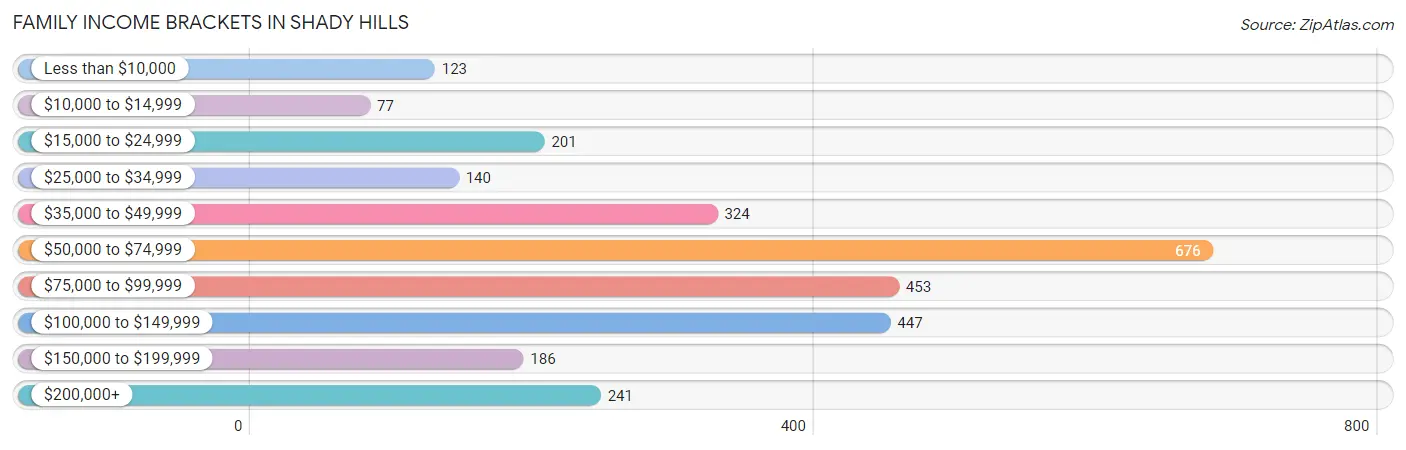
Family Income Brackets in Shady Hills
According to the Shady Hills family income data, there are 676 families falling into the $50,000 to $74,999 income range, which is the most common income bracket and makes up 23.6% of all families. Conversely, the $10,000 to $14,999 income bracket is the least frequent group with only 77 families (2.7%) belonging to this category.
| Income Bracket | # Families | % Families |
| Less than $10,000 | 123 | 4.3% |
| $10,000 to $14,999 | 77 | 2.7% |
| $15,000 to $24,999 | 201 | 7.0% |
| $25,000 to $34,999 | 140 | 4.9% |
| $35,000 to $49,999 | 324 | 11.3% |
| $50,000 to $74,999 | 676 | 23.6% |
| $75,000 to $99,999 | 453 | 15.8% |
| $100,000 to $149,999 | 447 | 15.6% |
| $150,000 to $199,999 | 186 | 6.5% |
| $200,000+ | 241 | 8.4% |
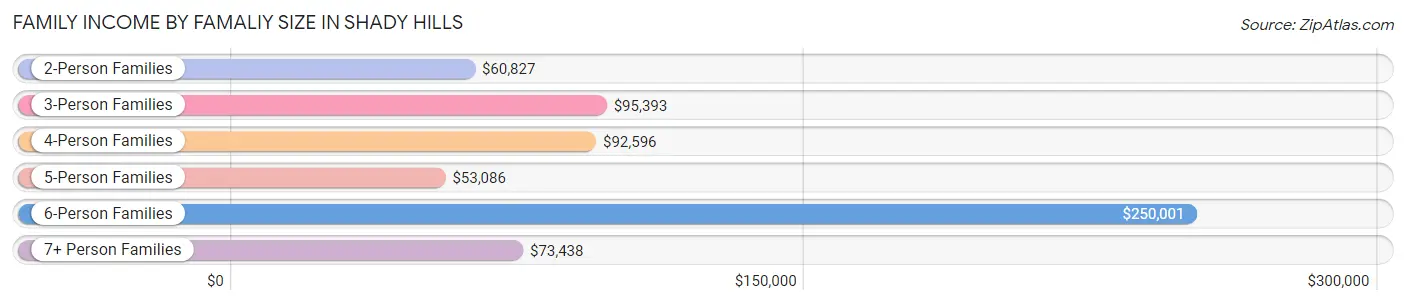
Family Income by Famaliy Size in Shady Hills
6-person families (130 | 4.5%) account for the highest median family income in Shady Hills with $250,001 per family, while 6-person families (130 | 4.5%) have the highest median income of $41,667 per family member.
| Income Bracket | # Families | Median Income |
| 2-Person Families | 1,457 (50.9%) | $60,827 |
| 3-Person Families | 415 (14.5%) | $95,393 |
| 4-Person Families | 509 (17.8%) | $92,596 |
| 5-Person Families | 309 (10.8%) | $53,086 |
| 6-Person Families | 130 (4.5%) | $250,001 |
| 7+ Person Families | 45 (1.6%) | $73,438 |
| Total | 2,865 (100.0%) | $69,792 |
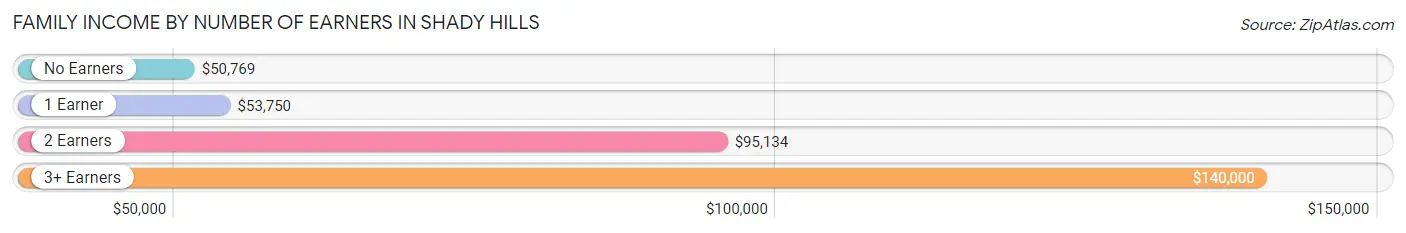
Family Income by Number of Earners in Shady Hills
The median family income in Shady Hills is $69,792, with families comprising 3+ earners (306) having the highest median family income of $140,000, while families with no earners (730) have the lowest median family income of $50,769, accounting for 10.7% and 25.5% of families, respectively.
| Number of Earners | # Families | Median Income |
| No Earners | 730 (25.5%) | $50,769 |
| 1 Earner | 889 (31.0%) | $53,750 |
| 2 Earners | 940 (32.8%) | $95,134 |
| 3+ Earners | 306 (10.7%) | $140,000 |
| Total | 2,865 (100.0%) | $69,792 |
Household Income in Shady Hills
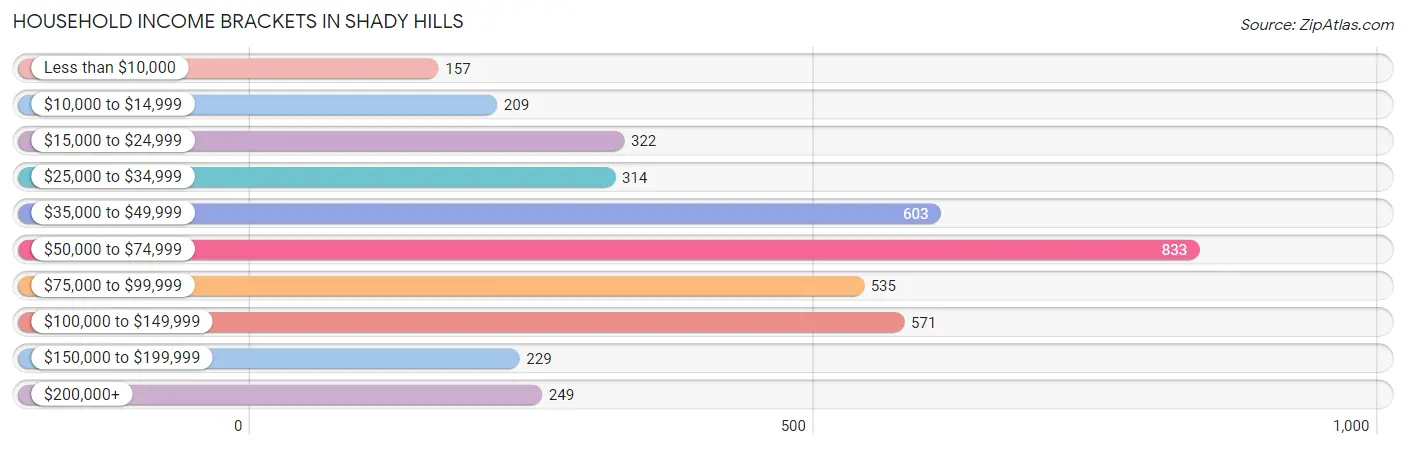
Household Income Brackets in Shady Hills
With 833 households falling in the category, the $50,000 to $74,999 income range is the most frequent in Shady Hills, accounting for 20.7% of all households. In contrast, only 157 households (3.9%) fall into the less than $10,000 income bracket, making it the least populous group.
| Income Bracket | # Households | % Households |
| Less than $10,000 | 157 | 3.9% |
| $10,000 to $14,999 | 209 | 5.2% |
| $15,000 to $24,999 | 322 | 8.0% |
| $25,000 to $34,999 | 314 | 7.8% |
| $35,000 to $49,999 | 603 | 15.0% |
| $50,000 to $74,999 | 833 | 20.7% |
| $75,000 to $99,999 | 535 | 13.3% |
| $100,000 to $149,999 | 571 | 14.2% |
| $150,000 to $199,999 | 229 | 5.7% |
| $200,000+ | 249 | 6.2% |
Household Income by Householder Age in Shady Hills
The median household income in Shady Hills is $60,538, with the highest median household income of $69,583 found in the 25 to 44 years age bracket for the primary householder. A total of 899 households (22.4%) fall into this category. Meanwhile, the 15 to 24 years age bracket for the primary householder has the lowest median household income of $0, with 26 households (0.6%) in this group.
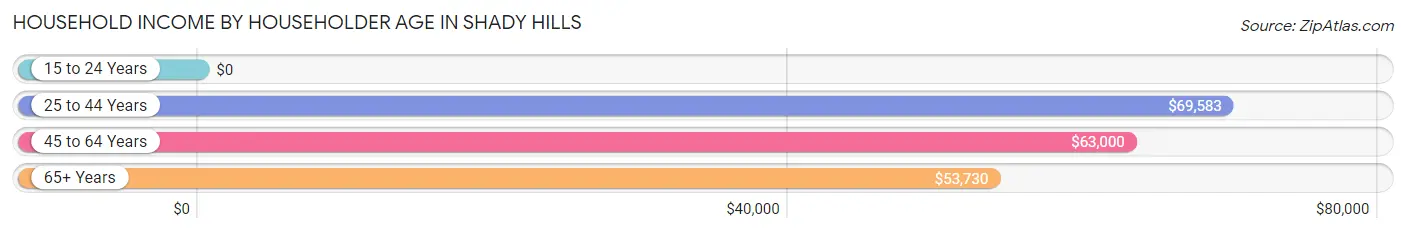
| Income Bracket | # Households | Median Income |
| 15 to 24 Years | 26 (0.6%) | $0 |
| 25 to 44 Years | 899 (22.4%) | $69,583 |
| 45 to 64 Years | 1,678 (41.7%) | $63,000 |
| 65+ Years | 1,420 (35.3%) | $53,730 |
| Total | 4,023 (100.0%) | $60,538 |
Poverty in Shady Hills
Income Below Poverty by Sex and Age in Shady Hills
With 14.7% poverty level for males and 14.4% for females among the residents of Shady Hills, under 5 year old males and 15 year old females are the most vulnerable to poverty, with 189 males (55.4%) and 24 females (35.8%) in their respective age groups living below the poverty level.
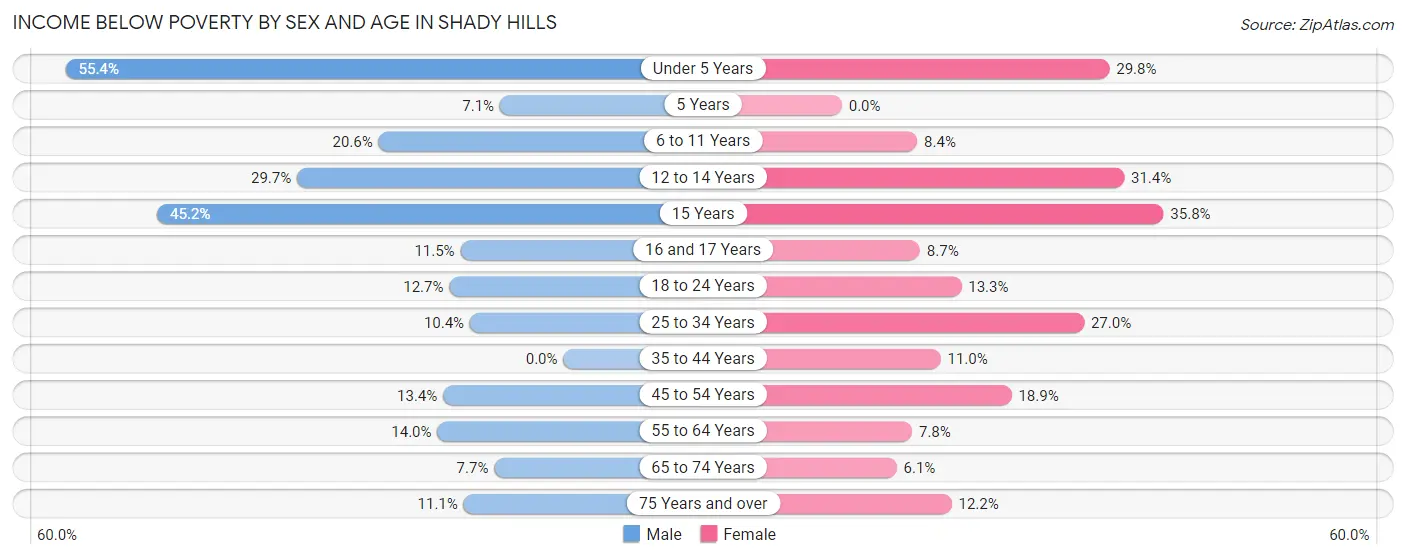
| Age Bracket | Male | Female |
| Under 5 Years | 189 (55.4%) | 84 (29.8%) |
| 5 Years | 12 (7.1%) | 0 (0.0%) |
| 6 to 11 Years | 99 (20.6%) | 25 (8.4%) |
| 12 to 14 Years | 78 (29.7%) | 44 (31.4%) |
| 15 Years | 19 (45.2%) | 24 (35.8%) |
| 16 and 17 Years | 11 (11.5%) | 12 (8.7%) |
| 18 to 24 Years | 64 (12.7%) | 66 (13.3%) |
| 25 to 34 Years | 84 (10.4%) | 168 (27.0%) |
| 35 to 44 Years | 0 (0.0%) | 74 (11.0%) |
| 45 to 54 Years | 130 (13.4%) | 127 (18.9%) |
| 55 to 64 Years | 101 (14.0%) | 75 (7.8%) |
| 65 to 74 Years | 51 (7.7%) | 42 (6.1%) |
| 75 Years and over | 53 (11.1%) | 66 (12.2%) |
| Total | 891 (14.7%) | 807 (14.4%) |
Income Above Poverty by Sex and Age in Shady Hills
According to the poverty statistics in Shady Hills, males aged 35 to 44 years and females aged 5 years are the age groups that are most secure financially, with 100.0% of males and 100.0% of females in these age groups living above the poverty line.
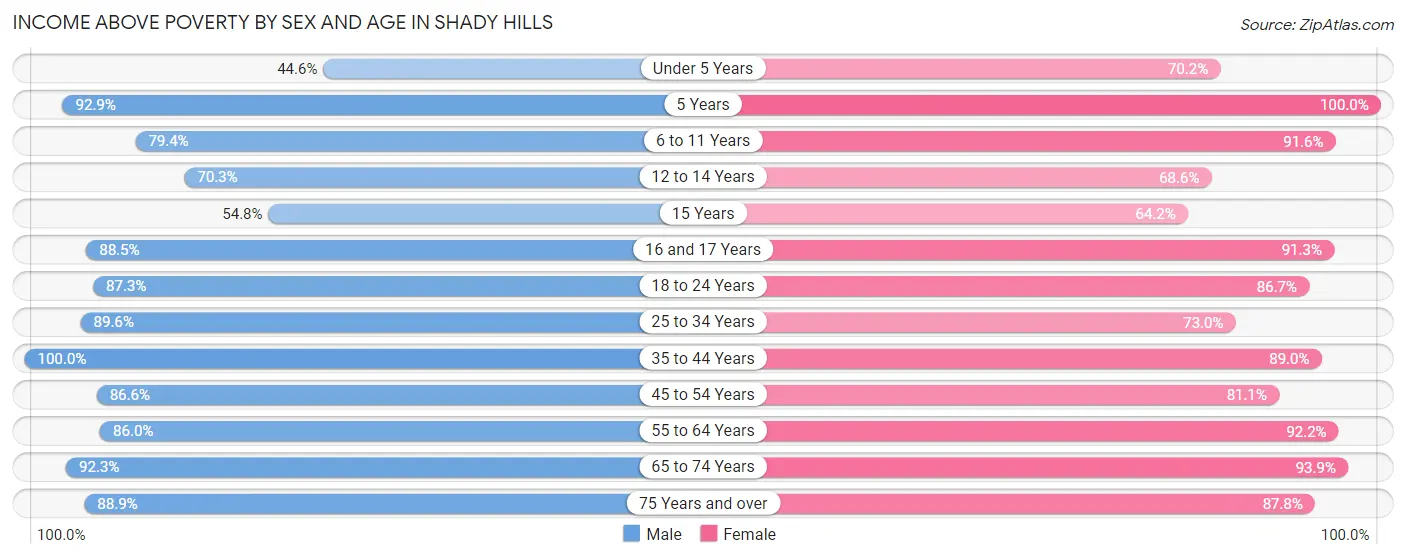
| Age Bracket | Male | Female |
| Under 5 Years | 152 (44.6%) | 198 (70.2%) |
| 5 Years | 158 (92.9%) | 22 (100.0%) |
| 6 to 11 Years | 382 (79.4%) | 273 (91.6%) |
| 12 to 14 Years | 185 (70.3%) | 96 (68.6%) |
| 15 Years | 23 (54.8%) | 43 (64.2%) |
| 16 and 17 Years | 85 (88.5%) | 126 (91.3%) |
| 18 to 24 Years | 440 (87.3%) | 430 (86.7%) |
| 25 to 34 Years | 724 (89.6%) | 455 (73.0%) |
| 35 to 44 Years | 514 (100.0%) | 599 (89.0%) |
| 45 to 54 Years | 841 (86.6%) | 545 (81.1%) |
| 55 to 64 Years | 619 (86.0%) | 884 (92.2%) |
| 65 to 74 Years | 611 (92.3%) | 646 (93.9%) |
| 75 Years and over | 424 (88.9%) | 474 (87.8%) |
| Total | 5,158 (85.3%) | 4,791 (85.6%) |
Income Below Poverty Among Married-Couple Families in Shady Hills
The poverty statistics for married-couple families in Shady Hills show that 7.6% or 168 of the total 2,213 families live below the poverty line. Families with 3 or 4 children have the highest poverty rate of 55.8%, comprising of 86 families. On the other hand, families with 1 or 2 children have the lowest poverty rate of 3.0%, which includes 17 families.
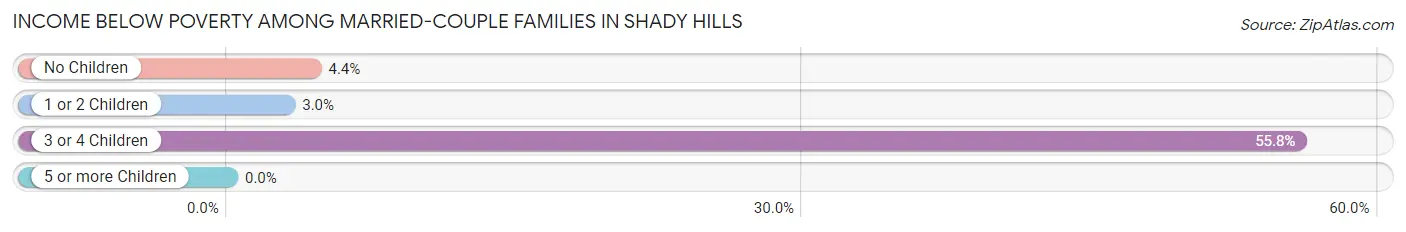
| Children | Above Poverty | Below Poverty |
| No Children | 1,426 (95.6%) | 65 (4.4%) |
| 1 or 2 Children | 551 (97.0%) | 17 (3.0%) |
| 3 or 4 Children | 68 (44.2%) | 86 (55.8%) |
| 5 or more Children | 0 (0.0%) | 0 (0.0%) |
| Total | 2,045 (92.4%) | 168 (7.6%) |
Income Below Poverty Among Single-Parent Households in Shady Hills
According to the poverty data in Shady Hills, 3.2% or 8 single-father households and 29.7% or 119 single-mother households are living below the poverty line. Among single-father households, those with 1 or 2 children have the highest poverty rate, with 8 households (9.6%) experiencing poverty. Likewise, among single-mother households, those with 3 or 4 children have the highest poverty rate, with 46 households (47.4%) falling below the poverty line.
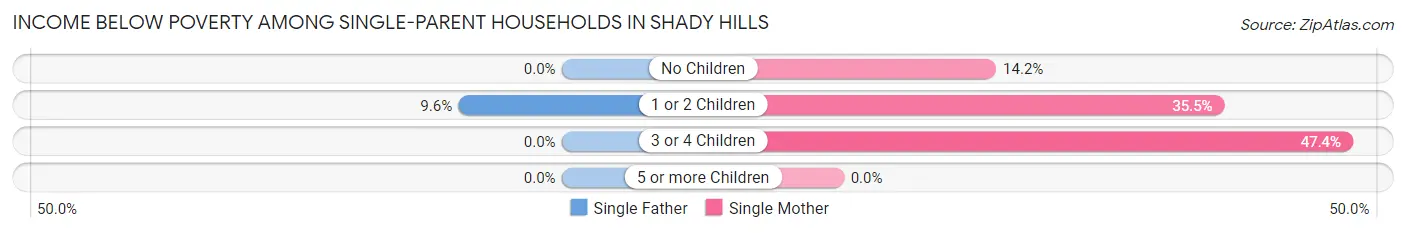
| Children | Single Father | Single Mother |
| No Children | 0 (0.0%) | 23 (14.2%) |
| 1 or 2 Children | 8 (9.6%) | 50 (35.5%) |
| 3 or 4 Children | 0 (0.0%) | 46 (47.4%) |
| 5 or more Children | 0 (0.0%) | 0 (0.0%) |
| Total | 8 (3.2%) | 119 (29.7%) |
Income Below Poverty Among Married-Couple vs Single-Parent Households in Shady Hills
The poverty data for Shady Hills shows that 168 of the married-couple family households (7.6%) and 127 of the single-parent households (19.5%) are living below the poverty level. Within the married-couple family households, those with 3 or 4 children have the highest poverty rate, with 86 households (55.8%) falling below the poverty line. Among the single-parent households, those with 3 or 4 children have the highest poverty rate, with 46 household (47.4%) living below poverty.
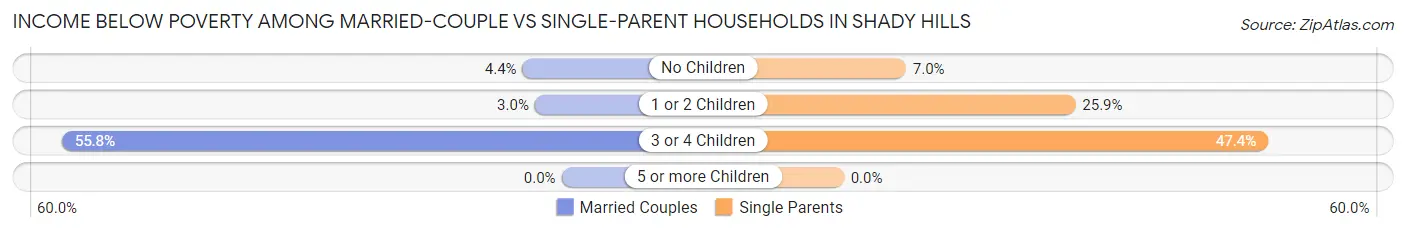
| Children | Married-Couple Families | Single-Parent Households |
| No Children | 65 (4.4%) | 23 (7.0%) |
| 1 or 2 Children | 17 (3.0%) | 58 (25.9%) |
| 3 or 4 Children | 86 (55.8%) | 46 (47.4%) |
| 5 or more Children | 0 (0.0%) | 0 (0.0%) |
| Total | 168 (7.6%) | 127 (19.5%) |
Race in Shady Hills
The most populous races in Shady Hills are White / Caucasian (10,850 | 92.5%), Hispanic or Latino (829 | 7.1%), and Two or more Races (447 | 3.8%).
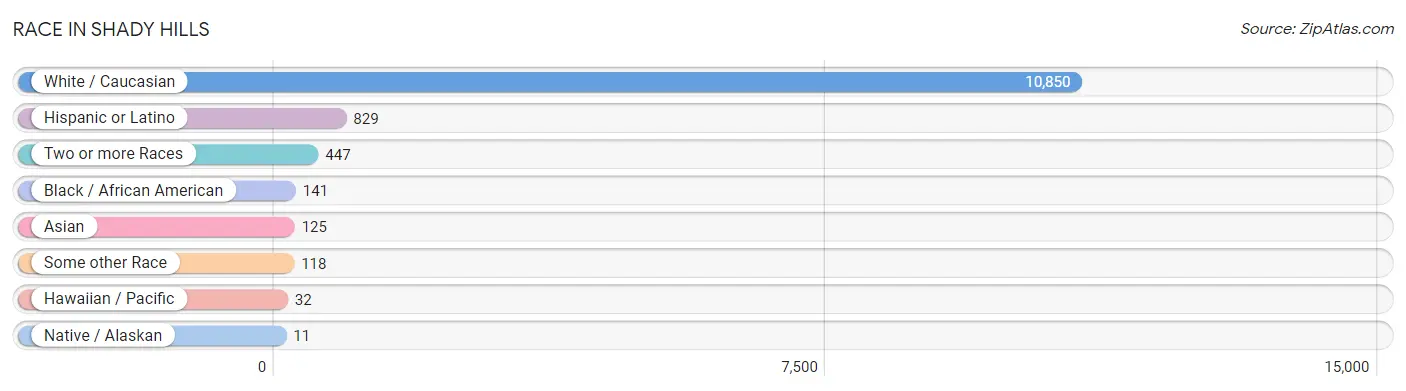
| Race | # Population | % Population |
| Asian | 125 | 1.1% |
| Black / African American | 141 | 1.2% |
| Hawaiian / Pacific | 32 | 0.3% |
| Hispanic or Latino | 829 | 7.1% |
| Native / Alaskan | 11 | 0.1% |
| White / Caucasian | 10,850 | 92.5% |
| Two or more Races | 447 | 3.8% |
| Some other Race | 118 | 1.0% |
| Total | 11,724 | 100.0% |
Ancestry in Shady Hills
The most populous ancestries reported in Shady Hills are German (1,935 | 16.5%), Irish (1,747 | 14.9%), English (1,681 | 14.3%), American (1,670 | 14.2%), and Italian (940 | 8.0%), together accounting for 68.0% of all Shady Hills residents.
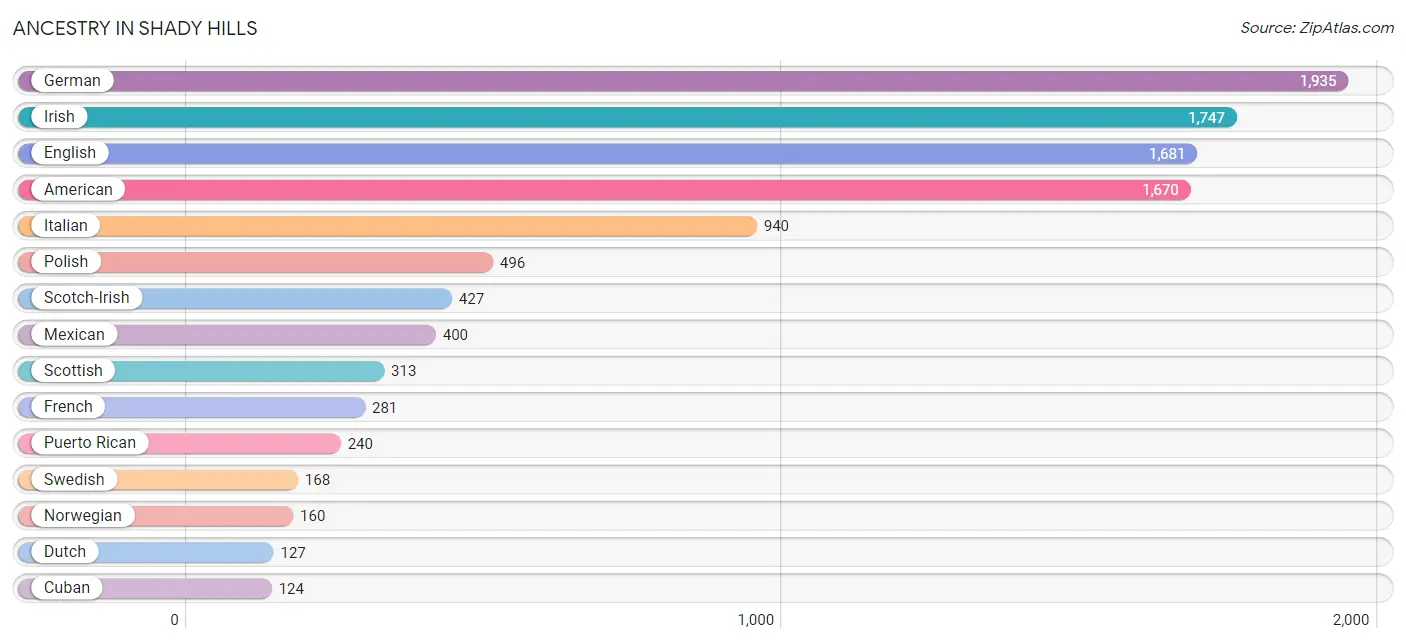
| Ancestry | # Population | % Population |
| American | 1,670 | 14.2% |
| Austrian | 6 | 0.1% |
| Bhutanese | 44 | 0.4% |
| Blackfeet | 4 | 0.0% |
| British | 85 | 0.7% |
| Burmese | 9 | 0.1% |
| Central American | 7 | 0.1% |
| Cherokee | 14 | 0.1% |
| Comanche | 8 | 0.1% |
| Croatian | 7 | 0.1% |
| Cuban | 124 | 1.1% |
| Czechoslovakian | 21 | 0.2% |
| Danish | 8 | 0.1% |
| Dominican | 8 | 0.1% |
| Dutch | 127 | 1.1% |
| English | 1,681 | 14.3% |
| European | 71 | 0.6% |
| Finnish | 10 | 0.1% |
| French | 281 | 2.4% |
| French American Indian | 14 | 0.1% |
| French Canadian | 95 | 0.8% |
| German | 1,935 | 16.5% |
| Greek | 46 | 0.4% |
| Indonesian | 19 | 0.2% |
| Irish | 1,747 | 14.9% |
| Italian | 940 | 8.0% |
| Korean | 9 | 0.1% |
| Lithuanian | 11 | 0.1% |
| Mexican | 400 | 3.4% |
| Native Hawaiian | 34 | 0.3% |
| Nicaraguan | 7 | 0.1% |
| Northern European | 37 | 0.3% |
| Norwegian | 160 | 1.4% |
| Pakistani | 16 | 0.1% |
| Pennsylvania German | 7 | 0.1% |
| Polish | 496 | 4.2% |
| Portuguese | 76 | 0.6% |
| Potawatomi | 3 | 0.0% |
| Puerto Rican | 240 | 2.1% |
| Russian | 36 | 0.3% |
| Scandinavian | 27 | 0.2% |
| Scotch-Irish | 427 | 3.6% |
| Scottish | 313 | 2.7% |
| Slovak | 32 | 0.3% |
| South American | 20 | 0.2% |
| Spanish | 4 | 0.0% |
| Sri Lankan | 25 | 0.2% |
| Swedish | 168 | 1.4% |
| Swiss | 28 | 0.2% |
| Thai | 9 | 0.1% |
| Ukrainian | 46 | 0.4% |
| Venezuelan | 20 | 0.2% |
| Vietnamese | 42 | 0.4% |
| Welsh | 90 | 0.8% | View All 54 Rows |
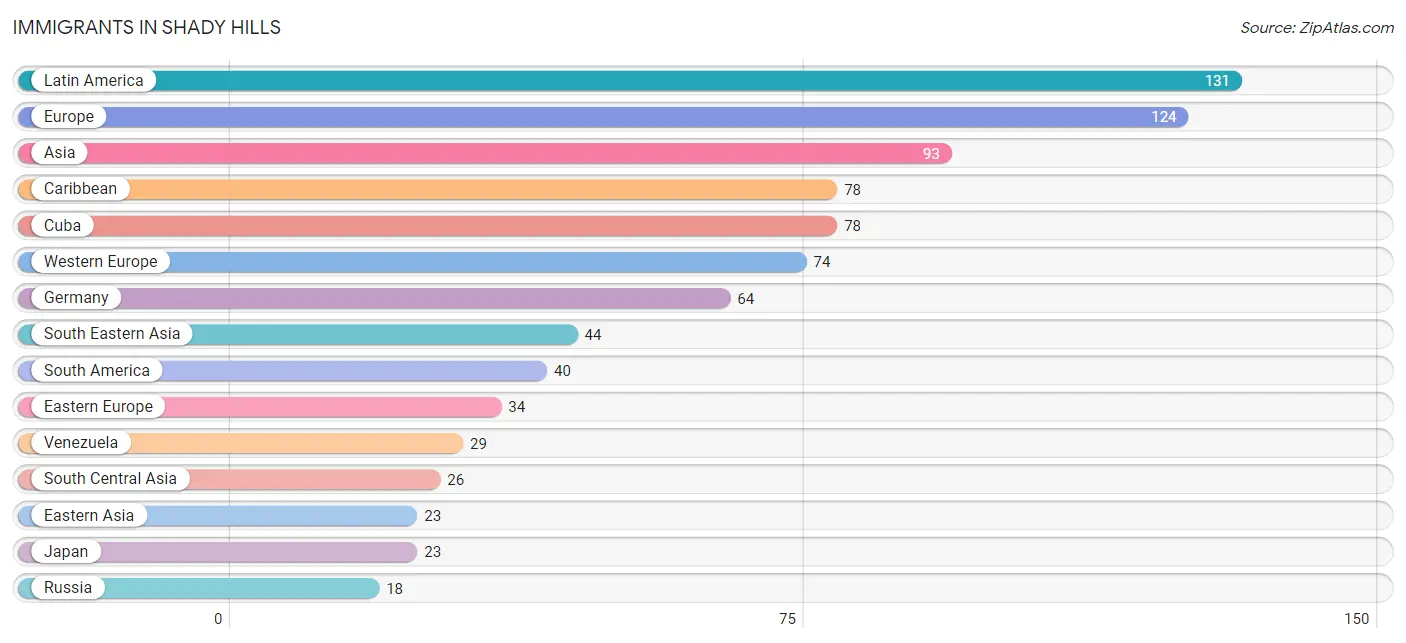
Immigrants in Shady Hills
The most numerous immigrant groups reported in Shady Hills came from Latin America (131 | 1.1%), Europe (124 | 1.1%), Asia (93 | 0.8%), Caribbean (78 | 0.7%), and Cuba (78 | 0.7%), together accounting for 4.3% of all Shady Hills residents.
| Immigration Origin | # Population | % Population |
| Asia | 93 | 0.8% |
| Bangladesh | 15 | 0.1% |
| Caribbean | 78 | 0.7% |
| Central America | 13 | 0.1% |
| Cuba | 78 | 0.7% |
| Denmark | 8 | 0.1% |
| Eastern Asia | 23 | 0.2% |
| Eastern Europe | 34 | 0.3% |
| Ecuador | 5 | 0.0% |
| Europe | 124 | 1.1% |
| France | 5 | 0.0% |
| Germany | 64 | 0.5% |
| Honduras | 6 | 0.1% |
| India | 11 | 0.1% |
| Ireland | 8 | 0.1% |
| Japan | 23 | 0.2% |
| Latin America | 131 | 1.1% |
| Netherlands | 5 | 0.0% |
| Nicaragua | 7 | 0.1% |
| Northern Europe | 16 | 0.1% |
| Peru | 6 | 0.1% |
| Philippines | 9 | 0.1% |
| Poland | 5 | 0.0% |
| Russia | 18 | 0.2% |
| South America | 40 | 0.3% |
| South Central Asia | 26 | 0.2% |
| South Eastern Asia | 44 | 0.4% |
| Thailand | 16 | 0.1% |
| Ukraine | 11 | 0.1% |
| Venezuela | 29 | 0.3% |
| Vietnam | 7 | 0.1% |
| Western Europe | 74 | 0.6% | View All 32 Rows |
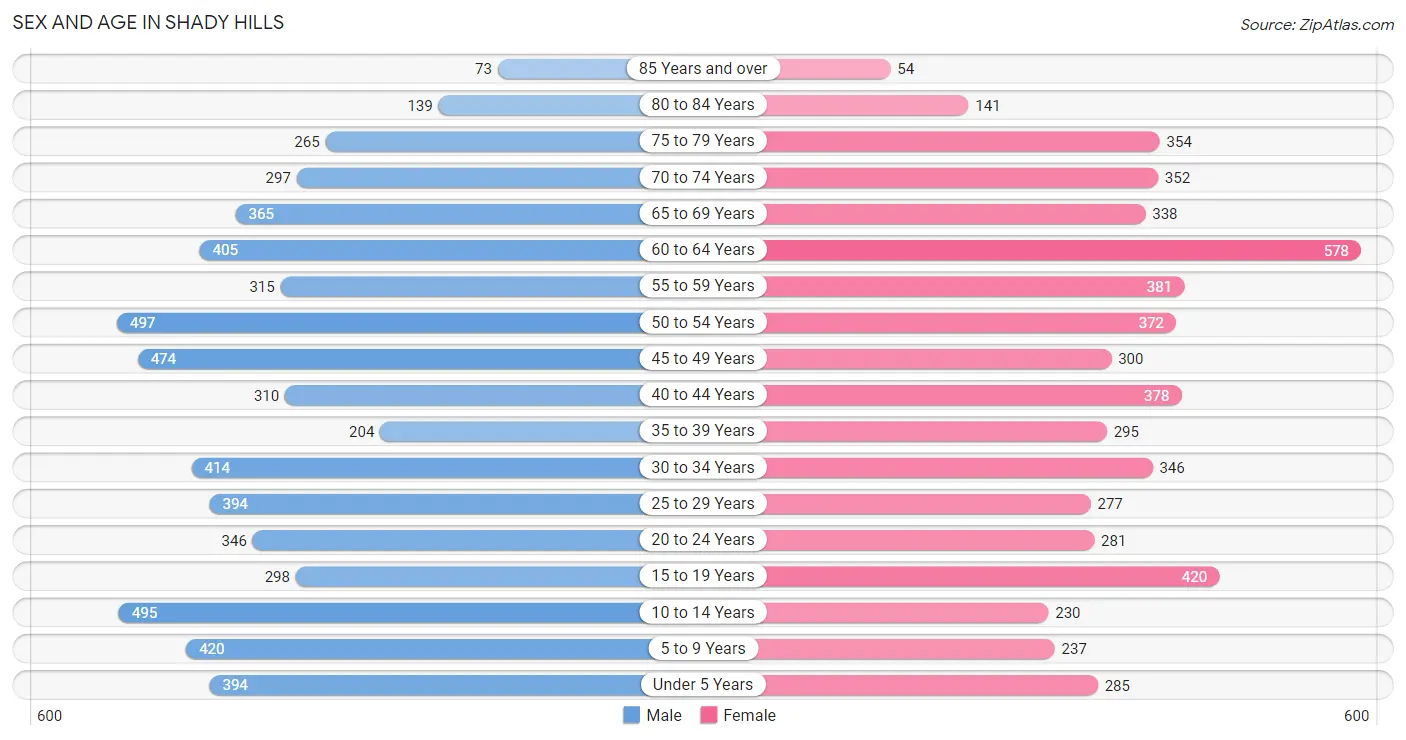
Sex and Age in Shady Hills
Sex and Age in Shady Hills
The most populous age groups in Shady Hills are 50 to 54 Years (497 | 8.1%) for men and 60 to 64 Years (578 | 10.3%) for women.
| Age Bracket | Male | Female |
| Under 5 Years | 394 (6.5%) | 285 (5.1%) |
| 5 to 9 Years | 420 (6.9%) | 237 (4.2%) |
| 10 to 14 Years | 495 (8.1%) | 230 (4.1%) |
| 15 to 19 Years | 298 (4.9%) | 420 (7.5%) |
| 20 to 24 Years | 346 (5.7%) | 281 (5.0%) |
| 25 to 29 Years | 394 (6.5%) | 277 (4.9%) |
| 30 to 34 Years | 414 (6.8%) | 346 (6.2%) |
| 35 to 39 Years | 204 (3.3%) | 295 (5.2%) |
| 40 to 44 Years | 310 (5.1%) | 378 (6.7%) |
| 45 to 49 Years | 474 (7.8%) | 300 (5.3%) |
| 50 to 54 Years | 497 (8.1%) | 372 (6.6%) |
| 55 to 59 Years | 315 (5.2%) | 381 (6.8%) |
| 60 to 64 Years | 405 (6.6%) | 578 (10.3%) |
| 65 to 69 Years | 365 (6.0%) | 338 (6.0%) |
| 70 to 74 Years | 297 (4.9%) | 352 (6.3%) |
| 75 to 79 Years | 265 (4.3%) | 354 (6.3%) |
| 80 to 84 Years | 139 (2.3%) | 141 (2.5%) |
| 85 Years and over | 73 (1.2%) | 54 (1.0%) |
| Total | 6,105 (100.0%) | 5,619 (100.0%) |
Families and Households in Shady Hills
Median Family Size in Shady Hills
The median family size in Shady Hills is 3.41 persons per family, with single female/mother families (400 | 14.0%) accounting for the largest median family size of 3.92 persons per family. On the other hand, married-couple families (2,213 | 77.2%) represent the smallest median family size with 3.31 persons per family.

| Family Type | # Families | Family Size |
| Married-Couple | 2,213 (77.2%) | 3.31 |
| Single Male/Father | 252 (8.8%) | 3.55 |
| Single Female/Mother | 400 (14.0%) | 3.92 |
| Total Families | 2,865 (100.0%) | 3.41 |
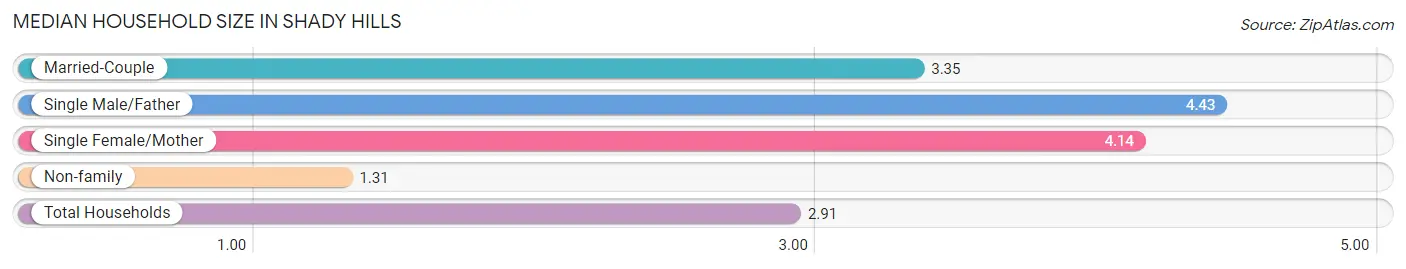
Median Household Size in Shady Hills
The median household size in Shady Hills is 2.91 persons per household, with single male/father households (252 | 6.3%) accounting for the largest median household size of 4.43 persons per household. non-family households (1,158 | 28.8%) represent the smallest median household size with 1.31 persons per household.
| Household Type | # Households | Household Size |
| Married-Couple | 2,213 (55.0%) | 3.35 |
| Single Male/Father | 252 (6.3%) | 4.43 |
| Single Female/Mother | 400 (9.9%) | 4.14 |
| Non-family | 1,158 (28.8%) | 1.31 |
| Total Households | 4,023 (100.0%) | 2.91 |
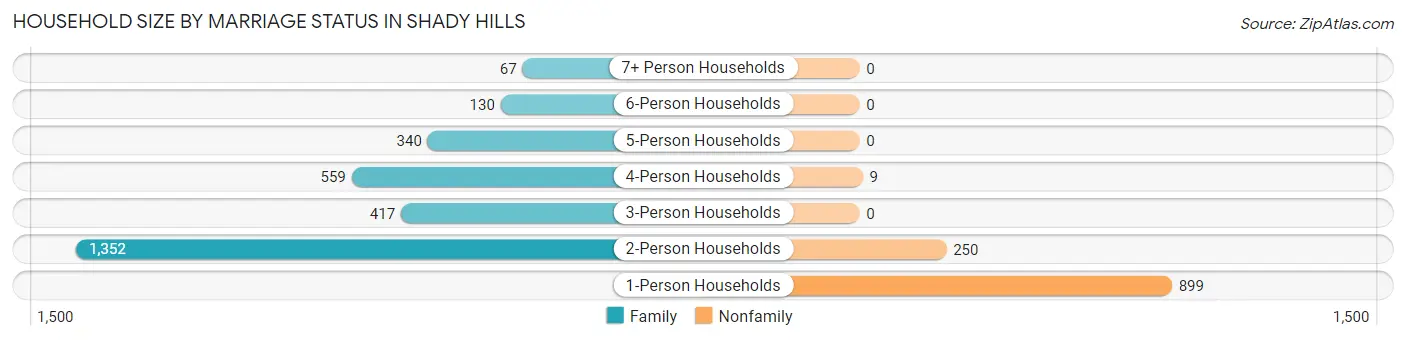
Household Size by Marriage Status in Shady Hills
Out of a total of 4,023 households in Shady Hills, 2,865 (71.2%) are family households, while 1,158 (28.8%) are nonfamily households. The most numerous type of family households are 2-person households, comprising 1,352, and the most common type of nonfamily households are 1-person households, comprising 899.
| Household Size | Family Households | Nonfamily Households |
| 1-Person Households | - | 899 (22.4%) |
| 2-Person Households | 1,352 (33.6%) | 250 (6.2%) |
| 3-Person Households | 417 (10.4%) | 0 (0.0%) |
| 4-Person Households | 559 (13.9%) | 9 (0.2%) |
| 5-Person Households | 340 (8.5%) | 0 (0.0%) |
| 6-Person Households | 130 (3.2%) | 0 (0.0%) |
| 7+ Person Households | 67 (1.7%) | 0 (0.0%) |
| Total | 2,865 (71.2%) | 1,158 (28.8%) |
Female Fertility in Shady Hills
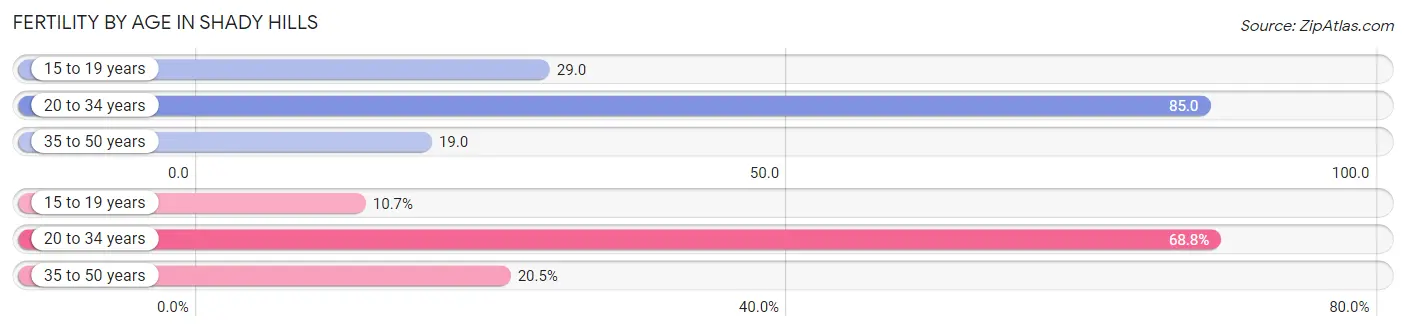
Fertility by Age in Shady Hills
Average fertility rate in Shady Hills is 45.0 births per 1,000 women. Women in the age bracket of 20 to 34 years have the highest fertility rate with 85.0 births per 1,000 women. Women in the age bracket of 20 to 34 years acount for 68.8% of all women with births.
| Age Bracket | Women with Births | Births / 1,000 Women |
| 15 to 19 years | 12 (10.7%) | 29.0 |
| 20 to 34 years | 77 (68.8%) | 85.0 |
| 35 to 50 years | 23 (20.5%) | 19.0 |
| Total | 112 (100.0%) | 45.0 |
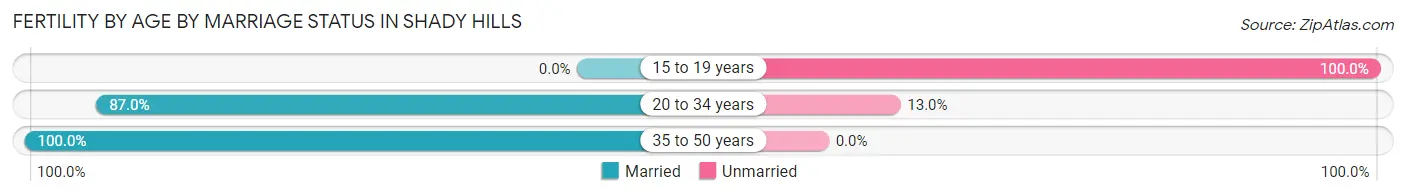
Fertility by Age by Marriage Status in Shady Hills
80.4% of women with births (112) in Shady Hills are married. The highest percentage of unmarried women with births falls into 15 to 19 years age bracket with 100.0% of them unmarried at the time of birth, while the lowest percentage of unmarried women with births belong to 35 to 50 years age bracket with 0.0% of them unmarried.
| Age Bracket | Married | Unmarried |
| 15 to 19 years | 0 (0.0%) | 12 (100.0%) |
| 20 to 34 years | 67 (87.0%) | 10 (13.0%) |
| 35 to 50 years | 23 (100.0%) | 0 (0.0%) |
| Total | 90 (80.4%) | 22 (19.6%) |
Fertility by Education in Shady Hills
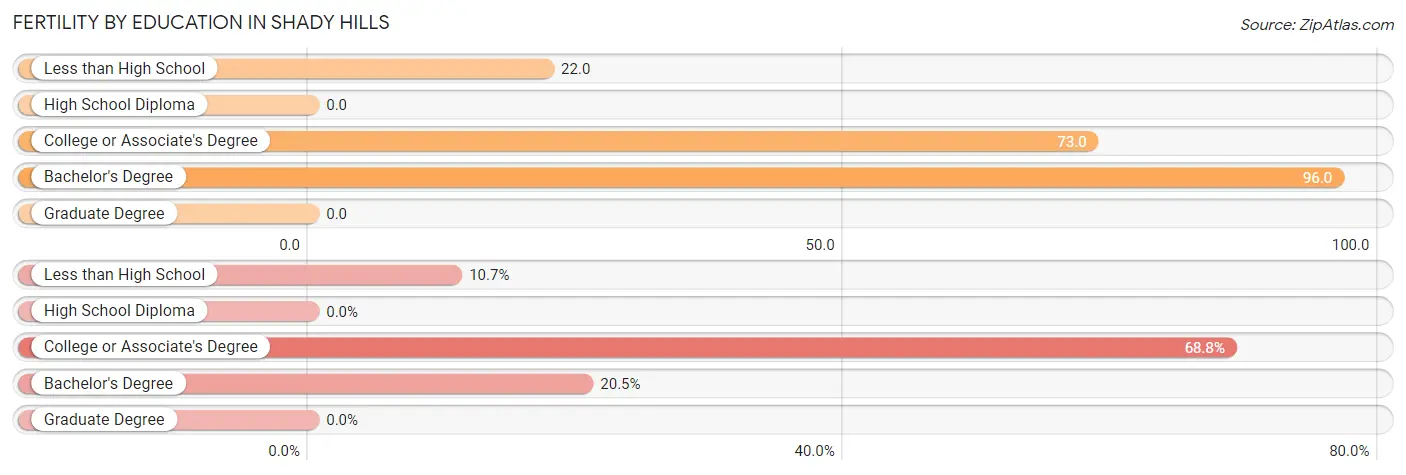
| Educational Attainment | Women with Births | Births / 1,000 Women |
| Less than High School | 12 (10.7%) | 22.0 |
| High School Diploma | 0 (0.0%) | 0.0 |
| College or Associate's Degree | 77 (68.8%) | 73.0 |
| Bachelor's Degree | 23 (20.5%) | 96.0 |
| Graduate Degree | 0 (0.0%) | 0.0 |
| Total | 112 (100.0%) | 45.0 |
Fertility by Education by Marriage Status in Shady Hills
19.6% of women with births in Shady Hills are unmarried. Women with the educational attainment of bachelor's degree are most likely to be married with 100.0% of them married at childbirth, while women with the educational attainment of less than high school are least likely to be married with 100.0% of them unmarried at childbirth.
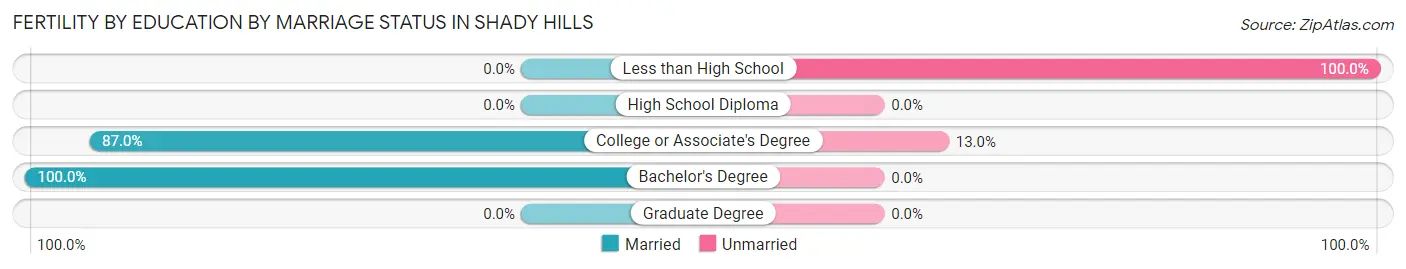
| Educational Attainment | Married | Unmarried |
| Less than High School | 0 (0.0%) | 12 (100.0%) |
| High School Diploma | 0 (0.0%) | 0 (0.0%) |
| College or Associate's Degree | 67 (87.0%) | 10 (13.0%) |
| Bachelor's Degree | 23 (100.0%) | 0 (0.0%) |
| Graduate Degree | 0 (0.0%) | 0 (0.0%) |
| Total | 90 (80.4%) | 22 (19.6%) |
Employment Characteristics in Shady Hills
Employment by Class of Employer in Shady Hills
Among the 4,721 employed individuals in Shady Hills, private company employees (3,580 | 75.8%), self-employed (not incorporated) (347 | 7.3%), and local government employees (242 | 5.1%) make up the most common classes of employment.
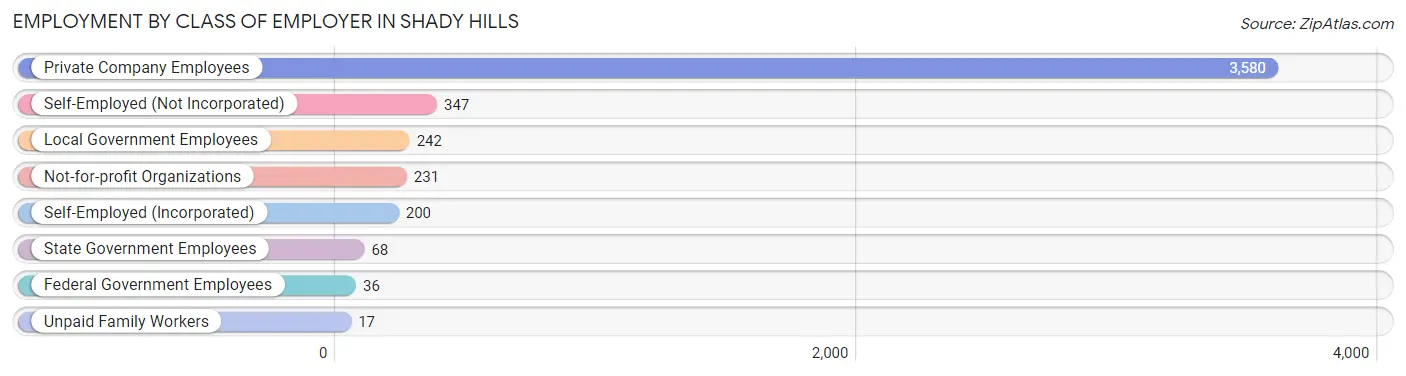
| Employer Class | # Employees | % Employees |
| Private Company Employees | 3,580 | 75.8% |
| Self-Employed (Incorporated) | 200 | 4.2% |
| Self-Employed (Not Incorporated) | 347 | 7.3% |
| Not-for-profit Organizations | 231 | 4.9% |
| Local Government Employees | 242 | 5.1% |
| State Government Employees | 68 | 1.4% |
| Federal Government Employees | 36 | 0.8% |
| Unpaid Family Workers | 17 | 0.4% |
| Total | 4,721 | 100.0% |
Employment Status by Age in Shady Hills
According to the labor force statistics for Shady Hills, out of the total population over 16 years of age (9,553), 53.3% or 5,092 individuals are in the labor force, with 5.7% or 290 of them unemployed. The age group with the highest labor force participation rate is 30 to 34 years, with 88.0% or 669 individuals in the labor force. Within the labor force, the 75 years and over age range has the highest percentage of unemployed individuals, with 40.6% or 26 of them being unemployed.
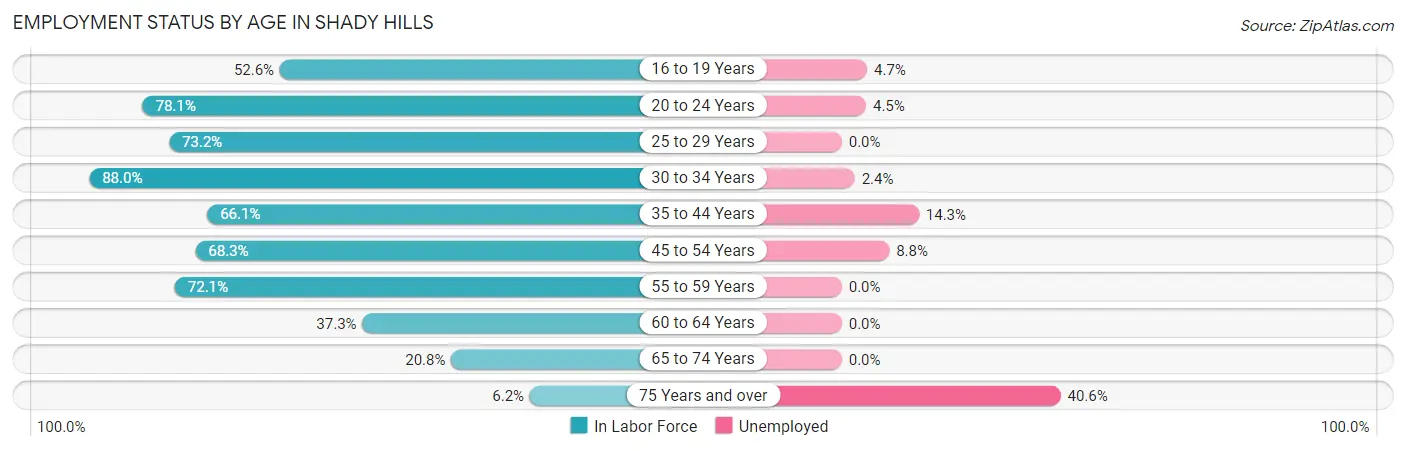
| Age Bracket | In Labor Force | Unemployed |
| 16 to 19 Years | 320 (52.6%) | 15 (4.7%) |
| 20 to 24 Years | 490 (78.1%) | 22 (4.5%) |
| 25 to 29 Years | 491 (73.2%) | 0 (0.0%) |
| 30 to 34 Years | 669 (88.0%) | 16 (2.4%) |
| 35 to 44 Years | 785 (66.1%) | 112 (14.3%) |
| 45 to 54 Years | 1,122 (68.3%) | 99 (8.8%) |
| 55 to 59 Years | 502 (72.1%) | 0 (0.0%) |
| 60 to 64 Years | 367 (37.3%) | 0 (0.0%) |
| 65 to 74 Years | 281 (20.8%) | 0 (0.0%) |
| 75 Years and over | 64 (6.2%) | 26 (40.6%) |
| Total | 5,092 (53.3%) | 290 (5.7%) |
Employment Status by Educational Attainment in Shady Hills
According to labor force statistics for Shady Hills, 66.3% of individuals (3,938) out of the total population between 25 and 64 years of age (5,940) are in the labor force, with 5.8% or 228 of them being unemployed. The group with the highest labor force participation rate are those with the educational attainment of bachelor's degree or higher, with 77.2% or 594 individuals in the labor force. Within the labor force, individuals with less than high school education have the highest percentage of unemployment, with 10.0% or 78 of them being unemployed.
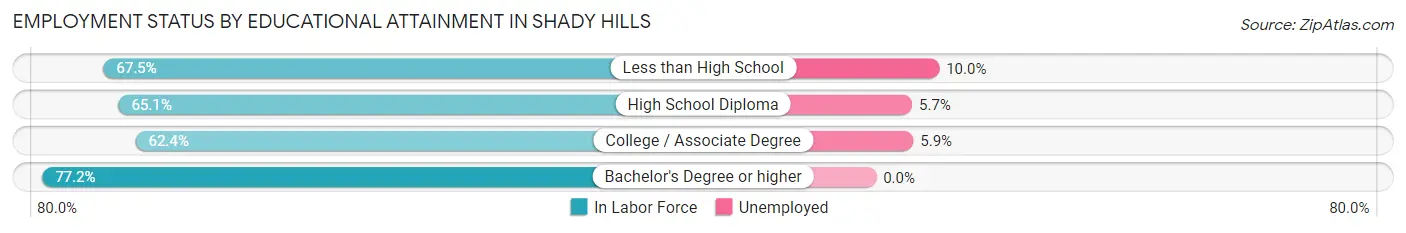
| Educational Attainment | In Labor Force | Unemployed |
| Less than High School | 778 (67.5%) | 115 (10.0%) |
| High School Diploma | 1,398 (65.1%) | 122 (5.7%) |
| College / Associate Degree | 1,168 (62.4%) | 110 (5.9%) |
| Bachelor's Degree or higher | 594 (77.2%) | 0 (0.0%) |
| Total | 3,938 (66.3%) | 345 (5.8%) |
Employment Occupations by Sex in Shady Hills
Management, Business, Science and Arts Occupations
The most common Management, Business, Science and Arts occupations in Shady Hills are Management (367 | 7.7%), Health Diagnosing & Treating (272 | 5.7%), Community & Social Service (239 | 5.0%), Computers, Engineering & Science (208 | 4.3%), and Computers & Mathematics (185 | 3.9%).
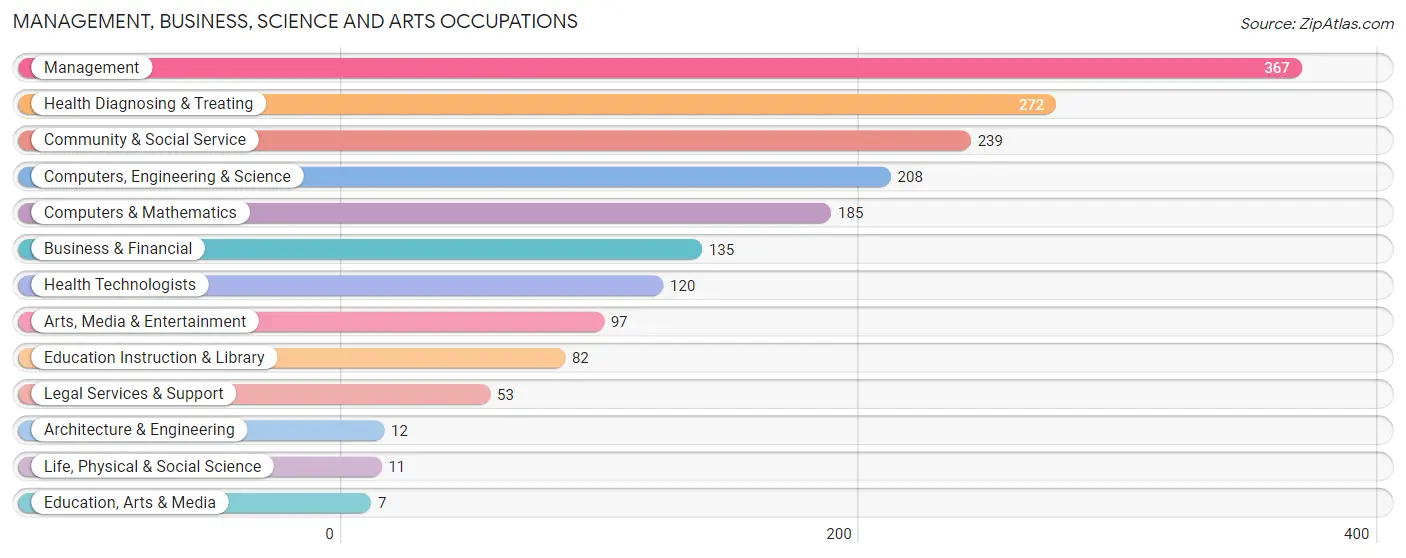
Management, Business, Science and Arts Occupations by Sex
Within the Management, Business, Science and Arts occupations in Shady Hills, the most male-oriented occupations are Architecture & Engineering (100.0%), Life, Physical & Social Science (100.0%), and Computers, Engineering & Science (96.2%), while the most female-oriented occupations are Education, Arts & Media (100.0%), Education Instruction & Library (92.7%), and Health Diagnosing & Treating (78.7%).
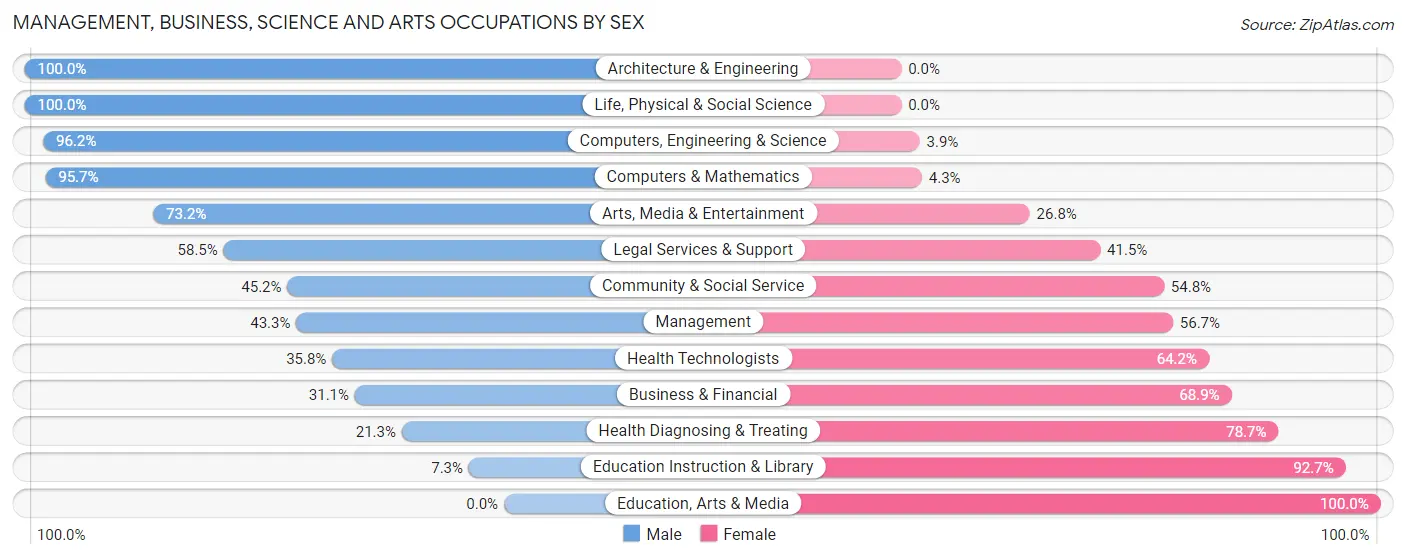
| Occupation | Male | Female |
| Management | 159 (43.3%) | 208 (56.7%) |
| Business & Financial | 42 (31.1%) | 93 (68.9%) |
| Computers, Engineering & Science | 200 (96.2%) | 8 (3.8%) |
| Computers & Mathematics | 177 (95.7%) | 8 (4.3%) |
| Architecture & Engineering | 12 (100.0%) | 0 (0.0%) |
| Life, Physical & Social Science | 11 (100.0%) | 0 (0.0%) |
| Community & Social Service | 108 (45.2%) | 131 (54.8%) |
| Education, Arts & Media | 0 (0.0%) | 7 (100.0%) |
| Legal Services & Support | 31 (58.5%) | 22 (41.5%) |
| Education Instruction & Library | 6 (7.3%) | 76 (92.7%) |
| Arts, Media & Entertainment | 71 (73.2%) | 26 (26.8%) |
| Health Diagnosing & Treating | 58 (21.3%) | 214 (78.7%) |
| Health Technologists | 43 (35.8%) | 77 (64.2%) |
| Total (Category) | 567 (46.4%) | 654 (53.6%) |
| Total (Overall) | 2,761 (57.6%) | 2,032 (42.4%) |
Services Occupations
The most common Services occupations in Shady Hills are Food Preparation & Serving (264 | 5.5%), Cleaning & Maintenance (261 | 5.4%), Personal Care & Service (214 | 4.5%), Healthcare Support (164 | 3.4%), and Security & Protection (84 | 1.8%).

Services Occupations by Sex
Within the Services occupations in Shady Hills, the most male-oriented occupations are Security & Protection (90.5%), Law Enforcement (90.5%), and Personal Care & Service (63.1%), while the most female-oriented occupations are Healthcare Support (95.1%), Food Preparation & Serving (51.5%), and Cleaning & Maintenance (49.4%).
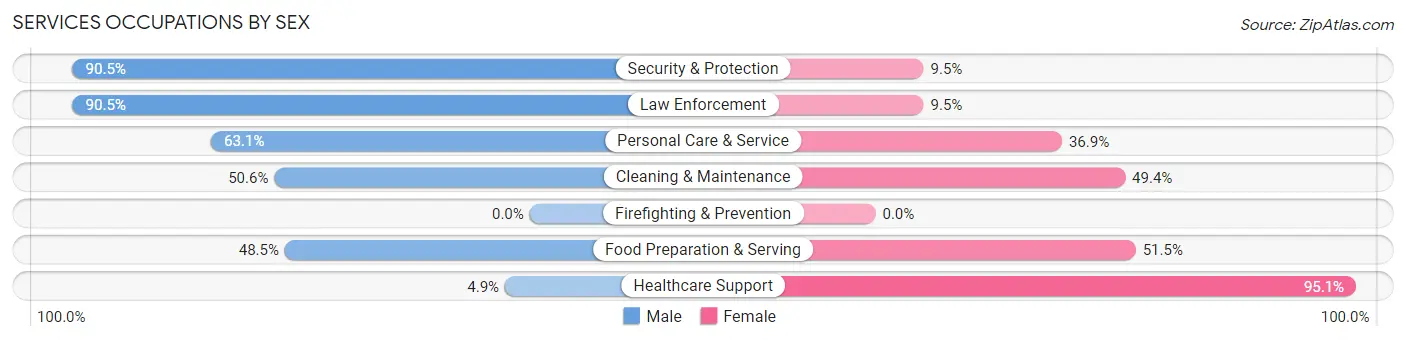
| Occupation | Male | Female |
| Healthcare Support | 8 (4.9%) | 156 (95.1%) |
| Security & Protection | 76 (90.5%) | 8 (9.5%) |
| Firefighting & Prevention | 0 (0.0%) | 0 (0.0%) |
| Law Enforcement | 76 (90.5%) | 8 (9.5%) |
| Food Preparation & Serving | 128 (48.5%) | 136 (51.5%) |
| Cleaning & Maintenance | 132 (50.6%) | 129 (49.4%) |
| Personal Care & Service | 135 (63.1%) | 79 (36.9%) |
| Total (Category) | 479 (48.5%) | 508 (51.5%) |
| Total (Overall) | 2,761 (57.6%) | 2,032 (42.4%) |
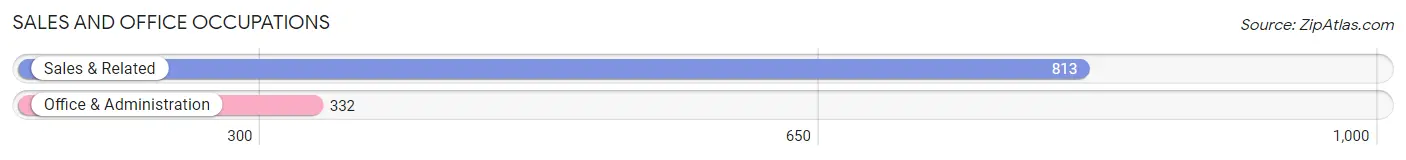
Sales and Office Occupations
The most common Sales and Office occupations in Shady Hills are Sales & Related (813 | 17.0%), and Office & Administration (332 | 6.9%).
Sales and Office Occupations by Sex
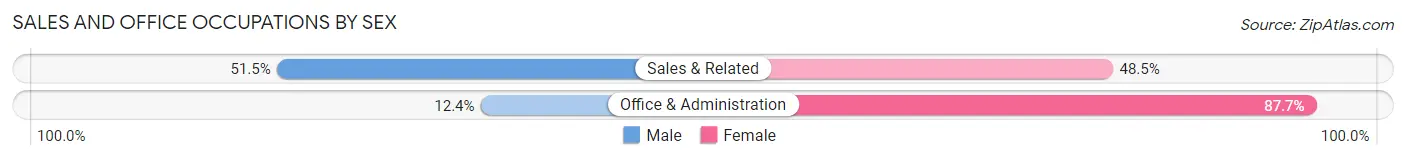
| Occupation | Male | Female |
| Sales & Related | 419 (51.5%) | 394 (48.5%) |
| Office & Administration | 41 (12.3%) | 291 (87.6%) |
| Total (Category) | 460 (40.2%) | 685 (59.8%) |
| Total (Overall) | 2,761 (57.6%) | 2,032 (42.4%) |
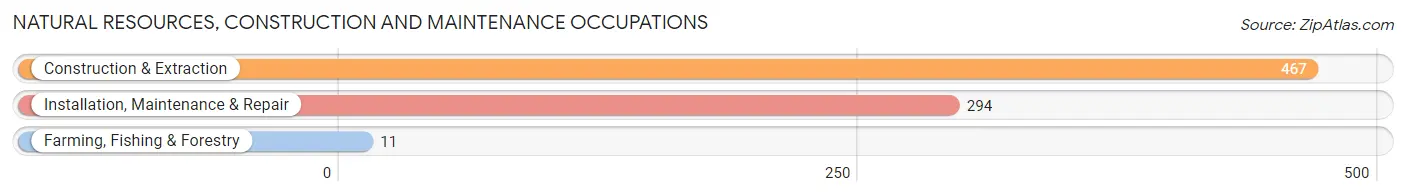
Natural Resources, Construction and Maintenance Occupations
The most common Natural Resources, Construction and Maintenance occupations in Shady Hills are Construction & Extraction (467 | 9.7%), Installation, Maintenance & Repair (294 | 6.1%), and Farming, Fishing & Forestry (11 | 0.2%).
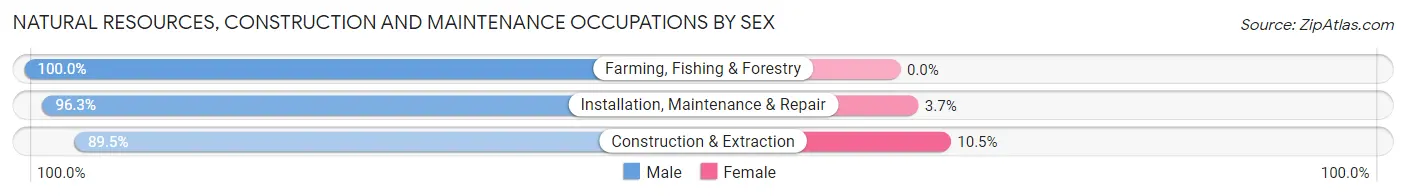
Natural Resources, Construction and Maintenance Occupations by Sex
| Occupation | Male | Female |
| Farming, Fishing & Forestry | 11 (100.0%) | 0 (0.0%) |
| Construction & Extraction | 418 (89.5%) | 49 (10.5%) |
| Installation, Maintenance & Repair | 283 (96.3%) | 11 (3.7%) |
| Total (Category) | 712 (92.2%) | 60 (7.8%) |
| Total (Overall) | 2,761 (57.6%) | 2,032 (42.4%) |
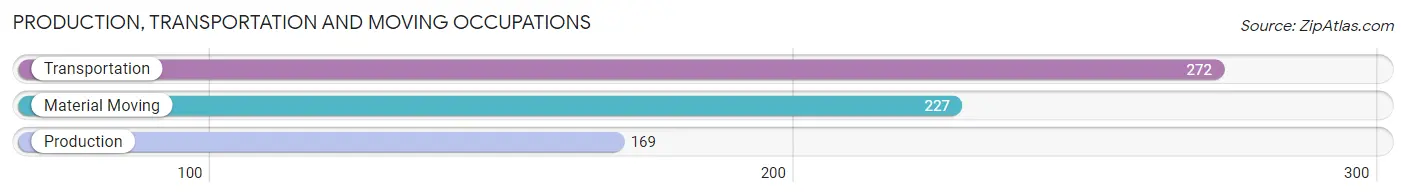
Production, Transportation and Moving Occupations
The most common Production, Transportation and Moving occupations in Shady Hills are Transportation (272 | 5.7%), Material Moving (227 | 4.7%), and Production (169 | 3.5%).
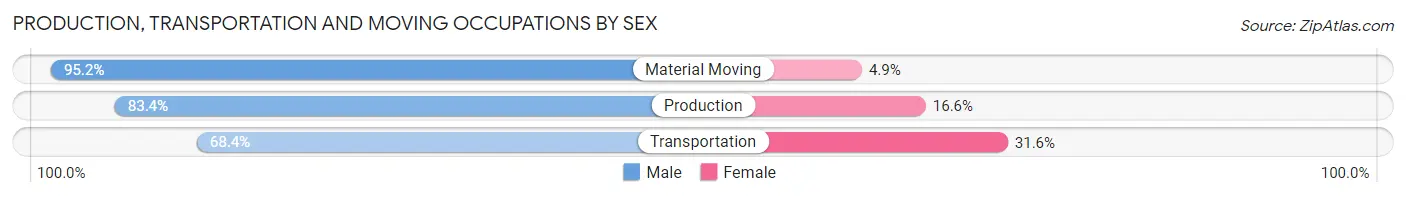
Production, Transportation and Moving Occupations by Sex
| Occupation | Male | Female |
| Production | 141 (83.4%) | 28 (16.6%) |
| Transportation | 186 (68.4%) | 86 (31.6%) |
| Material Moving | 216 (95.2%) | 11 (4.9%) |
| Total (Category) | 543 (81.3%) | 125 (18.7%) |
| Total (Overall) | 2,761 (57.6%) | 2,032 (42.4%) |
Employment Industries by Sex in Shady Hills
Employment Industries in Shady Hills
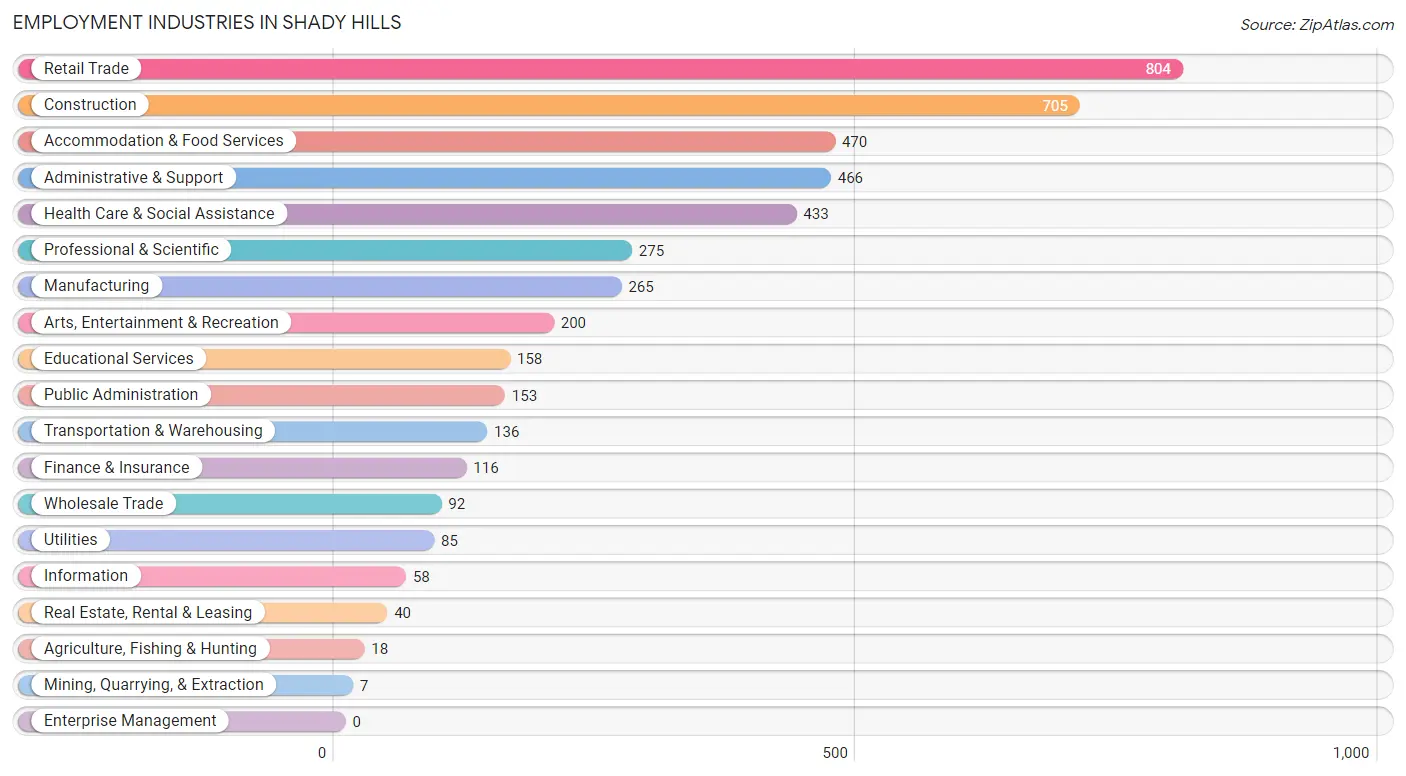
The major employment industries in Shady Hills include Retail Trade (804 | 16.8%), Construction (705 | 14.7%), Accommodation & Food Services (470 | 9.8%), Administrative & Support (466 | 9.7%), and Health Care & Social Assistance (433 | 9.0%).
Employment Industries by Sex in Shady Hills
The Shady Hills industries that see more men than women are Wholesale Trade (100.0%), Arts, Entertainment & Recreation (92.0%), and Construction (84.5%), whereas the industries that tend to have a higher number of women are Mining, Quarrying, & Extraction (100.0%), Educational Services (87.3%), and Finance & Insurance (76.7%).
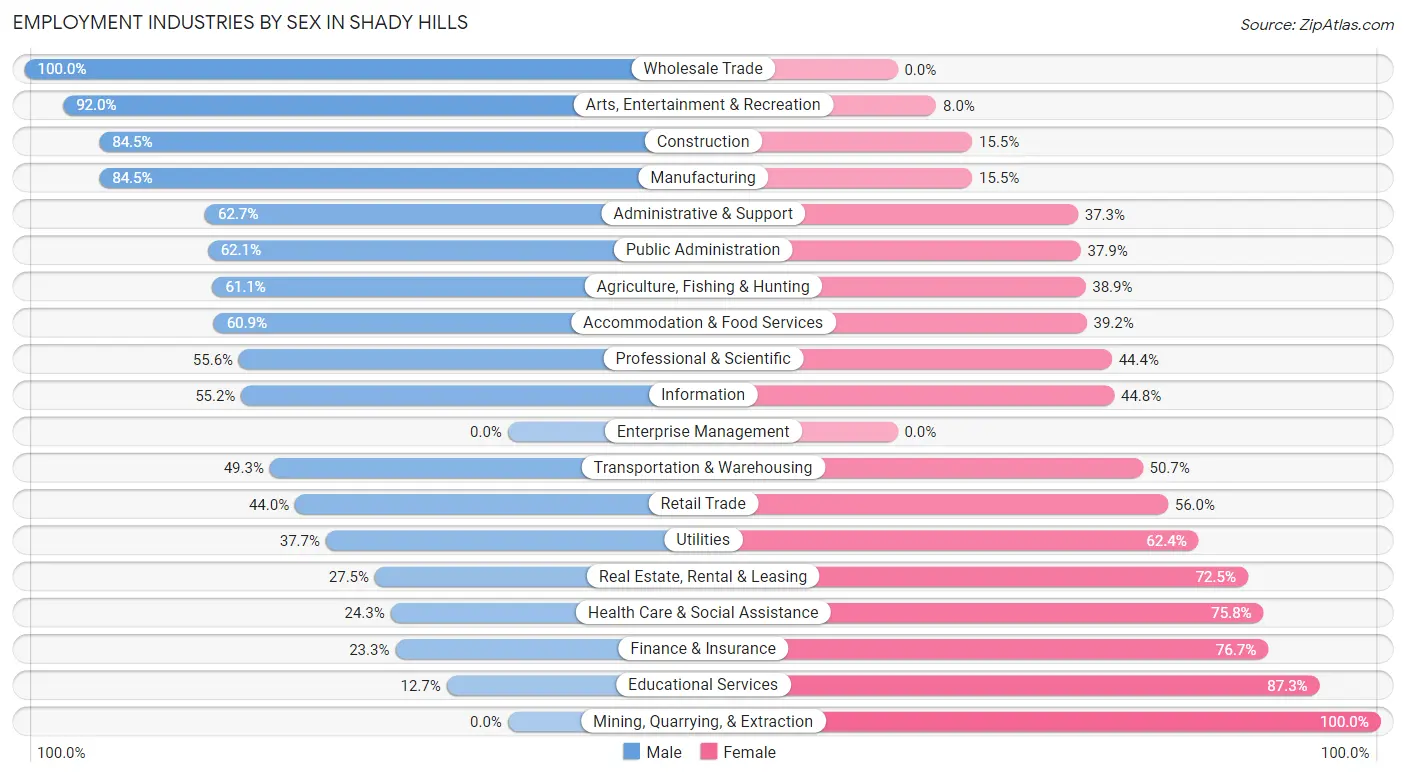
| Industry | Male | Female |
| Agriculture, Fishing & Hunting | 11 (61.1%) | 7 (38.9%) |
| Mining, Quarrying, & Extraction | 0 (0.0%) | 7 (100.0%) |
| Construction | 596 (84.5%) | 109 (15.5%) |
| Manufacturing | 224 (84.5%) | 41 (15.5%) |
| Wholesale Trade | 92 (100.0%) | 0 (0.0%) |
| Retail Trade | 354 (44.0%) | 450 (56.0%) |
| Transportation & Warehousing | 67 (49.3%) | 69 (50.7%) |
| Utilities | 32 (37.7%) | 53 (62.4%) |
| Information | 32 (55.2%) | 26 (44.8%) |
| Finance & Insurance | 27 (23.3%) | 89 (76.7%) |
| Real Estate, Rental & Leasing | 11 (27.5%) | 29 (72.5%) |
| Professional & Scientific | 153 (55.6%) | 122 (44.4%) |
| Enterprise Management | 0 (0.0%) | 0 (0.0%) |
| Administrative & Support | 292 (62.7%) | 174 (37.3%) |
| Educational Services | 20 (12.7%) | 138 (87.3%) |
| Health Care & Social Assistance | 105 (24.2%) | 328 (75.7%) |
| Arts, Entertainment & Recreation | 184 (92.0%) | 16 (8.0%) |
| Accommodation & Food Services | 286 (60.9%) | 184 (39.2%) |
| Public Administration | 95 (62.1%) | 58 (37.9%) |
| Total | 2,761 (57.6%) | 2,032 (42.4%) |
Education in Shady Hills
School Enrollment in Shady Hills
The most common levels of schooling among the 2,340 students in Shady Hills are elementary school (593 | 25.3%), middle school (525 | 22.4%), and high school (469 | 20.0%).
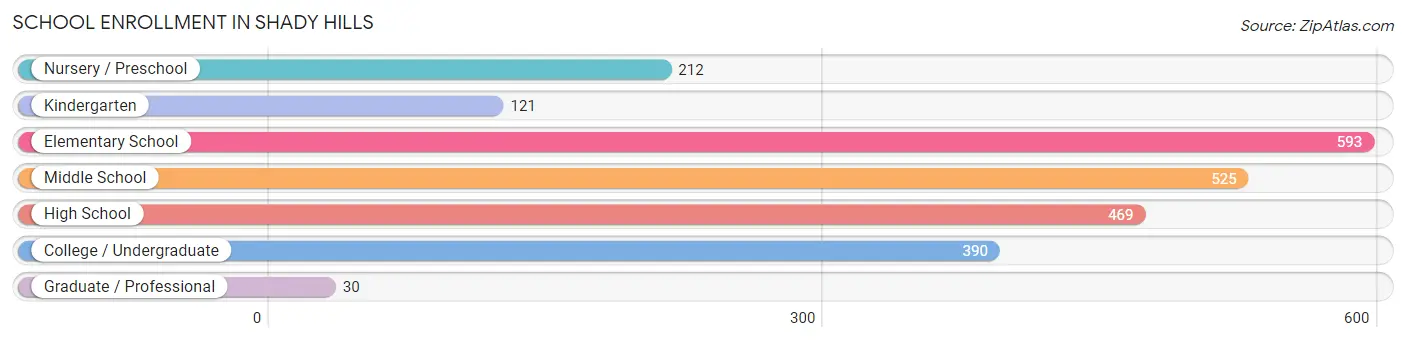
| School Level | # Students | % Students |
| Nursery / Preschool | 212 | 9.1% |
| Kindergarten | 121 | 5.2% |
| Elementary School | 593 | 25.3% |
| Middle School | 525 | 22.4% |
| High School | 469 | 20.0% |
| College / Undergraduate | 390 | 16.7% |
| Graduate / Professional | 30 | 1.3% |
| Total | 2,340 | 100.0% |
School Enrollment by Age by Funding Source in Shady Hills
Out of a total of 2,340 students who are enrolled in schools in Shady Hills, 475 (20.3%) attend a private institution, while the remaining 1,865 (79.7%) are enrolled in public schools. The age group of 35 years and over has the highest likelihood of being enrolled in private schools, with 57 (41.6% in the age bracket) enrolled. Conversely, the age group of 25 to 34 year olds has the lowest likelihood of being enrolled in a private school, with 89 (100.0% in the age bracket) attending a public institution.
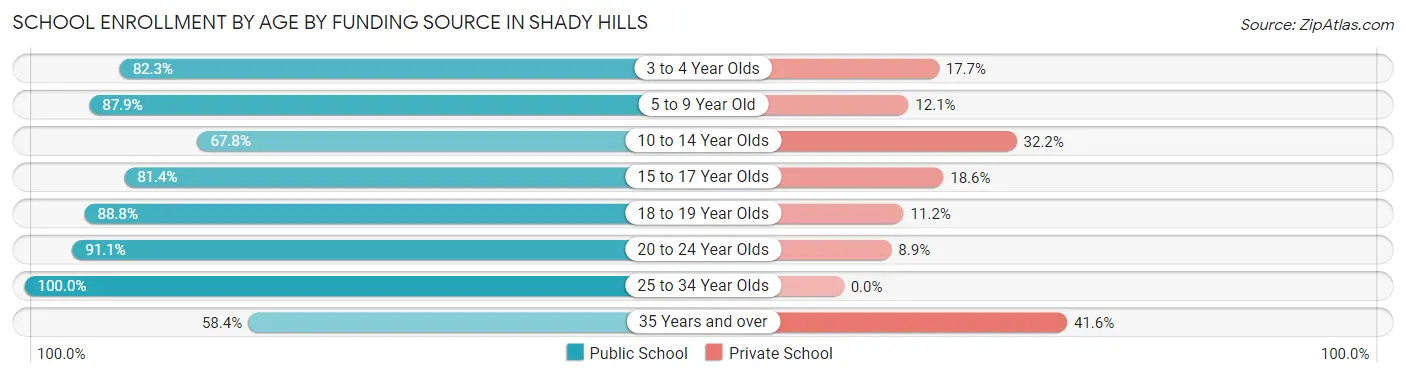
| Age Bracket | Public School | Private School |
| 3 to 4 Year Olds | 65 (82.3%) | 14 (17.7%) |
| 5 to 9 Year Old | 576 (87.9%) | 79 (12.1%) |
| 10 to 14 Year Olds | 484 (67.8%) | 230 (32.2%) |
| 15 to 17 Year Olds | 272 (81.4%) | 62 (18.6%) |
| 18 to 19 Year Olds | 175 (88.8%) | 22 (11.2%) |
| 20 to 24 Year Olds | 123 (91.1%) | 12 (8.9%) |
| 25 to 34 Year Olds | 89 (100.0%) | 0 (0.0%) |
| 35 Years and over | 80 (58.4%) | 57 (41.6%) |
| Total | 1,865 (79.7%) | 475 (20.3%) |
Educational Attainment by Field of Study in Shady Hills
Business (347 | 25.6%), education (196 | 14.4%), arts & humanities (155 | 11.4%), science & technology (147 | 10.8%), and engineering (142 | 10.5%) are the most common fields of study among 1,358 individuals in Shady Hills who have obtained a bachelor's degree or higher.
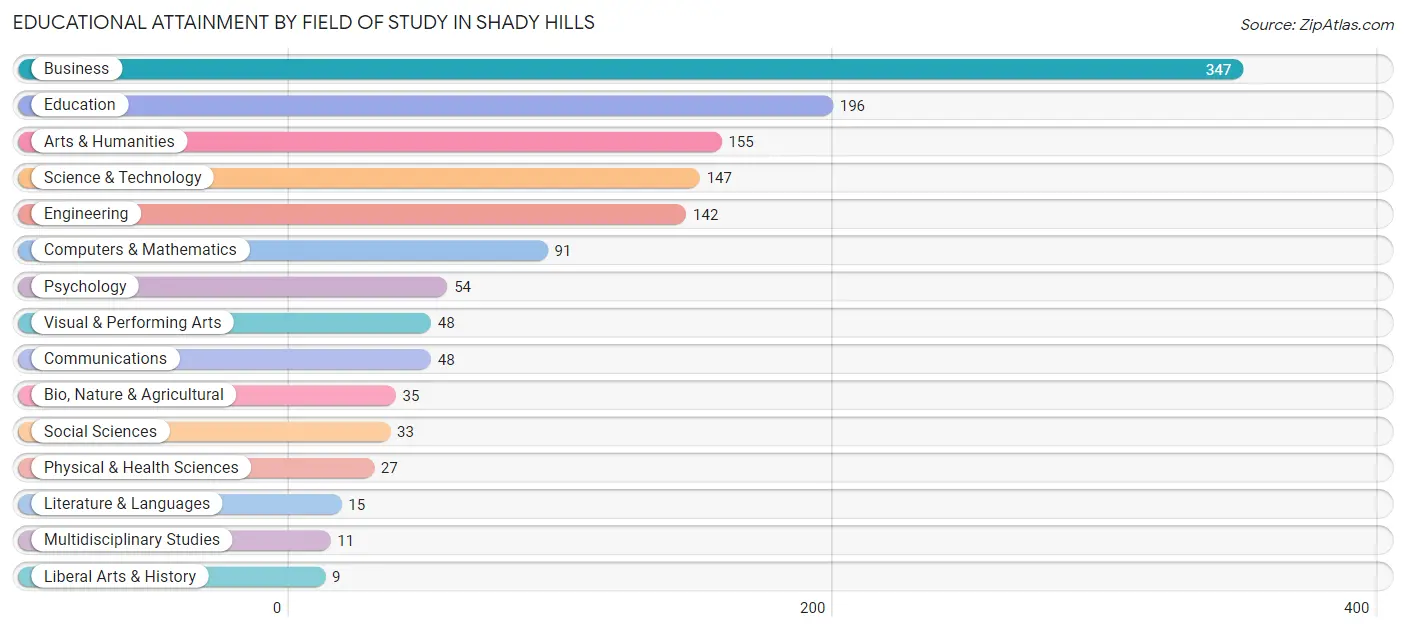
| Field of Study | # Graduates | % Graduates |
| Computers & Mathematics | 91 | 6.7% |
| Bio, Nature & Agricultural | 35 | 2.6% |
| Physical & Health Sciences | 27 | 2.0% |
| Psychology | 54 | 4.0% |
| Social Sciences | 33 | 2.4% |
| Engineering | 142 | 10.5% |
| Multidisciplinary Studies | 11 | 0.8% |
| Science & Technology | 147 | 10.8% |
| Business | 347 | 25.6% |
| Education | 196 | 14.4% |
| Literature & Languages | 15 | 1.1% |
| Liberal Arts & History | 9 | 0.7% |
| Visual & Performing Arts | 48 | 3.5% |
| Communications | 48 | 3.5% |
| Arts & Humanities | 155 | 11.4% |
| Total | 1,358 | 100.0% |
Transportation & Commute in Shady Hills
Vehicle Availability by Sex in Shady Hills
The most prevalent vehicle ownership categories in Shady Hills are males with 2 vehicles (761, accounting for 28.0%) and females with 2 vehicles (743, making up 38.0%).
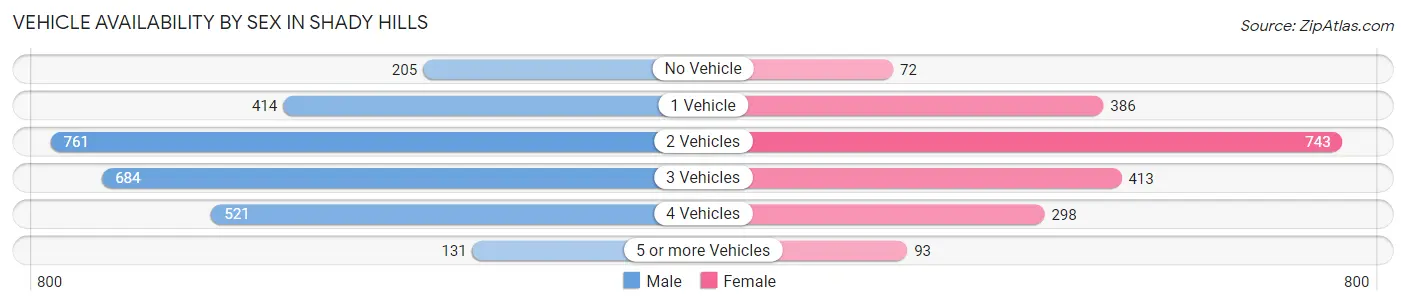
| Vehicles Available | Male | Female |
| No Vehicle | 205 (7.5%) | 72 (3.6%) |
| 1 Vehicle | 414 (15.2%) | 386 (19.3%) |
| 2 Vehicles | 761 (28.0%) | 743 (37.1%) |
| 3 Vehicles | 684 (25.2%) | 413 (20.6%) |
| 4 Vehicles | 521 (19.2%) | 298 (14.9%) |
| 5 or more Vehicles | 131 (4.8%) | 93 (4.6%) |
| Total | 2,716 (100.0%) | 2,005 (100.0%) |
Commute Time in Shady Hills
The most frequently occuring commute durations in Shady Hills are 30 to 34 minutes (802 commuters, 19.0%), 10 to 14 minutes (549 commuters, 13.0%), and 20 to 24 minutes (540 commuters, 12.8%).
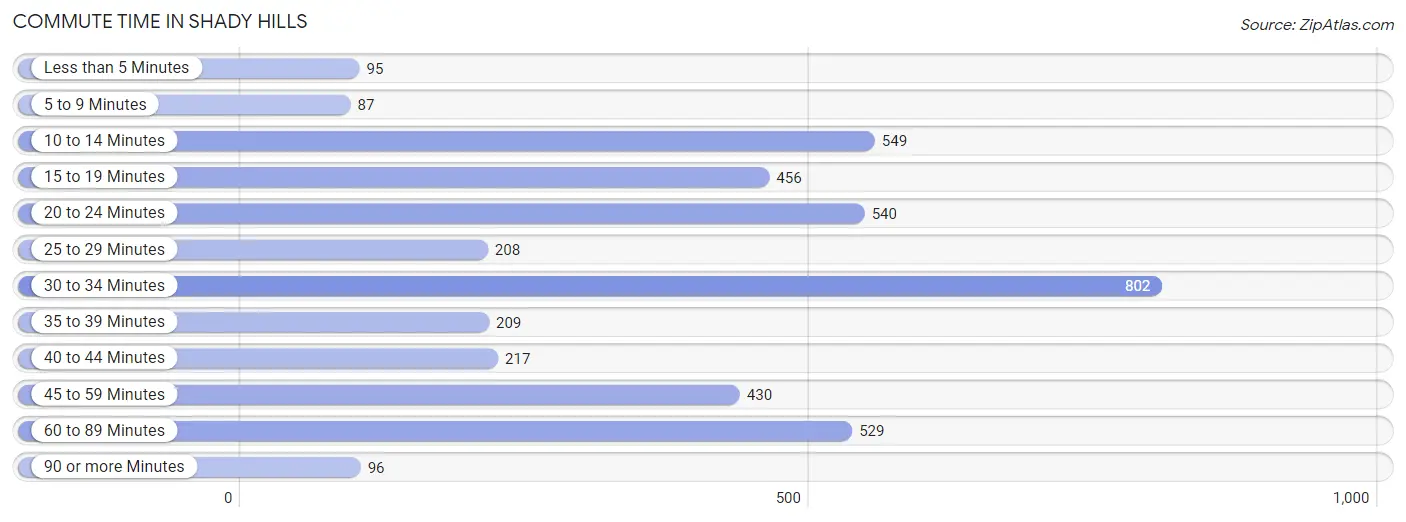
| Commute Time | # Commuters | % Commuters |
| Less than 5 Minutes | 95 | 2.2% |
| 5 to 9 Minutes | 87 | 2.1% |
| 10 to 14 Minutes | 549 | 13.0% |
| 15 to 19 Minutes | 456 | 10.8% |
| 20 to 24 Minutes | 540 | 12.8% |
| 25 to 29 Minutes | 208 | 4.9% |
| 30 to 34 Minutes | 802 | 19.0% |
| 35 to 39 Minutes | 209 | 5.0% |
| 40 to 44 Minutes | 217 | 5.1% |
| 45 to 59 Minutes | 430 | 10.2% |
| 60 to 89 Minutes | 529 | 12.5% |
| 90 or more Minutes | 96 | 2.3% |
Commute Time by Sex in Shady Hills
The most common commute times in Shady Hills are 30 to 34 minutes (433 commuters, 17.0%) for males and 30 to 34 minutes (369 commuters, 22.1%) for females.
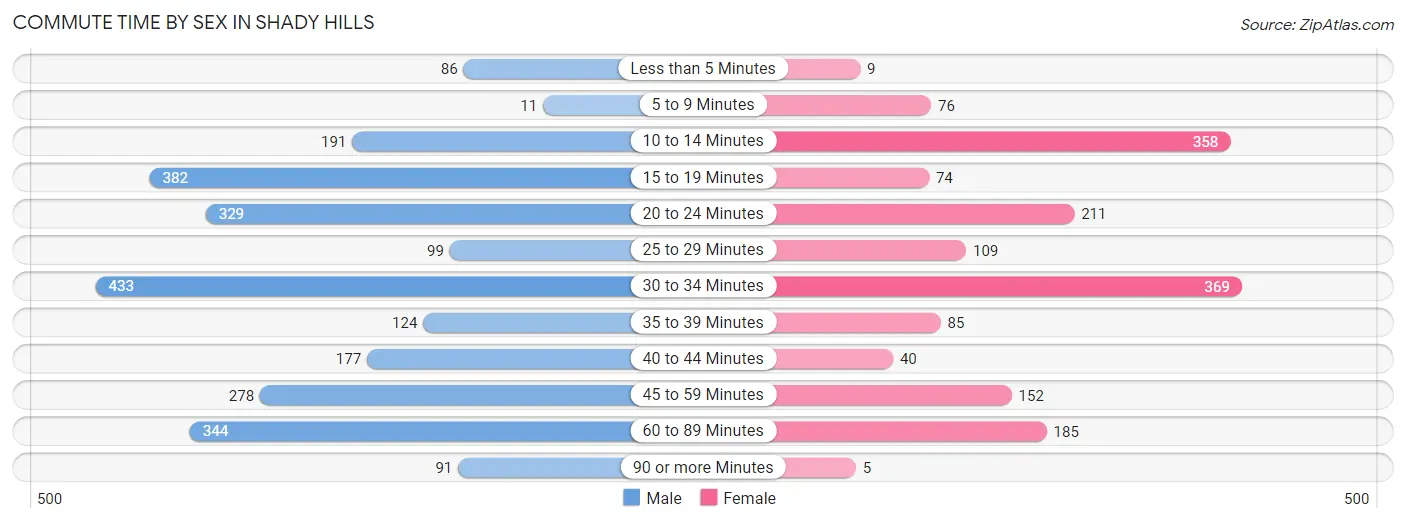
| Commute Time | Male | Female |
| Less than 5 Minutes | 86 (3.4%) | 9 (0.5%) |
| 5 to 9 Minutes | 11 (0.4%) | 76 (4.5%) |
| 10 to 14 Minutes | 191 (7.5%) | 358 (21.4%) |
| 15 to 19 Minutes | 382 (15.0%) | 74 (4.4%) |
| 20 to 24 Minutes | 329 (12.9%) | 211 (12.6%) |
| 25 to 29 Minutes | 99 (3.9%) | 109 (6.5%) |
| 30 to 34 Minutes | 433 (17.0%) | 369 (22.1%) |
| 35 to 39 Minutes | 124 (4.9%) | 85 (5.1%) |
| 40 to 44 Minutes | 177 (7.0%) | 40 (2.4%) |
| 45 to 59 Minutes | 278 (10.9%) | 152 (9.1%) |
| 60 to 89 Minutes | 344 (13.5%) | 185 (11.1%) |
| 90 or more Minutes | 91 (3.6%) | 5 (0.3%) |
Time of Departure to Work by Sex in Shady Hills
The most frequent times of departure to work in Shady Hills are 5:00 AM to 5:29 AM (366, 14.4%) for males and 5:00 AM to 5:29 AM (217, 13.0%) for females.
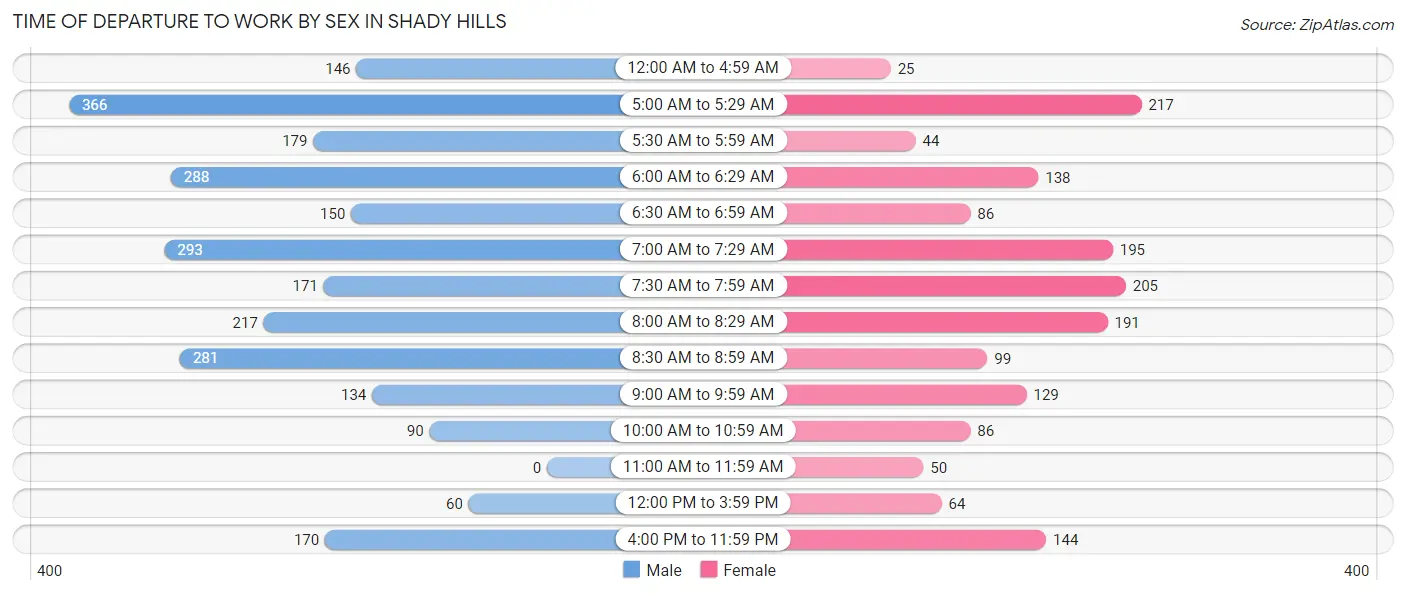
| Time of Departure | Male | Female |
| 12:00 AM to 4:59 AM | 146 (5.7%) | 25 (1.5%) |
| 5:00 AM to 5:29 AM | 366 (14.4%) | 217 (13.0%) |
| 5:30 AM to 5:59 AM | 179 (7.0%) | 44 (2.6%) |
| 6:00 AM to 6:29 AM | 288 (11.3%) | 138 (8.3%) |
| 6:30 AM to 6:59 AM | 150 (5.9%) | 86 (5.1%) |
| 7:00 AM to 7:29 AM | 293 (11.5%) | 195 (11.7%) |
| 7:30 AM to 7:59 AM | 171 (6.7%) | 205 (12.2%) |
| 8:00 AM to 8:29 AM | 217 (8.5%) | 191 (11.4%) |
| 8:30 AM to 8:59 AM | 281 (11.0%) | 99 (5.9%) |
| 9:00 AM to 9:59 AM | 134 (5.3%) | 129 (7.7%) |
| 10:00 AM to 10:59 AM | 90 (3.5%) | 86 (5.1%) |
| 11:00 AM to 11:59 AM | 0 (0.0%) | 50 (3.0%) |
| 12:00 PM to 3:59 PM | 60 (2.4%) | 64 (3.8%) |
| 4:00 PM to 11:59 PM | 170 (6.7%) | 144 (8.6%) |
| Total | 2,545 (100.0%) | 1,673 (100.0%) |
Housing Occupancy in Shady Hills
Occupancy by Ownership in Shady Hills
Of the total 4,023 dwellings in Shady Hills, owner-occupied units account for 3,314 (82.4%), while renter-occupied units make up 709 (17.6%).
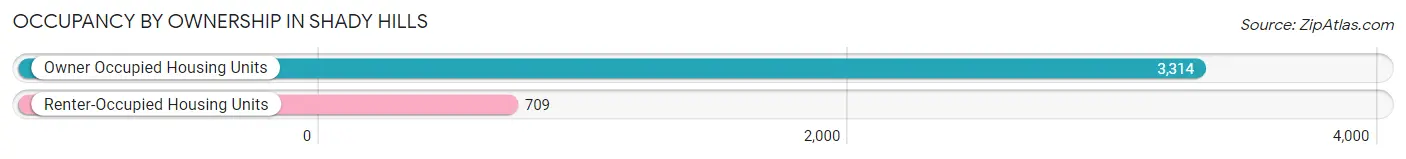
| Occupancy | # Housing Units | % Housing Units |
| Owner Occupied Housing Units | 3,314 | 82.4% |
| Renter-Occupied Housing Units | 709 | 17.6% |
| Total Occupied Housing Units | 4,023 | 100.0% |
Occupancy by Household Size in Shady Hills
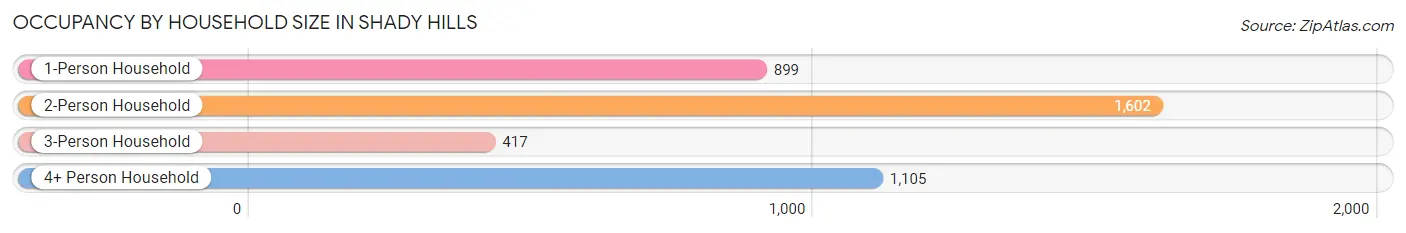
| Household Size | # Housing Units | % Housing Units |
| 1-Person Household | 899 | 22.4% |
| 2-Person Household | 1,602 | 39.8% |
| 3-Person Household | 417 | 10.4% |
| 4+ Person Household | 1,105 | 27.5% |
| Total Housing Units | 4,023 | 100.0% |
Occupancy by Ownership by Household Size in Shady Hills
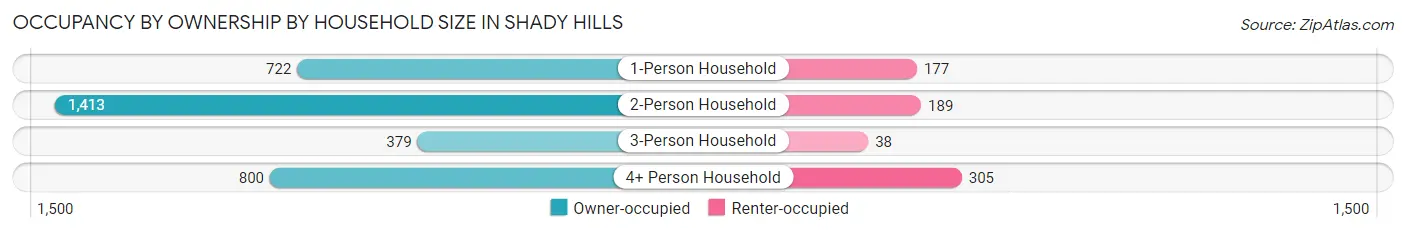
| Household Size | Owner-occupied | Renter-occupied |
| 1-Person Household | 722 (80.3%) | 177 (19.7%) |
| 2-Person Household | 1,413 (88.2%) | 189 (11.8%) |
| 3-Person Household | 379 (90.9%) | 38 (9.1%) |
| 4+ Person Household | 800 (72.4%) | 305 (27.6%) |
| Total Housing Units | 3,314 (82.4%) | 709 (17.6%) |
Occupancy by Educational Attainment in Shady Hills
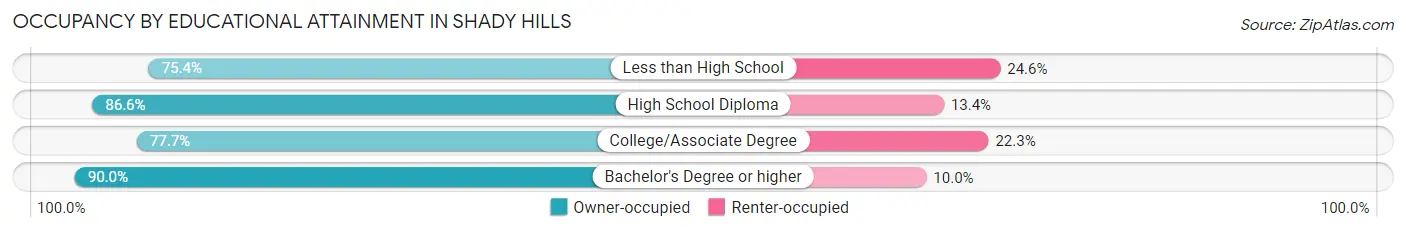
| Household Size | Owner-occupied | Renter-occupied |
| Less than High School | 527 (75.4%) | 172 (24.6%) |
| High School Diploma | 1,108 (86.6%) | 172 (13.4%) |
| College/Associate Degree | 1,019 (77.7%) | 292 (22.3%) |
| Bachelor's Degree or higher | 660 (90.0%) | 73 (10.0%) |
Occupancy by Age of Householder in Shady Hills
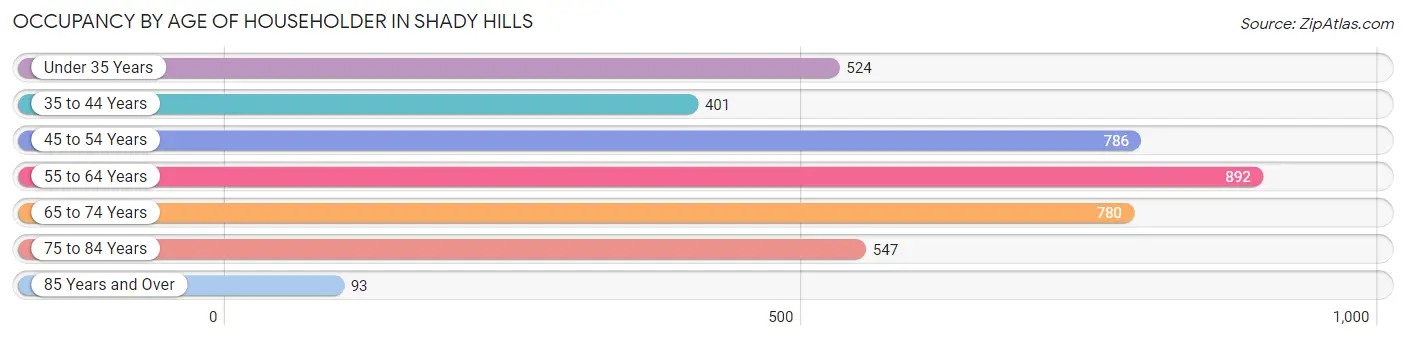
| Age Bracket | # Households | % Households |
| Under 35 Years | 524 | 13.0% |
| 35 to 44 Years | 401 | 10.0% |
| 45 to 54 Years | 786 | 19.5% |
| 55 to 64 Years | 892 | 22.2% |
| 65 to 74 Years | 780 | 19.4% |
| 75 to 84 Years | 547 | 13.6% |
| 85 Years and Over | 93 | 2.3% |
| Total | 4,023 | 100.0% |
Housing Finances in Shady Hills
Median Income by Occupancy in Shady Hills
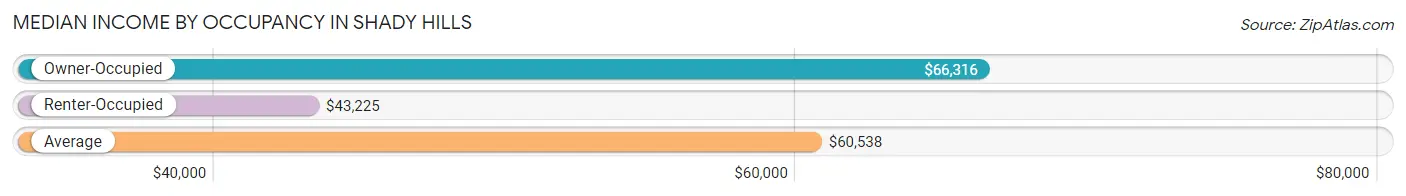
| Occupancy Type | # Households | Median Income |
| Owner-Occupied | 3,314 (82.4%) | $66,316 |
| Renter-Occupied | 709 (17.6%) | $43,225 |
| Average | 4,023 (100.0%) | $60,538 |
Occupancy by Householder Income Bracket in Shady Hills
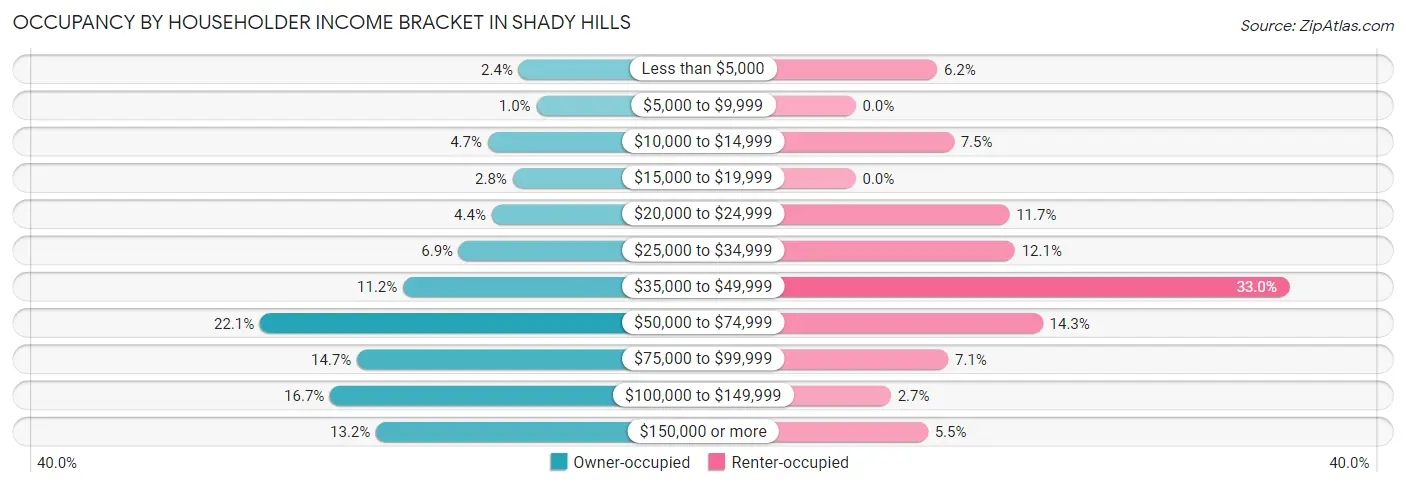
| Income Bracket | Owner-occupied | Renter-occupied |
| Less than $5,000 | 78 (2.4%) | 44 (6.2%) |
| $5,000 to $9,999 | 33 (1.0%) | 0 (0.0%) |
| $10,000 to $14,999 | 156 (4.7%) | 53 (7.5%) |
| $15,000 to $19,999 | 93 (2.8%) | 0 (0.0%) |
| $20,000 to $24,999 | 146 (4.4%) | 83 (11.7%) |
| $25,000 to $34,999 | 229 (6.9%) | 86 (12.1%) |
| $35,000 to $49,999 | 370 (11.2%) | 234 (33.0%) |
| $50,000 to $74,999 | 731 (22.1%) | 101 (14.2%) |
| $75,000 to $99,999 | 486 (14.7%) | 50 (7.0%) |
| $100,000 to $149,999 | 554 (16.7%) | 19 (2.7%) |
| $150,000 or more | 438 (13.2%) | 39 (5.5%) |
| Total | 3,314 (100.0%) | 709 (100.0%) |
Monthly Housing Cost Tiers in Shady Hills
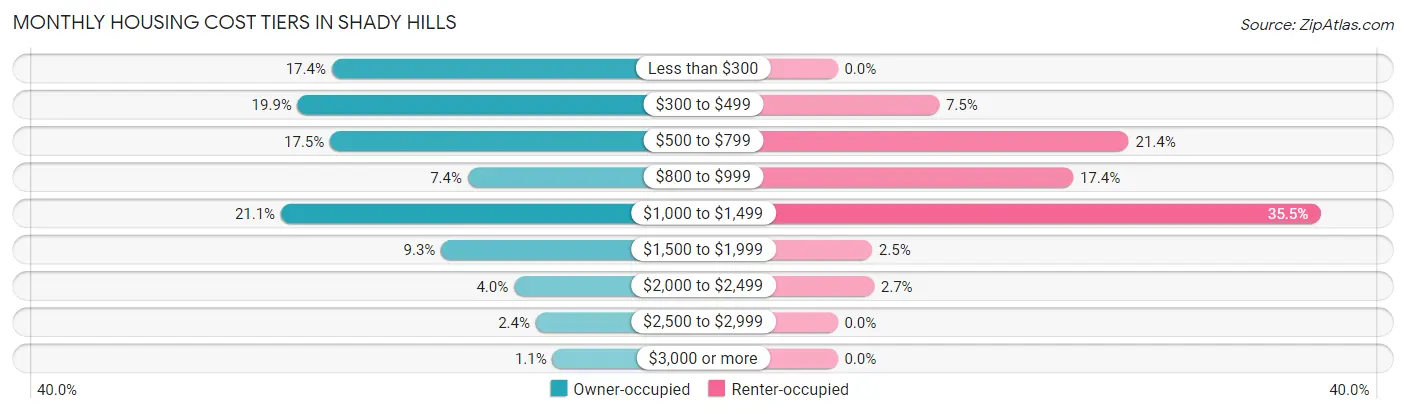
| Monthly Cost | Owner-occupied | Renter-occupied |
| Less than $300 | 576 (17.4%) | 0 (0.0%) |
| $300 to $499 | 659 (19.9%) | 53 (7.5%) |
| $500 to $799 | 580 (17.5%) | 152 (21.4%) |
| $800 to $999 | 244 (7.4%) | 123 (17.3%) |
| $1,000 to $1,499 | 700 (21.1%) | 252 (35.5%) |
| $1,500 to $1,999 | 309 (9.3%) | 18 (2.5%) |
| $2,000 to $2,499 | 131 (4.0%) | 19 (2.7%) |
| $2,500 to $2,999 | 78 (2.4%) | 0 (0.0%) |
| $3,000 or more | 37 (1.1%) | 0 (0.0%) |
| Total | 3,314 (100.0%) | 709 (100.0%) |
Physical Housing Characteristics in Shady Hills
Housing Structures in Shady Hills
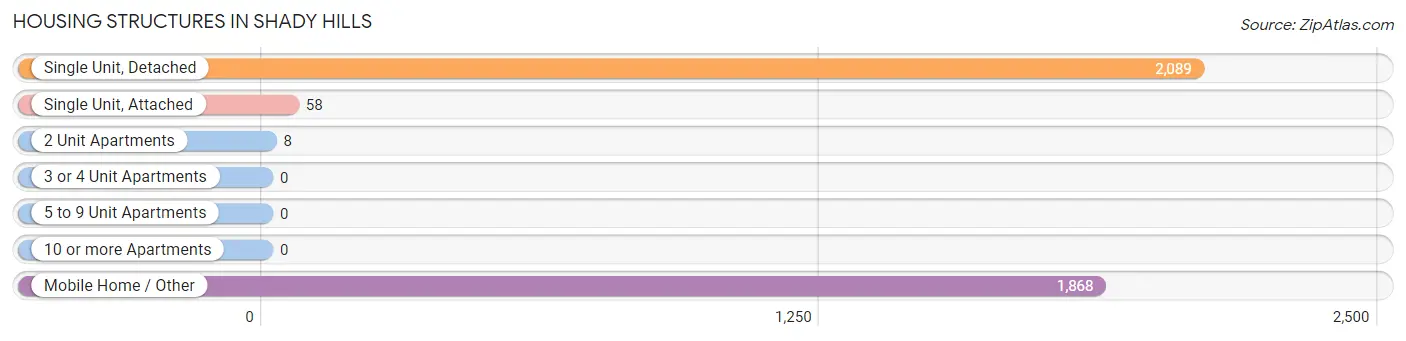
| Structure Type | # Housing Units | % Housing Units |
| Single Unit, Detached | 2,089 | 51.9% |
| Single Unit, Attached | 58 | 1.4% |
| 2 Unit Apartments | 8 | 0.2% |
| 3 or 4 Unit Apartments | 0 | 0.0% |
| 5 to 9 Unit Apartments | 0 | 0.0% |
| 10 or more Apartments | 0 | 0.0% |
| Mobile Home / Other | 1,868 | 46.4% |
| Total | 4,023 | 100.0% |
Housing Structures by Occupancy in Shady Hills
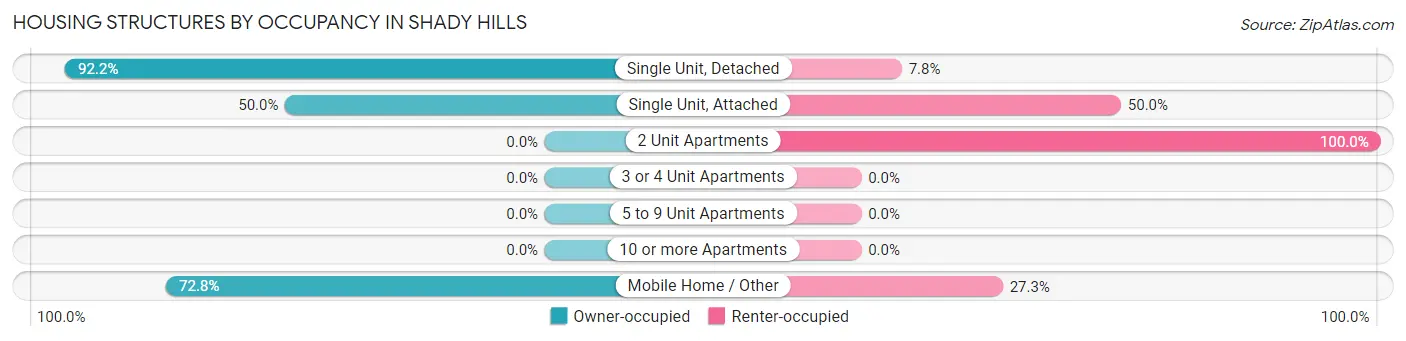
| Structure Type | Owner-occupied | Renter-occupied |
| Single Unit, Detached | 1,926 (92.2%) | 163 (7.8%) |
| Single Unit, Attached | 29 (50.0%) | 29 (50.0%) |
| 2 Unit Apartments | 0 (0.0%) | 8 (100.0%) |
| 3 or 4 Unit Apartments | 0 (0.0%) | 0 (0.0%) |
| 5 to 9 Unit Apartments | 0 (0.0%) | 0 (0.0%) |
| 10 or more Apartments | 0 (0.0%) | 0 (0.0%) |
| Mobile Home / Other | 1,359 (72.8%) | 509 (27.3%) |
| Total | 3,314 (82.4%) | 709 (17.6%) |
Housing Structures by Number of Rooms in Shady Hills
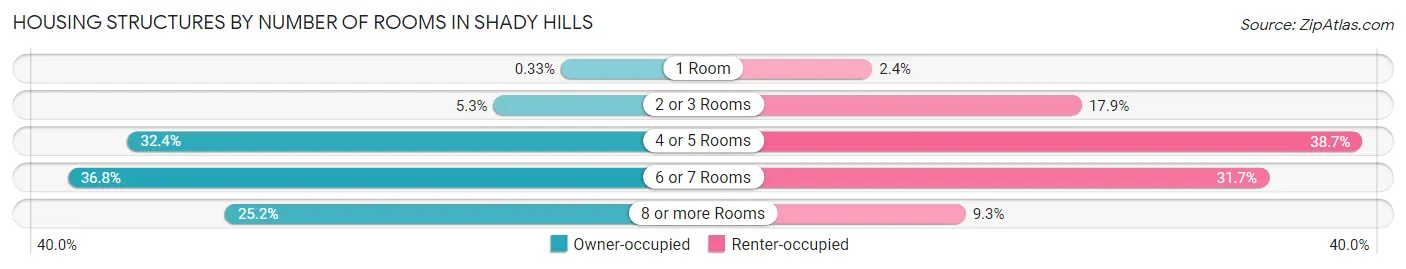
| Number of Rooms | Owner-occupied | Renter-occupied |
| 1 Room | 11 (0.3%) | 17 (2.4%) |
| 2 or 3 Rooms | 176 (5.3%) | 127 (17.9%) |
| 4 or 5 Rooms | 1,073 (32.4%) | 274 (38.7%) |
| 6 or 7 Rooms | 1,220 (36.8%) | 225 (31.7%) |
| 8 or more Rooms | 834 (25.2%) | 66 (9.3%) |
| Total | 3,314 (100.0%) | 709 (100.0%) |
Housing Structure by Heating Type in Shady Hills
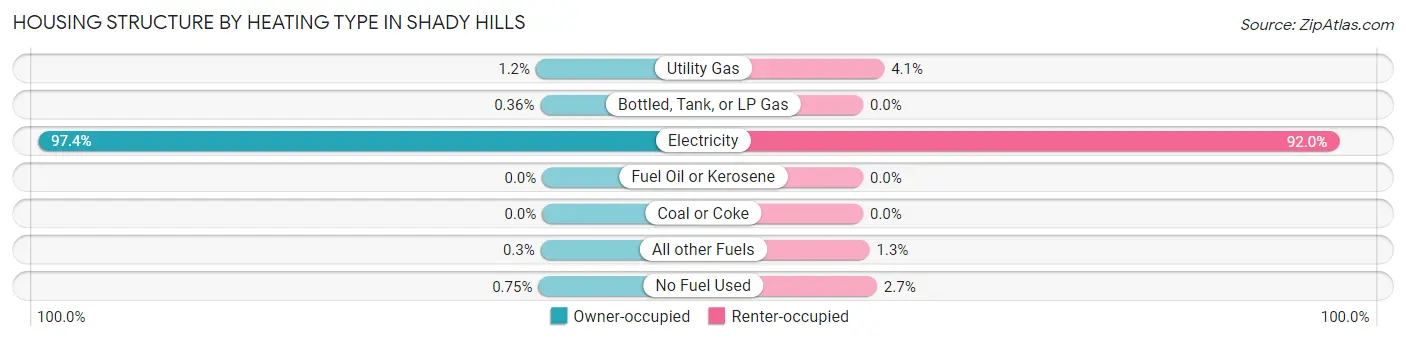
| Heating Type | Owner-occupied | Renter-occupied |
| Utility Gas | 40 (1.2%) | 29 (4.1%) |
| Bottled, Tank, or LP Gas | 12 (0.4%) | 0 (0.0%) |
| Electricity | 3,227 (97.4%) | 652 (92.0%) |
| Fuel Oil or Kerosene | 0 (0.0%) | 0 (0.0%) |
| Coal or Coke | 0 (0.0%) | 0 (0.0%) |
| All other Fuels | 10 (0.3%) | 9 (1.3%) |
| No Fuel Used | 25 (0.7%) | 19 (2.7%) |
| Total | 3,314 (100.0%) | 709 (100.0%) |
Household Vehicle Usage in Shady Hills
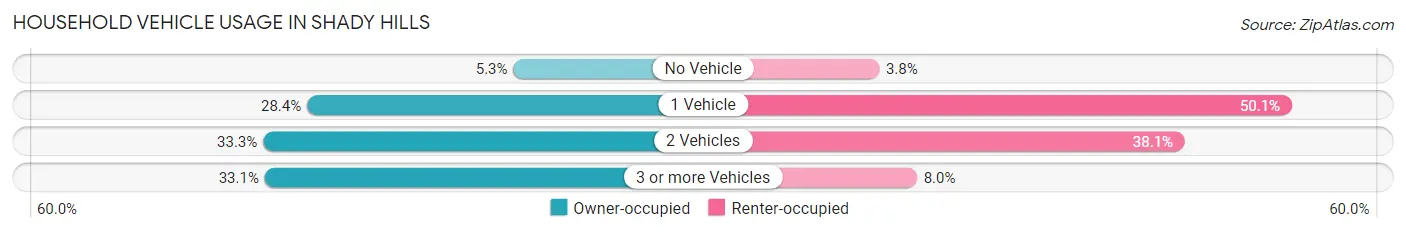
| Vehicles per Household | Owner-occupied | Renter-occupied |
| No Vehicle | 174 (5.2%) | 27 (3.8%) |
| 1 Vehicle | 940 (28.4%) | 355 (50.1%) |
| 2 Vehicles | 1,103 (33.3%) | 270 (38.1%) |
| 3 or more Vehicles | 1,097 (33.1%) | 57 (8.0%) |
| Total | 3,314 (100.0%) | 709 (100.0%) |
Real Estate & Mortgages in Shady Hills
Real Estate and Mortgage Overview in Shady Hills
| Characteristic | Without Mortgage | With Mortgage |
| Housing Units | 1,778 | 1,536 |
| Median Property Value | $162,300 | $224,300 |
| Median Household Income | $53,683 | $272 |
| Monthly Housing Costs | $397 | $37 |
| Real Estate Taxes | $1,093 | $22 |
Property Value by Mortgage Status in Shady Hills
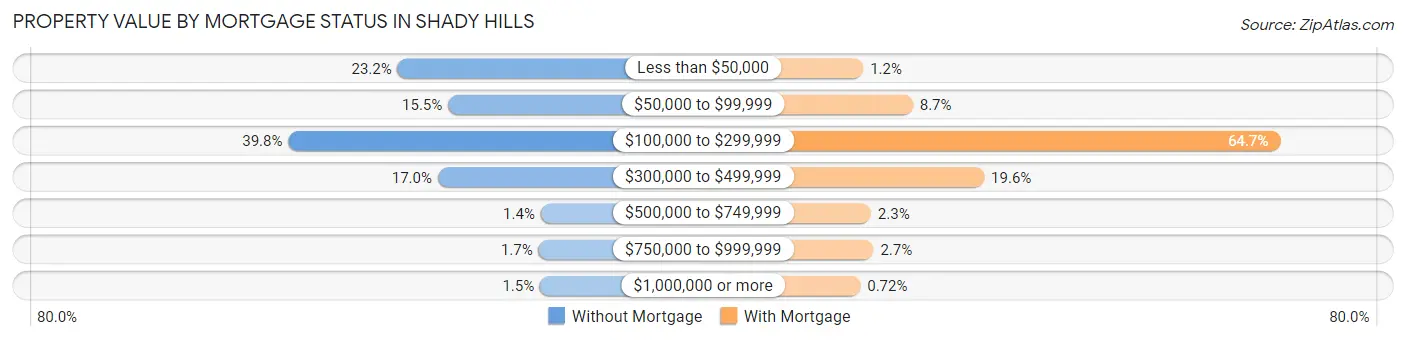
| Property Value | Without Mortgage | With Mortgage |
| Less than $50,000 | 412 (23.2%) | 18 (1.2%) |
| $50,000 to $99,999 | 275 (15.5%) | 134 (8.7%) |
| $100,000 to $299,999 | 708 (39.8%) | 994 (64.7%) |
| $300,000 to $499,999 | 303 (17.0%) | 301 (19.6%) |
| $500,000 to $749,999 | 24 (1.3%) | 36 (2.3%) |
| $750,000 to $999,999 | 30 (1.7%) | 42 (2.7%) |
| $1,000,000 or more | 26 (1.5%) | 11 (0.7%) |
| Total | 1,778 (100.0%) | 1,536 (100.0%) |
Household Income by Mortgage Status in Shady Hills
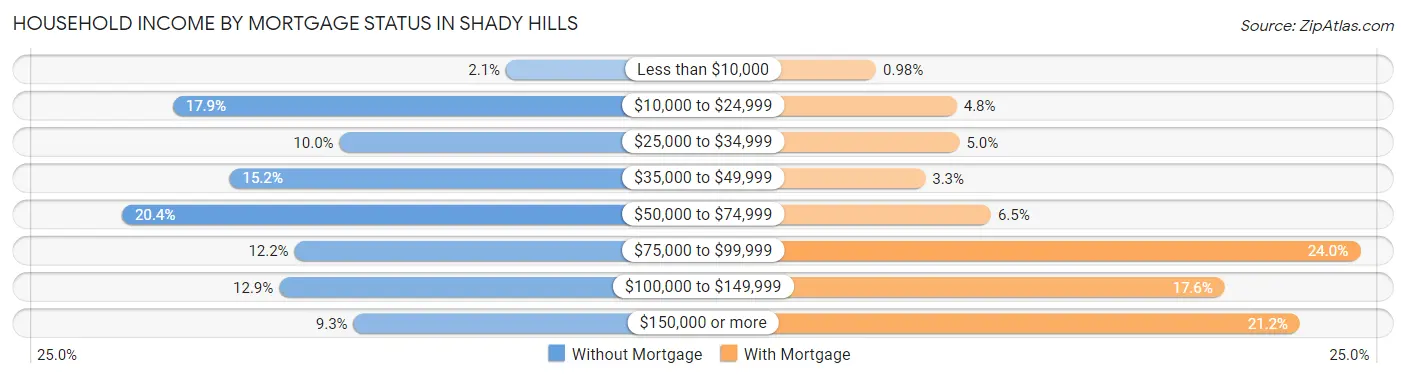
| Household Income | Without Mortgage | With Mortgage |
| Less than $10,000 | 37 (2.1%) | 15 (1.0%) |
| $10,000 to $24,999 | 319 (17.9%) | 74 (4.8%) |
| $25,000 to $34,999 | 178 (10.0%) | 76 (5.0%) |
| $35,000 to $49,999 | 271 (15.2%) | 51 (3.3%) |
| $50,000 to $74,999 | 362 (20.4%) | 99 (6.5%) |
| $75,000 to $99,999 | 216 (12.1%) | 369 (24.0%) |
| $100,000 to $149,999 | 229 (12.9%) | 270 (17.6%) |
| $150,000 or more | 166 (9.3%) | 325 (21.2%) |
| Total | 1,778 (100.0%) | 1,536 (100.0%) |
Property Value to Household Income Ratio in Shady Hills
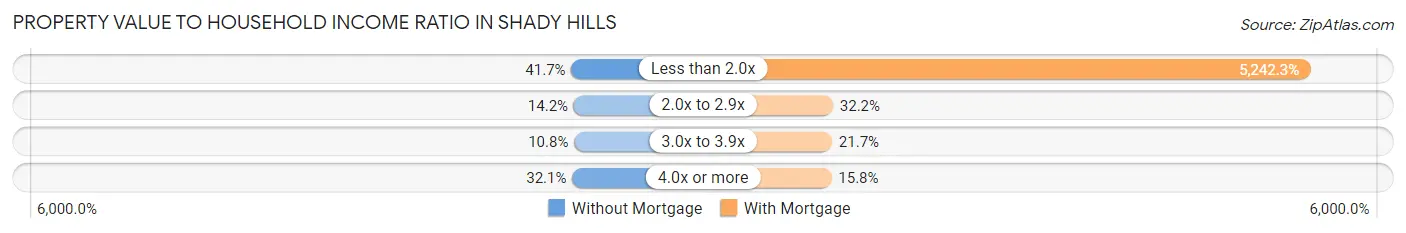
| Value-to-Income Ratio | Without Mortgage | With Mortgage |
| Less than 2.0x | 741 (41.7%) | 80,521 (5,242.2%) |
| 2.0x to 2.9x | 253 (14.2%) | 495 (32.2%) |
| 3.0x to 3.9x | 192 (10.8%) | 334 (21.7%) |
| 4.0x or more | 571 (32.1%) | 243 (15.8%) |
| Total | 1,778 (100.0%) | 1,536 (100.0%) |
Real Estate Taxes by Mortgage Status in Shady Hills
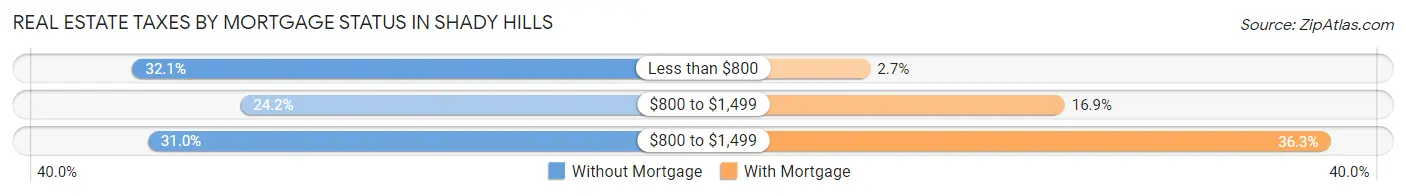
| Property Taxes | Without Mortgage | With Mortgage |
| Less than $800 | 571 (32.1%) | 42 (2.7%) |
| $800 to $1,499 | 431 (24.2%) | 260 (16.9%) |
| $800 to $1,499 | 551 (31.0%) | 558 (36.3%) |
| Total | 1,778 (100.0%) | 1,536 (100.0%) |
Health & Disability in Shady Hills
Health Insurance Coverage by Age in Shady Hills
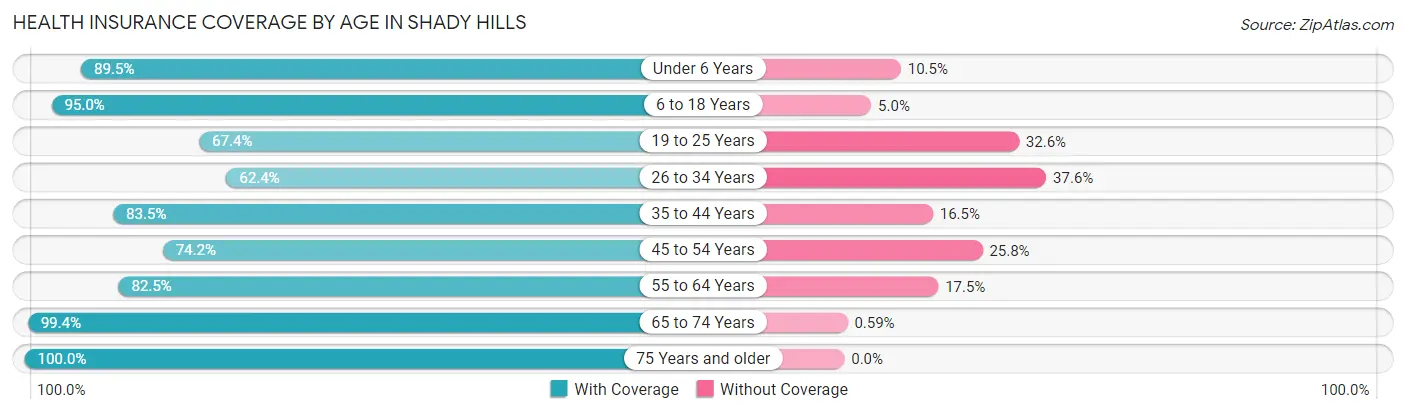
| Age Bracket | With Coverage | Without Coverage |
| Under 6 Years | 781 (89.5%) | 92 (10.5%) |
| 6 to 18 Years | 1,612 (95.0%) | 85 (5.0%) |
| 19 to 25 Years | 642 (67.4%) | 310 (32.6%) |
| 26 to 34 Years | 815 (62.4%) | 492 (37.6%) |
| 35 to 44 Years | 991 (83.5%) | 196 (16.5%) |
| 45 to 54 Years | 1,213 (74.2%) | 421 (25.8%) |
| 55 to 64 Years | 1,385 (82.5%) | 294 (17.5%) |
| 65 to 74 Years | 1,342 (99.4%) | 8 (0.6%) |
| 75 Years and older | 1,017 (100.0%) | 0 (0.0%) |
| Total | 9,798 (83.8%) | 1,898 (16.2%) |
Health Insurance Coverage by Citizenship Status in Shady Hills
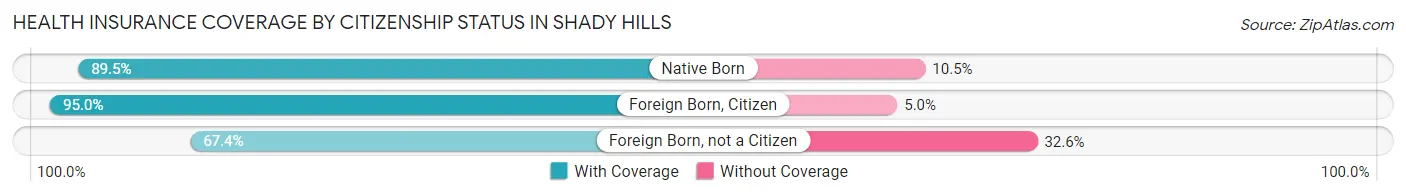
| Citizenship Status | With Coverage | Without Coverage |
| Native Born | 781 (89.5%) | 92 (10.5%) |
| Foreign Born, Citizen | 1,612 (95.0%) | 85 (5.0%) |
| Foreign Born, not a Citizen | 642 (67.4%) | 310 (32.6%) |
Health Insurance Coverage by Household Income in Shady Hills
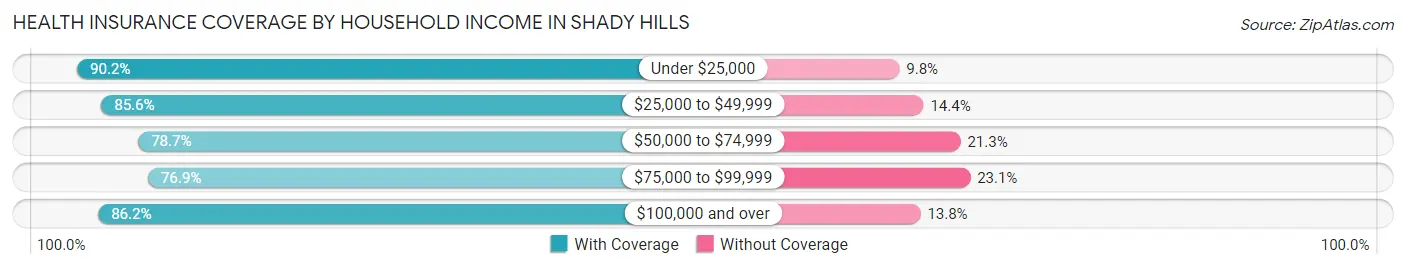
| Household Income | With Coverage | Without Coverage |
| Under $25,000 | 1,503 (90.2%) | 164 (9.8%) |
| $25,000 to $49,999 | 1,633 (85.6%) | 274 (14.4%) |
| $50,000 to $74,999 | 1,648 (78.7%) | 446 (21.3%) |
| $75,000 to $99,999 | 1,510 (76.9%) | 454 (23.1%) |
| $100,000 and over | 3,498 (86.2%) | 560 (13.8%) |
Public vs Private Health Insurance Coverage by Age in Shady Hills
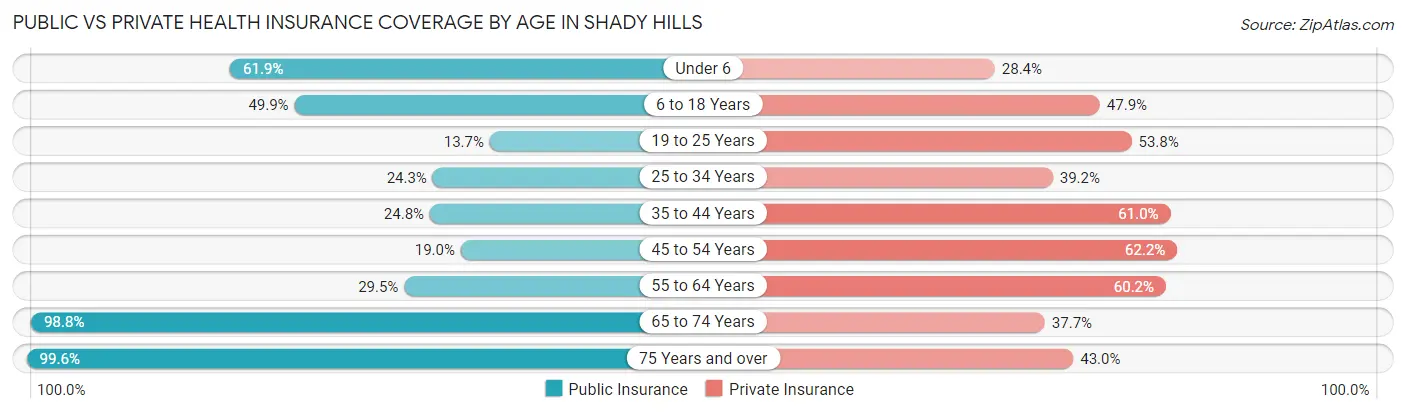
| Age Bracket | Public Insurance | Private Insurance |
| Under 6 | 540 (61.9%) | 248 (28.4%) |
| 6 to 18 Years | 847 (49.9%) | 813 (47.9%) |
| 19 to 25 Years | 130 (13.7%) | 512 (53.8%) |
| 25 to 34 Years | 317 (24.2%) | 512 (39.2%) |
| 35 to 44 Years | 294 (24.8%) | 724 (61.0%) |
| 45 to 54 Years | 311 (19.0%) | 1,017 (62.2%) |
| 55 to 64 Years | 496 (29.5%) | 1,010 (60.2%) |
| 65 to 74 Years | 1,334 (98.8%) | 509 (37.7%) |
| 75 Years and over | 1,013 (99.6%) | 437 (43.0%) |
| Total | 5,282 (45.2%) | 5,782 (49.4%) |
Disability Status by Sex by Age in Shady Hills
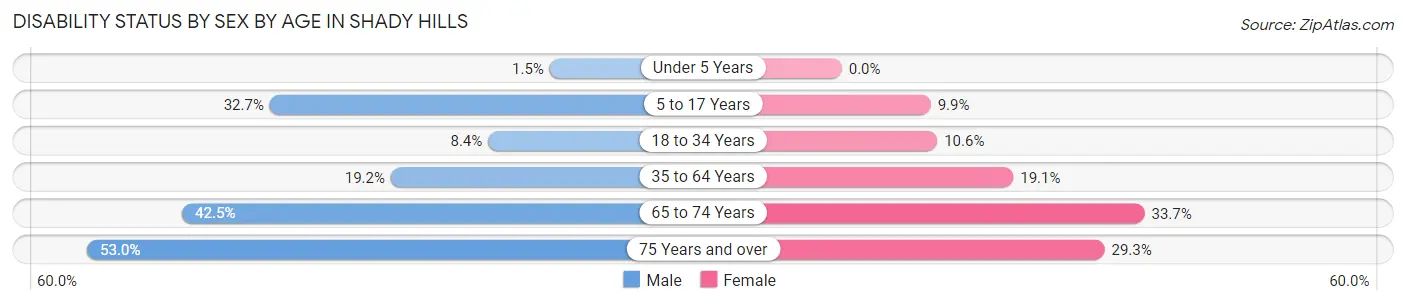
| Age Bracket | Male | Female |
| Under 5 Years | 6 (1.5%) | 0 (0.0%) |
| 5 to 17 Years | 344 (32.7%) | 66 (9.9%) |
| 18 to 34 Years | 110 (8.4%) | 119 (10.6%) |
| 35 to 64 Years | 422 (19.2%) | 440 (19.1%) |
| 65 to 74 Years | 281 (42.4%) | 232 (33.7%) |
| 75 Years and over | 253 (53.0%) | 158 (29.3%) |
Disability Class by Sex by Age in Shady Hills
Disability Class: Hearing Difficulty
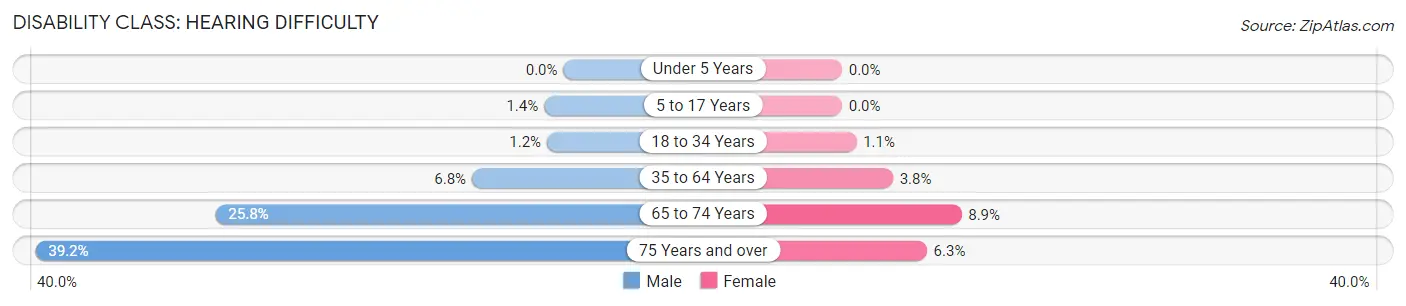
| Age Bracket | Male | Female |
| Under 5 Years | 0 (0.0%) | 0 (0.0%) |
| 5 to 17 Years | 15 (1.4%) | 0 (0.0%) |
| 18 to 34 Years | 16 (1.2%) | 12 (1.1%) |
| 35 to 64 Years | 149 (6.8%) | 87 (3.8%) |
| 65 to 74 Years | 171 (25.8%) | 61 (8.9%) |
| 75 Years and over | 187 (39.2%) | 34 (6.3%) |
Disability Class: Vision Difficulty
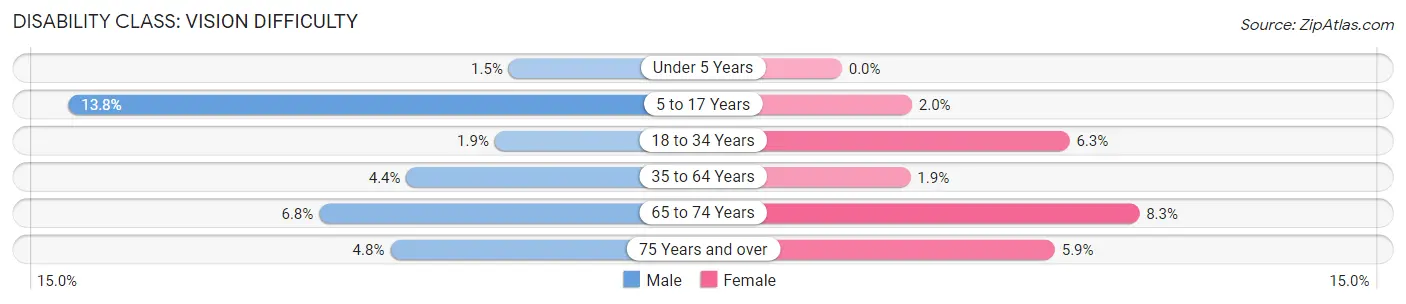
| Age Bracket | Male | Female |
| Under 5 Years | 6 (1.5%) | 0 (0.0%) |
| 5 to 17 Years | 145 (13.8%) | 13 (1.9%) |
| 18 to 34 Years | 25 (1.9%) | 71 (6.3%) |
| 35 to 64 Years | 96 (4.4%) | 44 (1.9%) |
| 65 to 74 Years | 45 (6.8%) | 57 (8.3%) |
| 75 Years and over | 23 (4.8%) | 32 (5.9%) |
Disability Class: Cognitive Difficulty
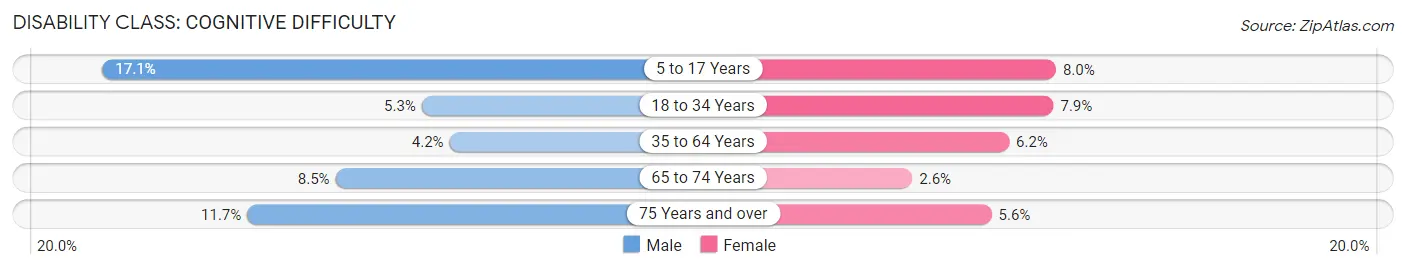
| Age Bracket | Male | Female |
| 5 to 17 Years | 180 (17.1%) | 53 (8.0%) |
| 18 to 34 Years | 69 (5.3%) | 88 (7.9%) |
| 35 to 64 Years | 93 (4.2%) | 143 (6.2%) |
| 65 to 74 Years | 56 (8.5%) | 18 (2.6%) |
| 75 Years and over | 56 (11.7%) | 30 (5.6%) |
Disability Class: Ambulatory Difficulty
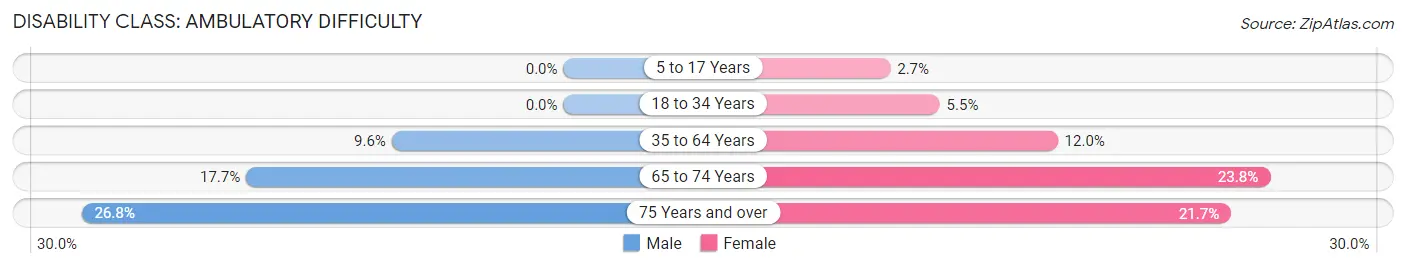
| Age Bracket | Male | Female |
| 5 to 17 Years | 0 (0.0%) | 18 (2.7%) |
| 18 to 34 Years | 0 (0.0%) | 61 (5.4%) |
| 35 to 64 Years | 210 (9.6%) | 277 (12.0%) |
| 65 to 74 Years | 117 (17.7%) | 164 (23.8%) |
| 75 Years and over | 128 (26.8%) | 117 (21.7%) |
Disability Class: Self-Care Difficulty
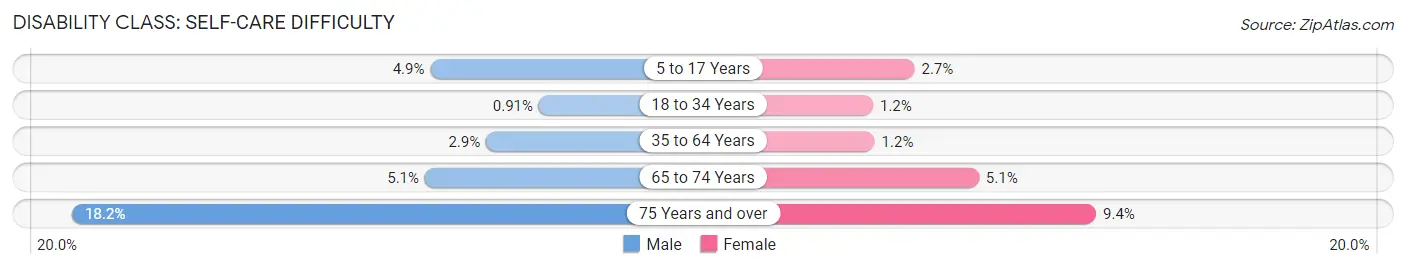
| Age Bracket | Male | Female |
| 5 to 17 Years | 52 (4.9%) | 18 (2.7%) |
| 18 to 34 Years | 12 (0.9%) | 13 (1.2%) |
| 35 to 64 Years | 63 (2.9%) | 28 (1.2%) |
| 65 to 74 Years | 34 (5.1%) | 35 (5.1%) |
| 75 Years and over | 87 (18.2%) | 51 (9.4%) |
Technology Access in Shady Hills
Computing Device Access in Shady Hills
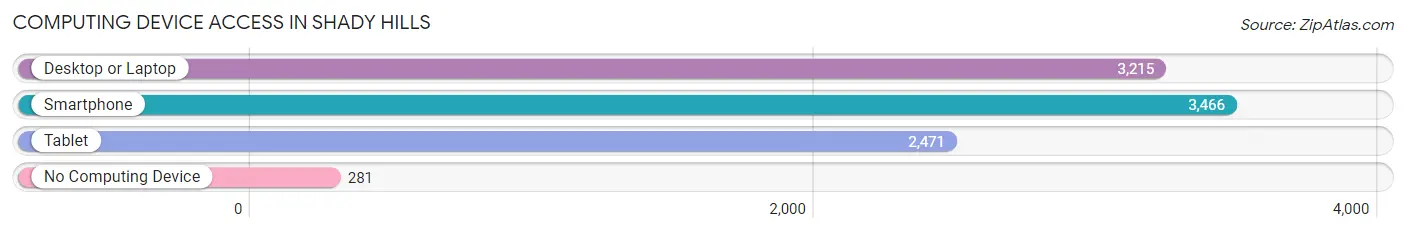
| Device Type | # Households | % Households |
| Desktop or Laptop | 3,215 | 79.9% |
| Smartphone | 3,466 | 86.2% |
| Tablet | 2,471 | 61.4% |
| No Computing Device | 281 | 7.0% |
| Total | 4,023 | 100.0% |
Internet Access in Shady Hills
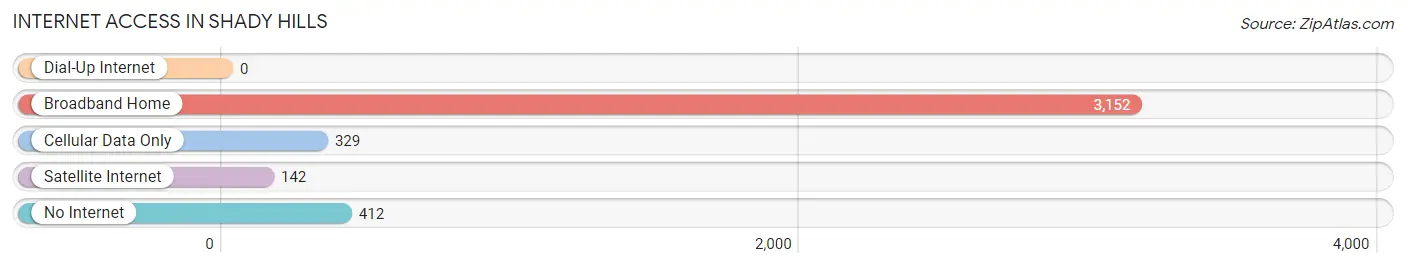
| Internet Type | # Households | % Households |
| Dial-Up Internet | 0 | 0.0% |
| Broadband Home | 3,152 | 78.3% |
| Cellular Data Only | 329 | 8.2% |
| Satellite Internet | 142 | 3.5% |
| No Internet | 412 | 10.2% |
| Total | 4,023 | 100.0% |
Shady Hills Summary
Shady Hills is a census-designated place (CDP) located in Pasco County, Florida, United States. It is located about 25 miles north of Tampa and is part of the Tampa-St. Petersburg-Clearwater Metropolitan Statistical Area. As of the 2010 census, the population of Shady Hills was 8,845.
Geography
Shady Hills is located at 28°25'25" North, 82°30'17" West (28.423750, -82.504722). It is situated in the northern part of Pasco County, approximately 25 miles north of Tampa. The CDP has a total area of 8.3 square miles, of which 8.2 square miles is land and 0.1 square miles is water.
History
Shady Hills was first settled in the late 1800s by settlers from the nearby town of Dade City. The area was originally known as "Shady Hill" and was home to a small farming community. In the early 1900s, the area was renamed "Shady Hills" and the first post office was established in the area in 1910.
In the 1950s, the area began to experience rapid growth as more people moved to the area. The population of Shady Hills increased from 1,000 in 1950 to 8,845 in 2010.
Economy
The economy of Shady Hills is largely based on agriculture and tourism. The area is home to several farms, including citrus, vegetable, and dairy farms. The area is also home to several tourist attractions, including the Pasco County Fairgrounds and the Shady Hills Golf Course.
Demographics
As of the 2010 census, there were 8,845 people, 3,093 households, and 2,521 families residing in the CDP. The population density was 1,072.2 people per square mile. The racial makeup of the CDP was 91.2% White, 4.2% African American, 0.3% Native American, 1.2% Asian, 0.1% Pacific Islander, 1.3% from other races, and 1.7% from two or more races. Hispanic or Latino of any race were 5.2% of the population.
The median income for a household in the CDP was $50,945, and the median income for a family was $58,958. Males had a median income of $41,919 versus $30,917 for females. The per capita income for the CDP was $21,945. About 4.2% of families and 5.7% of the population were below the poverty line, including 7.2% of those under age 18 and 4.2% of those age 65 or over.
Common Questions
What is Per Capita Income in Shady Hills?
Per Capita income in Shady Hills is $29,579.
What is the Median Family Income in Shady Hills?
Median Family Income in Shady Hills is $69,792.
What is the Median Household income in Shady Hills?
Median Household Income in Shady Hills is $60,538.
What is Income or Wage Gap in Shady Hills?
Income or Wage Gap in Shady Hills is 36.5%.
Women in Shady Hills earn 63.5 cents for every dollar earned by a man.
What is Inequality or Gini Index in Shady Hills?
Inequality or Gini Index in Shady Hills is 0.43.
What is the Total Population of Shady Hills?
Total Population of Shady Hills is 11,724.
What is the Total Male Population of Shady Hills?
Total Male Population of Shady Hills is 6,105.
What is the Total Female Population of Shady Hills?
Total Female Population of Shady Hills is 5,619.
What is the Ratio of Males per 100 Females in Shady Hills?
There are 108.65 Males per 100 Females in Shady Hills.
What is the Ratio of Females per 100 Males in Shady Hills?
There are 92.04 Females per 100 Males in Shady Hills.
What is the Median Population Age in Shady Hills?
Median Population Age in Shady Hills is 44.3 Years.
What is the Average Family Size in Shady Hills
Average Family Size in Shady Hills is 3.4 People.
What is the Average Household Size in Shady Hills
Average Household Size in Shady Hills is 2.9 People.
How Large is the Labor Force in Shady Hills?
There are 5,092 People in the Labor Forcein in Shady Hills.
What is the Percentage of People in the Labor Force in Shady Hills?
53.3% of People are in the Labor Force in Shady Hills.
What is the Unemployment Rate in Shady Hills?
Unemployment Rate in Shady Hills is 5.7%.