Safety Harbor, FL Map & Demographics
Safety Harbor Map
Safety Harbor Overview
$52,790
PER CAPITA INCOME
$119,800
AVG FAMILY INCOME
$102,670
AVG HOUSEHOLD INCOME
29.6%
WAGE / INCOME GAP [ % ]
70.4¢/ $1
WAGE / INCOME GAP [ $ ]
0.45
INEQUALITY / GINI INDEX
17,087
TOTAL POPULATION
8,038
MALE POPULATION
9,049
FEMALE POPULATION
88.83
MALES / 100 FEMALES
112.58
FEMALES / 100 MALES
48.1
MEDIAN AGE
3.0
AVG FAMILY SIZE
2.5
AVG HOUSEHOLD SIZE
8,806
LABOR FORCE [ PEOPLE ]
62.5%
PERCENT IN LABOR FORCE
4.1%
UNEMPLOYMENT RATE
Safety Harbor Zip Codes
Safety Harbor Area Codes
Income in Safety Harbor
Income Overview in Safety Harbor
Per Capita Income in Safety Harbor is $52,790, while median incomes of families and households are $119,800 and $102,670 respectively.
| Characteristic | Number | Measure |
| Per Capita Income | 17,087 | $52,790 |
| Median Family Income | 4,614 | $119,800 |
| Mean Family Income | 4,614 | $153,750 |
| Median Household Income | 6,789 | $102,670 |
| Mean Household Income | 6,789 | $129,061 |
| Income Deficit | 4,614 | $0 |
| Wage / Income Gap (%) | 17,087 | 29.60% |
| Wage / Income Gap ($) | 17,087 | 70.40¢ per $1 |
| Gini / Inequality Index | 17,087 | 0.45 |
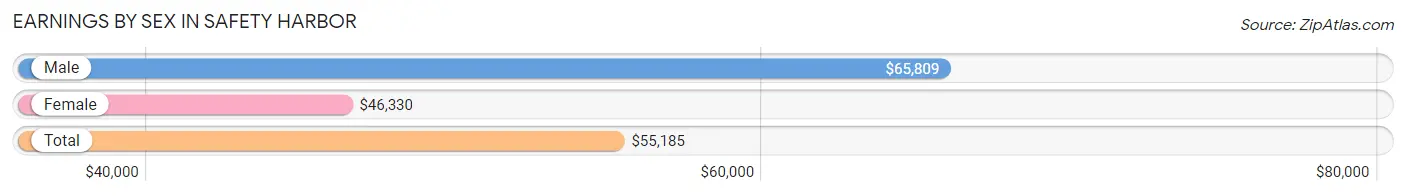
Earnings by Sex in Safety Harbor
Average Earnings in Safety Harbor are $55,185, $65,809 for men and $46,330 for women, a difference of 29.6%.
| Sex | Number | Average Earnings |
| Male | 4,324 (47.4%) | $65,809 |
| Female | 4,803 (52.6%) | $46,330 |
| Total | 9,127 (100.0%) | $55,185 |
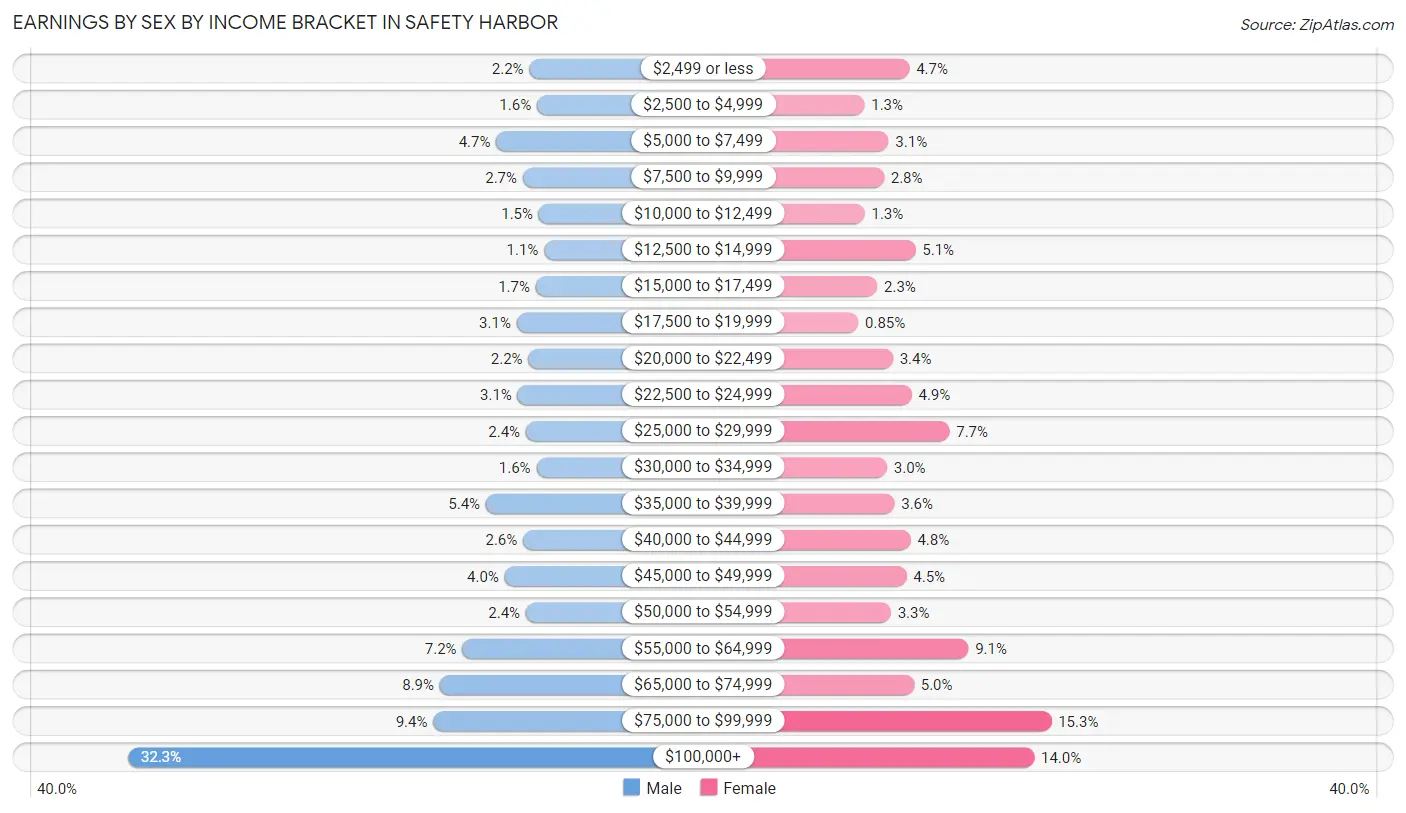
Earnings by Sex by Income Bracket in Safety Harbor
The most common earnings brackets in Safety Harbor are $100,000+ for men (1,395 | 32.3%) and $75,000 to $99,999 for women (736 | 15.3%).
| Income | Male | Female |
| $2,499 or less | 94 (2.2%) | 225 (4.7%) |
| $2,500 to $4,999 | 69 (1.6%) | 63 (1.3%) |
| $5,000 to $7,499 | 201 (4.6%) | 150 (3.1%) |
| $7,500 to $9,999 | 115 (2.7%) | 133 (2.8%) |
| $10,000 to $12,499 | 63 (1.5%) | 64 (1.3%) |
| $12,500 to $14,999 | 46 (1.1%) | 247 (5.1%) |
| $15,000 to $17,499 | 73 (1.7%) | 109 (2.3%) |
| $17,500 to $19,999 | 135 (3.1%) | 41 (0.9%) |
| $20,000 to $22,499 | 97 (2.2%) | 165 (3.4%) |
| $22,500 to $24,999 | 132 (3.0%) | 233 (4.9%) |
| $25,000 to $29,999 | 105 (2.4%) | 369 (7.7%) |
| $30,000 to $34,999 | 71 (1.6%) | 144 (3.0%) |
| $35,000 to $39,999 | 235 (5.4%) | 171 (3.6%) |
| $40,000 to $44,999 | 114 (2.6%) | 229 (4.8%) |
| $45,000 to $49,999 | 174 (4.0%) | 214 (4.5%) |
| $50,000 to $54,999 | 105 (2.4%) | 158 (3.3%) |
| $55,000 to $64,999 | 311 (7.2%) | 437 (9.1%) |
| $65,000 to $74,999 | 384 (8.9%) | 241 (5.0%) |
| $75,000 to $99,999 | 405 (9.4%) | 736 (15.3%) |
| $100,000+ | 1,395 (32.3%) | 674 (14.0%) |
| Total | 4,324 (100.0%) | 4,803 (100.0%) |
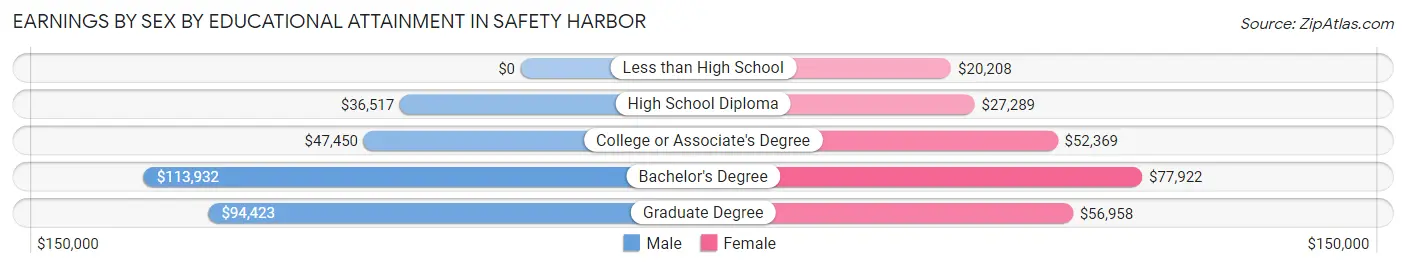
Earnings by Sex by Educational Attainment in Safety Harbor
Average earnings in Safety Harbor are $68,834 for men and $53,620 for women, a difference of 22.1%. Men with an educational attainment of bachelor's degree enjoy the highest average annual earnings of $113,932, while those with high school diploma education earn the least with $36,517. Women with an educational attainment of bachelor's degree earn the most with the average annual earnings of $77,922, while those with less than high school education have the smallest earnings of $20,208.
| Educational Attainment | Male Income | Female Income |
| Less than High School | - | - |
| High School Diploma | $36,517 | $27,289 |
| College or Associate's Degree | $47,450 | $52,369 |
| Bachelor's Degree | $113,932 | $77,922 |
| Graduate Degree | $94,423 | $56,958 |
| Total | $68,834 | $53,620 |
Family Income in Safety Harbor
Family Income Brackets in Safety Harbor
According to the Safety Harbor family income data, there are 1,149 families falling into the $200,000+ income range, which is the most common income bracket and makes up 24.9% of all families. Conversely, the $10,000 to $14,999 income bracket is the least frequent group with only 28 families (0.6%) belonging to this category.
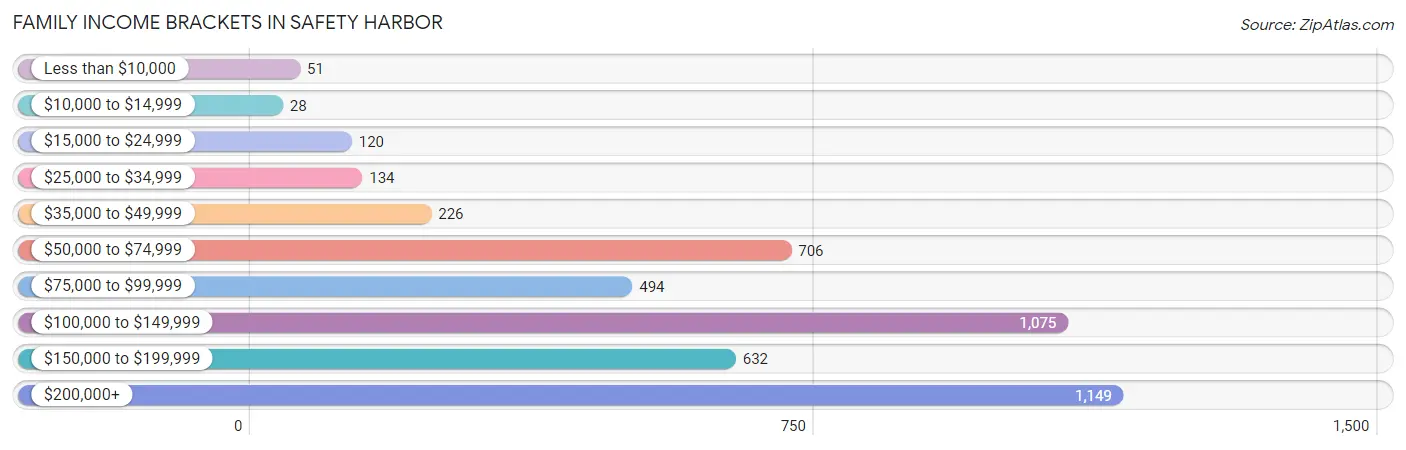
| Income Bracket | # Families | % Families |
| Less than $10,000 | 51 | 1.1% |
| $10,000 to $14,999 | 28 | 0.6% |
| $15,000 to $24,999 | 120 | 2.6% |
| $25,000 to $34,999 | 134 | 2.9% |
| $35,000 to $49,999 | 226 | 4.9% |
| $50,000 to $74,999 | 706 | 15.3% |
| $75,000 to $99,999 | 494 | 10.7% |
| $100,000 to $149,999 | 1,075 | 23.3% |
| $150,000 to $199,999 | 632 | 13.7% |
| $200,000+ | 1,149 | 24.9% |
Family Income by Famaliy Size in Safety Harbor
4-person families (643 | 13.9%) account for the highest median family income in Safety Harbor with $158,829 per family, while 2-person families (2,399 | 52.0%) have the highest median income of $57,734 per family member.
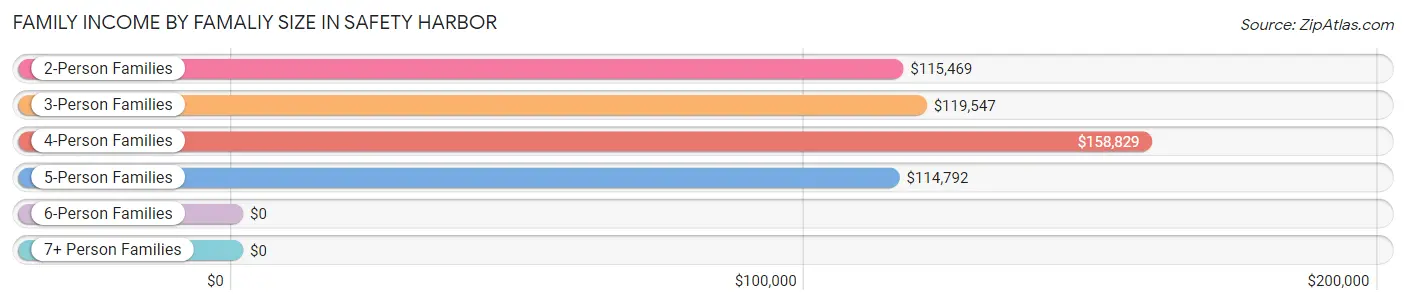
| Income Bracket | # Families | Median Income |
| 2-Person Families | 2,399 (52.0%) | $115,469 |
| 3-Person Families | 1,195 (25.9%) | $119,547 |
| 4-Person Families | 643 (13.9%) | $158,829 |
| 5-Person Families | 270 (5.9%) | $114,792 |
| 6-Person Families | 107 (2.3%) | $0 |
| 7+ Person Families | 0 (0.0%) | $0 |
| Total | 4,614 (100.0%) | $119,800 |
Family Income by Number of Earners in Safety Harbor
The median family income in Safety Harbor is $119,800, with families comprising 2 earners (2,016) having the highest median family income of $153,194, while families with no earners (630) have the lowest median family income of $88,000, accounting for 43.7% and 13.7% of families, respectively.
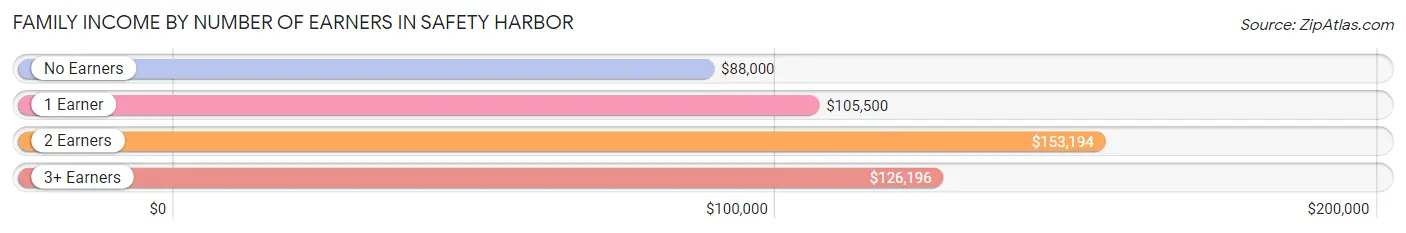
| Number of Earners | # Families | Median Income |
| No Earners | 630 (13.7%) | $88,000 |
| 1 Earner | 1,490 (32.3%) | $105,500 |
| 2 Earners | 2,016 (43.7%) | $153,194 |
| 3+ Earners | 478 (10.4%) | $126,196 |
| Total | 4,614 (100.0%) | $119,800 |
Household Income in Safety Harbor
Household Income Brackets in Safety Harbor
With 1,378 households falling in the category, the $100,000 to $149,999 income range is the most frequent in Safety Harbor, accounting for 20.3% of all households. In contrast, only 183 households (2.7%) fall into the $10,000 to $14,999 income bracket, making it the least populous group.
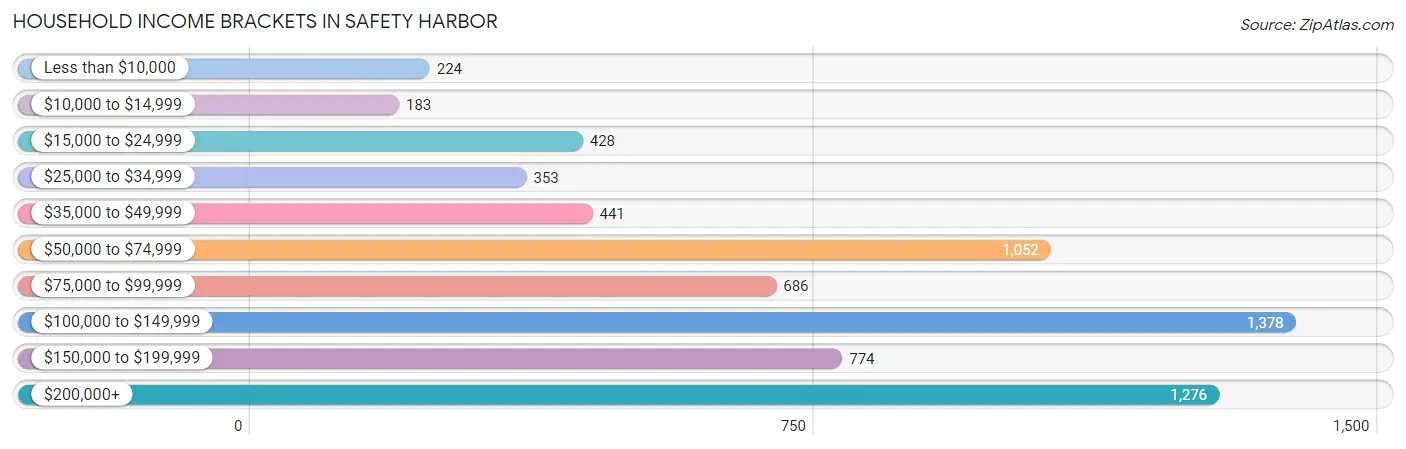
| Income Bracket | # Households | % Households |
| Less than $10,000 | 224 | 3.3% |
| $10,000 to $14,999 | 183 | 2.7% |
| $15,000 to $24,999 | 428 | 6.3% |
| $25,000 to $34,999 | 353 | 5.2% |
| $35,000 to $49,999 | 441 | 6.5% |
| $50,000 to $74,999 | 1,052 | 15.5% |
| $75,000 to $99,999 | 686 | 10.1% |
| $100,000 to $149,999 | 1,378 | 20.3% |
| $150,000 to $199,999 | 774 | 11.4% |
| $200,000+ | 1,276 | 18.8% |
Household Income by Householder Age in Safety Harbor
The median household income in Safety Harbor is $102,670, with the highest median household income of $130,568 found in the 25 to 44 years age bracket for the primary householder. A total of 1,563 households (23.0%) fall into this category. Meanwhile, the 65+ years age bracket for the primary householder has the lowest median household income of $61,122, with 2,315 households (34.1%) in this group.
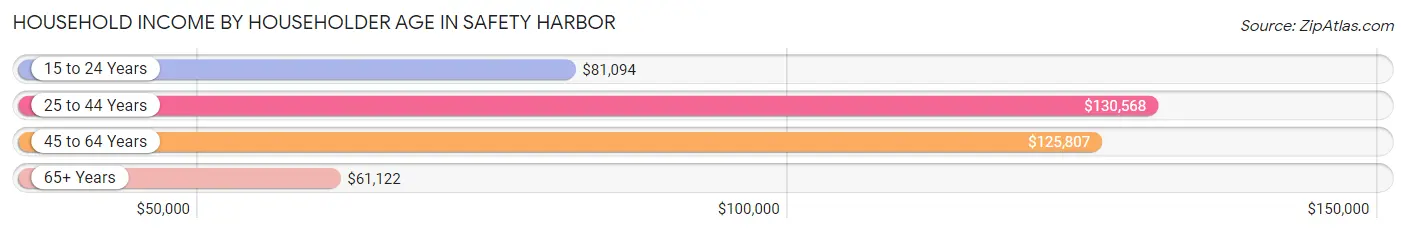
| Income Bracket | # Households | Median Income |
| 15 to 24 Years | 59 (0.9%) | $81,094 |
| 25 to 44 Years | 1,563 (23.0%) | $130,568 |
| 45 to 64 Years | 2,852 (42.0%) | $125,807 |
| 65+ Years | 2,315 (34.1%) | $61,122 |
| Total | 6,789 (100.0%) | $102,670 |
Poverty in Safety Harbor
Income Below Poverty by Sex and Age in Safety Harbor
With 7.0% poverty level for males and 6.0% for females among the residents of Safety Harbor, 65 to 74 year old males and 16 and 17 year old females are the most vulnerable to poverty, with 160 males (15.0%) and 86 females (28.3%) in their respective age groups living below the poverty level.
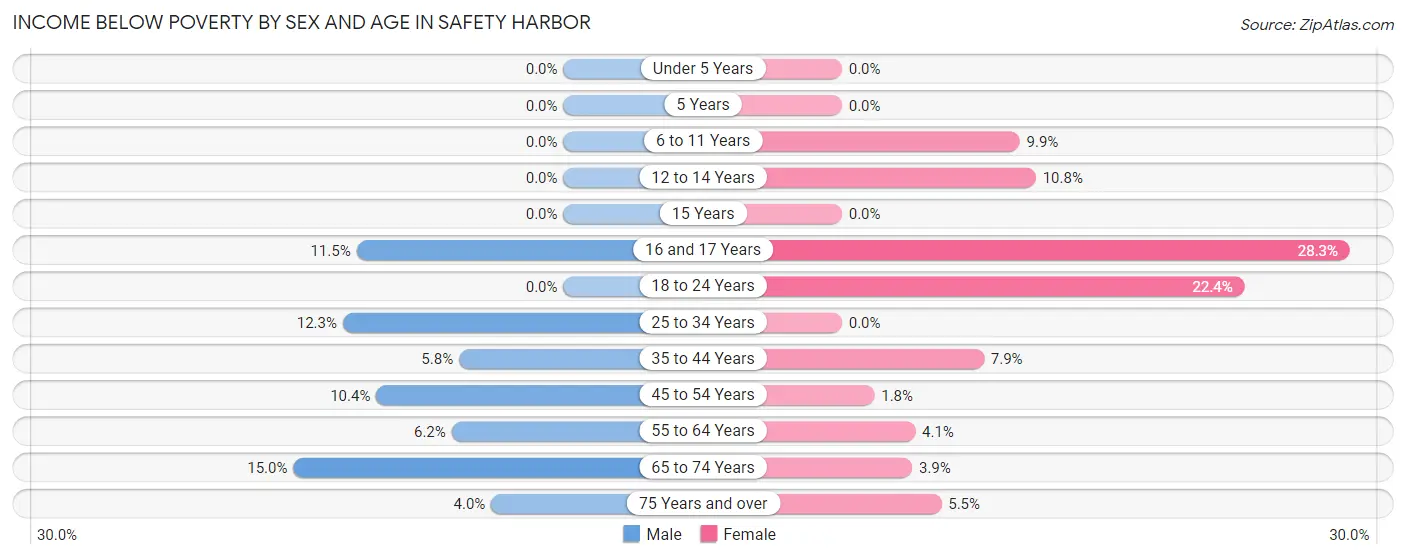
| Age Bracket | Male | Female |
| Under 5 Years | 0 (0.0%) | 0 (0.0%) |
| 5 Years | 0 (0.0%) | 0 (0.0%) |
| 6 to 11 Years | 0 (0.0%) | 61 (9.9%) |
| 12 to 14 Years | 0 (0.0%) | 19 (10.8%) |
| 15 Years | 0 (0.0%) | 0 (0.0%) |
| 16 and 17 Years | 19 (11.5%) | 86 (28.3%) |
| 18 to 24 Years | 0 (0.0%) | 107 (22.4%) |
| 25 to 34 Years | 97 (12.3%) | 0 (0.0%) |
| 35 to 44 Years | 60 (5.8%) | 80 (7.9%) |
| 45 to 54 Years | 135 (10.4%) | 25 (1.8%) |
| 55 to 64 Years | 67 (6.2%) | 55 (4.1%) |
| 65 to 74 Years | 160 (15.0%) | 43 (3.9%) |
| 75 Years and over | 25 (4.0%) | 54 (5.5%) |
| Total | 563 (7.0%) | 530 (6.0%) |
Income Above Poverty by Sex and Age in Safety Harbor
According to the poverty statistics in Safety Harbor, males aged under 5 years and females aged under 5 years are the age groups that are most secure financially, with 100.0% of males and 100.0% of females in these age groups living above the poverty line.
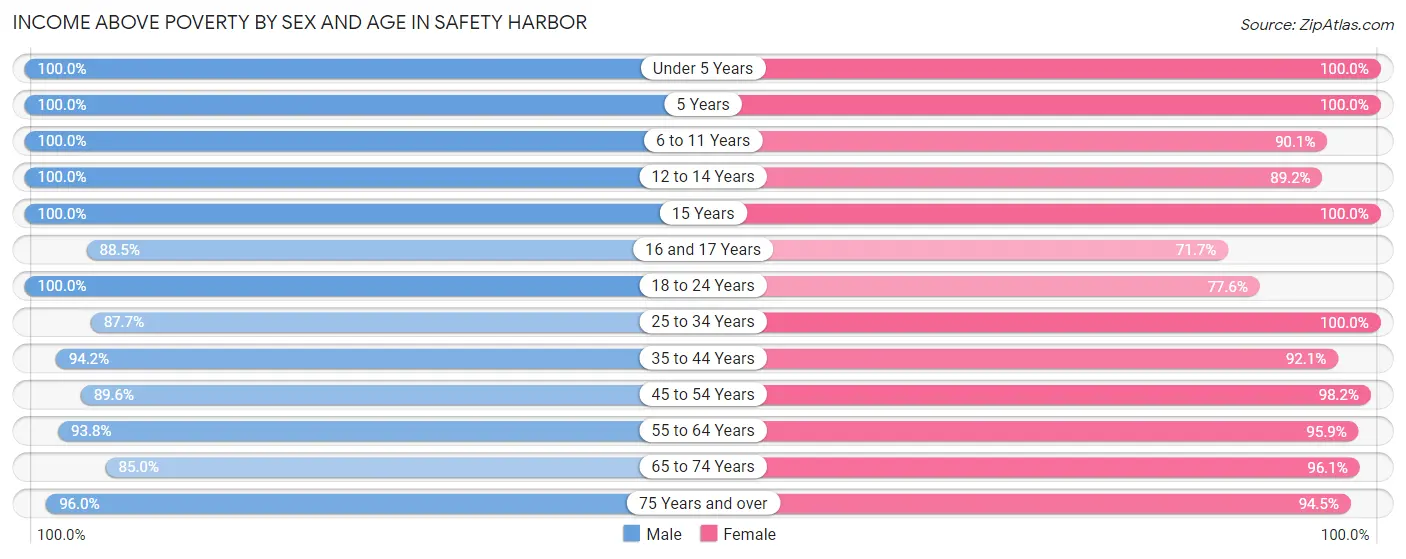
| Age Bracket | Male | Female |
| Under 5 Years | 559 (100.0%) | 453 (100.0%) |
| 5 Years | 40 (100.0%) | 21 (100.0%) |
| 6 to 11 Years | 521 (100.0%) | 555 (90.1%) |
| 12 to 14 Years | 400 (100.0%) | 157 (89.2%) |
| 15 Years | 65 (100.0%) | 124 (100.0%) |
| 16 and 17 Years | 146 (88.5%) | 218 (71.7%) |
| 18 to 24 Years | 350 (100.0%) | 370 (77.6%) |
| 25 to 34 Years | 693 (87.7%) | 902 (100.0%) |
| 35 to 44 Years | 972 (94.2%) | 932 (92.1%) |
| 45 to 54 Years | 1,161 (89.6%) | 1,355 (98.2%) |
| 55 to 64 Years | 1,010 (93.8%) | 1,292 (95.9%) |
| 65 to 74 Years | 904 (85.0%) | 1,058 (96.1%) |
| 75 Years and over | 597 (96.0%) | 921 (94.5%) |
| Total | 7,418 (92.9%) | 8,358 (94.0%) |
Income Below Poverty Among Married-Couple Families in Safety Harbor
The poverty statistics for married-couple families in Safety Harbor show that 2.5% or 89 of the total 3,566 families live below the poverty line. Families with 1 or 2 children have the highest poverty rate of 5.1%, comprising of 55 families. On the other hand, families with 3 or 4 children have the lowest poverty rate of 0.0%, which includes 0 families.
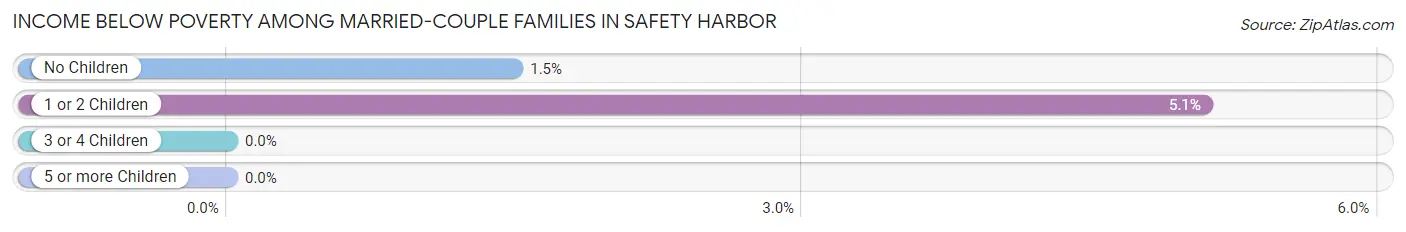
| Children | Above Poverty | Below Poverty |
| No Children | 2,249 (98.5%) | 34 (1.5%) |
| 1 or 2 Children | 1,026 (94.9%) | 55 (5.1%) |
| 3 or 4 Children | 202 (100.0%) | 0 (0.0%) |
| 5 or more Children | 0 (0.0%) | 0 (0.0%) |
| Total | 3,477 (97.5%) | 89 (2.5%) |
Income Below Poverty Among Single-Parent Households in Safety Harbor
According to the poverty data in Safety Harbor, 7.6% or 26 single-father households and 2.8% or 20 single-mother households are living below the poverty line. Among single-father households, those with 1 or 2 children have the highest poverty rate, with 19 households (7.8%) experiencing poverty. Likewise, among single-mother households, those with 1 or 2 children have the highest poverty rate, with 20 households (8.2%) falling below the poverty line.
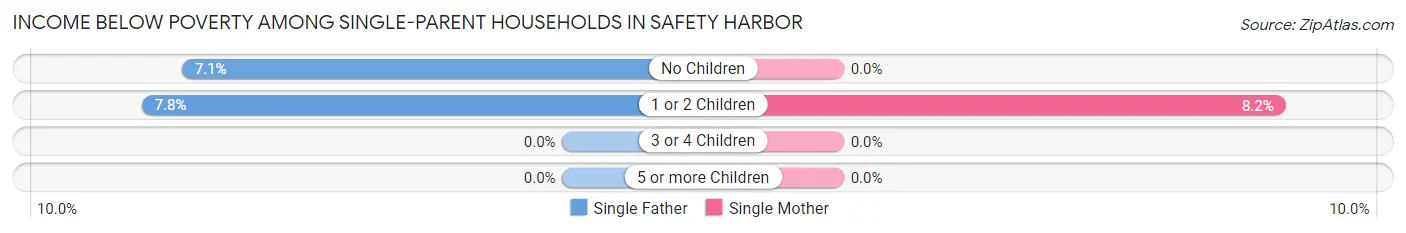
| Children | Single Father | Single Mother |
| No Children | 7 (7.1%) | 0 (0.0%) |
| 1 or 2 Children | 19 (7.8%) | 20 (8.2%) |
| 3 or 4 Children | 0 (0.0%) | 0 (0.0%) |
| 5 or more Children | 0 (0.0%) | 0 (0.0%) |
| Total | 26 (7.6%) | 20 (2.8%) |
Income Below Poverty Among Married-Couple vs Single-Parent Households in Safety Harbor
The poverty data for Safety Harbor shows that 89 of the married-couple family households (2.5%) and 46 of the single-parent households (4.4%) are living below the poverty level. Within the married-couple family households, those with 1 or 2 children have the highest poverty rate, with 55 households (5.1%) falling below the poverty line. Among the single-parent households, those with 1 or 2 children have the highest poverty rate, with 39 household (8.0%) living below poverty.
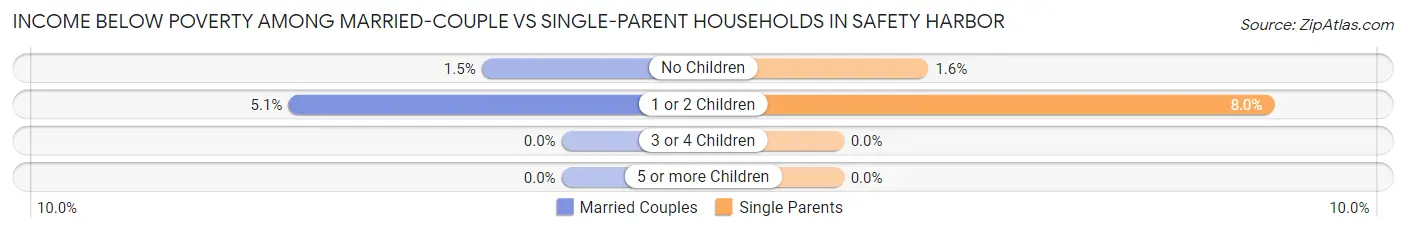
| Children | Married-Couple Families | Single-Parent Households |
| No Children | 34 (1.5%) | 7 (1.6%) |
| 1 or 2 Children | 55 (5.1%) | 39 (8.0%) |
| 3 or 4 Children | 0 (0.0%) | 0 (0.0%) |
| 5 or more Children | 0 (0.0%) | 0 (0.0%) |
| Total | 89 (2.5%) | 46 (4.4%) |
Race in Safety Harbor
The most populous races in Safety Harbor are White / Caucasian (14,573 | 85.3%), Hispanic or Latino (1,296 | 7.6%), and Black / African American (1,129 | 6.6%).
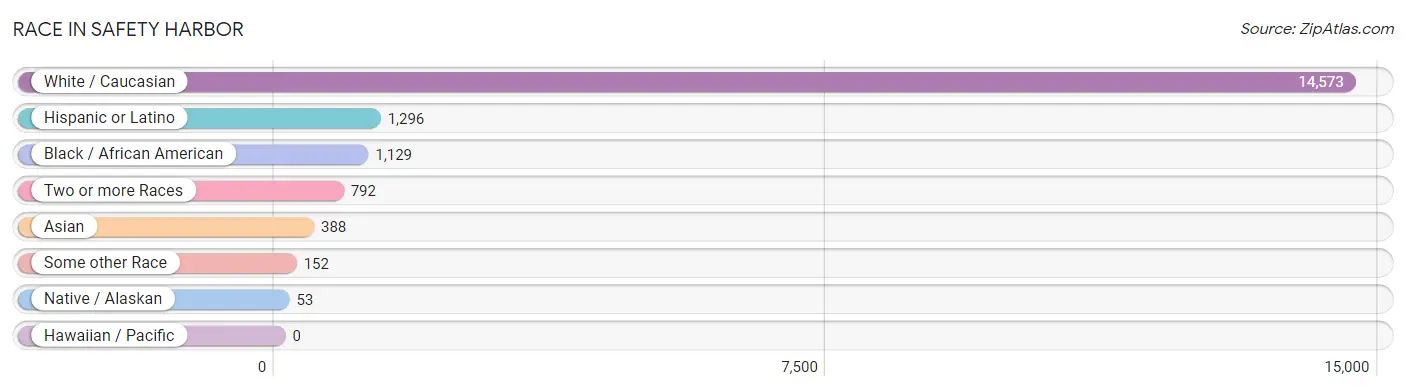
| Race | # Population | % Population |
| Asian | 388 | 2.3% |
| Black / African American | 1,129 | 6.6% |
| Hawaiian / Pacific | 0 | 0.0% |
| Hispanic or Latino | 1,296 | 7.6% |
| Native / Alaskan | 53 | 0.3% |
| White / Caucasian | 14,573 | 85.3% |
| Two or more Races | 792 | 4.6% |
| Some other Race | 152 | 0.9% |
| Total | 17,087 | 100.0% |
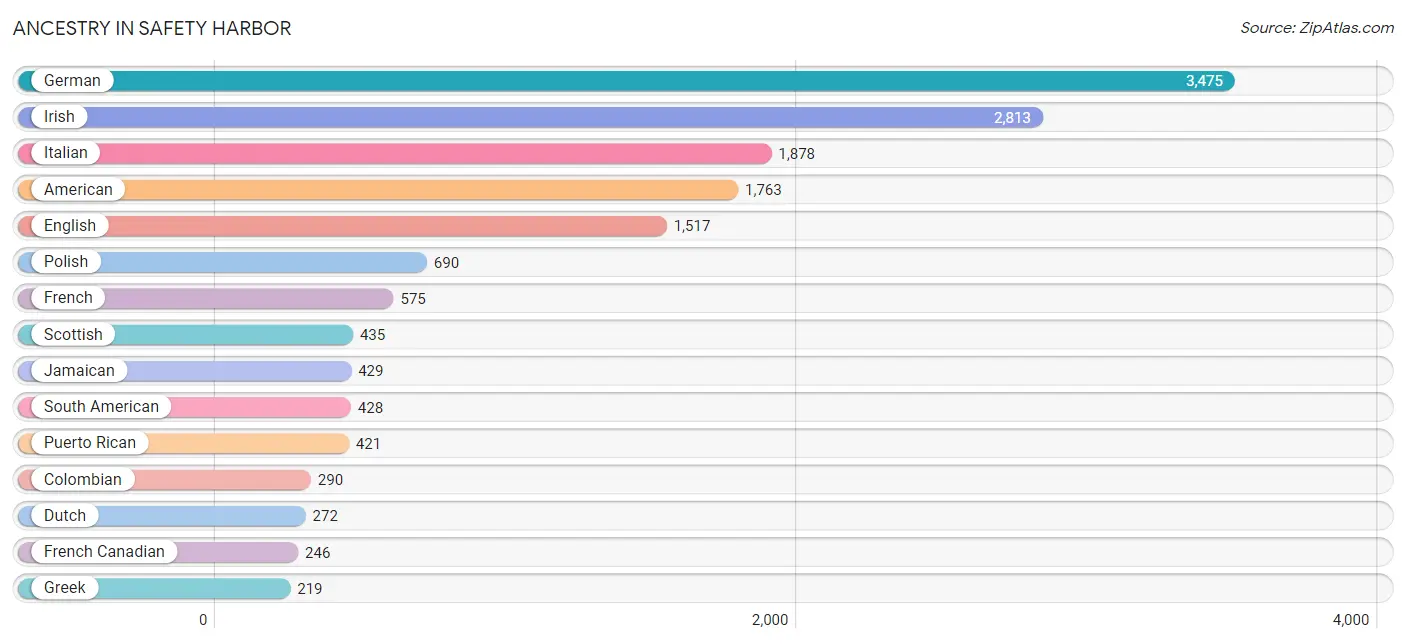
Ancestry in Safety Harbor
The most populous ancestries reported in Safety Harbor are German (3,475 | 20.3%), Irish (2,813 | 16.5%), Italian (1,878 | 11.0%), American (1,763 | 10.3%), and English (1,517 | 8.9%), together accounting for 67.0% of all Safety Harbor residents.
| Ancestry | # Population | % Population |
| American | 1,763 | 10.3% |
| Arab | 78 | 0.5% |
| Argentinean | 114 | 0.7% |
| Austrian | 85 | 0.5% |
| Belgian | 44 | 0.3% |
| Bhutanese | 45 | 0.3% |
| Brazilian | 52 | 0.3% |
| British | 132 | 0.8% |
| Burmese | 14 | 0.1% |
| Canadian | 40 | 0.2% |
| Central American | 75 | 0.4% |
| Central American Indian | 19 | 0.1% |
| Cherokee | 49 | 0.3% |
| Choctaw | 36 | 0.2% |
| Colombian | 290 | 1.7% |
| Croatian | 32 | 0.2% |
| Cuban | 202 | 1.2% |
| Czech | 83 | 0.5% |
| Danish | 35 | 0.2% |
| Dutch | 272 | 1.6% |
| Eastern European | 40 | 0.2% |
| Ecuadorian | 15 | 0.1% |
| English | 1,517 | 8.9% |
| European | 197 | 1.1% |
| French | 575 | 3.4% |
| French Canadian | 246 | 1.4% |
| German | 3,475 | 20.3% |
| Greek | 219 | 1.3% |
| Guatemalan | 15 | 0.1% |
| Hungarian | 169 | 1.0% |
| Indian (Asian) | 91 | 0.5% |
| Irish | 2,813 | 16.5% |
| Italian | 1,878 | 11.0% |
| Jamaican | 429 | 2.5% |
| Japanese | 19 | 0.1% |
| Korean | 69 | 0.4% |
| Lebanese | 60 | 0.4% |
| Lithuanian | 65 | 0.4% |
| Mexican | 116 | 0.7% |
| Moroccan | 18 | 0.1% |
| Native Hawaiian | 10 | 0.1% |
| Norwegian | 173 | 1.0% |
| Panamanian | 50 | 0.3% |
| Peruvian | 9 | 0.1% |
| Polish | 690 | 4.0% |
| Portuguese | 111 | 0.6% |
| Puerto Rican | 421 | 2.5% |
| Romanian | 37 | 0.2% |
| Russian | 87 | 0.5% |
| Salvadoran | 10 | 0.1% |
| Scandinavian | 82 | 0.5% |
| Scotch-Irish | 132 | 0.8% |
| Scottish | 435 | 2.5% |
| Seminole | 4 | 0.0% |
| Serbian | 8 | 0.1% |
| Slavic | 9 | 0.1% |
| Slovak | 86 | 0.5% |
| South American | 428 | 2.5% |
| Spaniard | 22 | 0.1% |
| Sri Lankan | 99 | 0.6% |
| Subsaharan African | 24 | 0.1% |
| Swedish | 153 | 0.9% |
| Swiss | 42 | 0.3% |
| Thai | 177 | 1.0% |
| Trinidadian and Tobagonian | 7 | 0.0% |
| Turkish | 53 | 0.3% |
| Welsh | 141 | 0.8% |
| Yugoslavian | 14 | 0.1% | View All 68 Rows |
Immigrants in Safety Harbor
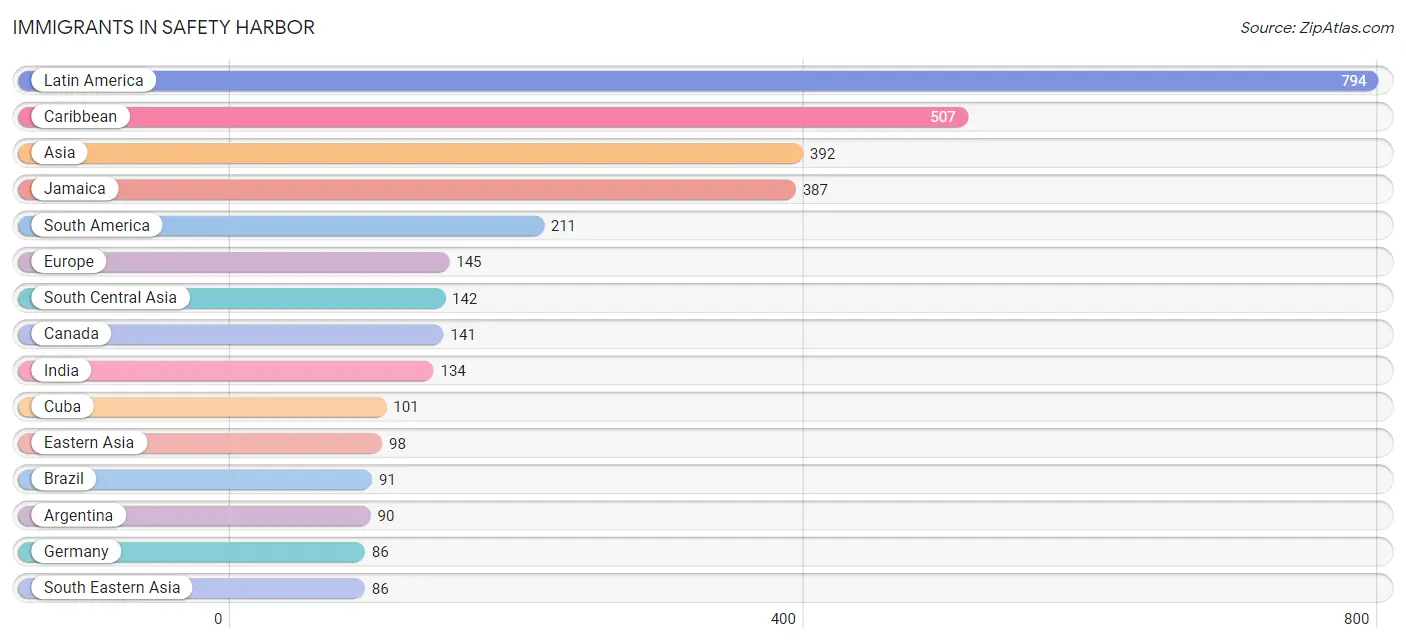
The most numerous immigrant groups reported in Safety Harbor came from Latin America (794 | 4.6%), Caribbean (507 | 3.0%), Asia (392 | 2.3%), Jamaica (387 | 2.3%), and South America (211 | 1.2%), together accounting for 13.4% of all Safety Harbor residents.
| Immigration Origin | # Population | % Population |
| Africa | 42 | 0.3% |
| Argentina | 90 | 0.5% |
| Asia | 392 | 2.3% |
| Bosnia and Herzegovina | 14 | 0.1% |
| Brazil | 91 | 0.5% |
| Cambodia | 19 | 0.1% |
| Canada | 141 | 0.8% |
| Caribbean | 507 | 3.0% |
| Central America | 76 | 0.4% |
| China | 53 | 0.3% |
| Cuba | 101 | 0.6% |
| Eastern Asia | 98 | 0.6% |
| Eastern Europe | 33 | 0.2% |
| Ecuador | 15 | 0.1% |
| England | 26 | 0.2% |
| Europe | 145 | 0.9% |
| Germany | 86 | 0.5% |
| Guatemala | 19 | 0.1% |
| India | 134 | 0.8% |
| Israel | 9 | 0.1% |
| Jamaica | 387 | 2.3% |
| Japan | 45 | 0.3% |
| Kuwait | 32 | 0.2% |
| Latin America | 794 | 4.6% |
| Mexico | 45 | 0.3% |
| Middle Africa | 21 | 0.1% |
| Nepal | 8 | 0.1% |
| Northern Europe | 26 | 0.2% |
| Panama | 12 | 0.1% |
| Peru | 9 | 0.1% |
| Philippines | 6 | 0.0% |
| Saudi Arabia | 10 | 0.1% |
| South Africa | 21 | 0.1% |
| South America | 211 | 1.2% |
| South Central Asia | 142 | 0.8% |
| South Eastern Asia | 86 | 0.5% |
| Trinidad and Tobago | 19 | 0.1% |
| Turkey | 15 | 0.1% |
| Ukraine | 11 | 0.1% |
| Venezuela | 6 | 0.0% |
| Vietnam | 61 | 0.4% |
| Western Asia | 66 | 0.4% |
| Western Europe | 86 | 0.5% | View All 43 Rows |
Sex and Age in Safety Harbor
Sex and Age in Safety Harbor
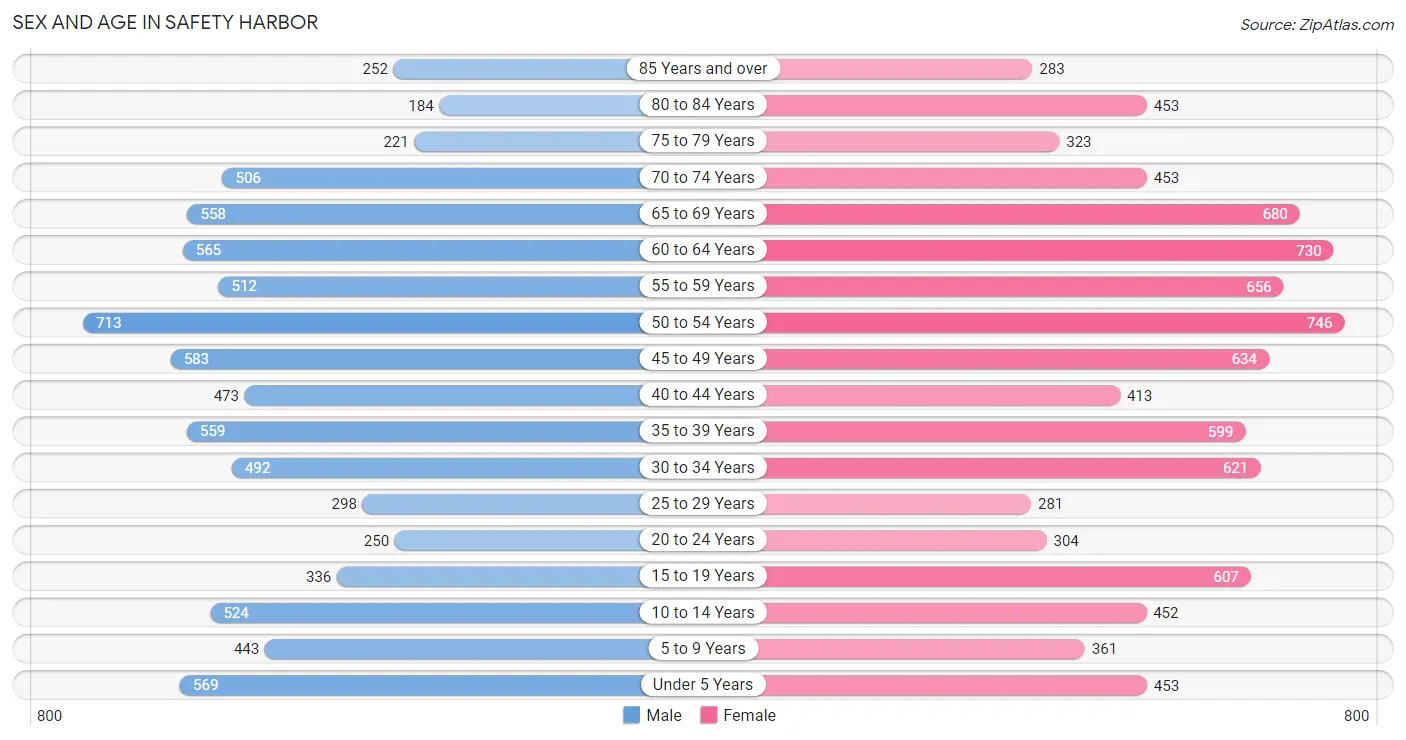
The most populous age groups in Safety Harbor are 50 to 54 Years (713 | 8.9%) for men and 50 to 54 Years (746 | 8.2%) for women.
| Age Bracket | Male | Female |
| Under 5 Years | 569 (7.1%) | 453 (5.0%) |
| 5 to 9 Years | 443 (5.5%) | 361 (4.0%) |
| 10 to 14 Years | 524 (6.5%) | 452 (5.0%) |
| 15 to 19 Years | 336 (4.2%) | 607 (6.7%) |
| 20 to 24 Years | 250 (3.1%) | 304 (3.4%) |
| 25 to 29 Years | 298 (3.7%) | 281 (3.1%) |
| 30 to 34 Years | 492 (6.1%) | 621 (6.9%) |
| 35 to 39 Years | 559 (7.0%) | 599 (6.6%) |
| 40 to 44 Years | 473 (5.9%) | 413 (4.6%) |
| 45 to 49 Years | 583 (7.2%) | 634 (7.0%) |
| 50 to 54 Years | 713 (8.9%) | 746 (8.2%) |
| 55 to 59 Years | 512 (6.4%) | 656 (7.2%) |
| 60 to 64 Years | 565 (7.0%) | 730 (8.1%) |
| 65 to 69 Years | 558 (6.9%) | 680 (7.5%) |
| 70 to 74 Years | 506 (6.3%) | 453 (5.0%) |
| 75 to 79 Years | 221 (2.8%) | 323 (3.6%) |
| 80 to 84 Years | 184 (2.3%) | 453 (5.0%) |
| 85 Years and over | 252 (3.1%) | 283 (3.1%) |
| Total | 8,038 (100.0%) | 9,049 (100.0%) |
Families and Households in Safety Harbor
Median Family Size in Safety Harbor
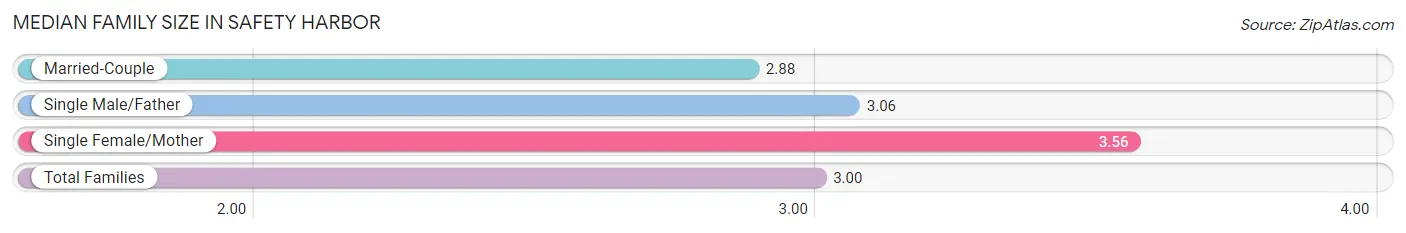
The median family size in Safety Harbor is 3.00 persons per family, with single female/mother families (706 | 15.3%) accounting for the largest median family size of 3.56 persons per family. On the other hand, married-couple families (3,566 | 77.3%) represent the smallest median family size with 2.88 persons per family.
| Family Type | # Families | Family Size |
| Married-Couple | 3,566 (77.3%) | 2.88 |
| Single Male/Father | 342 (7.4%) | 3.06 |
| Single Female/Mother | 706 (15.3%) | 3.56 |
| Total Families | 4,614 (100.0%) | 3.00 |
Median Household Size in Safety Harbor
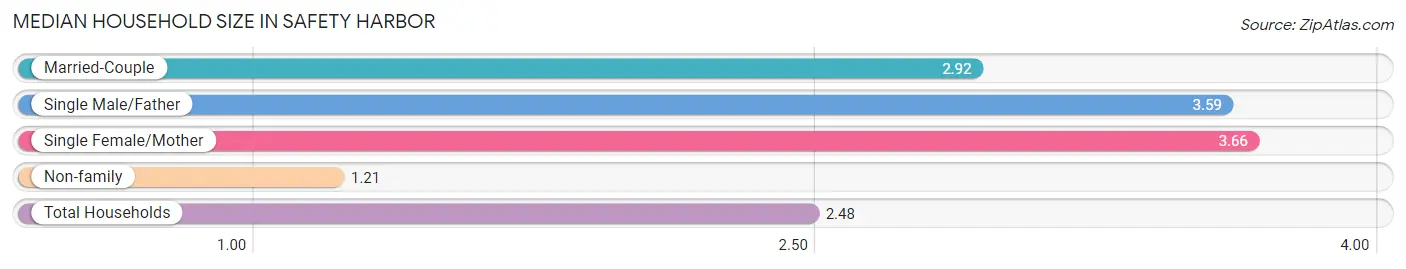
The median household size in Safety Harbor is 2.48 persons per household, with single female/mother households (706 | 10.4%) accounting for the largest median household size of 3.66 persons per household. non-family households (2,175 | 32.0%) represent the smallest median household size with 1.21 persons per household.
| Household Type | # Households | Household Size |
| Married-Couple | 3,566 (52.5%) | 2.92 |
| Single Male/Father | 342 (5.0%) | 3.59 |
| Single Female/Mother | 706 (10.4%) | 3.66 |
| Non-family | 2,175 (32.0%) | 1.21 |
| Total Households | 6,789 (100.0%) | 2.48 |
Household Size by Marriage Status in Safety Harbor
Out of a total of 6,789 households in Safety Harbor, 4,614 (68.0%) are family households, while 2,175 (32.0%) are nonfamily households. The most numerous type of family households are 2-person households, comprising 2,340, and the most common type of nonfamily households are 1-person households, comprising 1,867.
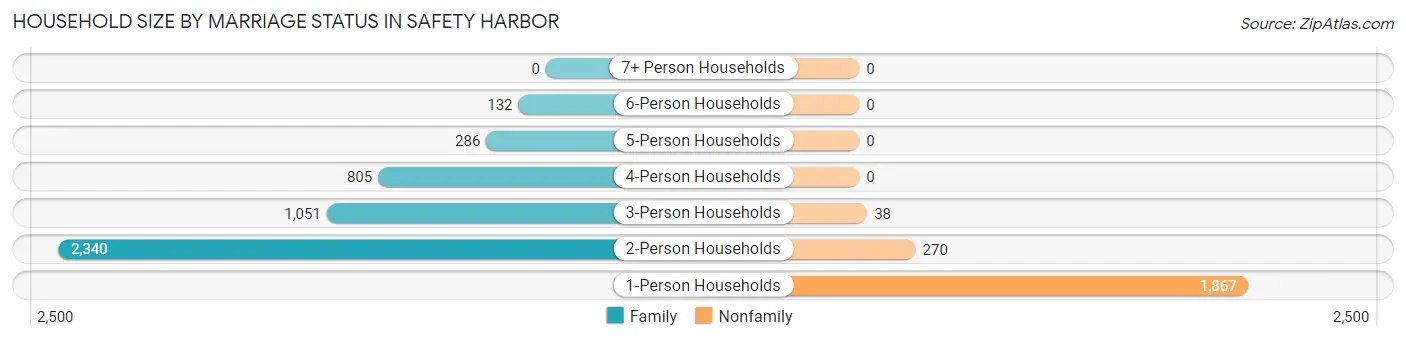
| Household Size | Family Households | Nonfamily Households |
| 1-Person Households | - | 1,867 (27.5%) |
| 2-Person Households | 2,340 (34.5%) | 270 (4.0%) |
| 3-Person Households | 1,051 (15.5%) | 38 (0.6%) |
| 4-Person Households | 805 (11.9%) | 0 (0.0%) |
| 5-Person Households | 286 (4.2%) | 0 (0.0%) |
| 6-Person Households | 132 (1.9%) | 0 (0.0%) |
| 7+ Person Households | 0 (0.0%) | 0 (0.0%) |
| Total | 4,614 (68.0%) | 2,175 (32.0%) |
Female Fertility in Safety Harbor
Fertility by Age in Safety Harbor
Average fertility rate in Safety Harbor is 94.0 births per 1,000 women. Women in the age bracket of 35 to 50 years have the highest fertility rate with 141.0 births per 1,000 women. Women in the age bracket of 35 to 50 years acount for 74.0% of all women with births.
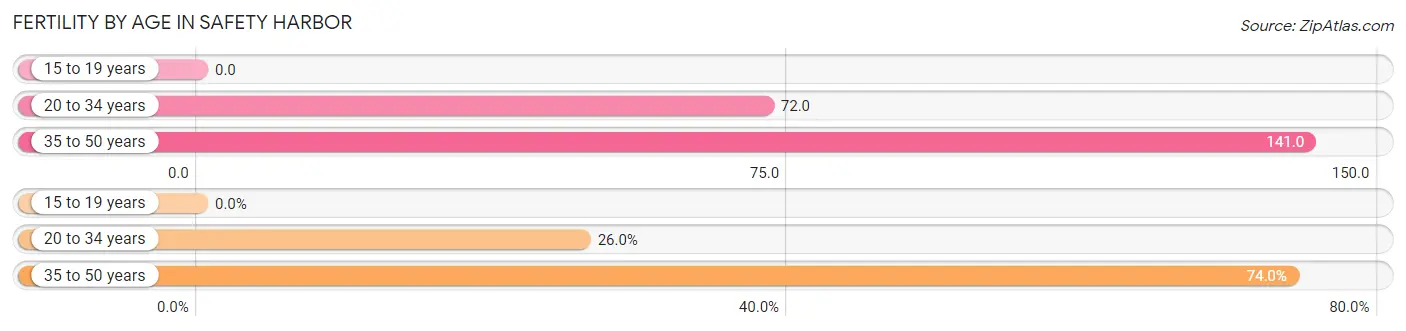
| Age Bracket | Women with Births | Births / 1,000 Women |
| 15 to 19 years | 0 (0.0%) | 0.0 |
| 20 to 34 years | 87 (26.0%) | 72.0 |
| 35 to 50 years | 248 (74.0%) | 141.0 |
| Total | 335 (100.0%) | 94.0 |
Fertility by Age by Marriage Status in Safety Harbor
91.0% of women with births (335) in Safety Harbor are married. The highest percentage of unmarried women with births falls into 20 to 34 years age bracket with 34.5% of them unmarried at the time of birth, while the lowest percentage of unmarried women with births belong to 35 to 50 years age bracket with 0.0% of them unmarried.
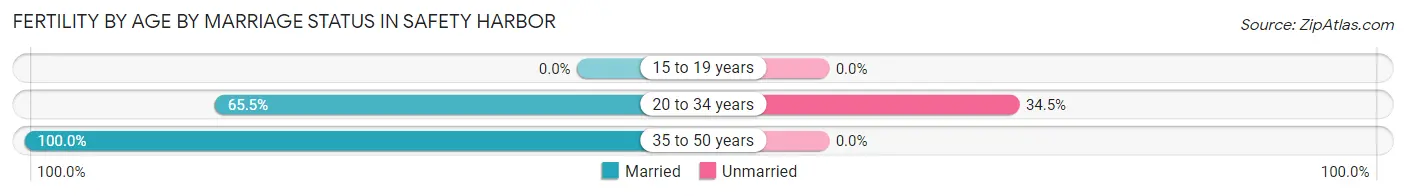
| Age Bracket | Married | Unmarried |
| 15 to 19 years | 0 (0.0%) | 0 (0.0%) |
| 20 to 34 years | 57 (65.5%) | 30 (34.5%) |
| 35 to 50 years | 248 (100.0%) | 0 (0.0%) |
| Total | 305 (91.0%) | 30 (9.0%) |
Fertility by Education in Safety Harbor
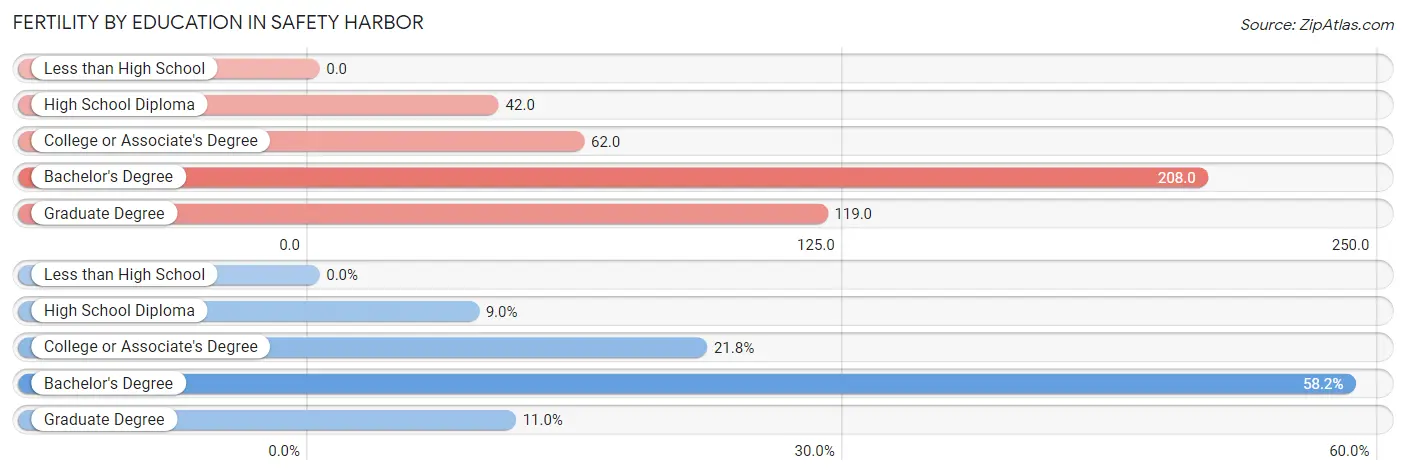
| Educational Attainment | Women with Births | Births / 1,000 Women |
| Less than High School | 0 (0.0%) | 0.0 |
| High School Diploma | 30 (9.0%) | 42.0 |
| College or Associate's Degree | 73 (21.8%) | 62.0 |
| Bachelor's Degree | 195 (58.2%) | 208.0 |
| Graduate Degree | 37 (11.0%) | 119.0 |
| Total | 335 (100.0%) | 94.0 |
Fertility by Education by Marriage Status in Safety Harbor
9.0% of women with births in Safety Harbor are unmarried. Women with the educational attainment of college or associate's degree are most likely to be married with 100.0% of them married at childbirth, while women with the educational attainment of high school diploma are least likely to be married with 100.0% of them unmarried at childbirth.
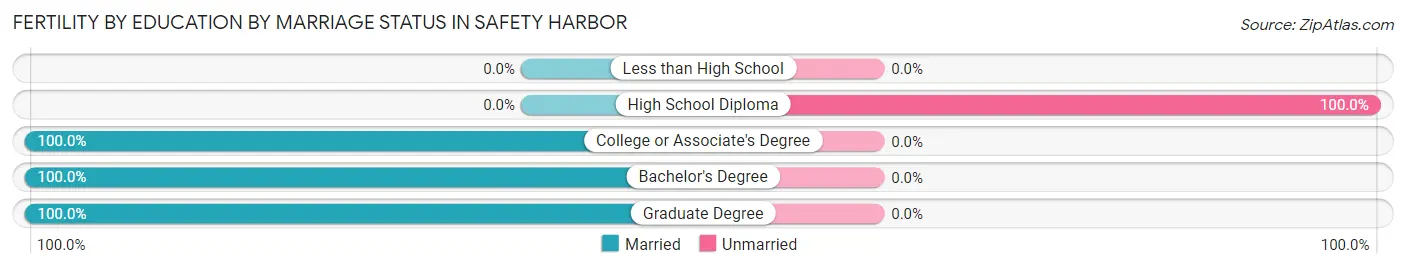
| Educational Attainment | Married | Unmarried |
| Less than High School | 0 (0.0%) | 0 (0.0%) |
| High School Diploma | 0 (0.0%) | 30 (100.0%) |
| College or Associate's Degree | 73 (100.0%) | 0 (0.0%) |
| Bachelor's Degree | 195 (100.0%) | 0 (0.0%) |
| Graduate Degree | 37 (100.0%) | 0 (0.0%) |
| Total | 305 (91.0%) | 30 (9.0%) |
Employment Characteristics in Safety Harbor
Employment by Class of Employer in Safety Harbor
Among the 8,233 employed individuals in Safety Harbor, private company employees (5,526 | 67.1%), not-for-profit organizations (881 | 10.7%), and local government employees (702 | 8.5%) make up the most common classes of employment.
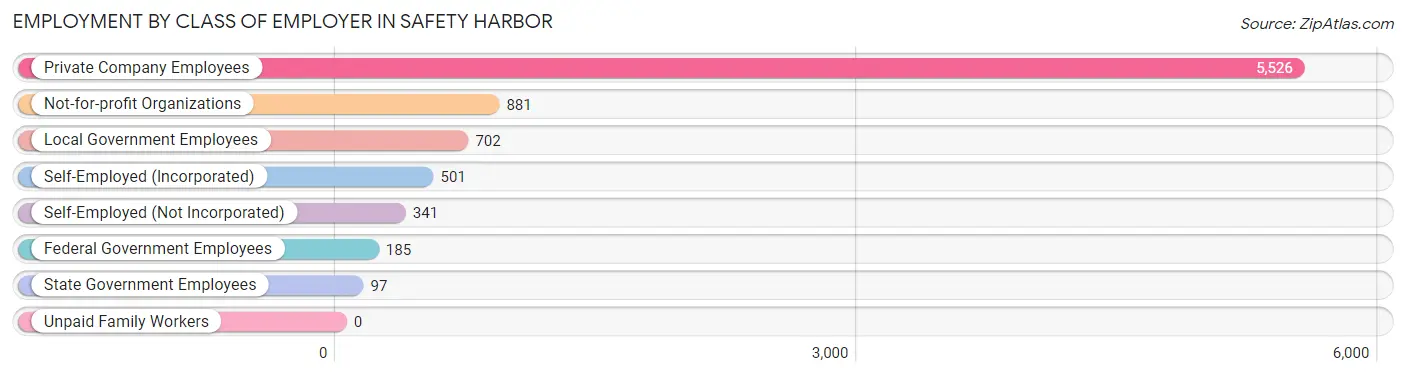
| Employer Class | # Employees | % Employees |
| Private Company Employees | 5,526 | 67.1% |
| Self-Employed (Incorporated) | 501 | 6.1% |
| Self-Employed (Not Incorporated) | 341 | 4.1% |
| Not-for-profit Organizations | 881 | 10.7% |
| Local Government Employees | 702 | 8.5% |
| State Government Employees | 97 | 1.2% |
| Federal Government Employees | 185 | 2.2% |
| Unpaid Family Workers | 0 | 0.0% |
| Total | 8,233 | 100.0% |
Employment Status by Age in Safety Harbor
According to the labor force statistics for Safety Harbor, out of the total population over 16 years of age (14,090), 62.5% or 8,806 individuals are in the labor force, with 4.1% or 361 of them unemployed. The age group with the highest labor force participation rate is 20 to 24 years, with 92.1% or 510 individuals in the labor force. Within the labor force, the 20 to 24 years age range has the highest percentage of unemployed individuals, with 17.5% or 89 of them being unemployed.
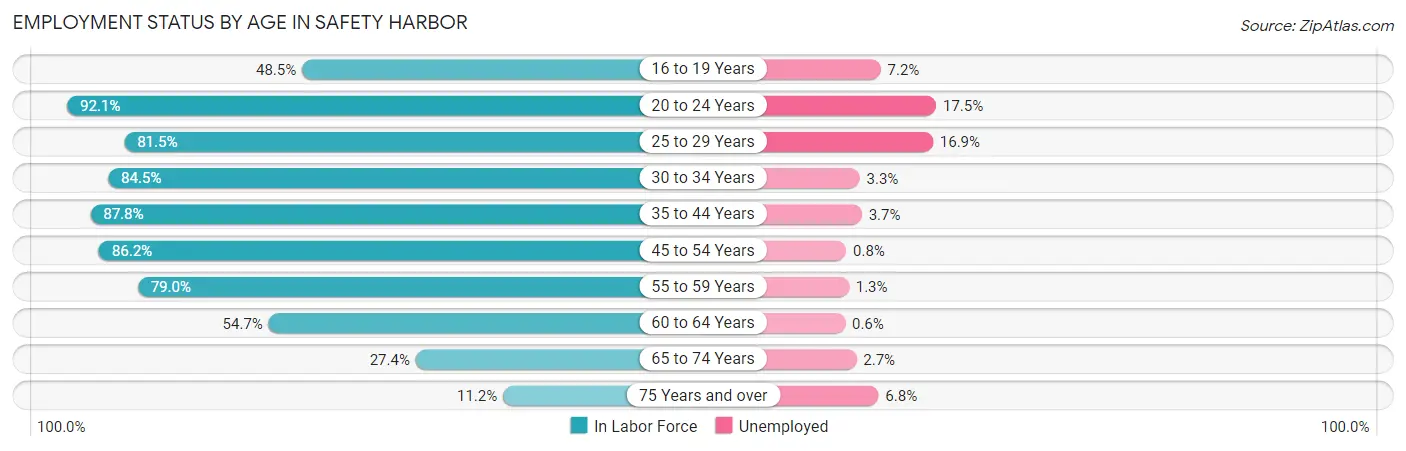
| Age Bracket | In Labor Force | Unemployed |
| 16 to 19 Years | 363 (48.5%) | 26 (7.2%) |
| 20 to 24 Years | 510 (92.1%) | 89 (17.5%) |
| 25 to 29 Years | 472 (81.5%) | 80 (16.9%) |
| 30 to 34 Years | 940 (84.5%) | 31 (3.3%) |
| 35 to 44 Years | 1,795 (87.8%) | 66 (3.7%) |
| 45 to 54 Years | 2,307 (86.2%) | 18 (0.8%) |
| 55 to 59 Years | 923 (79.0%) | 12 (1.3%) |
| 60 to 64 Years | 708 (54.7%) | 4 (0.6%) |
| 65 to 74 Years | 602 (27.4%) | 16 (2.7%) |
| 75 Years and over | 192 (11.2%) | 13 (6.8%) |
| Total | 8,806 (62.5%) | 361 (4.1%) |
Employment Status by Educational Attainment in Safety Harbor
According to labor force statistics for Safety Harbor, 80.5% of individuals (7,144) out of the total population between 25 and 64 years of age (8,875) are in the labor force, with 3.0% or 214 of them being unemployed. The group with the highest labor force participation rate are those with the educational attainment of bachelor's degree or higher, with 84.1% or 3,776 individuals in the labor force. Within the labor force, individuals with high school diploma education have the highest percentage of unemployment, with 7.7% or 99 of them being unemployed.
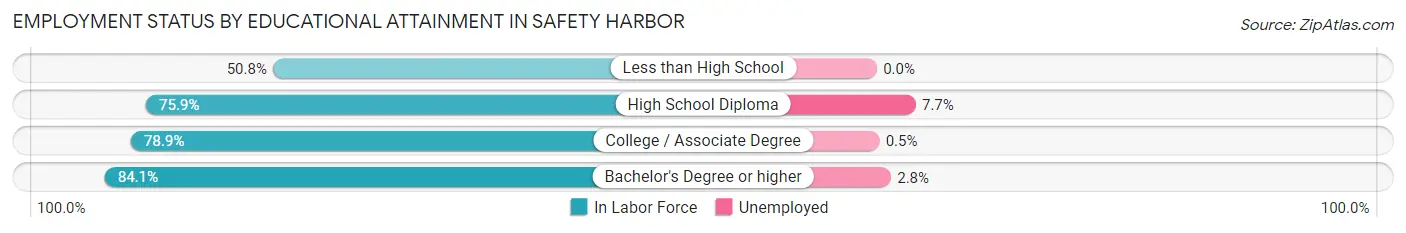
| Educational Attainment | In Labor Force | Unemployed |
| Less than High School | 67 (50.8%) | 0 (0.0%) |
| High School Diploma | 1,286 (75.9%) | 130 (7.7%) |
| College / Associate Degree | 2,019 (78.9%) | 13 (0.5%) |
| Bachelor's Degree or higher | 3,776 (84.1%) | 126 (2.8%) |
| Total | 7,144 (80.5%) | 266 (3.0%) |
Employment Occupations by Sex in Safety Harbor
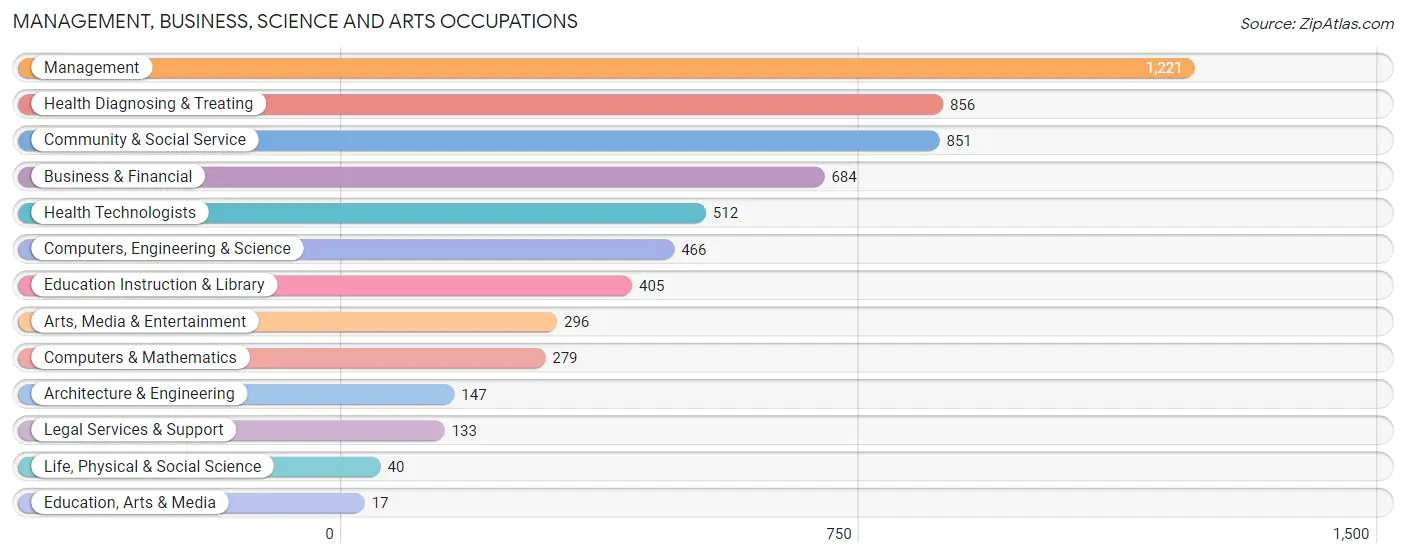
Management, Business, Science and Arts Occupations
The most common Management, Business, Science and Arts occupations in Safety Harbor are Management (1,221 | 14.4%), Health Diagnosing & Treating (856 | 10.1%), Community & Social Service (851 | 10.1%), Business & Financial (684 | 8.1%), and Health Technologists (512 | 6.0%).
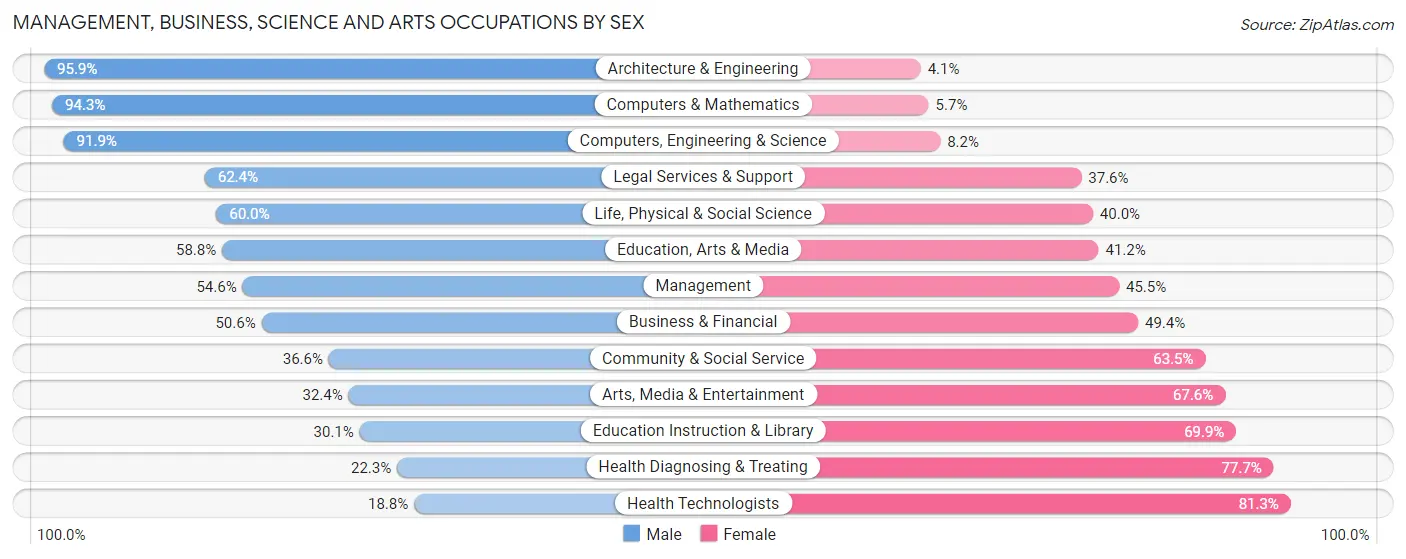
Management, Business, Science and Arts Occupations by Sex
Within the Management, Business, Science and Arts occupations in Safety Harbor, the most male-oriented occupations are Architecture & Engineering (95.9%), Computers & Mathematics (94.3%), and Computers, Engineering & Science (91.8%), while the most female-oriented occupations are Health Technologists (81.2%), Health Diagnosing & Treating (77.7%), and Education Instruction & Library (69.9%).
| Occupation | Male | Female |
| Management | 666 (54.5%) | 555 (45.5%) |
| Business & Financial | 346 (50.6%) | 338 (49.4%) |
| Computers, Engineering & Science | 428 (91.8%) | 38 (8.2%) |
| Computers & Mathematics | 263 (94.3%) | 16 (5.7%) |
| Architecture & Engineering | 141 (95.9%) | 6 (4.1%) |
| Life, Physical & Social Science | 24 (60.0%) | 16 (40.0%) |
| Community & Social Service | 311 (36.5%) | 540 (63.4%) |
| Education, Arts & Media | 10 (58.8%) | 7 (41.2%) |
| Legal Services & Support | 83 (62.4%) | 50 (37.6%) |
| Education Instruction & Library | 122 (30.1%) | 283 (69.9%) |
| Arts, Media & Entertainment | 96 (32.4%) | 200 (67.6%) |
| Health Diagnosing & Treating | 191 (22.3%) | 665 (77.7%) |
| Health Technologists | 96 (18.8%) | 416 (81.2%) |
| Total (Category) | 1,942 (47.6%) | 2,136 (52.4%) |
| Total (Overall) | 4,085 (48.3%) | 4,371 (51.7%) |
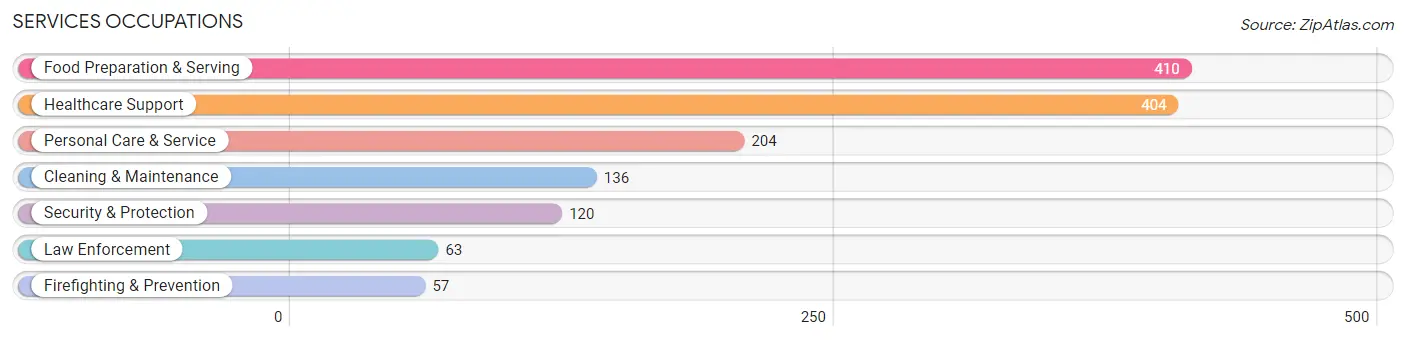
Services Occupations
The most common Services occupations in Safety Harbor are Food Preparation & Serving (410 | 4.9%), Healthcare Support (404 | 4.8%), Personal Care & Service (204 | 2.4%), Cleaning & Maintenance (136 | 1.6%), and Security & Protection (120 | 1.4%).
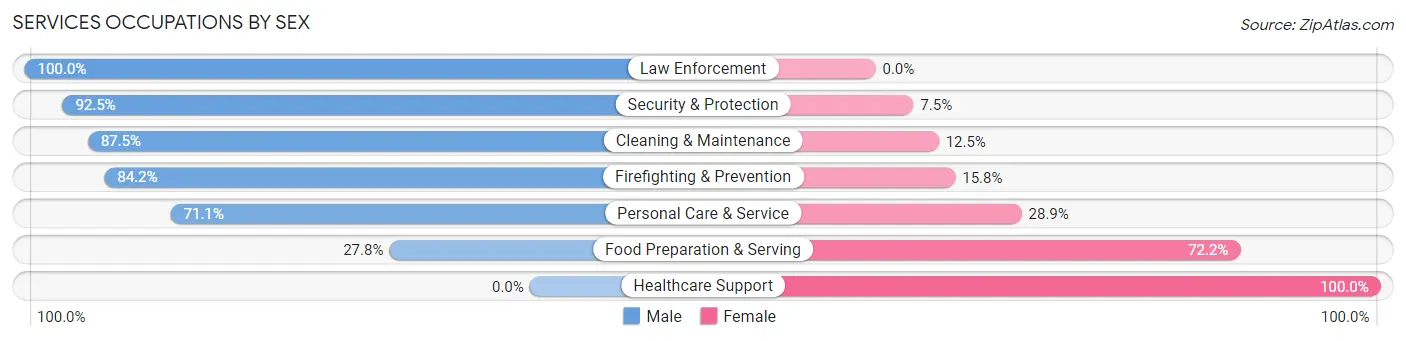
Services Occupations by Sex
Within the Services occupations in Safety Harbor, the most male-oriented occupations are Law Enforcement (100.0%), Security & Protection (92.5%), and Cleaning & Maintenance (87.5%), while the most female-oriented occupations are Healthcare Support (100.0%), Food Preparation & Serving (72.2%), and Personal Care & Service (28.9%).
| Occupation | Male | Female |
| Healthcare Support | 0 (0.0%) | 404 (100.0%) |
| Security & Protection | 111 (92.5%) | 9 (7.5%) |
| Firefighting & Prevention | 48 (84.2%) | 9 (15.8%) |
| Law Enforcement | 63 (100.0%) | 0 (0.0%) |
| Food Preparation & Serving | 114 (27.8%) | 296 (72.2%) |
| Cleaning & Maintenance | 119 (87.5%) | 17 (12.5%) |
| Personal Care & Service | 145 (71.1%) | 59 (28.9%) |
| Total (Category) | 489 (38.4%) | 785 (61.6%) |
| Total (Overall) | 4,085 (48.3%) | 4,371 (51.7%) |
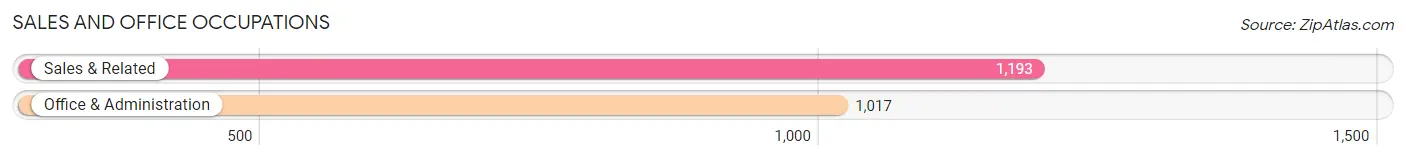
Sales and Office Occupations
The most common Sales and Office occupations in Safety Harbor are Sales & Related (1,193 | 14.1%), and Office & Administration (1,017 | 12.0%).
Sales and Office Occupations by Sex
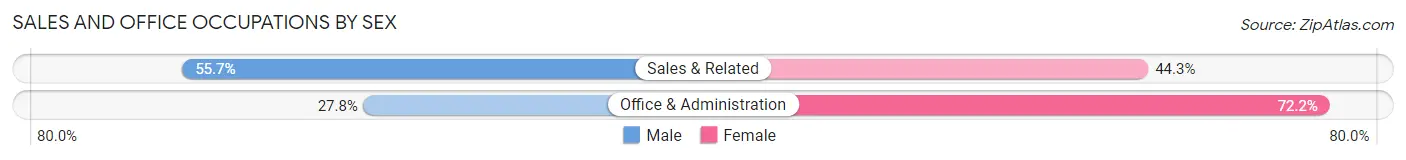
| Occupation | Male | Female |
| Sales & Related | 665 (55.7%) | 528 (44.3%) |
| Office & Administration | 283 (27.8%) | 734 (72.2%) |
| Total (Category) | 948 (42.9%) | 1,262 (57.1%) |
| Total (Overall) | 4,085 (48.3%) | 4,371 (51.7%) |
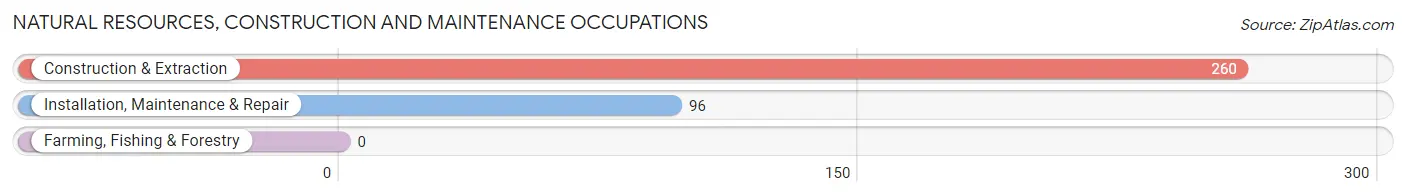
Natural Resources, Construction and Maintenance Occupations
The most common Natural Resources, Construction and Maintenance occupations in Safety Harbor are Construction & Extraction (260 | 3.1%), and Installation, Maintenance & Repair (96 | 1.1%).
Natural Resources, Construction and Maintenance Occupations by Sex
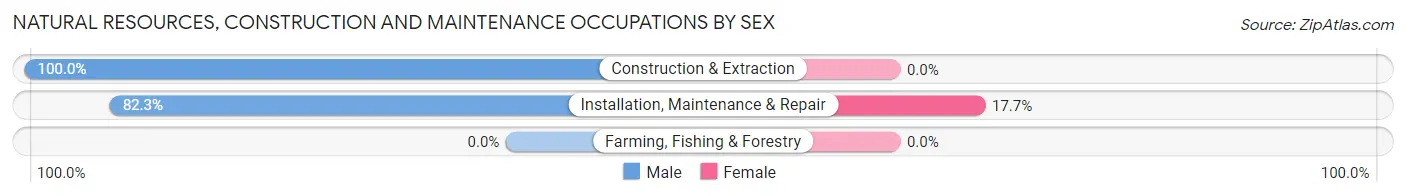
| Occupation | Male | Female |
| Farming, Fishing & Forestry | 0 (0.0%) | 0 (0.0%) |
| Construction & Extraction | 260 (100.0%) | 0 (0.0%) |
| Installation, Maintenance & Repair | 79 (82.3%) | 17 (17.7%) |
| Total (Category) | 339 (95.2%) | 17 (4.8%) |
| Total (Overall) | 4,085 (48.3%) | 4,371 (51.7%) |
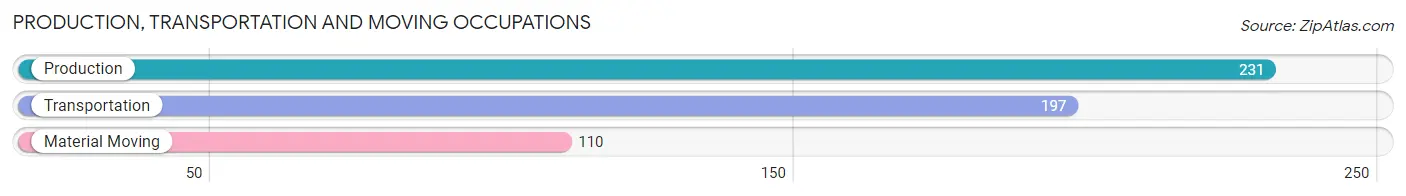
Production, Transportation and Moving Occupations
The most common Production, Transportation and Moving occupations in Safety Harbor are Production (231 | 2.7%), Transportation (197 | 2.3%), and Material Moving (110 | 1.3%).
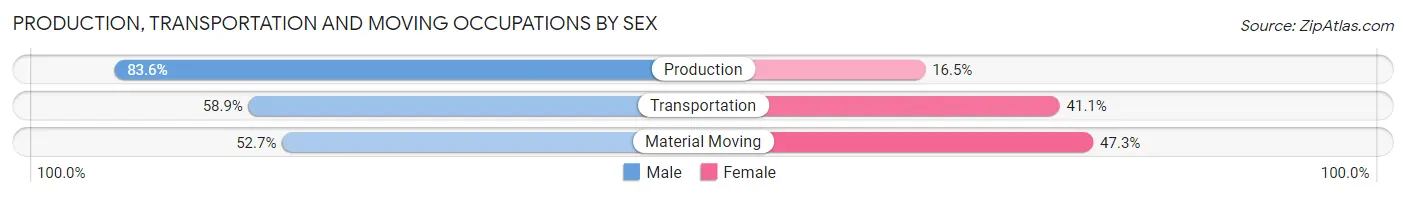
Production, Transportation and Moving Occupations by Sex
| Occupation | Male | Female |
| Production | 193 (83.6%) | 38 (16.5%) |
| Transportation | 116 (58.9%) | 81 (41.1%) |
| Material Moving | 58 (52.7%) | 52 (47.3%) |
| Total (Category) | 367 (68.2%) | 171 (31.8%) |
| Total (Overall) | 4,085 (48.3%) | 4,371 (51.7%) |
Employment Industries by Sex in Safety Harbor
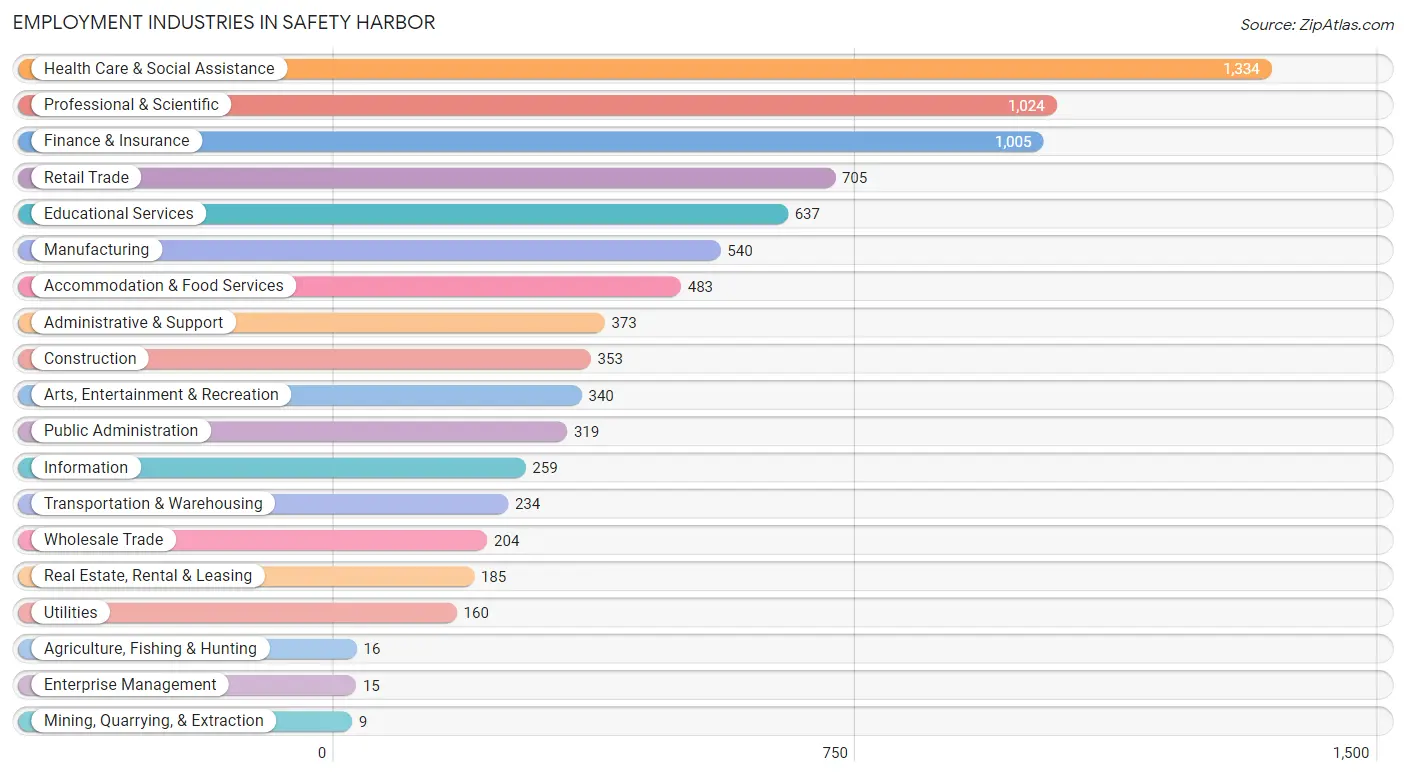
Employment Industries in Safety Harbor
The major employment industries in Safety Harbor include Health Care & Social Assistance (1,334 | 15.8%), Professional & Scientific (1,024 | 12.1%), Finance & Insurance (1,005 | 11.9%), Retail Trade (705 | 8.3%), and Educational Services (637 | 7.5%).
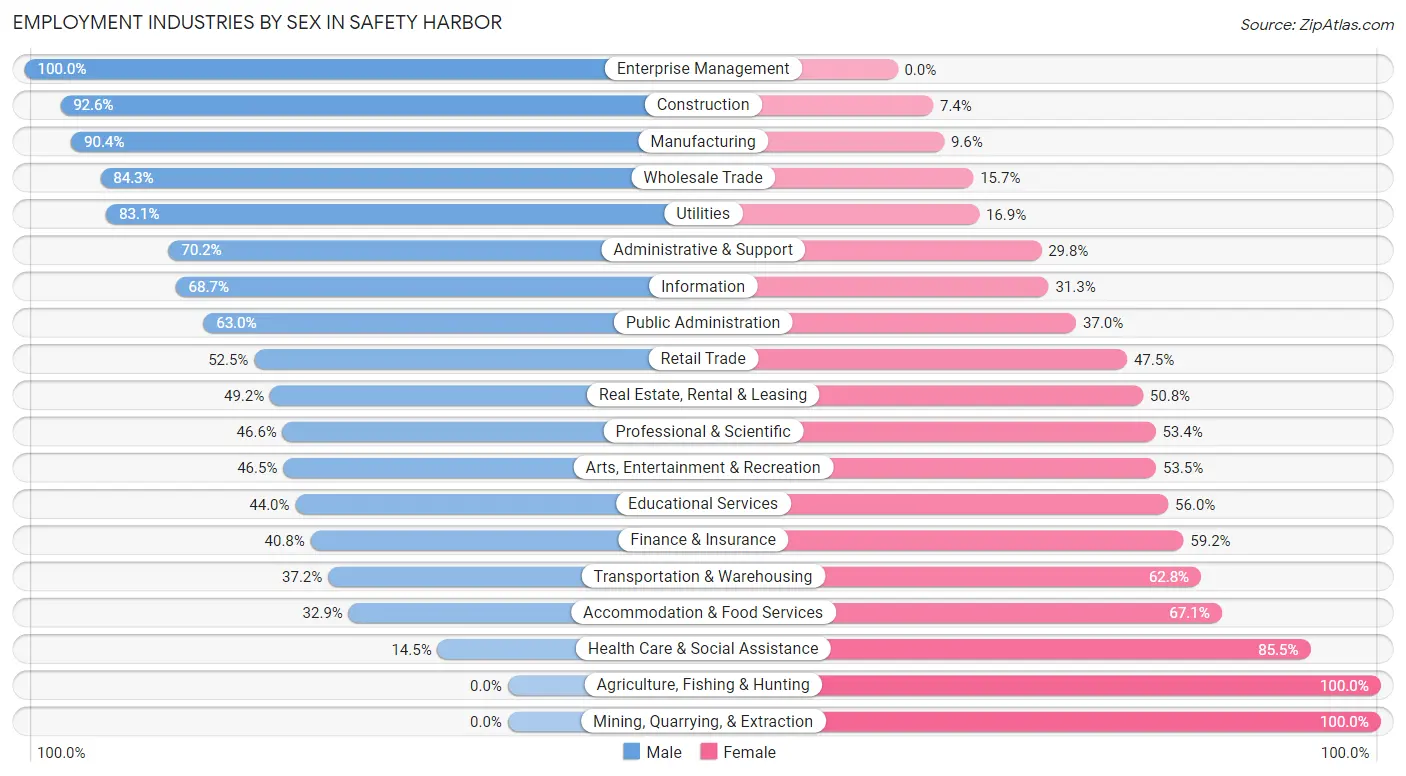
Employment Industries by Sex in Safety Harbor
The Safety Harbor industries that see more men than women are Enterprise Management (100.0%), Construction (92.6%), and Manufacturing (90.4%), whereas the industries that tend to have a higher number of women are Agriculture, Fishing & Hunting (100.0%), Mining, Quarrying, & Extraction (100.0%), and Health Care & Social Assistance (85.5%).
| Industry | Male | Female |
| Agriculture, Fishing & Hunting | 0 (0.0%) | 16 (100.0%) |
| Mining, Quarrying, & Extraction | 0 (0.0%) | 9 (100.0%) |
| Construction | 327 (92.6%) | 26 (7.4%) |
| Manufacturing | 488 (90.4%) | 52 (9.6%) |
| Wholesale Trade | 172 (84.3%) | 32 (15.7%) |
| Retail Trade | 370 (52.5%) | 335 (47.5%) |
| Transportation & Warehousing | 87 (37.2%) | 147 (62.8%) |
| Utilities | 133 (83.1%) | 27 (16.9%) |
| Information | 178 (68.7%) | 81 (31.3%) |
| Finance & Insurance | 410 (40.8%) | 595 (59.2%) |
| Real Estate, Rental & Leasing | 91 (49.2%) | 94 (50.8%) |
| Professional & Scientific | 477 (46.6%) | 547 (53.4%) |
| Enterprise Management | 15 (100.0%) | 0 (0.0%) |
| Administrative & Support | 262 (70.2%) | 111 (29.8%) |
| Educational Services | 280 (44.0%) | 357 (56.0%) |
| Health Care & Social Assistance | 194 (14.5%) | 1,140 (85.5%) |
| Arts, Entertainment & Recreation | 158 (46.5%) | 182 (53.5%) |
| Accommodation & Food Services | 159 (32.9%) | 324 (67.1%) |
| Public Administration | 201 (63.0%) | 118 (37.0%) |
| Total | 4,085 (48.3%) | 4,371 (51.7%) |
Education in Safety Harbor
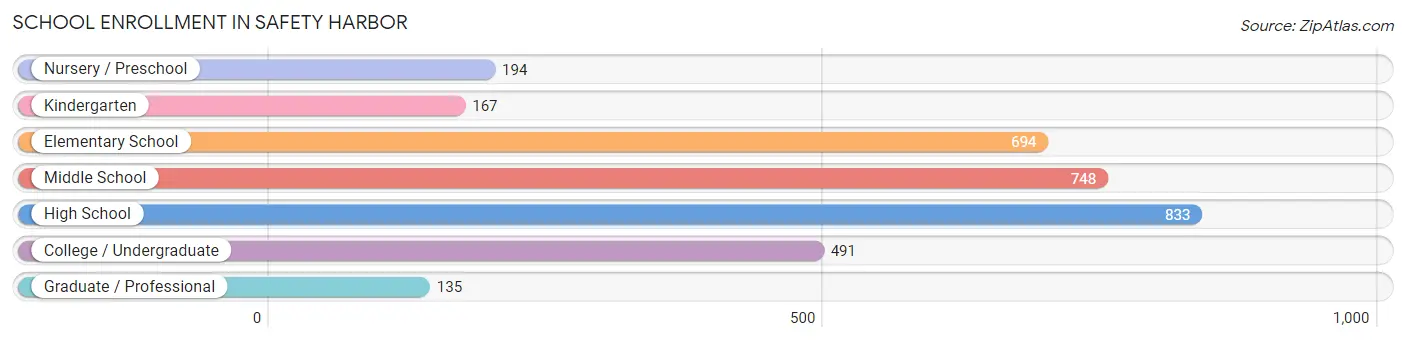
School Enrollment in Safety Harbor
The most common levels of schooling among the 3,262 students in Safety Harbor are high school (833 | 25.5%), middle school (748 | 22.9%), and elementary school (694 | 21.3%).
| School Level | # Students | % Students |
| Nursery / Preschool | 194 | 5.9% |
| Kindergarten | 167 | 5.1% |
| Elementary School | 694 | 21.3% |
| Middle School | 748 | 22.9% |
| High School | 833 | 25.5% |
| College / Undergraduate | 491 | 15.0% |
| Graduate / Professional | 135 | 4.1% |
| Total | 3,262 | 100.0% |
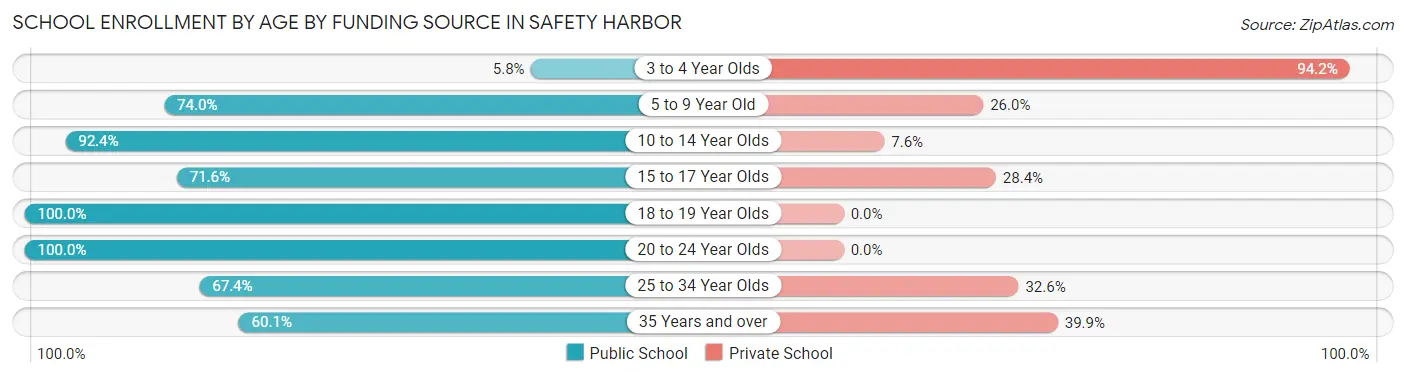
School Enrollment by Age by Funding Source in Safety Harbor
Out of a total of 3,262 students who are enrolled in schools in Safety Harbor, 727 (22.3%) attend a private institution, while the remaining 2,535 (77.7%) are enrolled in public schools. The age group of 3 to 4 year olds has the highest likelihood of being enrolled in private schools, with 163 (94.2% in the age bracket) enrolled. Conversely, the age group of 18 to 19 year olds has the lowest likelihood of being enrolled in a private school, with 142 (100.0% in the age bracket) attending a public institution.
| Age Bracket | Public School | Private School |
| 3 to 4 Year Olds | 10 (5.8%) | 163 (94.2%) |
| 5 to 9 Year Old | 595 (74.0%) | 209 (26.0%) |
| 10 to 14 Year Olds | 902 (92.4%) | 74 (7.6%) |
| 15 to 17 Year Olds | 480 (71.6%) | 190 (28.4%) |
| 18 to 19 Year Olds | 142 (100.0%) | 0 (0.0%) |
| 20 to 24 Year Olds | 248 (100.0%) | 0 (0.0%) |
| 25 to 34 Year Olds | 58 (67.4%) | 28 (32.6%) |
| 35 Years and over | 98 (60.1%) | 65 (39.9%) |
| Total | 2,535 (77.7%) | 727 (22.3%) |
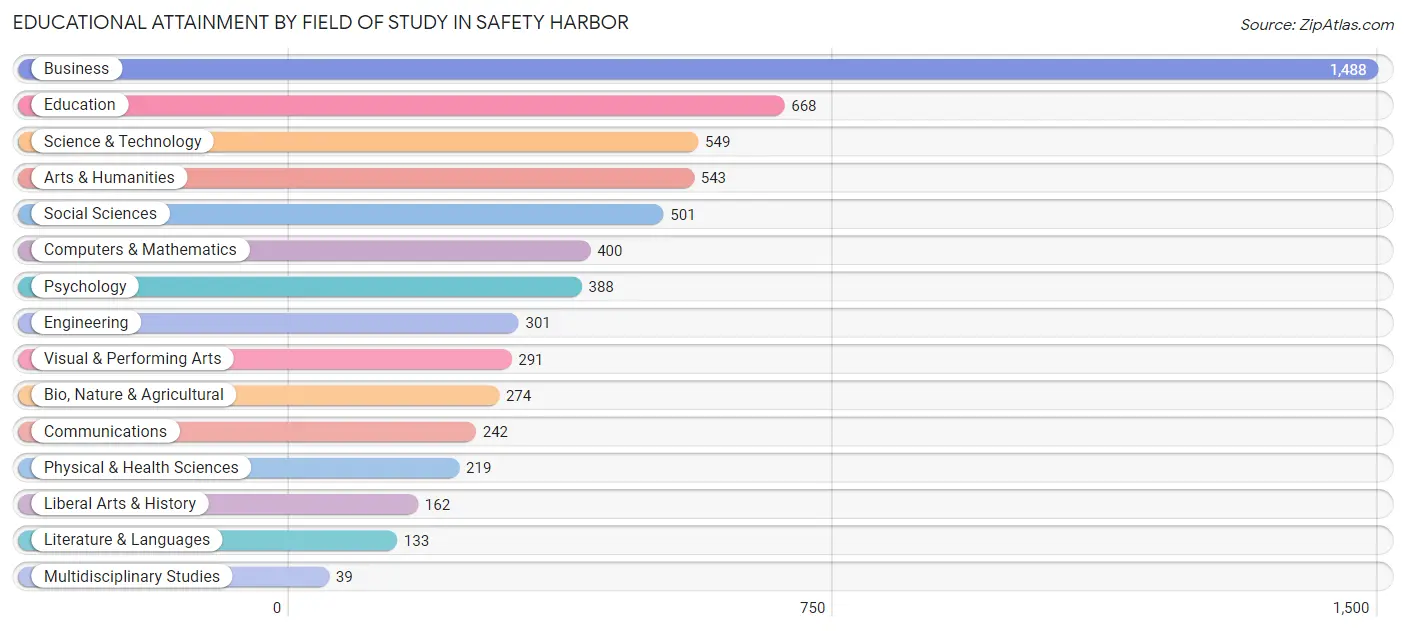
Educational Attainment by Field of Study in Safety Harbor
Business (1,488 | 24.0%), education (668 | 10.8%), science & technology (549 | 8.9%), arts & humanities (543 | 8.8%), and social sciences (501 | 8.1%) are the most common fields of study among 6,198 individuals in Safety Harbor who have obtained a bachelor's degree or higher.
| Field of Study | # Graduates | % Graduates |
| Computers & Mathematics | 400 | 6.5% |
| Bio, Nature & Agricultural | 274 | 4.4% |
| Physical & Health Sciences | 219 | 3.5% |
| Psychology | 388 | 6.3% |
| Social Sciences | 501 | 8.1% |
| Engineering | 301 | 4.9% |
| Multidisciplinary Studies | 39 | 0.6% |
| Science & Technology | 549 | 8.9% |
| Business | 1,488 | 24.0% |
| Education | 668 | 10.8% |
| Literature & Languages | 133 | 2.1% |
| Liberal Arts & History | 162 | 2.6% |
| Visual & Performing Arts | 291 | 4.7% |
| Communications | 242 | 3.9% |
| Arts & Humanities | 543 | 8.8% |
| Total | 6,198 | 100.0% |
Transportation & Commute in Safety Harbor
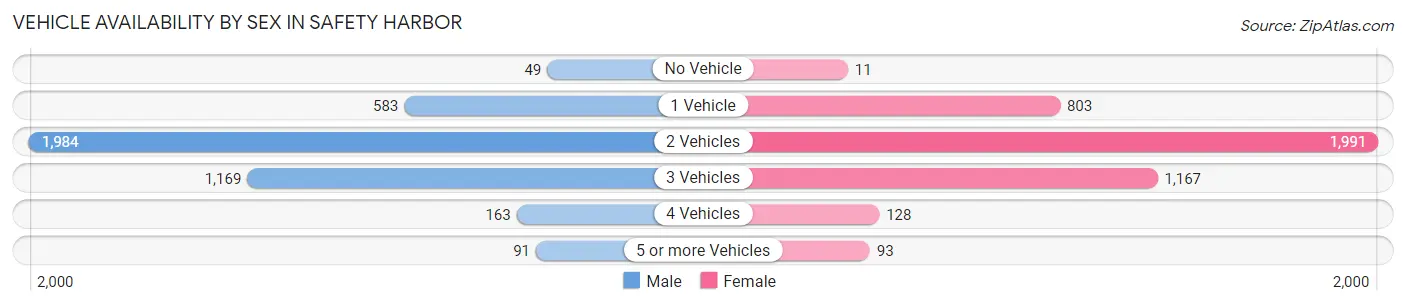
Vehicle Availability by Sex in Safety Harbor
The most prevalent vehicle ownership categories in Safety Harbor are males with 2 vehicles (1,984, accounting for 49.1%) and females with 2 vehicles (1,991, making up 47.3%).
| Vehicles Available | Male | Female |
| No Vehicle | 49 (1.2%) | 11 (0.3%) |
| 1 Vehicle | 583 (14.4%) | 803 (19.2%) |
| 2 Vehicles | 1,984 (49.1%) | 1,991 (47.5%) |
| 3 Vehicles | 1,169 (28.9%) | 1,167 (27.8%) |
| 4 Vehicles | 163 (4.0%) | 128 (3.0%) |
| 5 or more Vehicles | 91 (2.2%) | 93 (2.2%) |
| Total | 4,039 (100.0%) | 4,193 (100.0%) |
Commute Time in Safety Harbor
The most frequently occuring commute durations in Safety Harbor are 30 to 34 minutes (1,299 commuters, 19.6%), 15 to 19 minutes (1,133 commuters, 17.1%), and 10 to 14 minutes (902 commuters, 13.6%).
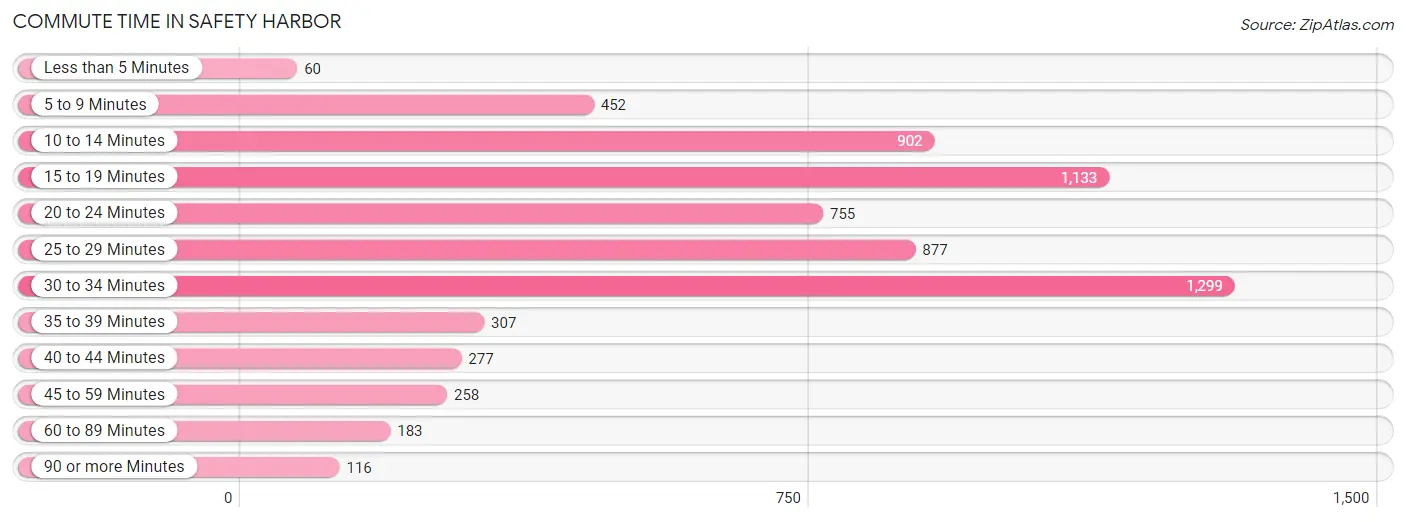
| Commute Time | # Commuters | % Commuters |
| Less than 5 Minutes | 60 | 0.9% |
| 5 to 9 Minutes | 452 | 6.8% |
| 10 to 14 Minutes | 902 | 13.6% |
| 15 to 19 Minutes | 1,133 | 17.1% |
| 20 to 24 Minutes | 755 | 11.4% |
| 25 to 29 Minutes | 877 | 13.3% |
| 30 to 34 Minutes | 1,299 | 19.6% |
| 35 to 39 Minutes | 307 | 4.6% |
| 40 to 44 Minutes | 277 | 4.2% |
| 45 to 59 Minutes | 258 | 3.9% |
| 60 to 89 Minutes | 183 | 2.8% |
| 90 or more Minutes | 116 | 1.8% |
Commute Time by Sex in Safety Harbor
The most common commute times in Safety Harbor are 30 to 34 minutes (649 commuters, 19.7%) for males and 15 to 19 minutes (711 commuters, 21.4%) for females.
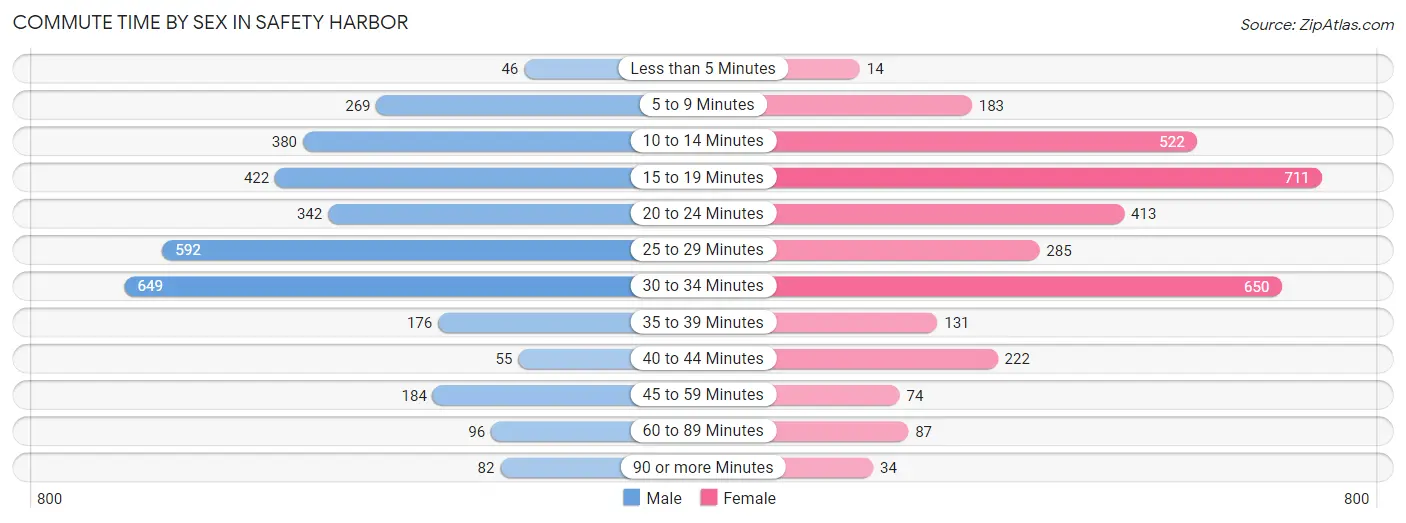
| Commute Time | Male | Female |
| Less than 5 Minutes | 46 (1.4%) | 14 (0.4%) |
| 5 to 9 Minutes | 269 (8.2%) | 183 (5.5%) |
| 10 to 14 Minutes | 380 (11.5%) | 522 (15.7%) |
| 15 to 19 Minutes | 422 (12.8%) | 711 (21.4%) |
| 20 to 24 Minutes | 342 (10.4%) | 413 (12.4%) |
| 25 to 29 Minutes | 592 (18.0%) | 285 (8.6%) |
| 30 to 34 Minutes | 649 (19.7%) | 650 (19.5%) |
| 35 to 39 Minutes | 176 (5.3%) | 131 (3.9%) |
| 40 to 44 Minutes | 55 (1.7%) | 222 (6.7%) |
| 45 to 59 Minutes | 184 (5.6%) | 74 (2.2%) |
| 60 to 89 Minutes | 96 (2.9%) | 87 (2.6%) |
| 90 or more Minutes | 82 (2.5%) | 34 (1.0%) |
Time of Departure to Work by Sex in Safety Harbor
The most frequent times of departure to work in Safety Harbor are 7:00 AM to 7:29 AM (540, 16.4%) for males and 7:30 AM to 7:59 AM (542, 16.3%) for females.
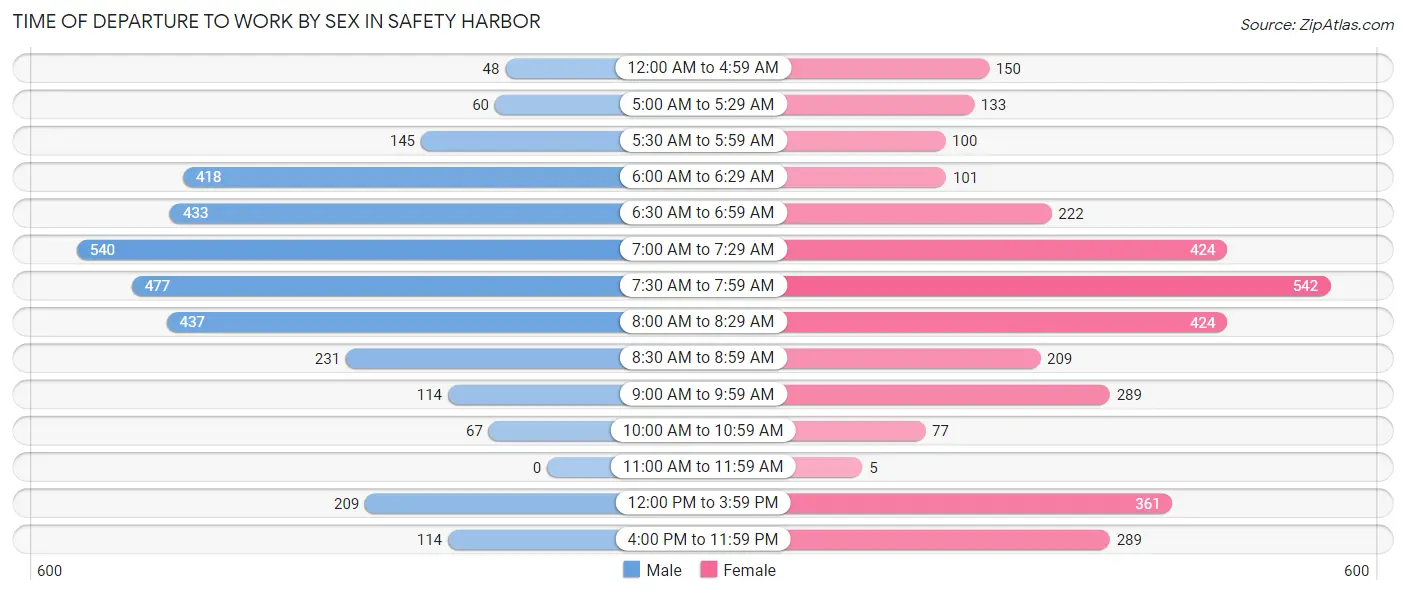
| Time of Departure | Male | Female |
| 12:00 AM to 4:59 AM | 48 (1.5%) | 150 (4.5%) |
| 5:00 AM to 5:29 AM | 60 (1.8%) | 133 (4.0%) |
| 5:30 AM to 5:59 AM | 145 (4.4%) | 100 (3.0%) |
| 6:00 AM to 6:29 AM | 418 (12.7%) | 101 (3.0%) |
| 6:30 AM to 6:59 AM | 433 (13.2%) | 222 (6.7%) |
| 7:00 AM to 7:29 AM | 540 (16.4%) | 424 (12.8%) |
| 7:30 AM to 7:59 AM | 477 (14.5%) | 542 (16.3%) |
| 8:00 AM to 8:29 AM | 437 (13.3%) | 424 (12.8%) |
| 8:30 AM to 8:59 AM | 231 (7.0%) | 209 (6.3%) |
| 9:00 AM to 9:59 AM | 114 (3.5%) | 289 (8.7%) |
| 10:00 AM to 10:59 AM | 67 (2.0%) | 77 (2.3%) |
| 11:00 AM to 11:59 AM | 0 (0.0%) | 5 (0.2%) |
| 12:00 PM to 3:59 PM | 209 (6.4%) | 361 (10.8%) |
| 4:00 PM to 11:59 PM | 114 (3.5%) | 289 (8.7%) |
| Total | 3,293 (100.0%) | 3,326 (100.0%) |
Housing Occupancy in Safety Harbor
Occupancy by Ownership in Safety Harbor
Of the total 6,789 dwellings in Safety Harbor, owner-occupied units account for 5,575 (82.1%), while renter-occupied units make up 1,214 (17.9%).
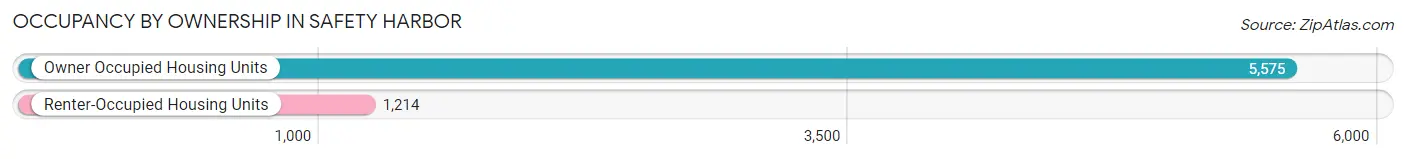
| Occupancy | # Housing Units | % Housing Units |
| Owner Occupied Housing Units | 5,575 | 82.1% |
| Renter-Occupied Housing Units | 1,214 | 17.9% |
| Total Occupied Housing Units | 6,789 | 100.0% |
Occupancy by Household Size in Safety Harbor
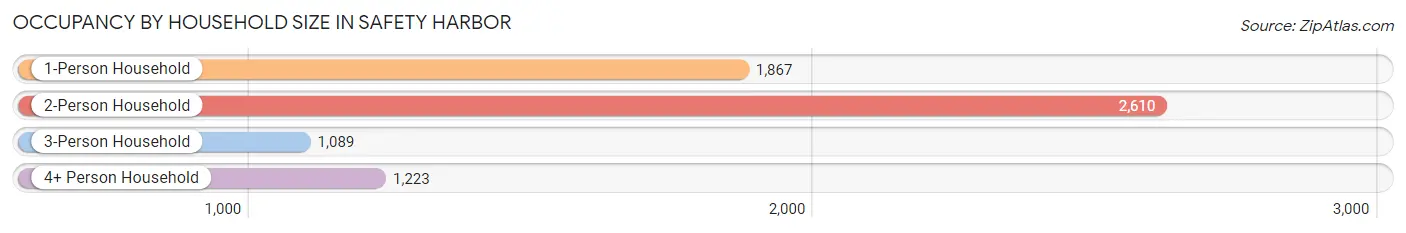
| Household Size | # Housing Units | % Housing Units |
| 1-Person Household | 1,867 | 27.5% |
| 2-Person Household | 2,610 | 38.4% |
| 3-Person Household | 1,089 | 16.0% |
| 4+ Person Household | 1,223 | 18.0% |
| Total Housing Units | 6,789 | 100.0% |
Occupancy by Ownership by Household Size in Safety Harbor
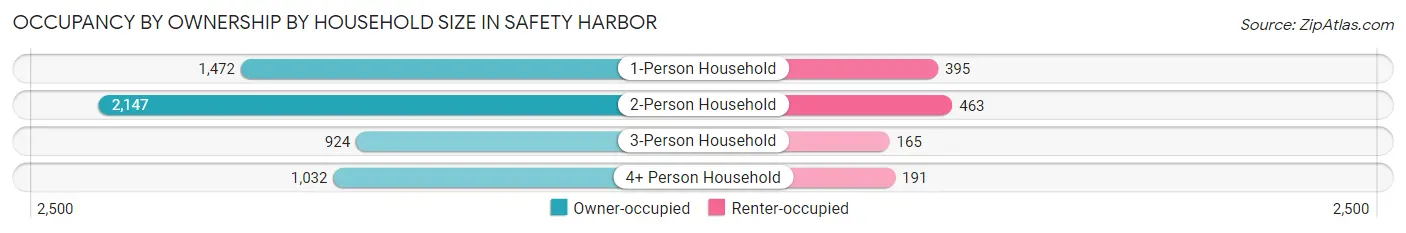
| Household Size | Owner-occupied | Renter-occupied |
| 1-Person Household | 1,472 (78.8%) | 395 (21.2%) |
| 2-Person Household | 2,147 (82.3%) | 463 (17.7%) |
| 3-Person Household | 924 (84.9%) | 165 (15.1%) |
| 4+ Person Household | 1,032 (84.4%) | 191 (15.6%) |
| Total Housing Units | 5,575 (82.1%) | 1,214 (17.9%) |
Occupancy by Educational Attainment in Safety Harbor
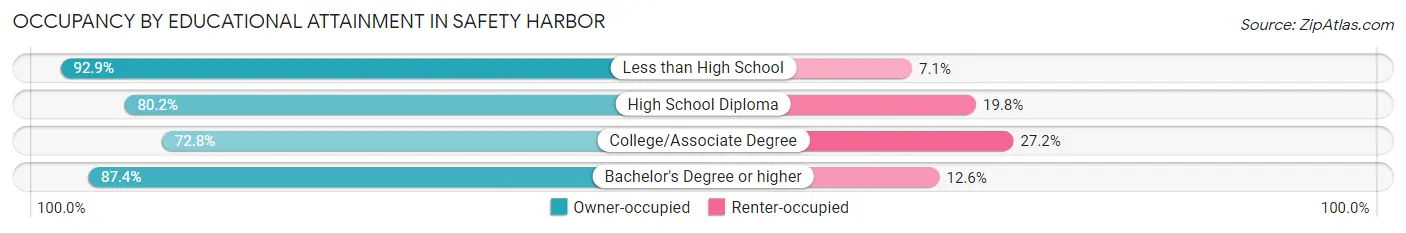
| Household Size | Owner-occupied | Renter-occupied |
| Less than High School | 117 (92.9%) | 9 (7.1%) |
| High School Diploma | 1,097 (80.2%) | 271 (19.8%) |
| College/Associate Degree | 1,331 (72.8%) | 498 (27.2%) |
| Bachelor's Degree or higher | 3,030 (87.4%) | 436 (12.6%) |
Occupancy by Age of Householder in Safety Harbor
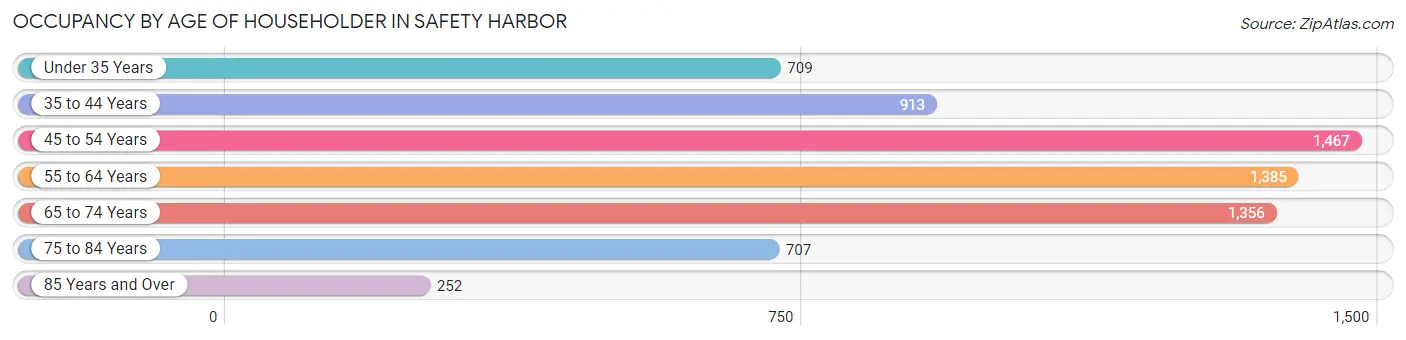
| Age Bracket | # Households | % Households |
| Under 35 Years | 709 | 10.4% |
| 35 to 44 Years | 913 | 13.5% |
| 45 to 54 Years | 1,467 | 21.6% |
| 55 to 64 Years | 1,385 | 20.4% |
| 65 to 74 Years | 1,356 | 20.0% |
| 75 to 84 Years | 707 | 10.4% |
| 85 Years and Over | 252 | 3.7% |
| Total | 6,789 | 100.0% |
Housing Finances in Safety Harbor
Median Income by Occupancy in Safety Harbor
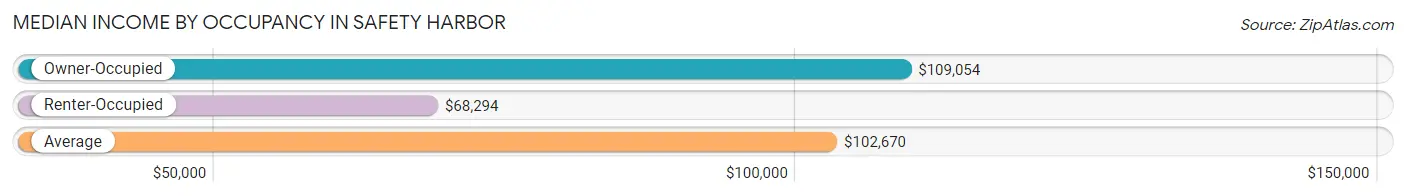
| Occupancy Type | # Households | Median Income |
| Owner-Occupied | 5,575 (82.1%) | $109,054 |
| Renter-Occupied | 1,214 (17.9%) | $68,294 |
| Average | 6,789 (100.0%) | $102,670 |
Occupancy by Householder Income Bracket in Safety Harbor
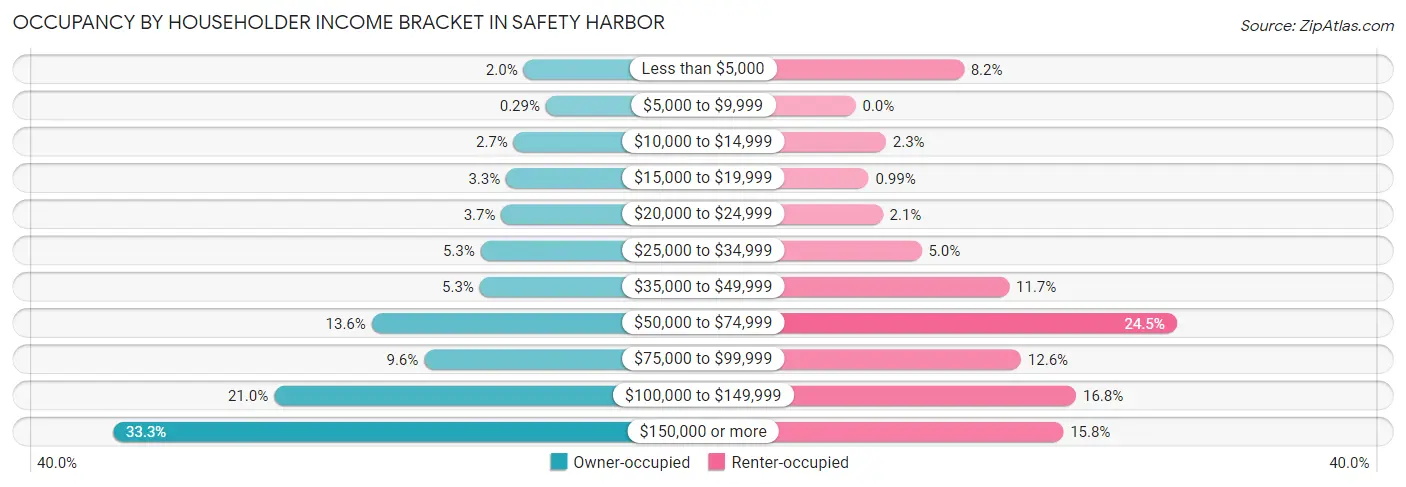
| Income Bracket | Owner-occupied | Renter-occupied |
| Less than $5,000 | 111 (2.0%) | 100 (8.2%) |
| $5,000 to $9,999 | 16 (0.3%) | 0 (0.0%) |
| $10,000 to $14,999 | 153 (2.7%) | 28 (2.3%) |
| $15,000 to $19,999 | 185 (3.3%) | 12 (1.0%) |
| $20,000 to $24,999 | 205 (3.7%) | 25 (2.1%) |
| $25,000 to $34,999 | 293 (5.3%) | 61 (5.0%) |
| $35,000 to $49,999 | 297 (5.3%) | 142 (11.7%) |
| $50,000 to $74,999 | 756 (13.6%) | 297 (24.5%) |
| $75,000 to $99,999 | 533 (9.6%) | 153 (12.6%) |
| $100,000 to $149,999 | 1,171 (21.0%) | 204 (16.8%) |
| $150,000 or more | 1,855 (33.3%) | 192 (15.8%) |
| Total | 5,575 (100.0%) | 1,214 (100.0%) |
Monthly Housing Cost Tiers in Safety Harbor
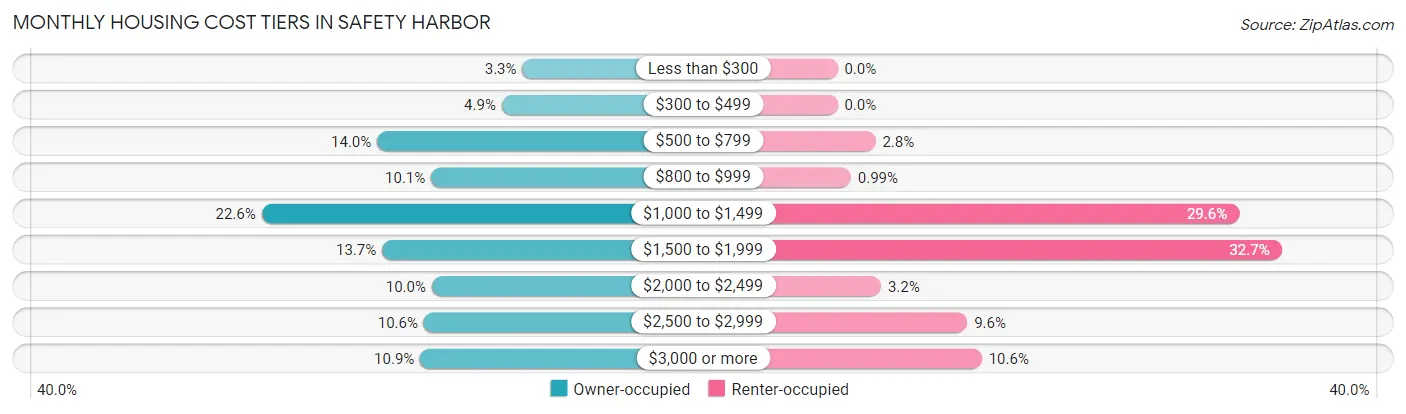
| Monthly Cost | Owner-occupied | Renter-occupied |
| Less than $300 | 186 (3.3%) | 0 (0.0%) |
| $300 to $499 | 271 (4.9%) | 0 (0.0%) |
| $500 to $799 | 783 (14.0%) | 34 (2.8%) |
| $800 to $999 | 561 (10.1%) | 12 (1.0%) |
| $1,000 to $1,499 | 1,257 (22.6%) | 359 (29.6%) |
| $1,500 to $1,999 | 762 (13.7%) | 397 (32.7%) |
| $2,000 to $2,499 | 558 (10.0%) | 39 (3.2%) |
| $2,500 to $2,999 | 591 (10.6%) | 116 (9.6%) |
| $3,000 or more | 606 (10.9%) | 129 (10.6%) |
| Total | 5,575 (100.0%) | 1,214 (100.0%) |
Physical Housing Characteristics in Safety Harbor
Housing Structures in Safety Harbor
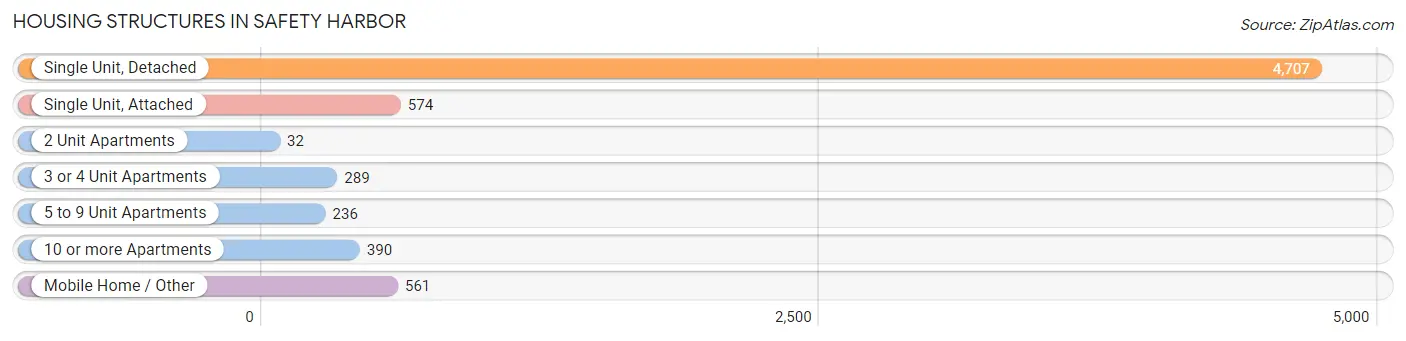
| Structure Type | # Housing Units | % Housing Units |
| Single Unit, Detached | 4,707 | 69.3% |
| Single Unit, Attached | 574 | 8.5% |
| 2 Unit Apartments | 32 | 0.5% |
| 3 or 4 Unit Apartments | 289 | 4.3% |
| 5 to 9 Unit Apartments | 236 | 3.5% |
| 10 or more Apartments | 390 | 5.7% |
| Mobile Home / Other | 561 | 8.3% |
| Total | 6,789 | 100.0% |
Housing Structures by Occupancy in Safety Harbor
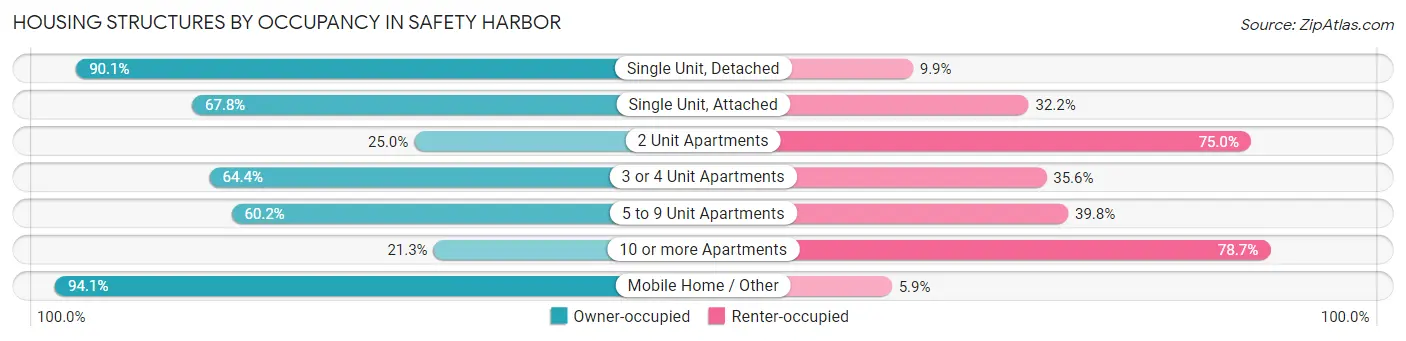
| Structure Type | Owner-occupied | Renter-occupied |
| Single Unit, Detached | 4,239 (90.1%) | 468 (9.9%) |
| Single Unit, Attached | 389 (67.8%) | 185 (32.2%) |
| 2 Unit Apartments | 8 (25.0%) | 24 (75.0%) |
| 3 or 4 Unit Apartments | 186 (64.4%) | 103 (35.6%) |
| 5 to 9 Unit Apartments | 142 (60.2%) | 94 (39.8%) |
| 10 or more Apartments | 83 (21.3%) | 307 (78.7%) |
| Mobile Home / Other | 528 (94.1%) | 33 (5.9%) |
| Total | 5,575 (82.1%) | 1,214 (17.9%) |
Housing Structures by Number of Rooms in Safety Harbor
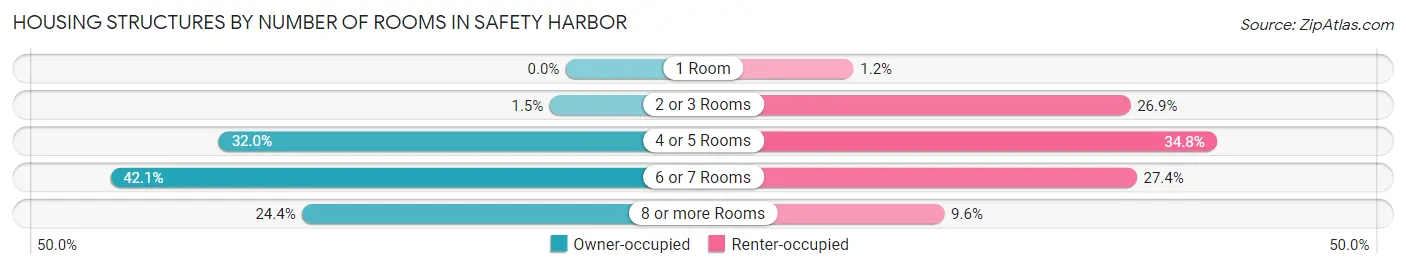
| Number of Rooms | Owner-occupied | Renter-occupied |
| 1 Room | 0 (0.0%) | 15 (1.2%) |
| 2 or 3 Rooms | 83 (1.5%) | 326 (26.9%) |
| 4 or 5 Rooms | 1,786 (32.0%) | 423 (34.8%) |
| 6 or 7 Rooms | 2,346 (42.1%) | 333 (27.4%) |
| 8 or more Rooms | 1,360 (24.4%) | 117 (9.6%) |
| Total | 5,575 (100.0%) | 1,214 (100.0%) |
Housing Structure by Heating Type in Safety Harbor
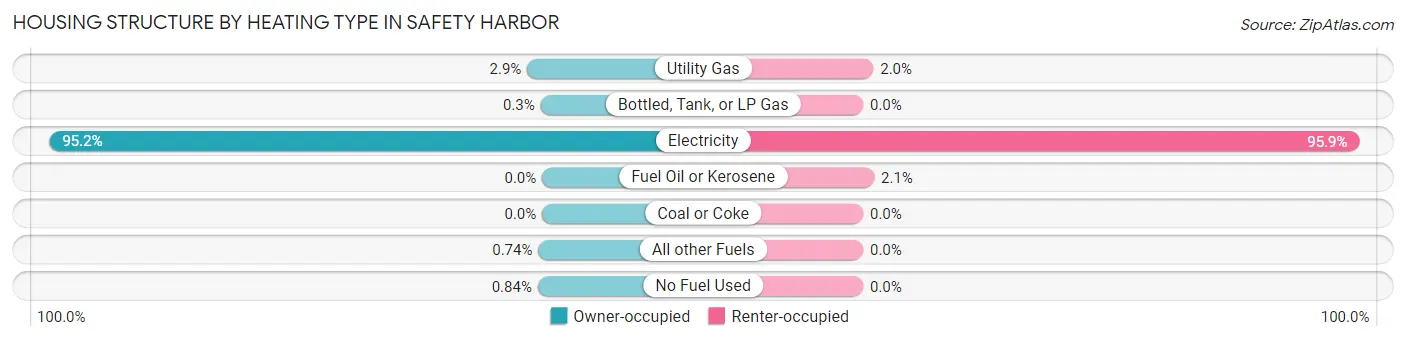
| Heating Type | Owner-occupied | Renter-occupied |
| Utility Gas | 161 (2.9%) | 24 (2.0%) |
| Bottled, Tank, or LP Gas | 17 (0.3%) | 0 (0.0%) |
| Electricity | 5,309 (95.2%) | 1,164 (95.9%) |
| Fuel Oil or Kerosene | 0 (0.0%) | 26 (2.1%) |
| Coal or Coke | 0 (0.0%) | 0 (0.0%) |
| All other Fuels | 41 (0.7%) | 0 (0.0%) |
| No Fuel Used | 47 (0.8%) | 0 (0.0%) |
| Total | 5,575 (100.0%) | 1,214 (100.0%) |
Household Vehicle Usage in Safety Harbor
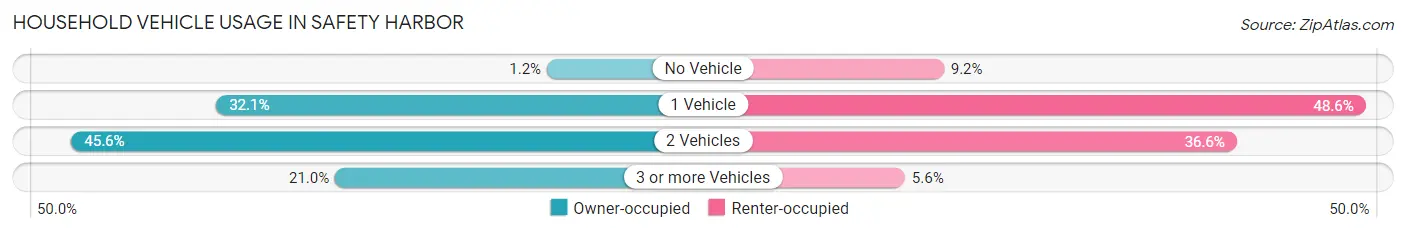
| Vehicles per Household | Owner-occupied | Renter-occupied |
| No Vehicle | 69 (1.2%) | 112 (9.2%) |
| 1 Vehicle | 1,790 (32.1%) | 590 (48.6%) |
| 2 Vehicles | 2,544 (45.6%) | 444 (36.6%) |
| 3 or more Vehicles | 1,172 (21.0%) | 68 (5.6%) |
| Total | 5,575 (100.0%) | 1,214 (100.0%) |
Real Estate & Mortgages in Safety Harbor
Real Estate and Mortgage Overview in Safety Harbor
| Characteristic | Without Mortgage | With Mortgage |
| Housing Units | 2,195 | 3,380 |
| Median Property Value | $315,000 | $380,800 |
| Median Household Income | $90,503 | $1,427 |
| Monthly Housing Costs | $777 | $586 |
| Real Estate Taxes | $2,290 | $38 |
Property Value by Mortgage Status in Safety Harbor
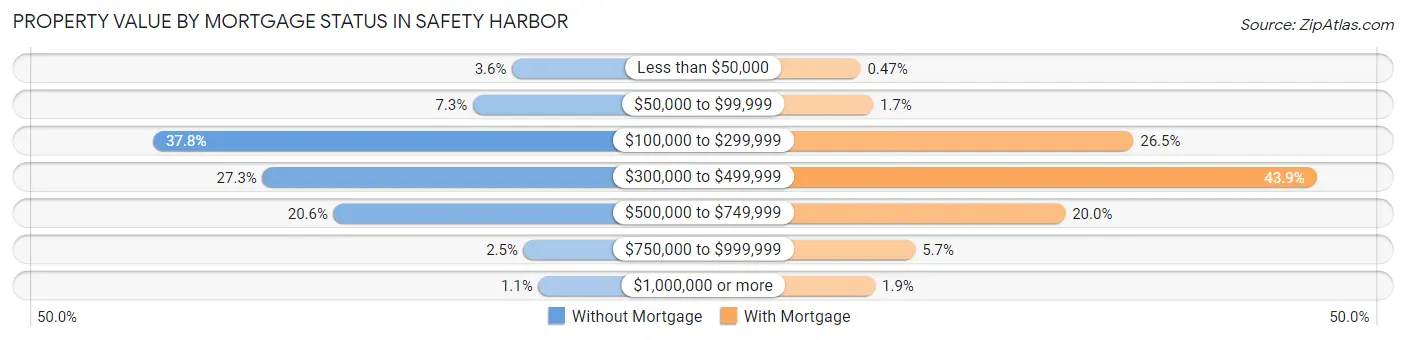
| Property Value | Without Mortgage | With Mortgage |
| Less than $50,000 | 78 (3.5%) | 16 (0.5%) |
| $50,000 to $99,999 | 160 (7.3%) | 56 (1.7%) |
| $100,000 to $299,999 | 829 (37.8%) | 894 (26.5%) |
| $300,000 to $499,999 | 600 (27.3%) | 1,484 (43.9%) |
| $500,000 to $749,999 | 451 (20.5%) | 675 (20.0%) |
| $750,000 to $999,999 | 54 (2.5%) | 192 (5.7%) |
| $1,000,000 or more | 23 (1.1%) | 63 (1.9%) |
| Total | 2,195 (100.0%) | 3,380 (100.0%) |
Household Income by Mortgage Status in Safety Harbor
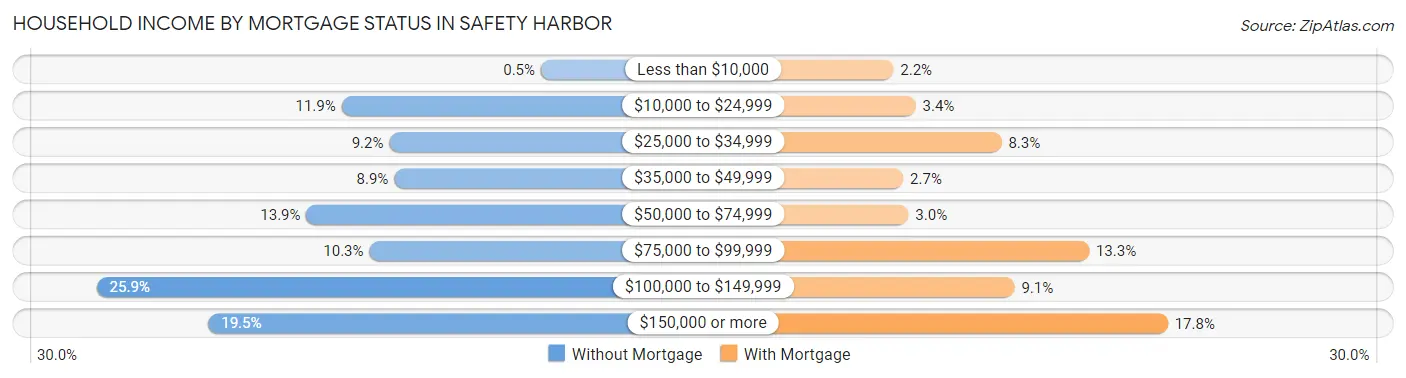
| Household Income | Without Mortgage | With Mortgage |
| Less than $10,000 | 11 (0.5%) | 73 (2.2%) |
| $10,000 to $24,999 | 261 (11.9%) | 116 (3.4%) |
| $25,000 to $34,999 | 201 (9.2%) | 282 (8.3%) |
| $35,000 to $49,999 | 195 (8.9%) | 92 (2.7%) |
| $50,000 to $74,999 | 305 (13.9%) | 102 (3.0%) |
| $75,000 to $99,999 | 226 (10.3%) | 451 (13.3%) |
| $100,000 to $149,999 | 568 (25.9%) | 307 (9.1%) |
| $150,000 or more | 428 (19.5%) | 603 (17.8%) |
| Total | 2,195 (100.0%) | 3,380 (100.0%) |
Property Value to Household Income Ratio in Safety Harbor
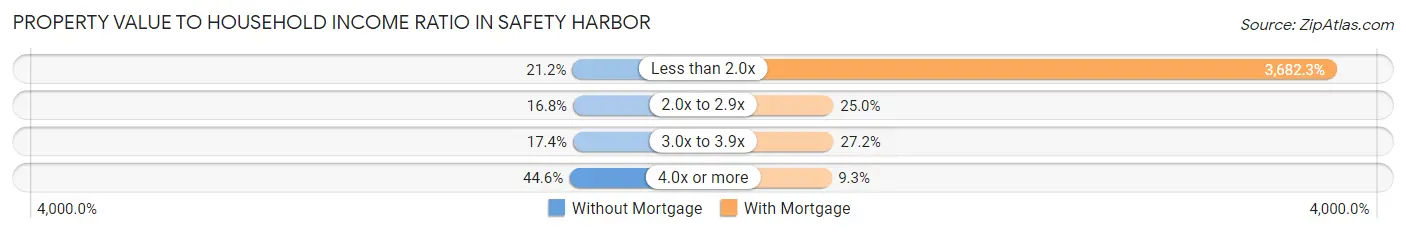
| Value-to-Income Ratio | Without Mortgage | With Mortgage |
| Less than 2.0x | 466 (21.2%) | 124,461 (3,682.3%) |
| 2.0x to 2.9x | 369 (16.8%) | 845 (25.0%) |
| 3.0x to 3.9x | 382 (17.4%) | 918 (27.2%) |
| 4.0x or more | 978 (44.6%) | 315 (9.3%) |
| Total | 2,195 (100.0%) | 3,380 (100.0%) |
Real Estate Taxes by Mortgage Status in Safety Harbor
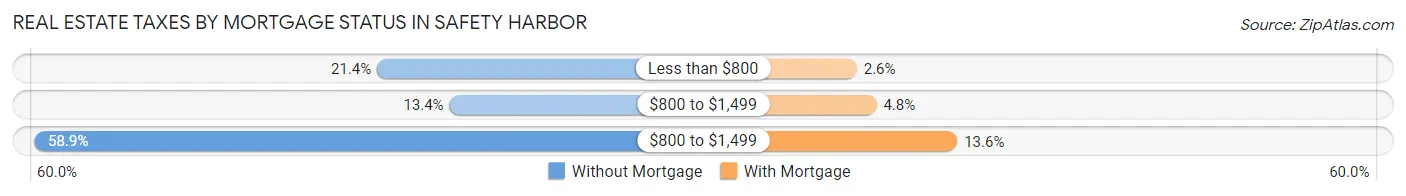
| Property Taxes | Without Mortgage | With Mortgage |
| Less than $800 | 469 (21.4%) | 88 (2.6%) |
| $800 to $1,499 | 295 (13.4%) | 161 (4.8%) |
| $800 to $1,499 | 1,292 (58.9%) | 460 (13.6%) |
| Total | 2,195 (100.0%) | 3,380 (100.0%) |
Health & Disability in Safety Harbor
Health Insurance Coverage by Age in Safety Harbor
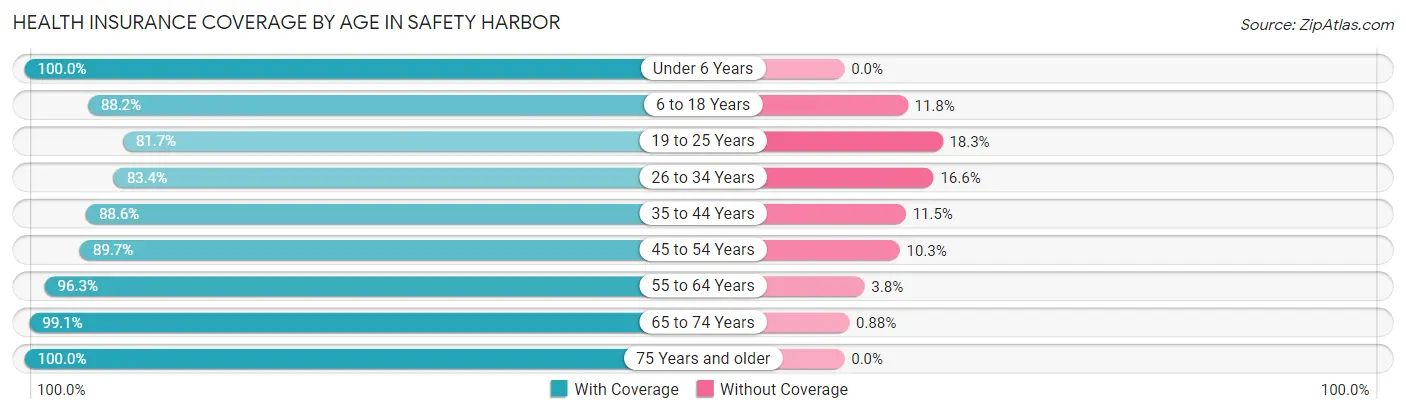
| Age Bracket | With Coverage | Without Coverage |
| Under 6 Years | 1,083 (100.0%) | 0 (0.0%) |
| 6 to 18 Years | 2,145 (88.2%) | 287 (11.8%) |
| 19 to 25 Years | 741 (81.7%) | 166 (18.3%) |
| 26 to 34 Years | 1,298 (83.4%) | 259 (16.6%) |
| 35 to 44 Years | 1,810 (88.5%) | 234 (11.5%) |
| 45 to 54 Years | 2,400 (89.7%) | 276 (10.3%) |
| 55 to 64 Years | 2,333 (96.3%) | 91 (3.7%) |
| 65 to 74 Years | 2,146 (99.1%) | 19 (0.9%) |
| 75 Years and older | 1,597 (100.0%) | 0 (0.0%) |
| Total | 15,553 (92.1%) | 1,332 (7.9%) |
Health Insurance Coverage by Citizenship Status in Safety Harbor
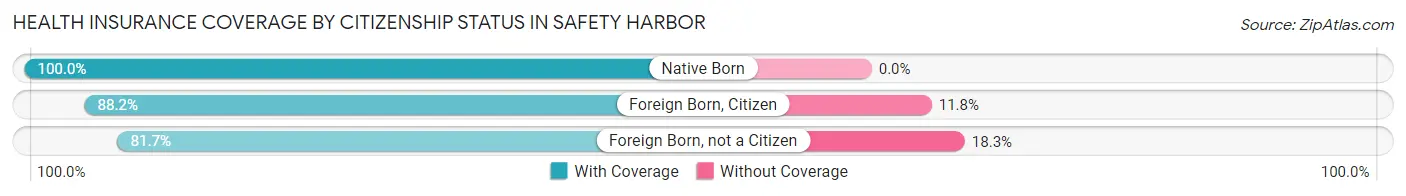
| Citizenship Status | With Coverage | Without Coverage |
| Native Born | 1,083 (100.0%) | 0 (0.0%) |
| Foreign Born, Citizen | 2,145 (88.2%) | 287 (11.8%) |
| Foreign Born, not a Citizen | 741 (81.7%) | 166 (18.3%) |
Health Insurance Coverage by Household Income in Safety Harbor
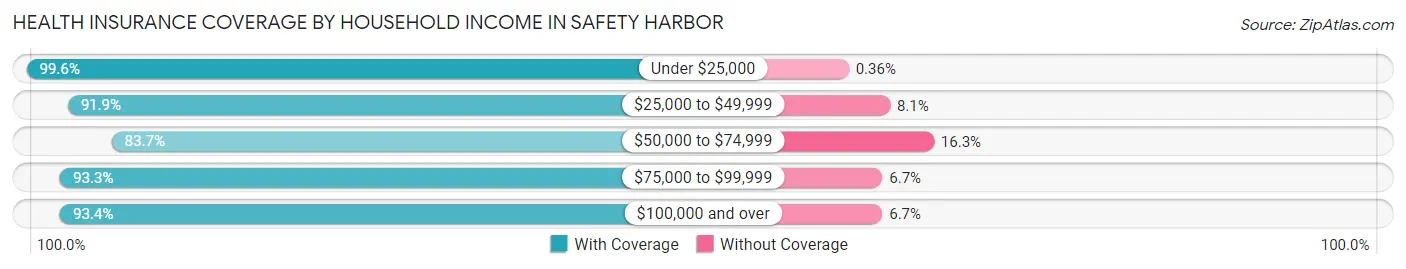
| Household Income | With Coverage | Without Coverage |
| Under $25,000 | 1,097 (99.6%) | 4 (0.4%) |
| $25,000 to $49,999 | 1,512 (91.9%) | 133 (8.1%) |
| $50,000 to $74,999 | 2,185 (83.7%) | 426 (16.3%) |
| $75,000 to $99,999 | 1,500 (93.3%) | 107 (6.7%) |
| $100,000 and over | 9,230 (93.3%) | 657 (6.7%) |
Public vs Private Health Insurance Coverage by Age in Safety Harbor
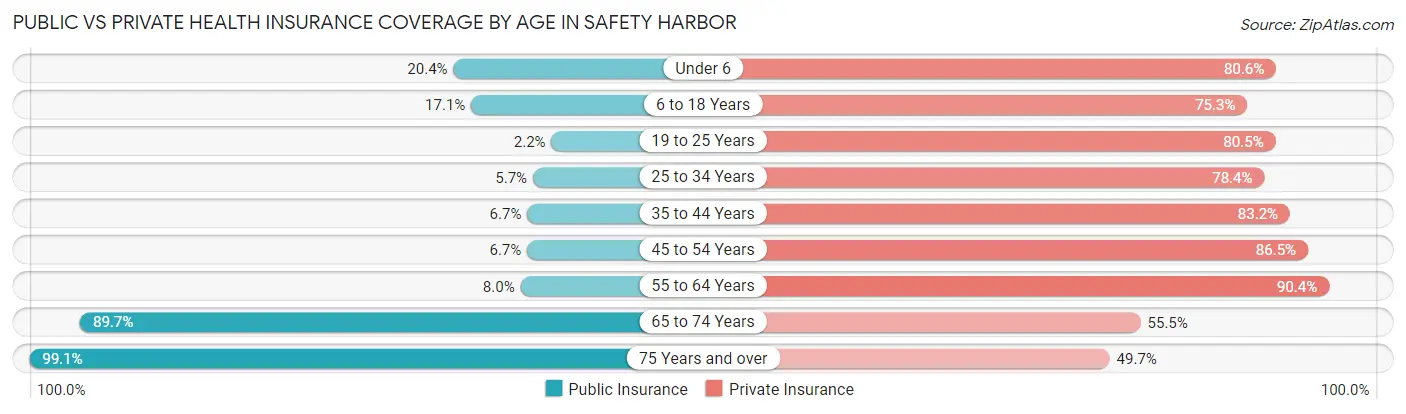
| Age Bracket | Public Insurance | Private Insurance |
| Under 6 | 221 (20.4%) | 873 (80.6%) |
| 6 to 18 Years | 416 (17.1%) | 1,830 (75.2%) |
| 19 to 25 Years | 20 (2.2%) | 730 (80.5%) |
| 25 to 34 Years | 88 (5.7%) | 1,221 (78.4%) |
| 35 to 44 Years | 137 (6.7%) | 1,700 (83.2%) |
| 45 to 54 Years | 180 (6.7%) | 2,315 (86.5%) |
| 55 to 64 Years | 193 (8.0%) | 2,192 (90.4%) |
| 65 to 74 Years | 1,942 (89.7%) | 1,201 (55.5%) |
| 75 Years and over | 1,583 (99.1%) | 794 (49.7%) |
| Total | 4,780 (28.3%) | 12,856 (76.1%) |
Disability Status by Sex by Age in Safety Harbor
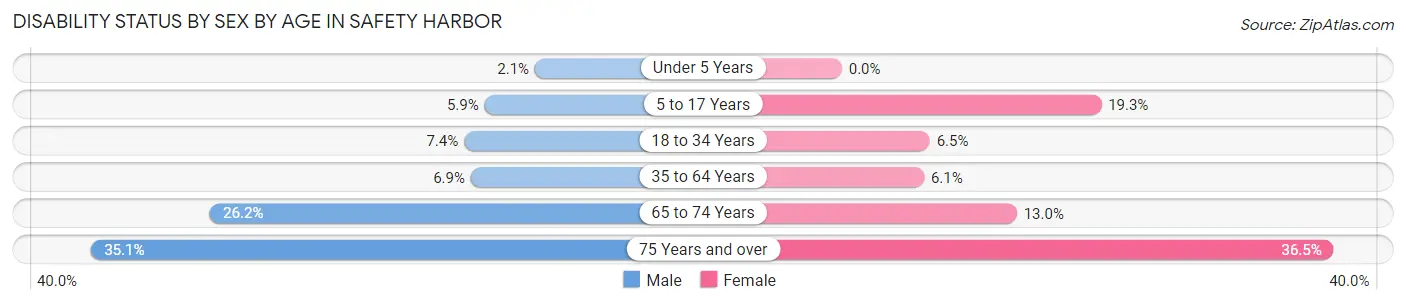
| Age Bracket | Male | Female |
| Under 5 Years | 12 (2.1%) | 0 (0.0%) |
| 5 to 17 Years | 70 (5.9%) | 239 (19.3%) |
| 18 to 34 Years | 84 (7.4%) | 90 (6.5%) |
| 35 to 64 Years | 234 (6.9%) | 228 (6.1%) |
| 65 to 74 Years | 279 (26.2%) | 143 (13.0%) |
| 75 Years and over | 218 (35.0%) | 356 (36.5%) |
Disability Class by Sex by Age in Safety Harbor
Disability Class: Hearing Difficulty
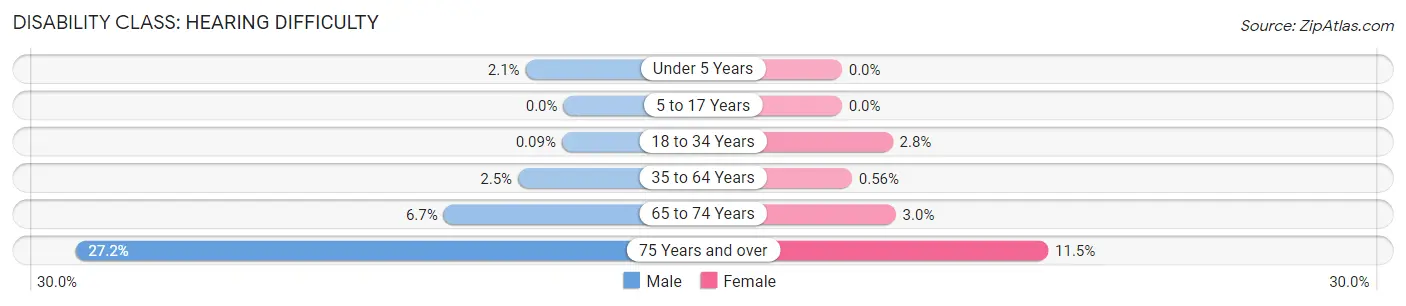
| Age Bracket | Male | Female |
| Under 5 Years | 12 (2.1%) | 0 (0.0%) |
| 5 to 17 Years | 0 (0.0%) | 0 (0.0%) |
| 18 to 34 Years | 1 (0.1%) | 39 (2.8%) |
| 35 to 64 Years | 86 (2.5%) | 21 (0.6%) |
| 65 to 74 Years | 71 (6.7%) | 33 (3.0%) |
| 75 Years and over | 169 (27.2%) | 112 (11.5%) |
Disability Class: Vision Difficulty
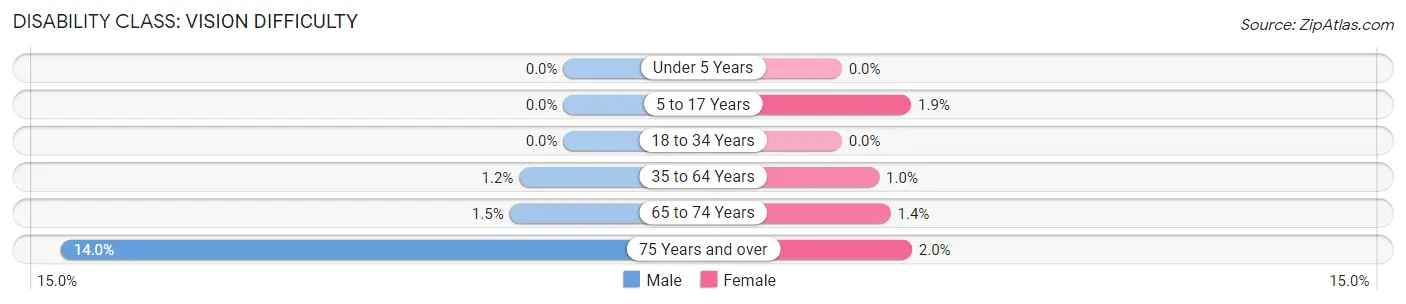
| Age Bracket | Male | Female |
| Under 5 Years | 0 (0.0%) | 0 (0.0%) |
| 5 to 17 Years | 0 (0.0%) | 24 (1.9%) |
| 18 to 34 Years | 0 (0.0%) | 0 (0.0%) |
| 35 to 64 Years | 42 (1.2%) | 39 (1.0%) |
| 65 to 74 Years | 16 (1.5%) | 15 (1.4%) |
| 75 Years and over | 87 (14.0%) | 19 (1.9%) |
Disability Class: Cognitive Difficulty
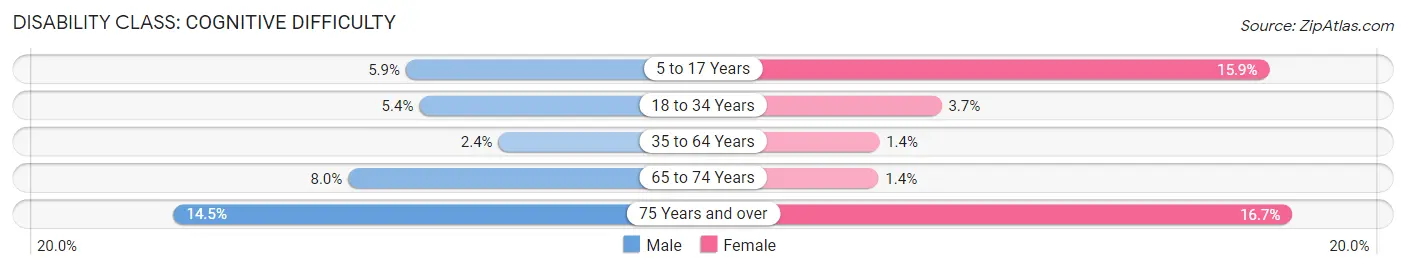
| Age Bracket | Male | Female |
| 5 to 17 Years | 70 (5.9%) | 197 (15.9%) |
| 18 to 34 Years | 61 (5.3%) | 51 (3.7%) |
| 35 to 64 Years | 82 (2.4%) | 52 (1.4%) |
| 65 to 74 Years | 85 (8.0%) | 15 (1.4%) |
| 75 Years and over | 90 (14.5%) | 163 (16.7%) |
Disability Class: Ambulatory Difficulty
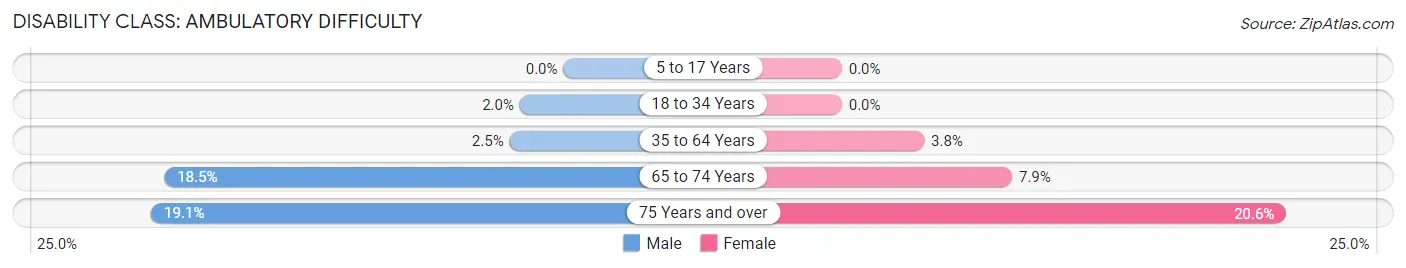
| Age Bracket | Male | Female |
| 5 to 17 Years | 0 (0.0%) | 0 (0.0%) |
| 18 to 34 Years | 23 (2.0%) | 0 (0.0%) |
| 35 to 64 Years | 85 (2.5%) | 143 (3.8%) |
| 65 to 74 Years | 197 (18.5%) | 87 (7.9%) |
| 75 Years and over | 119 (19.1%) | 201 (20.6%) |
Disability Class: Self-Care Difficulty
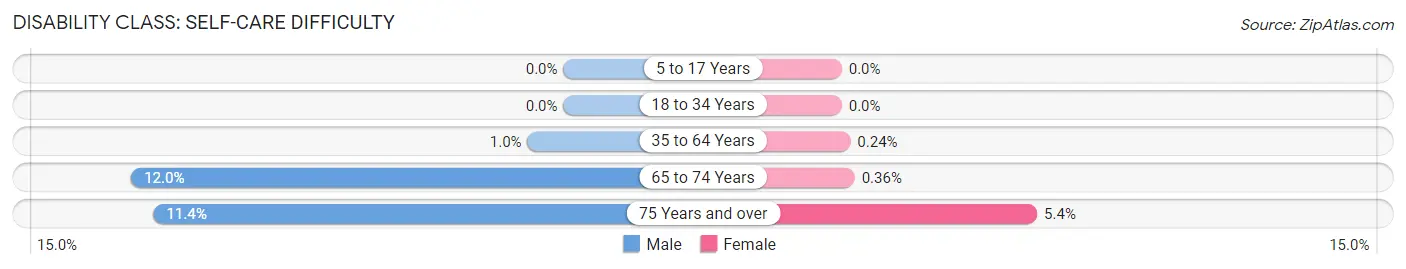
| Age Bracket | Male | Female |
| 5 to 17 Years | 0 (0.0%) | 0 (0.0%) |
| 18 to 34 Years | 0 (0.0%) | 0 (0.0%) |
| 35 to 64 Years | 34 (1.0%) | 9 (0.2%) |
| 65 to 74 Years | 128 (12.0%) | 4 (0.4%) |
| 75 Years and over | 71 (11.4%) | 53 (5.4%) |
Technology Access in Safety Harbor
Computing Device Access in Safety Harbor
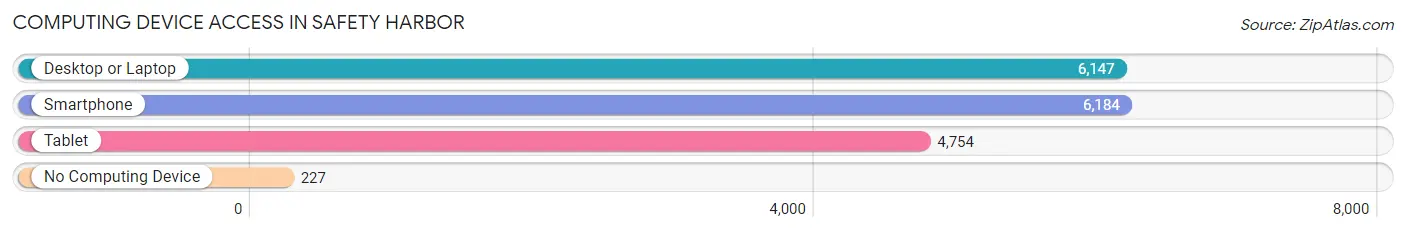
| Device Type | # Households | % Households |
| Desktop or Laptop | 6,147 | 90.5% |
| Smartphone | 6,184 | 91.1% |
| Tablet | 4,754 | 70.0% |
| No Computing Device | 227 | 3.3% |
| Total | 6,789 | 100.0% |
Internet Access in Safety Harbor
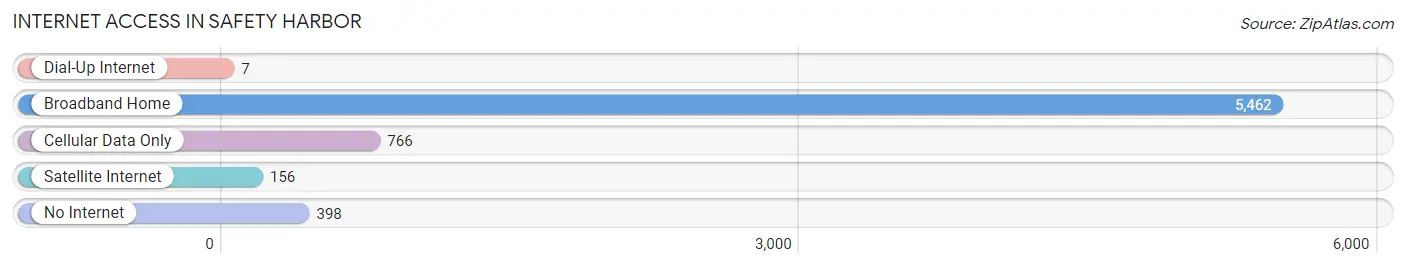
| Internet Type | # Households | % Households |
| Dial-Up Internet | 7 | 0.1% |
| Broadband Home | 5,462 | 80.4% |
| Cellular Data Only | 766 | 11.3% |
| Satellite Internet | 156 | 2.3% |
| No Internet | 398 | 5.9% |
| Total | 6,789 | 100.0% |
Safety Harbor Summary
History
The city of Safety Harbor is located in Pinellas County, Florida, and is part of the Tampa Bay Area. The city was first settled in the late 1800s by a group of settlers from Ohio. The city was originally known as “Bunces Landing” after the Bunce family, who were among the first settlers. The city was renamed Safety Harbor in 1925, after the nearby bay of the same name.
The city of Safety Harbor has a long and rich history. The area was originally inhabited by the Tocobaga Indians, who were part of the larger Timucua tribe. The Tocobaga were known for their pottery and shell mounds, which can still be seen in the area today. The first European settlers arrived in the area in the late 1700s, and the city was officially incorporated in 1917.
Geography
Safety Harbor is located in Pinellas County, Florida, and is part of the Tampa Bay Area. The city is situated on the west side of Tampa Bay, and is bordered by Oldsmar to the north, Clearwater to the south, and Dunedin to the east. The city covers an area of 4.2 square miles, and has a population of 16,890 as of the 2010 census.
The city of Safety Harbor is located on the shores of Tampa Bay, and is home to several parks and recreational areas. The city is also home to the Safety Harbor Resort and Spa, which is a popular destination for tourists and locals alike. The city is also home to Philippe Park, which is a popular spot for picnics, fishing, and other outdoor activities.
Economy
The economy of Safety Harbor is largely based on tourism and retail. The city is home to several popular tourist attractions, such as the Safety Harbor Resort and Spa, Philippe Park, and the Safety Harbor Museum of Regional History. The city is also home to several retail stores, restaurants, and other businesses.
The city of Safety Harbor is also home to several large employers, such as BayCare Health System, Raymond James Financial, and Tech Data Corporation. The city is also home to several smaller businesses, such as restaurants, retail stores, and other service-based businesses.
Demographics
As of the 2010 census, the city of Safety Harbor had a population of 16,890. The racial makeup of the city was 87.3% White, 5.7% African American, 0.4% Native American, 2.2% Asian, 0.1% Pacific Islander, 1.7% from other races, and 2.6% from two or more races. Hispanic or Latino of any race were 6.2% of the population.
The median income for a household in the city was $50,945, and the median income for a family was $60,945. The per capita income for the city was $27,945. About 8.2% of families and 10.3% of the population were below the poverty line, including 14.2% of those under age 18 and 5.2% of those age 65 or over.
Common Questions
What is Per Capita Income in Safety Harbor?
Per Capita income in Safety Harbor is $52,790.
What is the Median Family Income in Safety Harbor?
Median Family Income in Safety Harbor is $119,800.
What is the Median Household income in Safety Harbor?
Median Household Income in Safety Harbor is $102,670.
What is Income or Wage Gap in Safety Harbor?
Income or Wage Gap in Safety Harbor is 29.6%.
Women in Safety Harbor earn 70.4 cents for every dollar earned by a man.
What is Inequality or Gini Index in Safety Harbor?
Inequality or Gini Index in Safety Harbor is 0.45.
What is the Total Population of Safety Harbor?
Total Population of Safety Harbor is 17,087.
What is the Total Male Population of Safety Harbor?
Total Male Population of Safety Harbor is 8,038.
What is the Total Female Population of Safety Harbor?
Total Female Population of Safety Harbor is 9,049.
What is the Ratio of Males per 100 Females in Safety Harbor?
There are 88.83 Males per 100 Females in Safety Harbor.
What is the Ratio of Females per 100 Males in Safety Harbor?
There are 112.58 Females per 100 Males in Safety Harbor.
What is the Median Population Age in Safety Harbor?
Median Population Age in Safety Harbor is 48.1 Years.
What is the Average Family Size in Safety Harbor
Average Family Size in Safety Harbor is 3.0 People.
What is the Average Household Size in Safety Harbor
Average Household Size in Safety Harbor is 2.5 People.
How Large is the Labor Force in Safety Harbor?
There are 8,806 People in the Labor Forcein in Safety Harbor.
What is the Percentage of People in the Labor Force in Safety Harbor?
62.5% of People are in the Labor Force in Safety Harbor.
What is the Unemployment Rate in Safety Harbor?
Unemployment Rate in Safety Harbor is 4.1%.