Port Richey, FL Map & Demographics
Port Richey Map
Port Richey Overview
$41,726
PER CAPITA INCOME
$57,438
AVG FAMILY INCOME
$44,872
AVG HOUSEHOLD INCOME
14.9%
WAGE / INCOME GAP [ % ]
85.1¢/ $1
WAGE / INCOME GAP [ $ ]
$10,218
FAMILY INCOME DEFICIT
0.60
INEQUALITY / GINI INDEX
3,132
TOTAL POPULATION
1,760
MALE POPULATION
1,372
FEMALE POPULATION
128.28
MALES / 100 FEMALES
77.95
FEMALES / 100 MALES
49.1
MEDIAN AGE
2.8
AVG FAMILY SIZE
2.1
AVG HOUSEHOLD SIZE
1,241
LABOR FORCE [ PEOPLE ]
44.4%
PERCENT IN LABOR FORCE
3.4%
UNEMPLOYMENT RATE
Port Richey Zip Codes
Port Richey Area Codes
Income in Port Richey
Income Overview in Port Richey
Per Capita Income in Port Richey is $41,726, while median incomes of families and households are $57,438 and $44,872 respectively.
| Characteristic | Number | Measure |
| Per Capita Income | 3,132 | $41,726 |
| Median Family Income | 803 | $57,438 |
| Mean Family Income | 803 | $101,838 |
| Median Household Income | 1,458 | $44,872 |
| Mean Household Income | 1,458 | $89,434 |
| Income Deficit | 803 | $10,218 |
| Wage / Income Gap (%) | 3,132 | 14.91% |
| Wage / Income Gap ($) | 3,132 | 85.09¢ per $1 |
| Gini / Inequality Index | 3,132 | 0.60 |
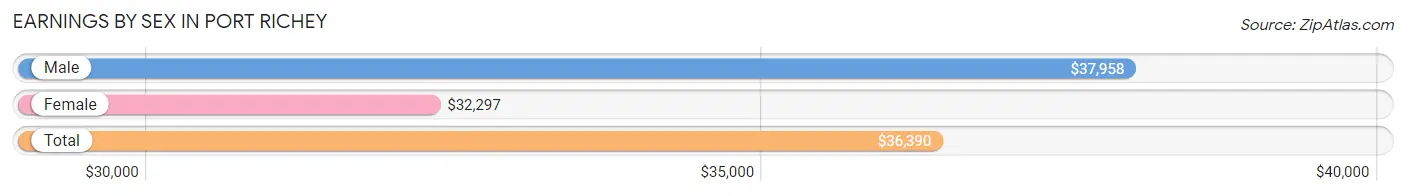
Earnings by Sex in Port Richey
Average Earnings in Port Richey are $36,390, $37,958 for men and $32,297 for women, a difference of 14.9%.
| Sex | Number | Average Earnings |
| Male | 785 (57.4%) | $37,958 |
| Female | 582 (42.6%) | $32,297 |
| Total | 1,367 (100.0%) | $36,390 |
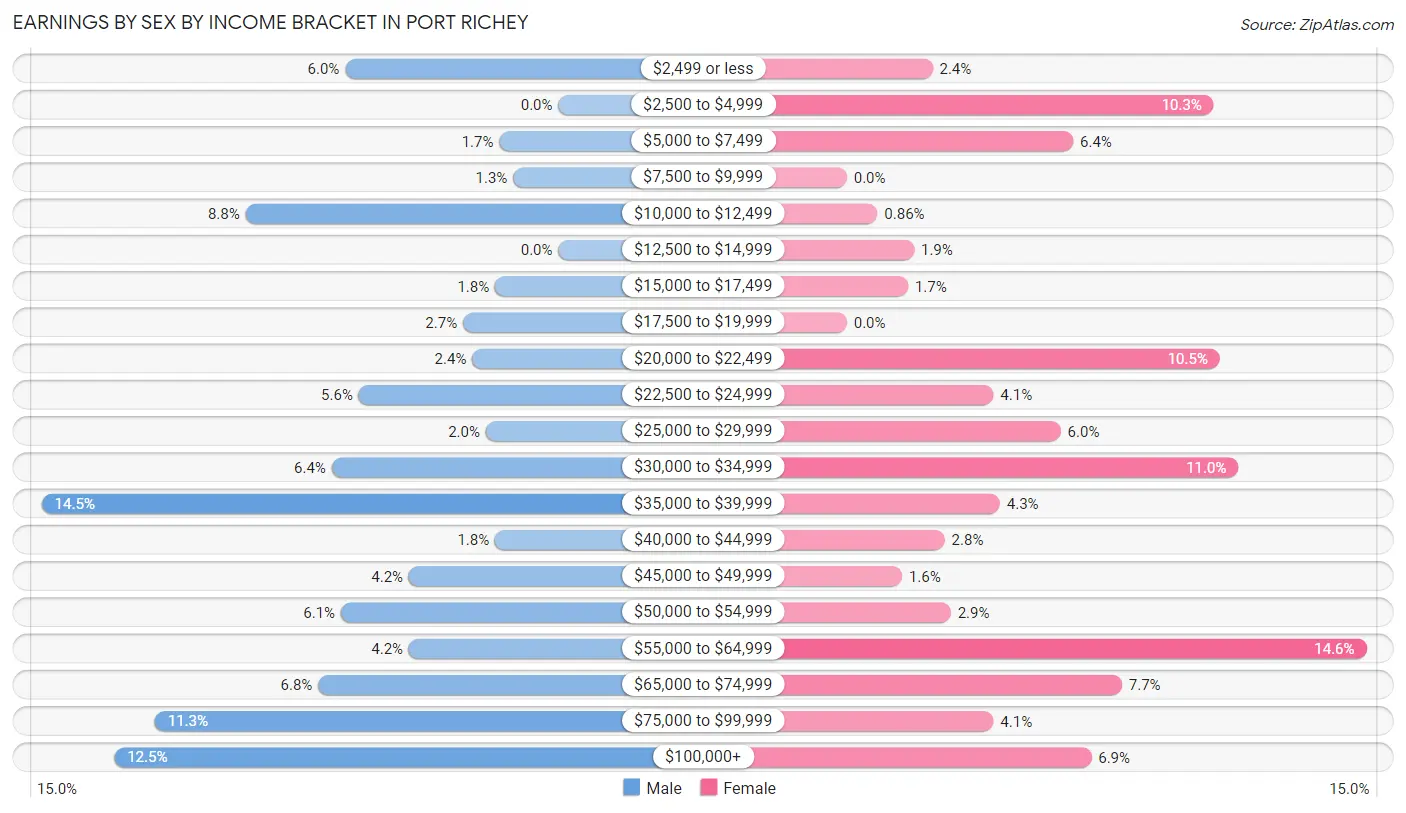
Earnings by Sex by Income Bracket in Port Richey
The most common earnings brackets in Port Richey are $35,000 to $39,999 for men (114 | 14.5%) and $55,000 to $64,999 for women (85 | 14.6%).
| Income | Male | Female |
| $2,499 or less | 47 (6.0%) | 14 (2.4%) |
| $2,500 to $4,999 | 0 (0.0%) | 60 (10.3%) |
| $5,000 to $7,499 | 13 (1.7%) | 37 (6.4%) |
| $7,500 to $9,999 | 10 (1.3%) | 0 (0.0%) |
| $10,000 to $12,499 | 69 (8.8%) | 5 (0.9%) |
| $12,500 to $14,999 | 0 (0.0%) | 11 (1.9%) |
| $15,000 to $17,499 | 14 (1.8%) | 10 (1.7%) |
| $17,500 to $19,999 | 21 (2.7%) | 0 (0.0%) |
| $20,000 to $22,499 | 19 (2.4%) | 61 (10.5%) |
| $22,500 to $24,999 | 44 (5.6%) | 24 (4.1%) |
| $25,000 to $29,999 | 16 (2.0%) | 35 (6.0%) |
| $30,000 to $34,999 | 50 (6.4%) | 64 (11.0%) |
| $35,000 to $39,999 | 114 (14.5%) | 25 (4.3%) |
| $40,000 to $44,999 | 14 (1.8%) | 16 (2.8%) |
| $45,000 to $49,999 | 33 (4.2%) | 9 (1.5%) |
| $50,000 to $54,999 | 48 (6.1%) | 17 (2.9%) |
| $55,000 to $64,999 | 33 (4.2%) | 85 (14.6%) |
| $65,000 to $74,999 | 53 (6.8%) | 45 (7.7%) |
| $75,000 to $99,999 | 89 (11.3%) | 24 (4.1%) |
| $100,000+ | 98 (12.5%) | 40 (6.9%) |
| Total | 785 (100.0%) | 582 (100.0%) |
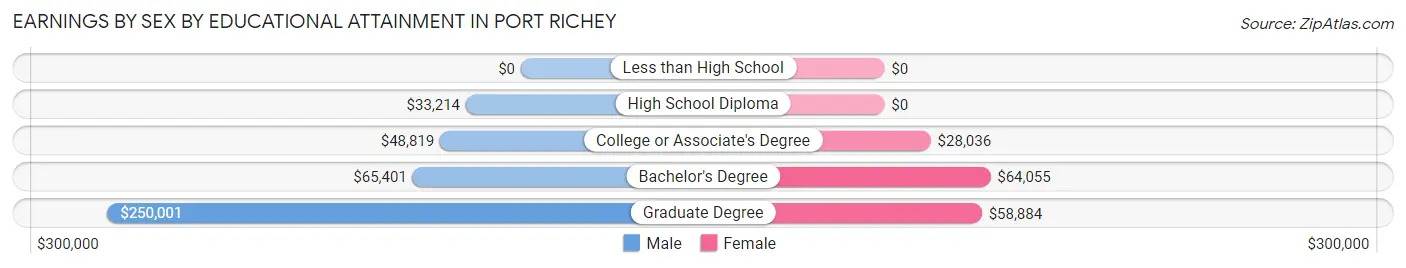
Earnings by Sex by Educational Attainment in Port Richey
Average earnings in Port Richey are $40,446 for men and $35,272 for women, a difference of 12.8%. Men with an educational attainment of graduate degree enjoy the highest average annual earnings of $250,001, while those with high school diploma education earn the least with $33,214. Women with an educational attainment of bachelor's degree earn the most with the average annual earnings of $64,055, while those with college or associate's degree education have the smallest earnings of $28,036.
| Educational Attainment | Male Income | Female Income |
| Less than High School | - | - |
| High School Diploma | $33,214 | $0 |
| College or Associate's Degree | $48,819 | $28,036 |
| Bachelor's Degree | $65,401 | $64,055 |
| Graduate Degree | $250,001 | $58,884 |
| Total | $40,446 | $35,272 |
Family Income in Port Richey
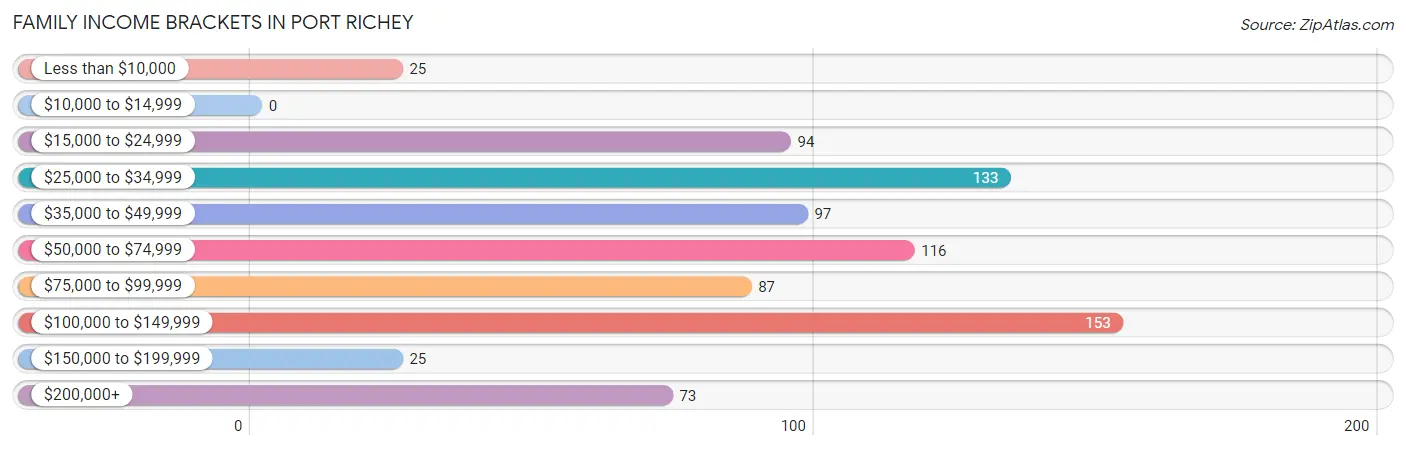
Family Income Brackets in Port Richey
According to the Port Richey family income data, there are 153 families falling into the $100,000 to $149,999 income range, which is the most common income bracket and makes up 19.1% of all families.
| Income Bracket | # Families | % Families |
| Less than $10,000 | 25 | 3.1% |
| $10,000 to $14,999 | 0 | 0.0% |
| $15,000 to $24,999 | 94 | 11.7% |
| $25,000 to $34,999 | 133 | 16.6% |
| $35,000 to $49,999 | 97 | 12.1% |
| $50,000 to $74,999 | 116 | 14.4% |
| $75,000 to $99,999 | 87 | 10.8% |
| $100,000 to $149,999 | 153 | 19.1% |
| $150,000 to $199,999 | 25 | 3.1% |
| $200,000+ | 73 | 9.1% |
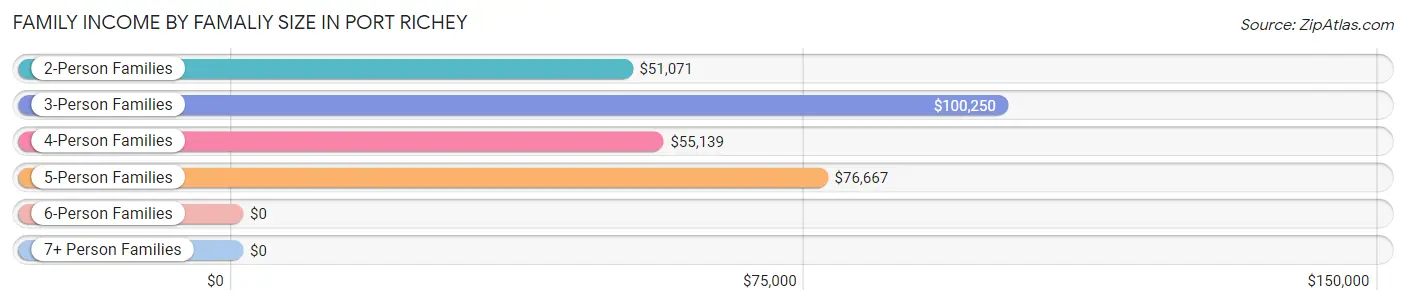
Family Income by Famaliy Size in Port Richey
3-person families (152 | 18.9%) account for the highest median family income in Port Richey with $100,250 per family, while 3-person families (152 | 18.9%) have the highest median income of $33,417 per family member.
| Income Bracket | # Families | Median Income |
| 2-Person Families | 536 (66.7%) | $51,071 |
| 3-Person Families | 152 (18.9%) | $100,250 |
| 4-Person Families | 51 (6.4%) | $55,139 |
| 5-Person Families | 60 (7.5%) | $76,667 |
| 6-Person Families | 4 (0.5%) | $0 |
| 7+ Person Families | 0 (0.0%) | $0 |
| Total | 803 (100.0%) | $57,438 |
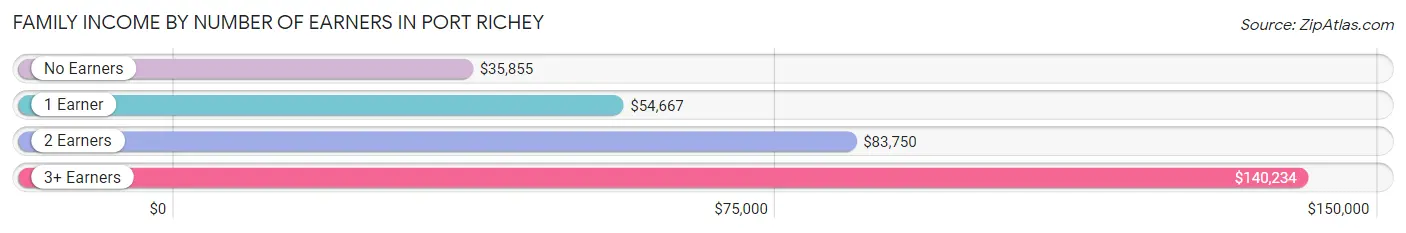
Family Income by Number of Earners in Port Richey
The median family income in Port Richey is $57,438, with families comprising 3+ earners (29) having the highest median family income of $140,234, while families with no earners (263) have the lowest median family income of $35,855, accounting for 3.6% and 32.8% of families, respectively.
| Number of Earners | # Families | Median Income |
| No Earners | 263 (32.8%) | $35,855 |
| 1 Earner | 202 (25.2%) | $54,667 |
| 2 Earners | 309 (38.5%) | $83,750 |
| 3+ Earners | 29 (3.6%) | $140,234 |
| Total | 803 (100.0%) | $57,438 |
Household Income in Port Richey
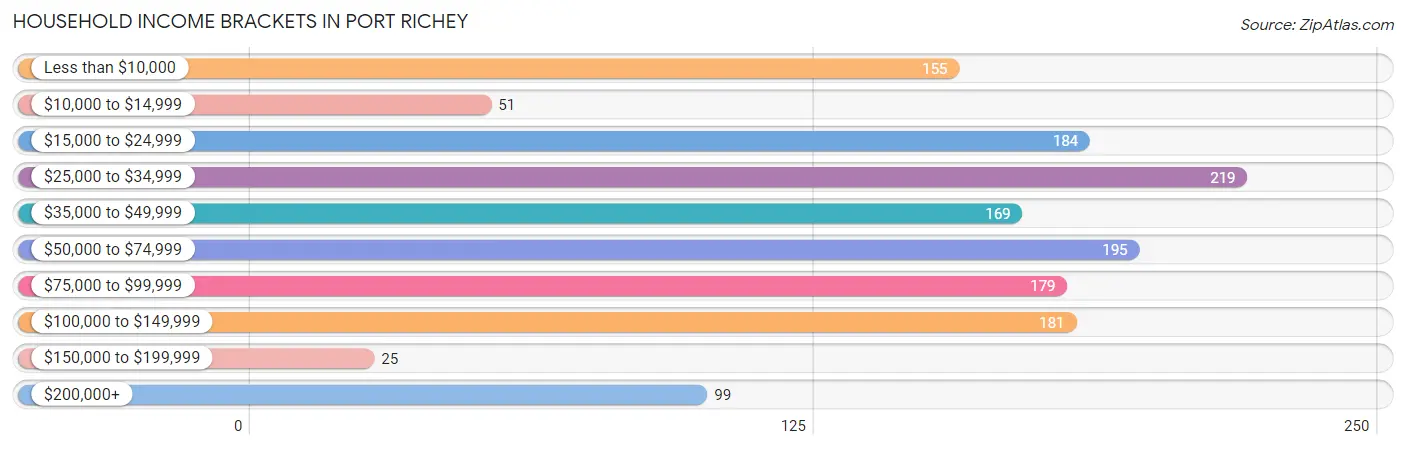
Household Income Brackets in Port Richey
With 219 households falling in the category, the $25,000 to $34,999 income range is the most frequent in Port Richey, accounting for 15.0% of all households. In contrast, only 25 households (1.7%) fall into the $150,000 to $199,999 income bracket, making it the least populous group.
| Income Bracket | # Households | % Households |
| Less than $10,000 | 155 | 10.6% |
| $10,000 to $14,999 | 51 | 3.5% |
| $15,000 to $24,999 | 184 | 12.6% |
| $25,000 to $34,999 | 219 | 15.0% |
| $35,000 to $49,999 | 169 | 11.6% |
| $50,000 to $74,999 | 195 | 13.4% |
| $75,000 to $99,999 | 179 | 12.3% |
| $100,000 to $149,999 | 181 | 12.4% |
| $150,000 to $199,999 | 25 | 1.7% |
| $200,000+ | 99 | 6.8% |
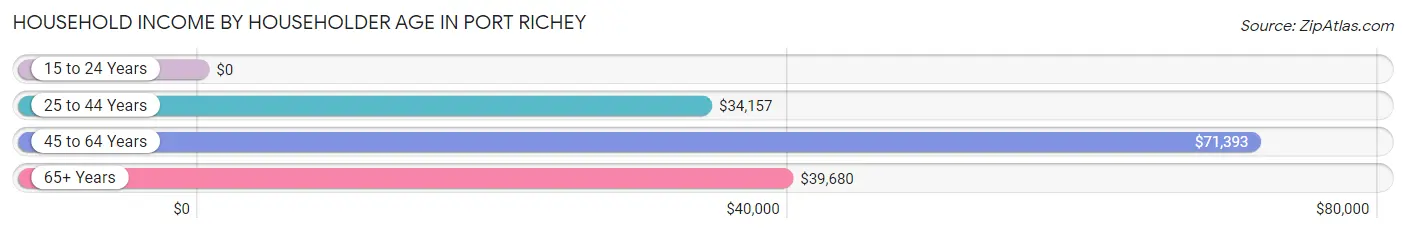
Household Income by Householder Age in Port Richey
The median household income in Port Richey is $44,872, with the highest median household income of $71,393 found in the 45 to 64 years age bracket for the primary householder. A total of 679 households (46.6%) fall into this category. Meanwhile, the 15 to 24 years age bracket for the primary householder has the lowest median household income of $0, with 14 households (1.0%) in this group.
| Income Bracket | # Households | Median Income |
| 15 to 24 Years | 14 (1.0%) | $0 |
| 25 to 44 Years | 270 (18.5%) | $34,157 |
| 45 to 64 Years | 679 (46.6%) | $71,393 |
| 65+ Years | 495 (34.0%) | $39,680 |
| Total | 1,458 (100.0%) | $44,872 |
Poverty in Port Richey
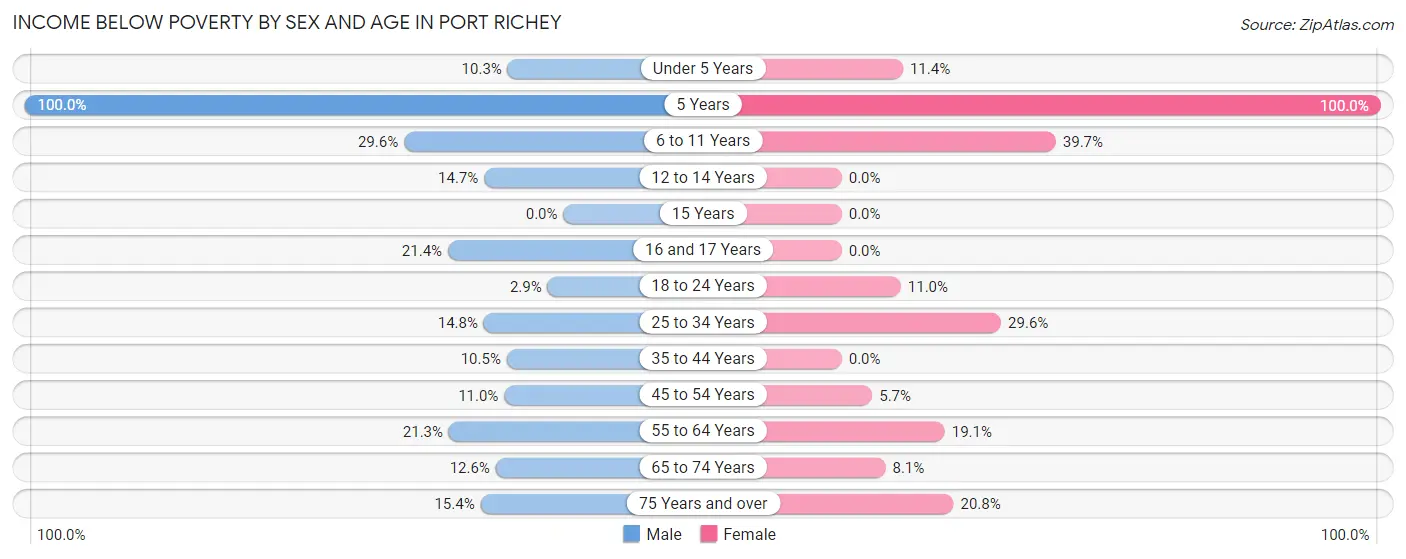
Income Below Poverty by Sex and Age in Port Richey
With 14.4% poverty level for males and 15.2% for females among the residents of Port Richey, 5 year old males and 5 year old females are the most vulnerable to poverty, with 16 males (100.0%) and 6 females (100.0%) in their respective age groups living below the poverty level.
| Age Bracket | Male | Female |
| Under 5 Years | 6 (10.3%) | 5 (11.4%) |
| 5 Years | 16 (100.0%) | 6 (100.0%) |
| 6 to 11 Years | 21 (29.6%) | 29 (39.7%) |
| 12 to 14 Years | 5 (14.7%) | 0 (0.0%) |
| 15 Years | 0 (0.0%) | 0 (0.0%) |
| 16 and 17 Years | 6 (21.4%) | 0 (0.0%) |
| 18 to 24 Years | 6 (2.9%) | 8 (11.0%) |
| 25 to 34 Years | 13 (14.8%) | 42 (29.6%) |
| 35 to 44 Years | 31 (10.5%) | 0 (0.0%) |
| 45 to 54 Years | 28 (11.0%) | 15 (5.7%) |
| 55 to 64 Years | 68 (21.2%) | 52 (19.1%) |
| 65 to 74 Years | 28 (12.6%) | 13 (8.1%) |
| 75 Years and over | 24 (15.4%) | 33 (20.7%) |
| Total | 252 (14.4%) | 203 (15.2%) |
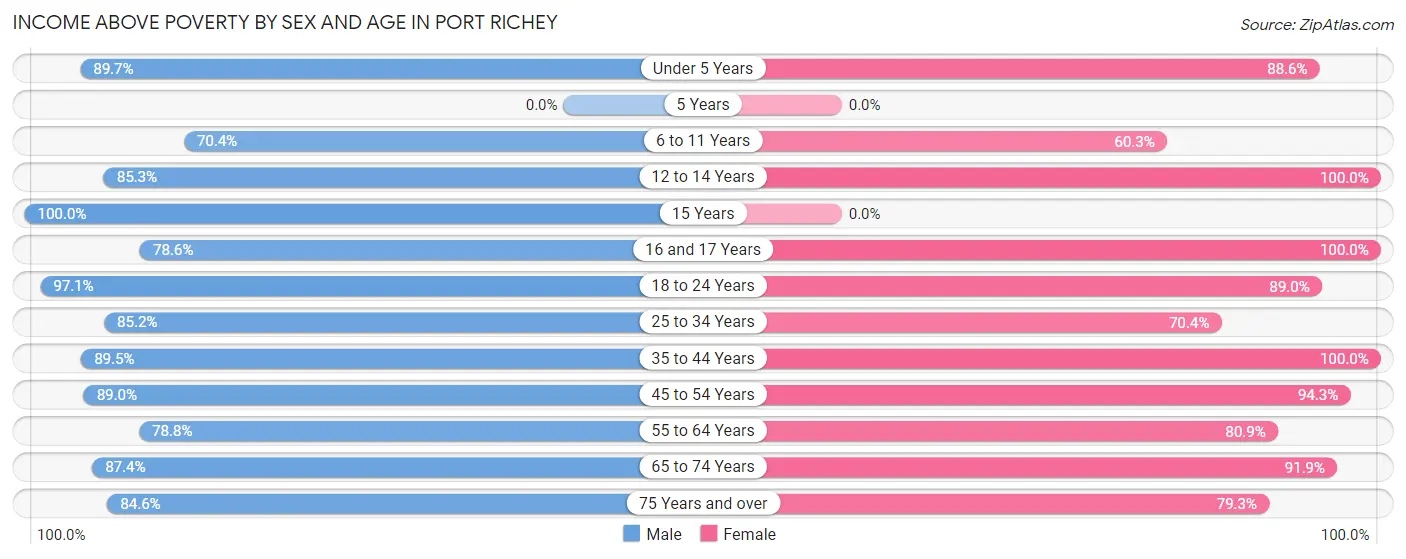
Income Above Poverty by Sex and Age in Port Richey
According to the poverty statistics in Port Richey, males aged 15 years and females aged 12 to 14 years are the age groups that are most secure financially, with 100.0% of males and 100.0% of females in these age groups living above the poverty line.
| Age Bracket | Male | Female |
| Under 5 Years | 52 (89.7%) | 39 (88.6%) |
| 5 Years | 0 (0.0%) | 0 (0.0%) |
| 6 to 11 Years | 50 (70.4%) | 44 (60.3%) |
| 12 to 14 Years | 29 (85.3%) | 27 (100.0%) |
| 15 Years | 5 (100.0%) | 0 (0.0%) |
| 16 and 17 Years | 22 (78.6%) | 58 (100.0%) |
| 18 to 24 Years | 199 (97.1%) | 65 (89.0%) |
| 25 to 34 Years | 75 (85.2%) | 100 (70.4%) |
| 35 to 44 Years | 264 (89.5%) | 56 (100.0%) |
| 45 to 54 Years | 227 (89.0%) | 250 (94.3%) |
| 55 to 64 Years | 252 (78.7%) | 220 (80.9%) |
| 65 to 74 Years | 195 (87.4%) | 147 (91.9%) |
| 75 Years and over | 132 (84.6%) | 126 (79.2%) |
| Total | 1,502 (85.6%) | 1,132 (84.8%) |
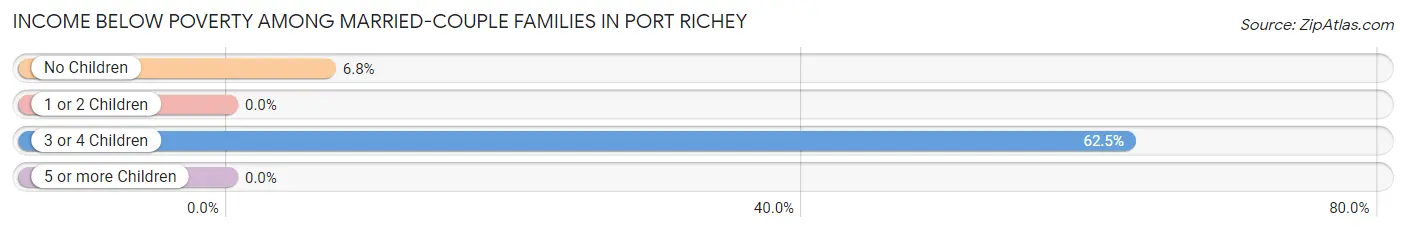
Income Below Poverty Among Married-Couple Families in Port Richey
The poverty statistics for married-couple families in Port Richey show that 9.2% or 56 of the total 606 families live below the poverty line. Families with 3 or 4 children have the highest poverty rate of 62.5%, comprising of 25 families. On the other hand, families with 1 or 2 children have the lowest poverty rate of 0.0%, which includes 0 families.
| Children | Above Poverty | Below Poverty |
| No Children | 424 (93.2%) | 31 (6.8%) |
| 1 or 2 Children | 111 (100.0%) | 0 (0.0%) |
| 3 or 4 Children | 15 (37.5%) | 25 (62.5%) |
| 5 or more Children | 0 (0.0%) | 0 (0.0%) |
| Total | 550 (90.8%) | 56 (9.2%) |
Income Below Poverty Among Single-Parent Households in Port Richey
| Children | Single Father | Single Mother |
| No Children | 0 (0.0%) | 0 (0.0%) |
| 1 or 2 Children | 0 (0.0%) | 0 (0.0%) |
| 3 or 4 Children | 0 (0.0%) | 0 (0.0%) |
| 5 or more Children | 0 (0.0%) | 0 (0.0%) |
| Total | 0 (0.0%) | 0 (0.0%) |
Income Below Poverty Among Married-Couple vs Single-Parent Households in Port Richey
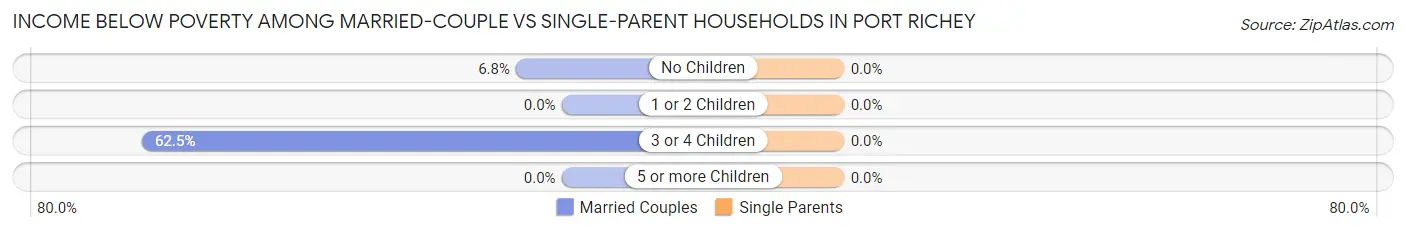
| Children | Married-Couple Families | Single-Parent Households |
| No Children | 31 (6.8%) | 0 (0.0%) |
| 1 or 2 Children | 0 (0.0%) | 0 (0.0%) |
| 3 or 4 Children | 25 (62.5%) | 0 (0.0%) |
| 5 or more Children | 0 (0.0%) | 0 (0.0%) |
| Total | 56 (9.2%) | 0 (0.0%) |
Race in Port Richey
The most populous races in Port Richey are White / Caucasian (2,628 | 83.9%), Hispanic or Latino (455 | 14.5%), and Two or more Races (430 | 13.7%).
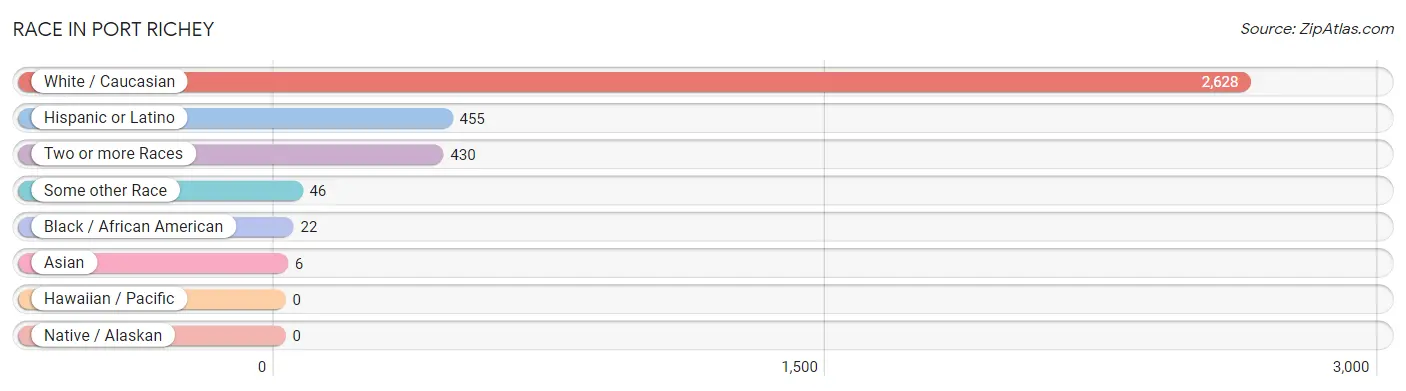
| Race | # Population | % Population |
| Asian | 6 | 0.2% |
| Black / African American | 22 | 0.7% |
| Hawaiian / Pacific | 0 | 0.0% |
| Hispanic or Latino | 455 | 14.5% |
| Native / Alaskan | 0 | 0.0% |
| White / Caucasian | 2,628 | 83.9% |
| Two or more Races | 430 | 13.7% |
| Some other Race | 46 | 1.5% |
| Total | 3,132 | 100.0% |
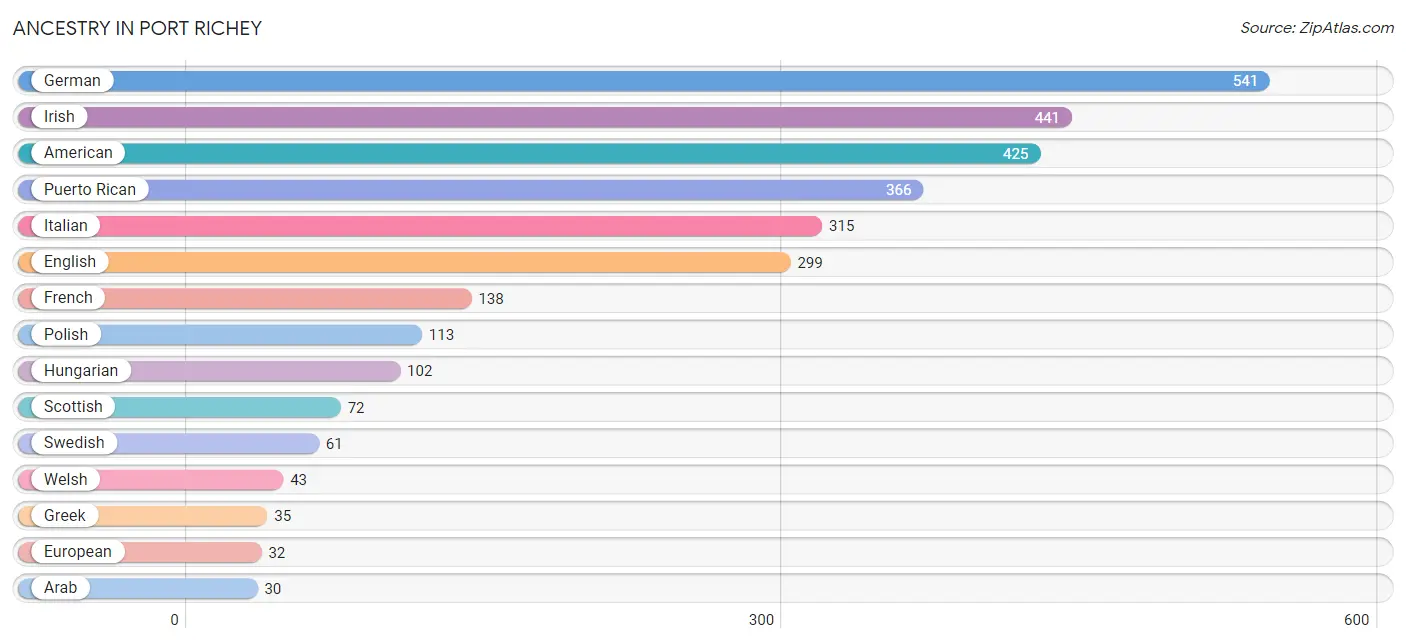
Ancestry in Port Richey
The most populous ancestries reported in Port Richey are German (541 | 17.3%), Irish (441 | 14.1%), American (425 | 13.6%), Puerto Rican (366 | 11.7%), and Italian (315 | 10.1%), together accounting for 66.7% of all Port Richey residents.
| Ancestry | # Population | % Population |
| American | 425 | 13.6% |
| Arab | 30 | 1.0% |
| Austrian | 6 | 0.2% |
| Belgian | 6 | 0.2% |
| British | 12 | 0.4% |
| Burmese | 6 | 0.2% |
| Canadian | 7 | 0.2% |
| Cherokee | 12 | 0.4% |
| Creek | 1 | 0.0% |
| Croatian | 6 | 0.2% |
| Cuban | 23 | 0.7% |
| Danish | 6 | 0.2% |
| Dutch | 18 | 0.6% |
| Dutch West Indian | 24 | 0.8% |
| English | 299 | 9.6% |
| European | 32 | 1.0% |
| French | 138 | 4.4% |
| French Canadian | 30 | 1.0% |
| German | 541 | 17.3% |
| Greek | 35 | 1.1% |
| Hungarian | 102 | 3.3% |
| Indian (Asian) | 17 | 0.5% |
| Irish | 441 | 14.1% |
| Italian | 315 | 10.1% |
| Jamaican | 29 | 0.9% |
| Korean | 6 | 0.2% |
| Lebanese | 30 | 1.0% |
| Mexican | 11 | 0.4% |
| Navajo | 7 | 0.2% |
| Norwegian | 7 | 0.2% |
| Polish | 113 | 3.6% |
| Puerto Rican | 366 | 11.7% |
| Russian | 18 | 0.6% |
| Scotch-Irish | 23 | 0.7% |
| Scottish | 72 | 2.3% |
| Slavic | 26 | 0.8% |
| Slovak | 5 | 0.2% |
| South American | 8 | 0.3% |
| Spaniard | 17 | 0.5% |
| Sri Lankan | 17 | 0.5% |
| Swedish | 61 | 1.9% |
| Venezuelan | 8 | 0.3% |
| Welsh | 43 | 1.4% | View All 43 Rows |
Immigrants in Port Richey
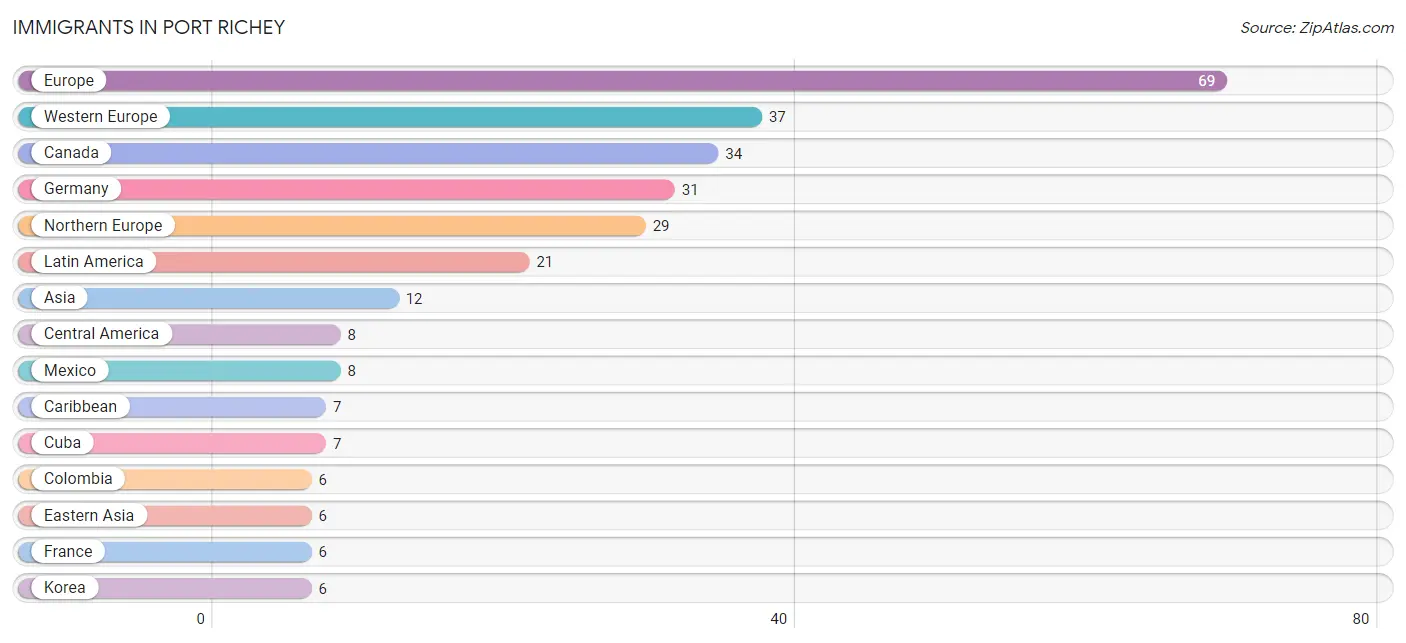
The most numerous immigrant groups reported in Port Richey came from Europe (69 | 2.2%), Western Europe (37 | 1.2%), Canada (34 | 1.1%), Germany (31 | 1.0%), and Northern Europe (29 | 0.9%), together accounting for 6.4% of all Port Richey residents.
| Immigration Origin | # Population | % Population |
| Asia | 12 | 0.4% |
| Canada | 34 | 1.1% |
| Caribbean | 7 | 0.2% |
| Central America | 8 | 0.3% |
| Colombia | 6 | 0.2% |
| Cuba | 7 | 0.2% |
| Eastern Asia | 6 | 0.2% |
| Eastern Europe | 3 | 0.1% |
| Europe | 69 | 2.2% |
| France | 6 | 0.2% |
| Germany | 31 | 1.0% |
| Korea | 6 | 0.2% |
| Latin America | 21 | 0.7% |
| Lebanon | 6 | 0.2% |
| Mexico | 8 | 0.3% |
| Northern Europe | 29 | 0.9% |
| South America | 6 | 0.2% |
| Western Asia | 6 | 0.2% |
| Western Europe | 37 | 1.2% | View All 19 Rows |
Sex and Age in Port Richey
Sex and Age in Port Richey
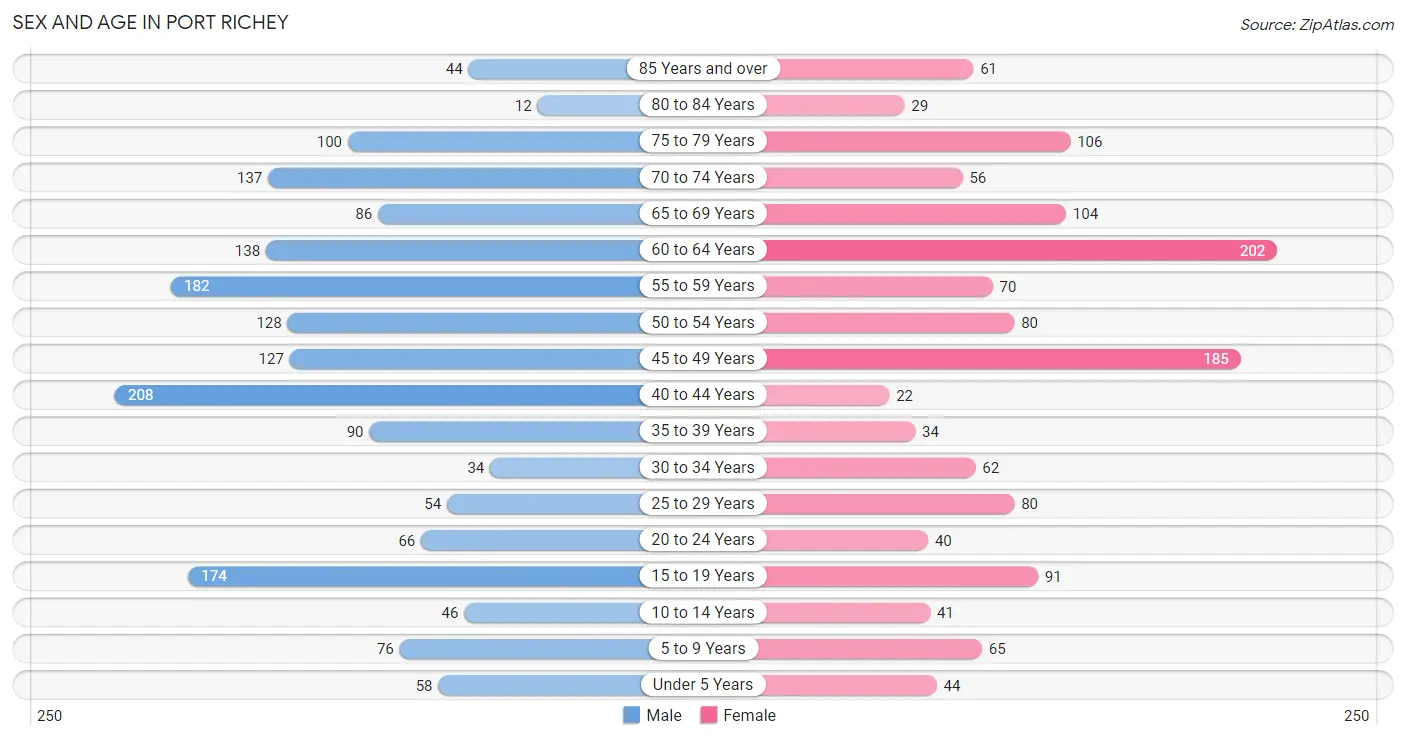
The most populous age groups in Port Richey are 40 to 44 Years (208 | 11.8%) for men and 60 to 64 Years (202 | 14.7%) for women.
| Age Bracket | Male | Female |
| Under 5 Years | 58 (3.3%) | 44 (3.2%) |
| 5 to 9 Years | 76 (4.3%) | 65 (4.7%) |
| 10 to 14 Years | 46 (2.6%) | 41 (3.0%) |
| 15 to 19 Years | 174 (9.9%) | 91 (6.6%) |
| 20 to 24 Years | 66 (3.7%) | 40 (2.9%) |
| 25 to 29 Years | 54 (3.1%) | 80 (5.8%) |
| 30 to 34 Years | 34 (1.9%) | 62 (4.5%) |
| 35 to 39 Years | 90 (5.1%) | 34 (2.5%) |
| 40 to 44 Years | 208 (11.8%) | 22 (1.6%) |
| 45 to 49 Years | 127 (7.2%) | 185 (13.5%) |
| 50 to 54 Years | 128 (7.3%) | 80 (5.8%) |
| 55 to 59 Years | 182 (10.3%) | 70 (5.1%) |
| 60 to 64 Years | 138 (7.8%) | 202 (14.7%) |
| 65 to 69 Years | 86 (4.9%) | 104 (7.6%) |
| 70 to 74 Years | 137 (7.8%) | 56 (4.1%) |
| 75 to 79 Years | 100 (5.7%) | 106 (7.7%) |
| 80 to 84 Years | 12 (0.7%) | 29 (2.1%) |
| 85 Years and over | 44 (2.5%) | 61 (4.4%) |
| Total | 1,760 (100.0%) | 1,372 (100.0%) |
Families and Households in Port Richey
Median Family Size in Port Richey
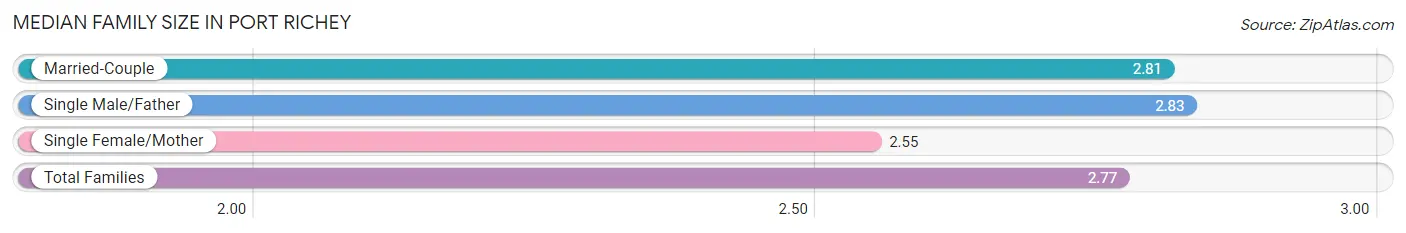
The median family size in Port Richey is 2.77 persons per family, with single male/father families (54 | 6.7%) accounting for the largest median family size of 2.83 persons per family. On the other hand, single female/mother families (143 | 17.8%) represent the smallest median family size with 2.55 persons per family.
| Family Type | # Families | Family Size |
| Married-Couple | 606 (75.5%) | 2.81 |
| Single Male/Father | 54 (6.7%) | 2.83 |
| Single Female/Mother | 143 (17.8%) | 2.55 |
| Total Families | 803 (100.0%) | 2.77 |
Median Household Size in Port Richey
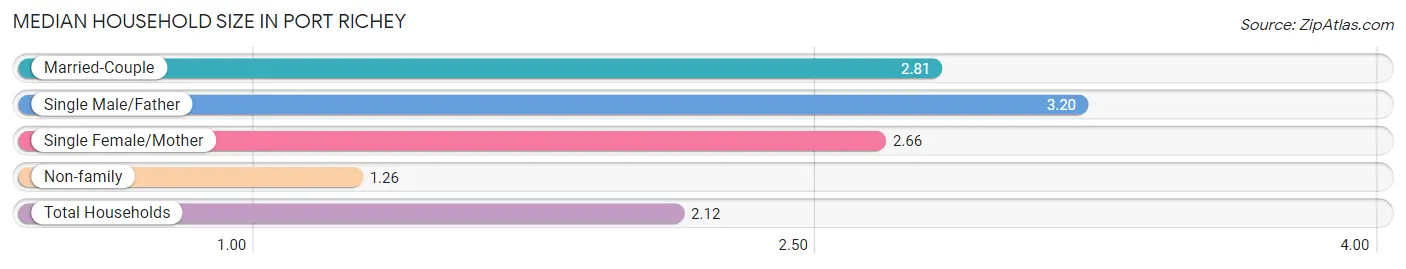
The median household size in Port Richey is 2.12 persons per household, with single male/father households (54 | 3.7%) accounting for the largest median household size of 3.2 persons per household. non-family households (655 | 44.9%) represent the smallest median household size with 1.26 persons per household.
| Household Type | # Households | Household Size |
| Married-Couple | 606 (41.6%) | 2.81 |
| Single Male/Father | 54 (3.7%) | 3.20 |
| Single Female/Mother | 143 (9.8%) | 2.66 |
| Non-family | 655 (44.9%) | 1.26 |
| Total Households | 1,458 (100.0%) | 2.12 |
Household Size by Marriage Status in Port Richey
Out of a total of 1,458 households in Port Richey, 803 (55.1%) are family households, while 655 (44.9%) are nonfamily households. The most numerous type of family households are 2-person households, comprising 517, and the most common type of nonfamily households are 1-person households, comprising 535.
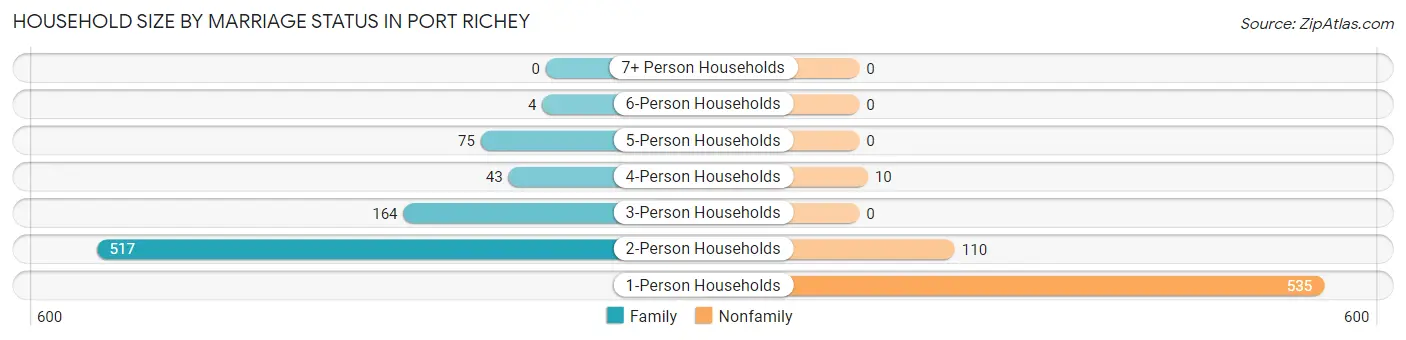
| Household Size | Family Households | Nonfamily Households |
| 1-Person Households | - | 535 (36.7%) |
| 2-Person Households | 517 (35.5%) | 110 (7.5%) |
| 3-Person Households | 164 (11.3%) | 0 (0.0%) |
| 4-Person Households | 43 (2.9%) | 10 (0.7%) |
| 5-Person Households | 75 (5.1%) | 0 (0.0%) |
| 6-Person Households | 4 (0.3%) | 0 (0.0%) |
| 7+ Person Households | 0 (0.0%) | 0 (0.0%) |
| Total | 803 (55.1%) | 655 (44.9%) |
Female Fertility in Port Richey
Fertility by Age in Port Richey
Average fertility rate in Port Richey is 98.0 births per 1,000 women. Women in the age bracket of 20 to 34 years have the highest fertility rate with 286.0 births per 1,000 women. Women in the age bracket of 20 to 34 years acount for 100.0% of all women with births.
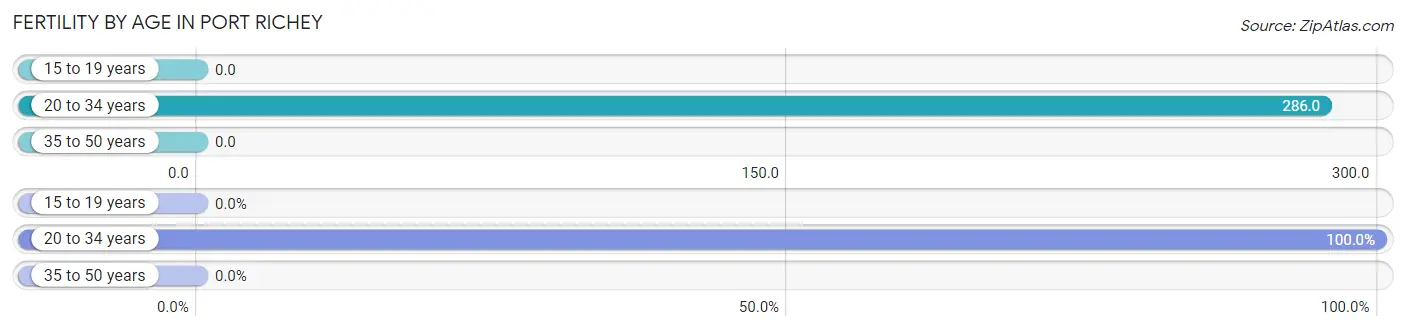
| Age Bracket | Women with Births | Births / 1,000 Women |
| 15 to 19 years | 0 (0.0%) | 0.0 |
| 20 to 34 years | 52 (100.0%) | 286.0 |
| 35 to 50 years | 0 (0.0%) | 0.0 |
| Total | 52 (100.0%) | 98.0 |
Fertility by Age by Marriage Status in Port Richey
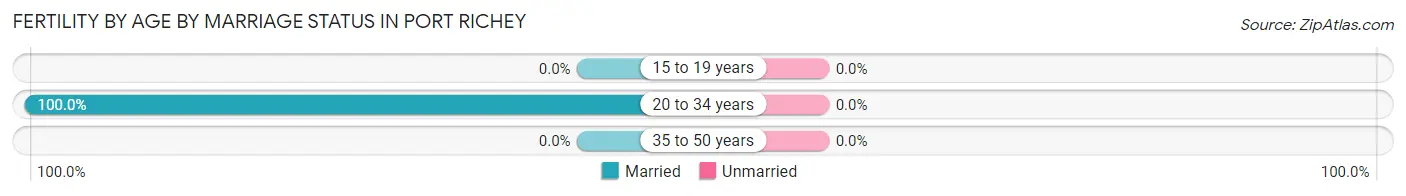
| Age Bracket | Married | Unmarried |
| 15 to 19 years | 0 (0.0%) | 0 (0.0%) |
| 20 to 34 years | 52 (100.0%) | 0 (0.0%) |
| 35 to 50 years | 0 (0.0%) | 0 (0.0%) |
| Total | 52 (100.0%) | 0 (0.0%) |
Fertility by Education in Port Richey
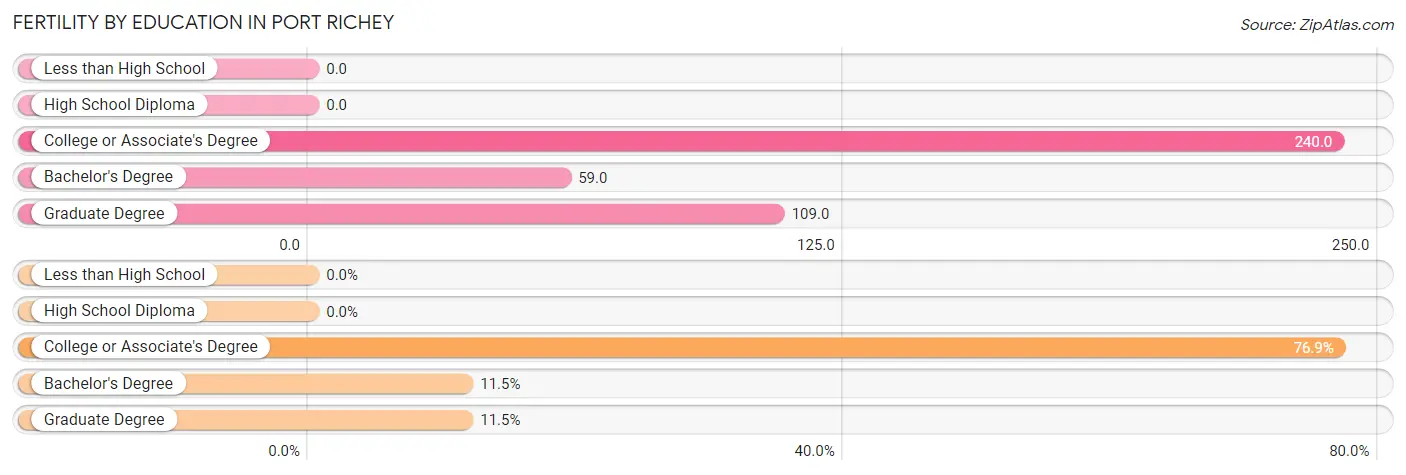
| Educational Attainment | Women with Births | Births / 1,000 Women |
| Less than High School | 0 (0.0%) | 0.0 |
| High School Diploma | 0 (0.0%) | 0.0 |
| College or Associate's Degree | 40 (76.9%) | 240.0 |
| Bachelor's Degree | 6 (11.5%) | 59.0 |
| Graduate Degree | 6 (11.5%) | 109.0 |
| Total | 52 (100.0%) | 98.0 |
Fertility by Education by Marriage Status in Port Richey
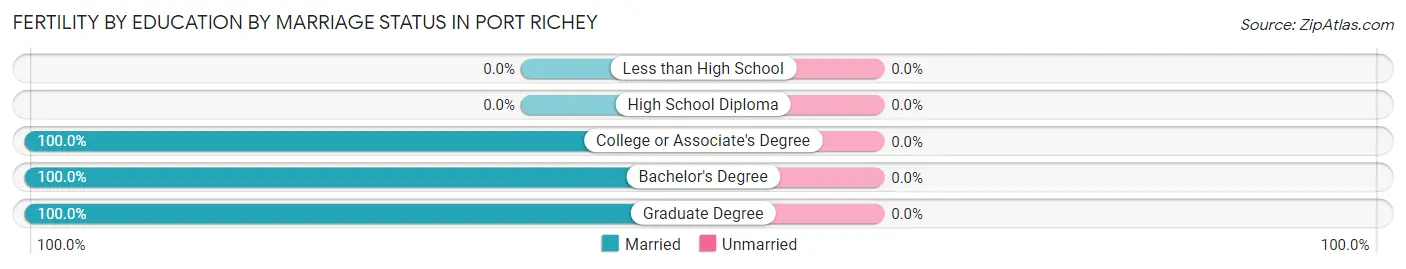
| Educational Attainment | Married | Unmarried |
| Less than High School | 0 (0.0%) | 0 (0.0%) |
| High School Diploma | 0 (0.0%) | 0 (0.0%) |
| College or Associate's Degree | 40 (100.0%) | 0 (0.0%) |
| Bachelor's Degree | 6 (100.0%) | 0 (0.0%) |
| Graduate Degree | 6 (100.0%) | 0 (0.0%) |
| Total | 52 (100.0%) | 0 (0.0%) |
Employment Characteristics in Port Richey
Employment by Class of Employer in Port Richey
Among the 1,167 employed individuals in Port Richey, private company employees (820 | 70.3%), self-employed (not incorporated) (119 | 10.2%), and local government employees (84 | 7.2%) make up the most common classes of employment.
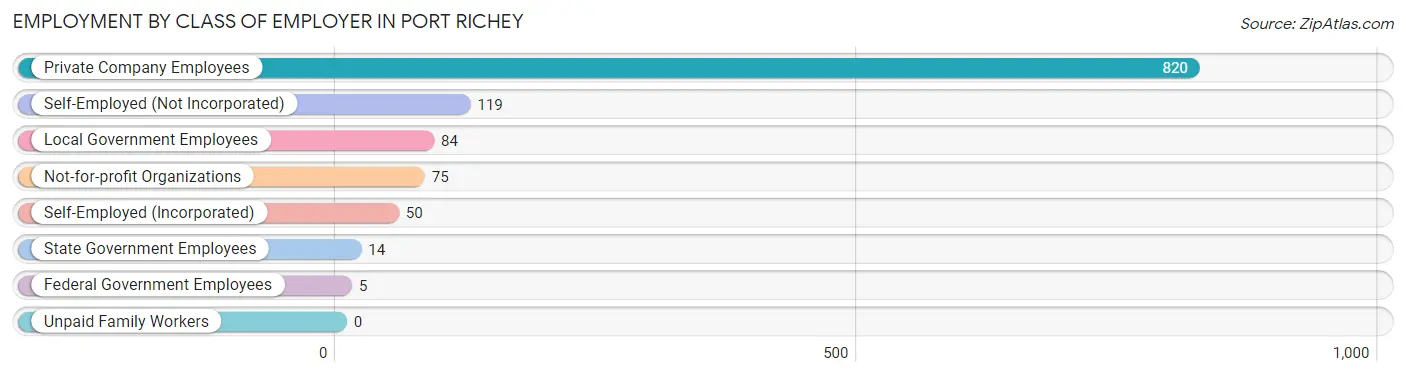
| Employer Class | # Employees | % Employees |
| Private Company Employees | 820 | 70.3% |
| Self-Employed (Incorporated) | 50 | 4.3% |
| Self-Employed (Not Incorporated) | 119 | 10.2% |
| Not-for-profit Organizations | 75 | 6.4% |
| Local Government Employees | 84 | 7.2% |
| State Government Employees | 14 | 1.2% |
| Federal Government Employees | 5 | 0.4% |
| Unpaid Family Workers | 0 | 0.0% |
| Total | 1,167 | 100.0% |
Employment Status by Age in Port Richey
According to the labor force statistics for Port Richey, out of the total population over 16 years of age (2,796), 44.4% or 1,241 individuals are in the labor force, with 3.4% or 42 of them unemployed. The age group with the highest labor force participation rate is 45 to 54 years, with 80.0% or 416 individuals in the labor force. Within the labor force, the 60 to 64 years age range has the highest percentage of unemployed individuals, with 9.4% or 12 of them being unemployed.
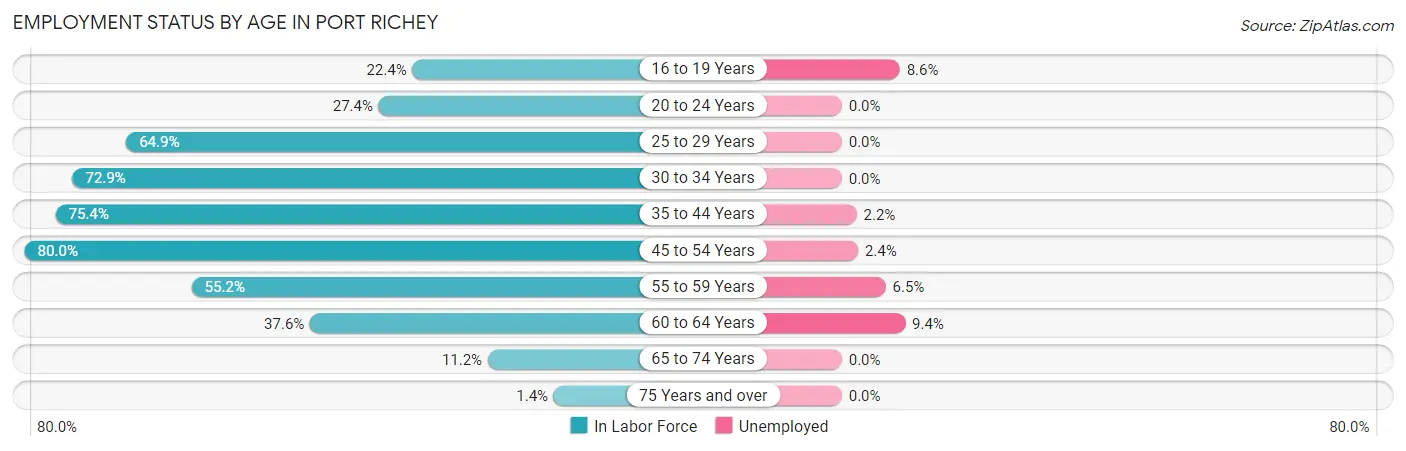
| Age Bracket | In Labor Force | Unemployed |
| 16 to 19 Years | 58 (22.4%) | 5 (8.6%) |
| 20 to 24 Years | 29 (27.4%) | 0 (0.0%) |
| 25 to 29 Years | 87 (64.9%) | 0 (0.0%) |
| 30 to 34 Years | 70 (72.9%) | 0 (0.0%) |
| 35 to 44 Years | 267 (75.4%) | 6 (2.2%) |
| 45 to 54 Years | 416 (80.0%) | 10 (2.4%) |
| 55 to 59 Years | 139 (55.2%) | 9 (6.5%) |
| 60 to 64 Years | 128 (37.6%) | 12 (9.4%) |
| 65 to 74 Years | 43 (11.2%) | 0 (0.0%) |
| 75 Years and over | 5 (1.4%) | 0 (0.0%) |
| Total | 1,241 (44.4%) | 42 (3.4%) |
Employment Status by Educational Attainment in Port Richey
According to labor force statistics for Port Richey, 65.3% of individuals (1,107) out of the total population between 25 and 64 years of age (1,696) are in the labor force, with 3.3% or 37 of them being unemployed. The group with the highest labor force participation rate are those with the educational attainment of bachelor's degree or higher, with 75.8% or 411 individuals in the labor force. Within the labor force, individuals with high school diploma education have the highest percentage of unemployment, with 9.5% or 23 of them being unemployed.
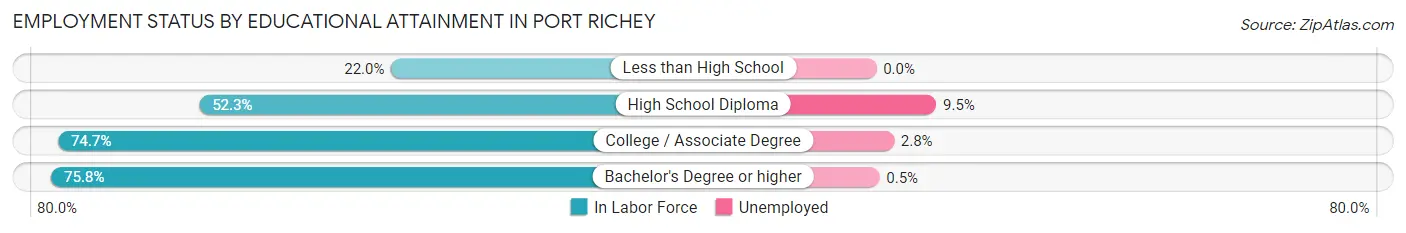
| Educational Attainment | In Labor Force | Unemployed |
| Less than High School | 26 (22.0%) | 0 (0.0%) |
| High School Diploma | 242 (52.3%) | 44 (9.5%) |
| College / Associate Degree | 428 (74.7%) | 16 (2.8%) |
| Bachelor's Degree or higher | 411 (75.8%) | 3 (0.5%) |
| Total | 1,107 (65.3%) | 56 (3.3%) |
Employment Occupations by Sex in Port Richey
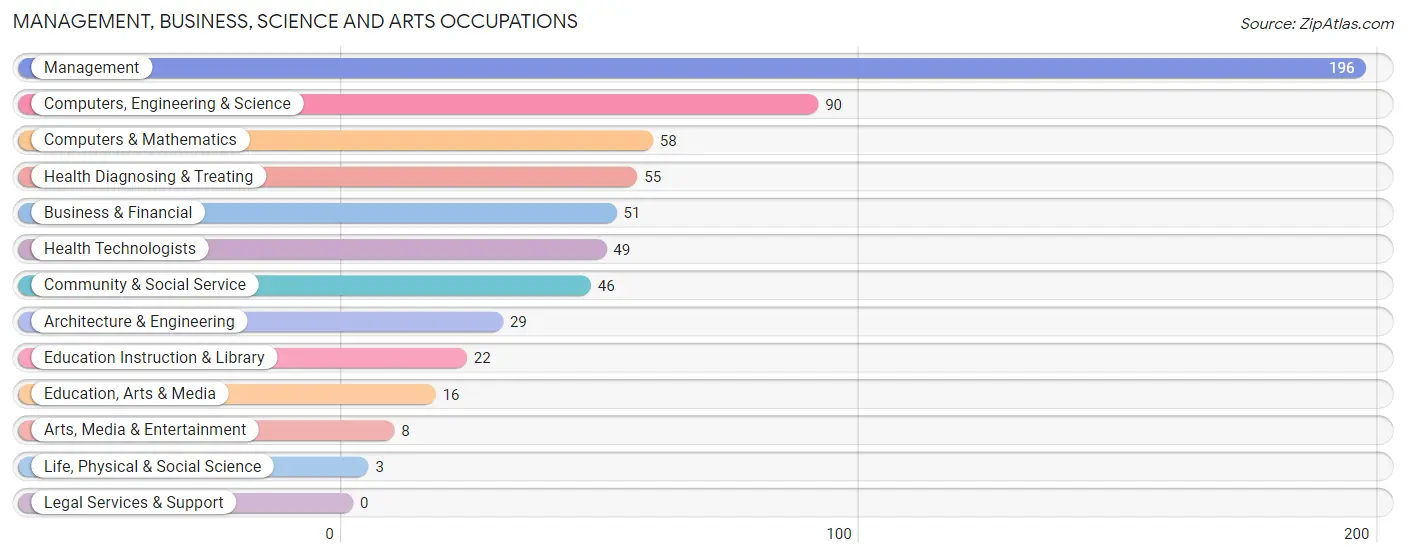
Management, Business, Science and Arts Occupations
The most common Management, Business, Science and Arts occupations in Port Richey are Management (196 | 16.3%), Computers, Engineering & Science (90 | 7.5%), Computers & Mathematics (58 | 4.8%), Health Diagnosing & Treating (55 | 4.6%), and Business & Financial (51 | 4.3%).
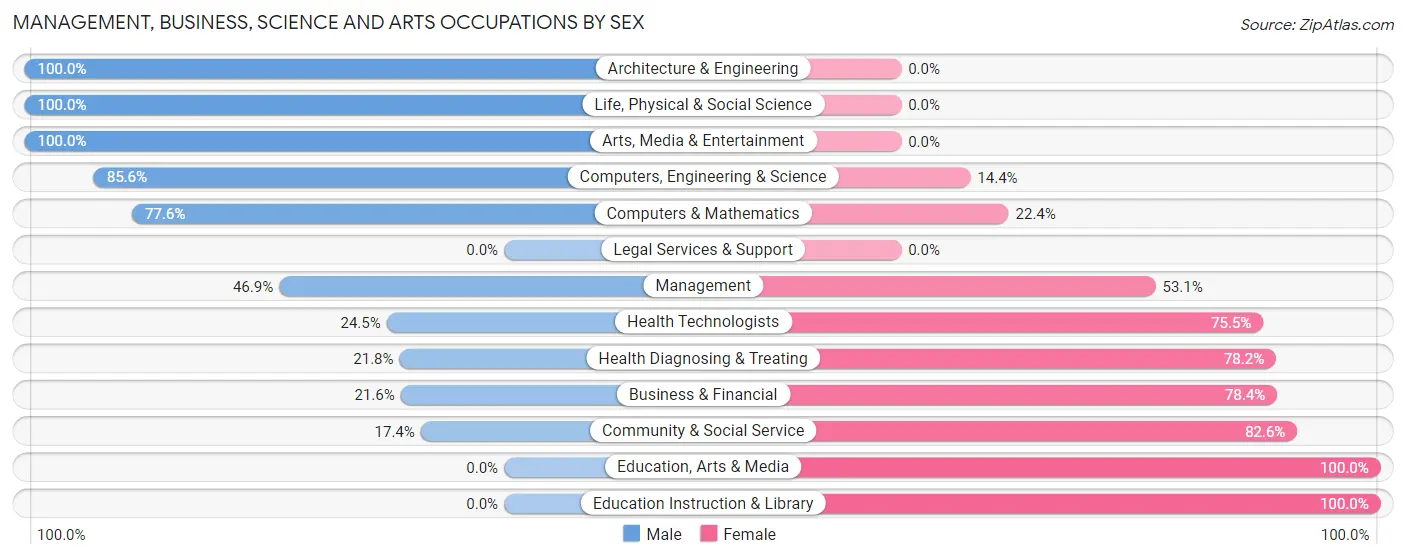
Management, Business, Science and Arts Occupations by Sex
Within the Management, Business, Science and Arts occupations in Port Richey, the most male-oriented occupations are Architecture & Engineering (100.0%), Life, Physical & Social Science (100.0%), and Arts, Media & Entertainment (100.0%), while the most female-oriented occupations are Education, Arts & Media (100.0%), Education Instruction & Library (100.0%), and Community & Social Service (82.6%).
| Occupation | Male | Female |
| Management | 92 (46.9%) | 104 (53.1%) |
| Business & Financial | 11 (21.6%) | 40 (78.4%) |
| Computers, Engineering & Science | 77 (85.6%) | 13 (14.4%) |
| Computers & Mathematics | 45 (77.6%) | 13 (22.4%) |
| Architecture & Engineering | 29 (100.0%) | 0 (0.0%) |
| Life, Physical & Social Science | 3 (100.0%) | 0 (0.0%) |
| Community & Social Service | 8 (17.4%) | 38 (82.6%) |
| Education, Arts & Media | 0 (0.0%) | 16 (100.0%) |
| Legal Services & Support | 0 (0.0%) | 0 (0.0%) |
| Education Instruction & Library | 0 (0.0%) | 22 (100.0%) |
| Arts, Media & Entertainment | 8 (100.0%) | 0 (0.0%) |
| Health Diagnosing & Treating | 12 (21.8%) | 43 (78.2%) |
| Health Technologists | 12 (24.5%) | 37 (75.5%) |
| Total (Category) | 200 (45.7%) | 238 (54.3%) |
| Total (Overall) | 655 (54.6%) | 545 (45.4%) |
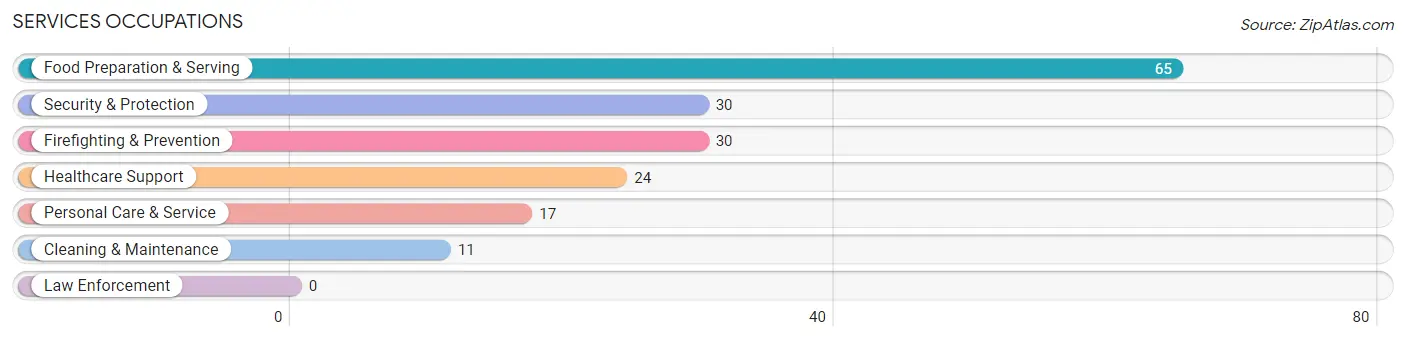
Services Occupations
The most common Services occupations in Port Richey are Food Preparation & Serving (65 | 5.4%), Security & Protection (30 | 2.5%), Firefighting & Prevention (30 | 2.5%), Healthcare Support (24 | 2.0%), and Personal Care & Service (17 | 1.4%).
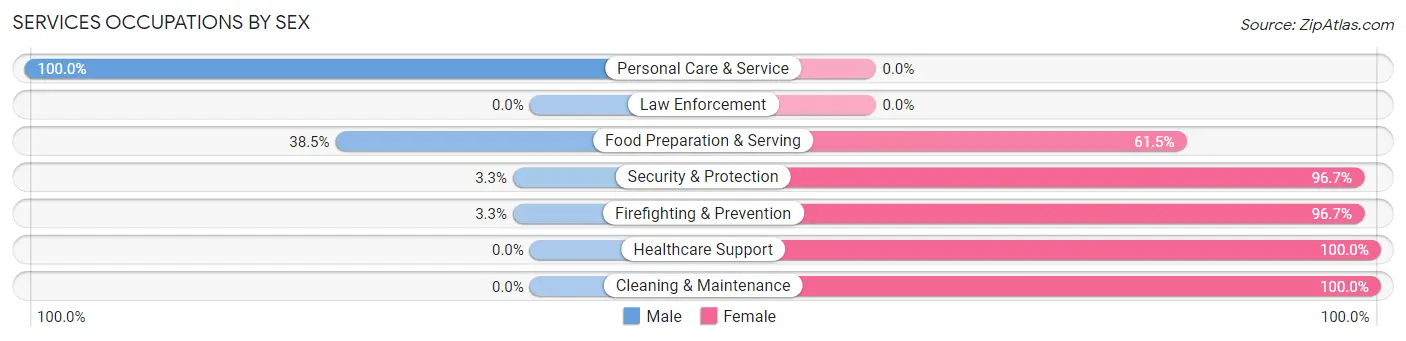
Services Occupations by Sex
Within the Services occupations in Port Richey, the most male-oriented occupations are Personal Care & Service (100.0%), Food Preparation & Serving (38.5%), and Security & Protection (3.3%), while the most female-oriented occupations are Healthcare Support (100.0%), Cleaning & Maintenance (100.0%), and Security & Protection (96.7%).
| Occupation | Male | Female |
| Healthcare Support | 0 (0.0%) | 24 (100.0%) |
| Security & Protection | 1 (3.3%) | 29 (96.7%) |
| Firefighting & Prevention | 1 (3.3%) | 29 (96.7%) |
| Law Enforcement | 0 (0.0%) | 0 (0.0%) |
| Food Preparation & Serving | 25 (38.5%) | 40 (61.5%) |
| Cleaning & Maintenance | 0 (0.0%) | 11 (100.0%) |
| Personal Care & Service | 17 (100.0%) | 0 (0.0%) |
| Total (Category) | 43 (29.2%) | 104 (70.8%) |
| Total (Overall) | 655 (54.6%) | 545 (45.4%) |
Sales and Office Occupations
The most common Sales and Office occupations in Port Richey are Sales & Related (153 | 12.8%), and Office & Administration (145 | 12.1%).
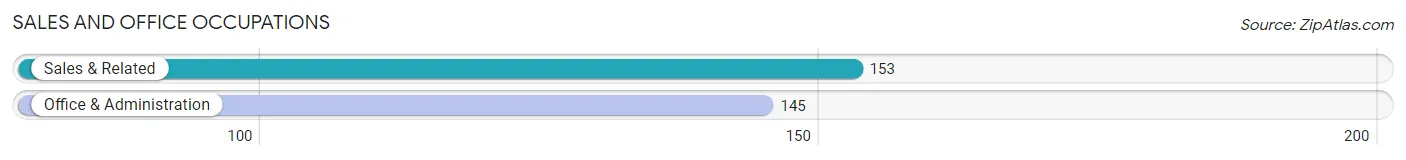
Sales and Office Occupations by Sex
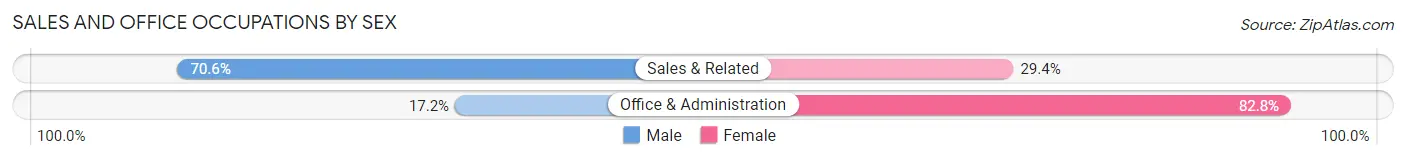
| Occupation | Male | Female |
| Sales & Related | 108 (70.6%) | 45 (29.4%) |
| Office & Administration | 25 (17.2%) | 120 (82.8%) |
| Total (Category) | 133 (44.6%) | 165 (55.4%) |
| Total (Overall) | 655 (54.6%) | 545 (45.4%) |
Natural Resources, Construction and Maintenance Occupations
The most common Natural Resources, Construction and Maintenance occupations in Port Richey are Construction & Extraction (125 | 10.4%), and Installation, Maintenance & Repair (81 | 6.8%).
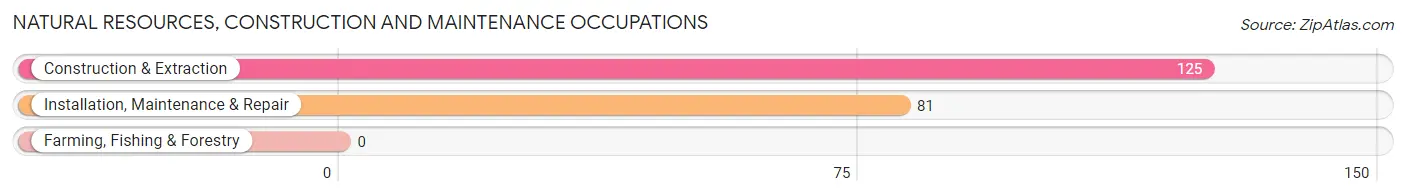
Natural Resources, Construction and Maintenance Occupations by Sex
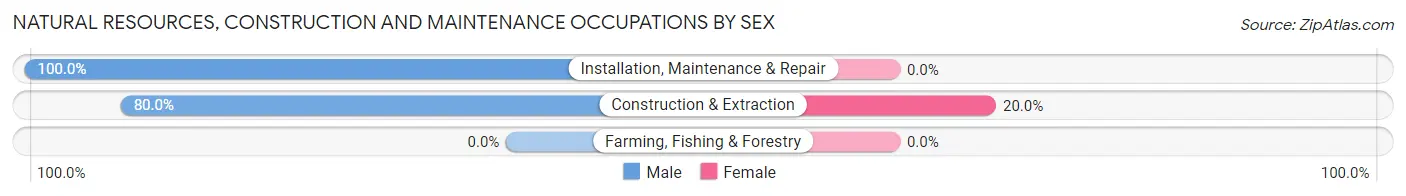
| Occupation | Male | Female |
| Farming, Fishing & Forestry | 0 (0.0%) | 0 (0.0%) |
| Construction & Extraction | 100 (80.0%) | 25 (20.0%) |
| Installation, Maintenance & Repair | 81 (100.0%) | 0 (0.0%) |
| Total (Category) | 181 (87.9%) | 25 (12.1%) |
| Total (Overall) | 655 (54.6%) | 545 (45.4%) |
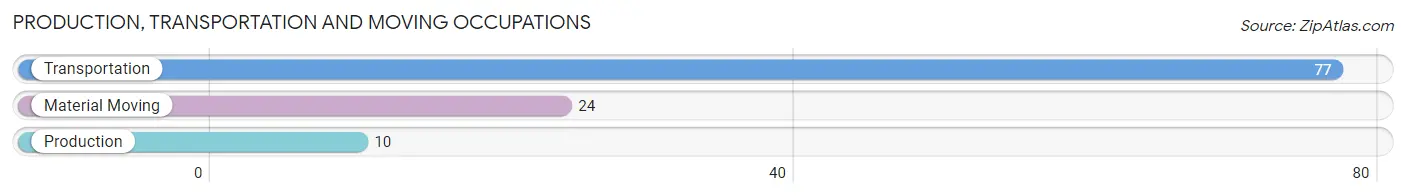
Production, Transportation and Moving Occupations
The most common Production, Transportation and Moving occupations in Port Richey are Transportation (77 | 6.4%), Material Moving (24 | 2.0%), and Production (10 | 0.8%).
Production, Transportation and Moving Occupations by Sex
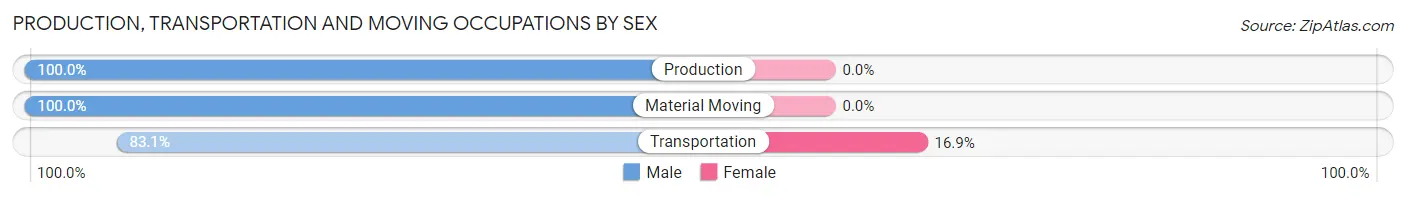
| Occupation | Male | Female |
| Production | 10 (100.0%) | 0 (0.0%) |
| Transportation | 64 (83.1%) | 13 (16.9%) |
| Material Moving | 24 (100.0%) | 0 (0.0%) |
| Total (Category) | 98 (88.3%) | 13 (11.7%) |
| Total (Overall) | 655 (54.6%) | 545 (45.4%) |
Employment Industries by Sex in Port Richey
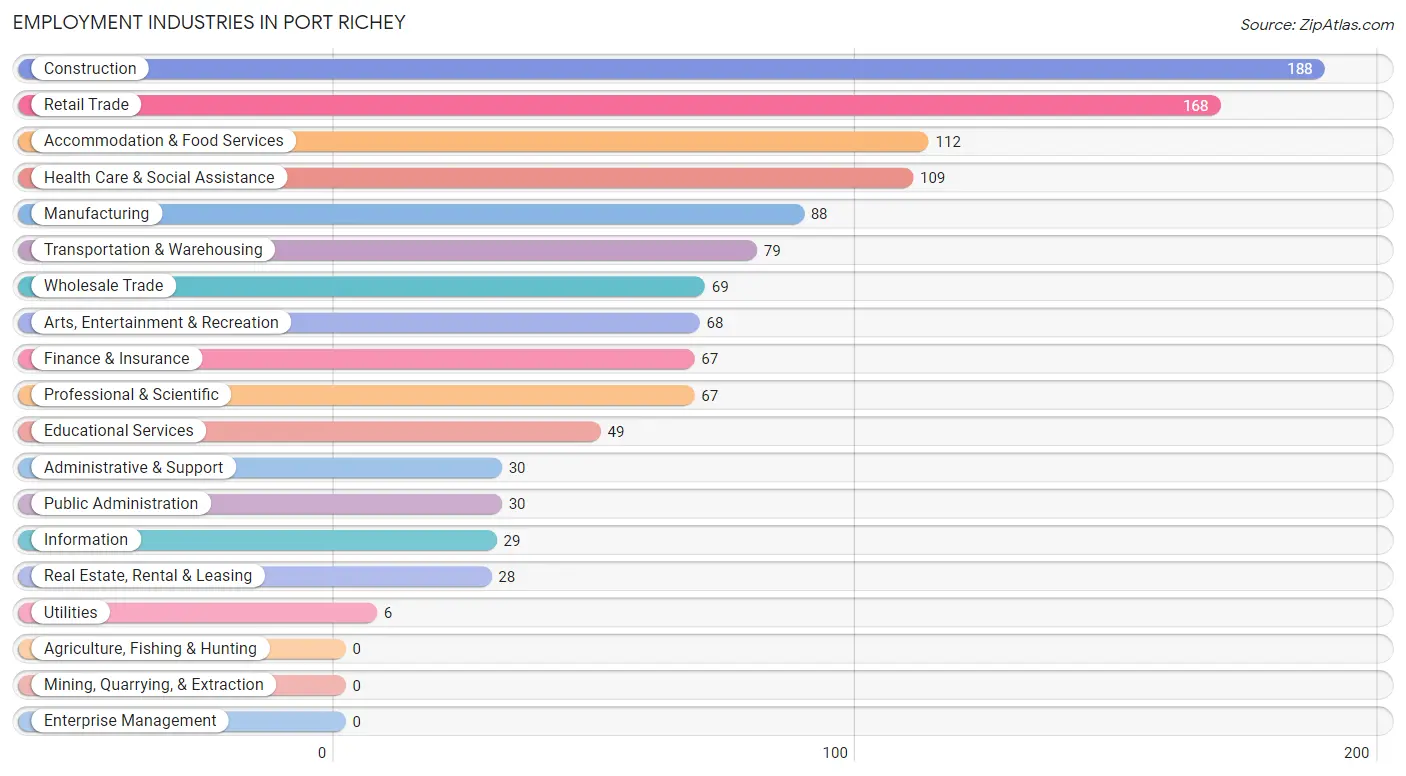
Employment Industries in Port Richey
The major employment industries in Port Richey include Construction (188 | 15.7%), Retail Trade (168 | 14.0%), Accommodation & Food Services (112 | 9.3%), Health Care & Social Assistance (109 | 9.1%), and Manufacturing (88 | 7.3%).
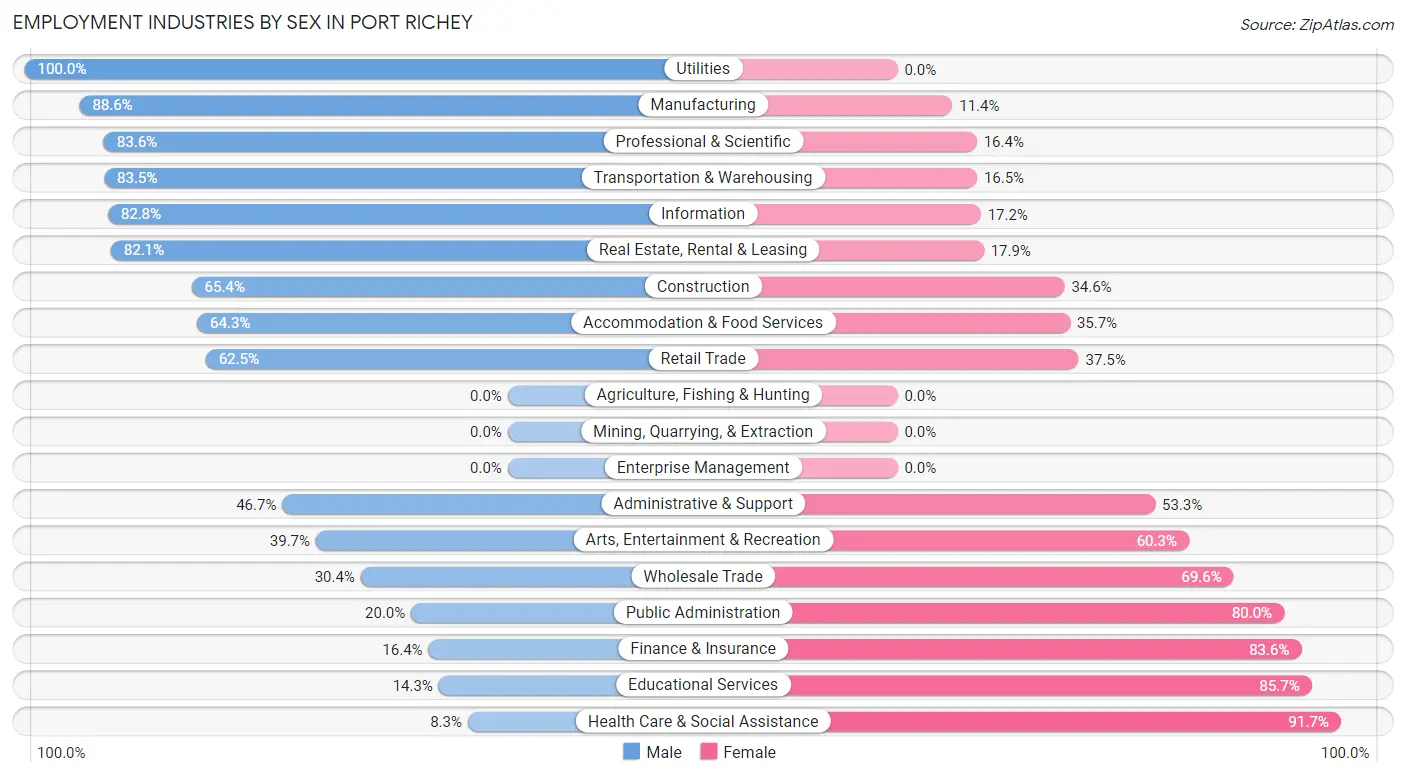
Employment Industries by Sex in Port Richey
The Port Richey industries that see more men than women are Utilities (100.0%), Manufacturing (88.6%), and Professional & Scientific (83.6%), whereas the industries that tend to have a higher number of women are Health Care & Social Assistance (91.7%), Educational Services (85.7%), and Finance & Insurance (83.6%).
| Industry | Male | Female |
| Agriculture, Fishing & Hunting | 0 (0.0%) | 0 (0.0%) |
| Mining, Quarrying, & Extraction | 0 (0.0%) | 0 (0.0%) |
| Construction | 123 (65.4%) | 65 (34.6%) |
| Manufacturing | 78 (88.6%) | 10 (11.4%) |
| Wholesale Trade | 21 (30.4%) | 48 (69.6%) |
| Retail Trade | 105 (62.5%) | 63 (37.5%) |
| Transportation & Warehousing | 66 (83.5%) | 13 (16.5%) |
| Utilities | 6 (100.0%) | 0 (0.0%) |
| Information | 24 (82.8%) | 5 (17.2%) |
| Finance & Insurance | 11 (16.4%) | 56 (83.6%) |
| Real Estate, Rental & Leasing | 23 (82.1%) | 5 (17.9%) |
| Professional & Scientific | 56 (83.6%) | 11 (16.4%) |
| Enterprise Management | 0 (0.0%) | 0 (0.0%) |
| Administrative & Support | 14 (46.7%) | 16 (53.3%) |
| Educational Services | 7 (14.3%) | 42 (85.7%) |
| Health Care & Social Assistance | 9 (8.3%) | 100 (91.7%) |
| Arts, Entertainment & Recreation | 27 (39.7%) | 41 (60.3%) |
| Accommodation & Food Services | 72 (64.3%) | 40 (35.7%) |
| Public Administration | 6 (20.0%) | 24 (80.0%) |
| Total | 655 (54.6%) | 545 (45.4%) |
Education in Port Richey
School Enrollment in Port Richey
The most common levels of schooling among the 554 students in Port Richey are college / undergraduate (225 | 40.6%), elementary school (102 | 18.4%), and middle school (92 | 16.6%).
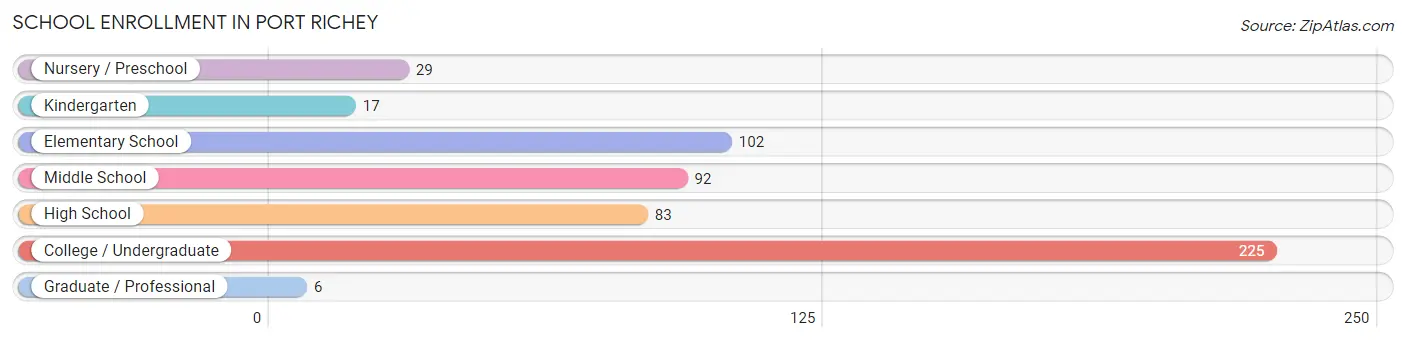
| School Level | # Students | % Students |
| Nursery / Preschool | 29 | 5.2% |
| Kindergarten | 17 | 3.1% |
| Elementary School | 102 | 18.4% |
| Middle School | 92 | 16.6% |
| High School | 83 | 15.0% |
| College / Undergraduate | 225 | 40.6% |
| Graduate / Professional | 6 | 1.1% |
| Total | 554 | 100.0% |
School Enrollment by Age by Funding Source in Port Richey
Out of a total of 554 students who are enrolled in schools in Port Richey, 234 (42.2%) attend a private institution, while the remaining 320 (57.8%) are enrolled in public schools. The age group of 25 to 34 year olds has the highest likelihood of being enrolled in private schools, with 41 (100.0% in the age bracket) enrolled. Conversely, the age group of 3 to 4 year olds has the lowest likelihood of being enrolled in a private school, with 23 (100.0% in the age bracket) attending a public institution.
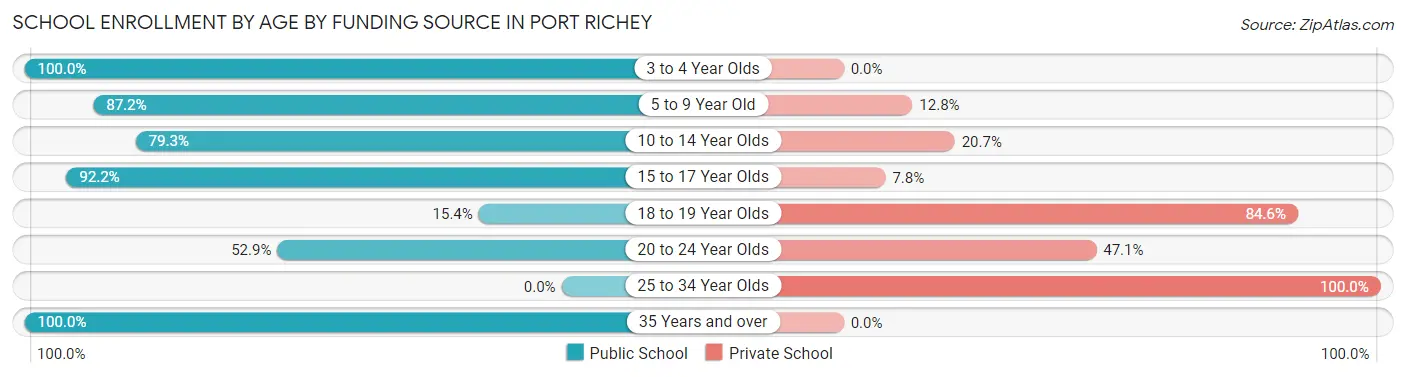
| Age Bracket | Public School | Private School |
| 3 to 4 Year Olds | 23 (100.0%) | 0 (0.0%) |
| 5 to 9 Year Old | 109 (87.2%) | 16 (12.8%) |
| 10 to 14 Year Olds | 69 (79.3%) | 18 (20.7%) |
| 15 to 17 Year Olds | 71 (92.2%) | 6 (7.8%) |
| 18 to 19 Year Olds | 25 (15.4%) | 137 (84.6%) |
| 20 to 24 Year Olds | 18 (52.9%) | 16 (47.1%) |
| 25 to 34 Year Olds | 0 (0.0%) | 41 (100.0%) |
| 35 Years and over | 5 (100.0%) | 0 (0.0%) |
| Total | 320 (57.8%) | 234 (42.2%) |
Educational Attainment by Field of Study in Port Richey
Business (188 | 25.8%), arts & humanities (132 | 18.1%), science & technology (119 | 16.3%), education (115 | 15.8%), and social sciences (53 | 7.3%) are the most common fields of study among 729 individuals in Port Richey who have obtained a bachelor's degree or higher.
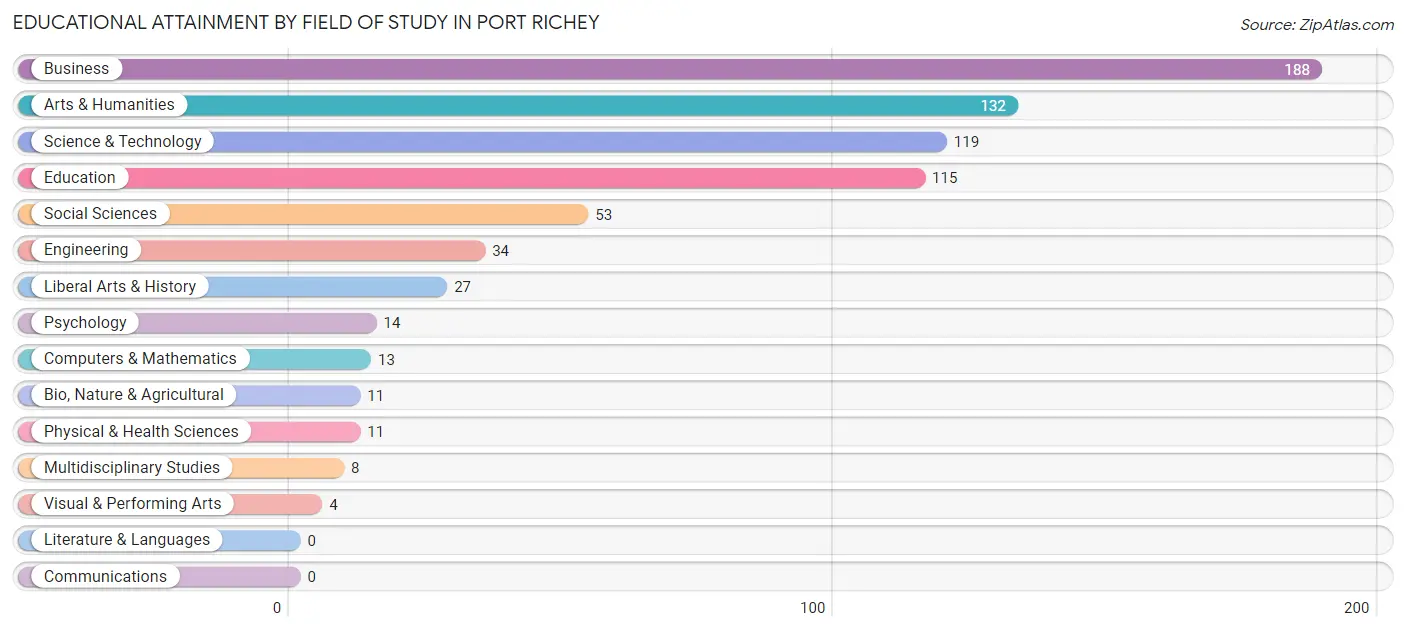
| Field of Study | # Graduates | % Graduates |
| Computers & Mathematics | 13 | 1.8% |
| Bio, Nature & Agricultural | 11 | 1.5% |
| Physical & Health Sciences | 11 | 1.5% |
| Psychology | 14 | 1.9% |
| Social Sciences | 53 | 7.3% |
| Engineering | 34 | 4.7% |
| Multidisciplinary Studies | 8 | 1.1% |
| Science & Technology | 119 | 16.3% |
| Business | 188 | 25.8% |
| Education | 115 | 15.8% |
| Literature & Languages | 0 | 0.0% |
| Liberal Arts & History | 27 | 3.7% |
| Visual & Performing Arts | 4 | 0.5% |
| Communications | 0 | 0.0% |
| Arts & Humanities | 132 | 18.1% |
| Total | 729 | 100.0% |
Transportation & Commute in Port Richey
Vehicle Availability by Sex in Port Richey
The most prevalent vehicle ownership categories in Port Richey are males with 2 vehicles (297, accounting for 46.6%) and females with 2 vehicles (252, making up 56.1%).
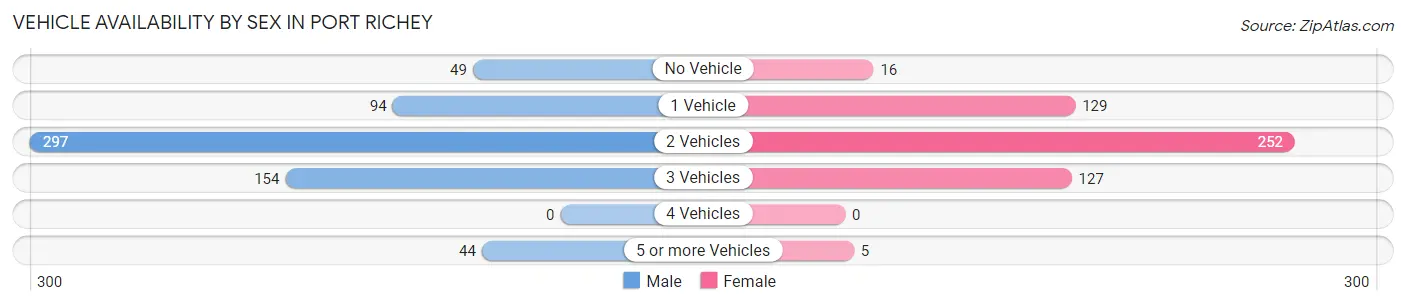
| Vehicles Available | Male | Female |
| No Vehicle | 49 (7.7%) | 16 (3.0%) |
| 1 Vehicle | 94 (14.7%) | 129 (24.4%) |
| 2 Vehicles | 297 (46.6%) | 252 (47.6%) |
| 3 Vehicles | 154 (24.1%) | 127 (24.0%) |
| 4 Vehicles | 0 (0.0%) | 0 (0.0%) |
| 5 or more Vehicles | 44 (6.9%) | 5 (0.9%) |
| Total | 638 (100.0%) | 529 (100.0%) |
Commute Time in Port Richey
The most frequently occuring commute durations in Port Richey are 20 to 24 minutes (215 commuters, 23.4%), 45 to 59 minutes (203 commuters, 22.1%), and 15 to 19 minutes (196 commuters, 21.3%).
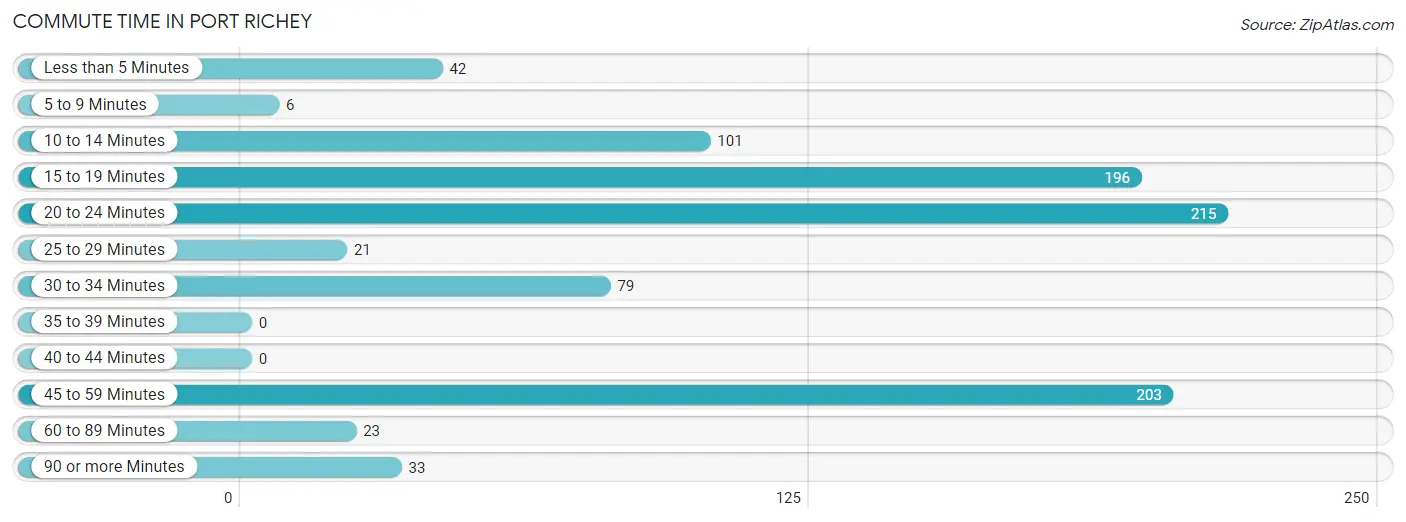
| Commute Time | # Commuters | % Commuters |
| Less than 5 Minutes | 42 | 4.6% |
| 5 to 9 Minutes | 6 | 0.6% |
| 10 to 14 Minutes | 101 | 11.0% |
| 15 to 19 Minutes | 196 | 21.3% |
| 20 to 24 Minutes | 215 | 23.4% |
| 25 to 29 Minutes | 21 | 2.3% |
| 30 to 34 Minutes | 79 | 8.6% |
| 35 to 39 Minutes | 0 | 0.0% |
| 40 to 44 Minutes | 0 | 0.0% |
| 45 to 59 Minutes | 203 | 22.1% |
| 60 to 89 Minutes | 23 | 2.5% |
| 90 or more Minutes | 33 | 3.6% |
Commute Time by Sex in Port Richey
The most common commute times in Port Richey are 45 to 59 minutes (140 commuters, 27.8%) for males and 20 to 24 minutes (146 commuters, 35.1%) for females.
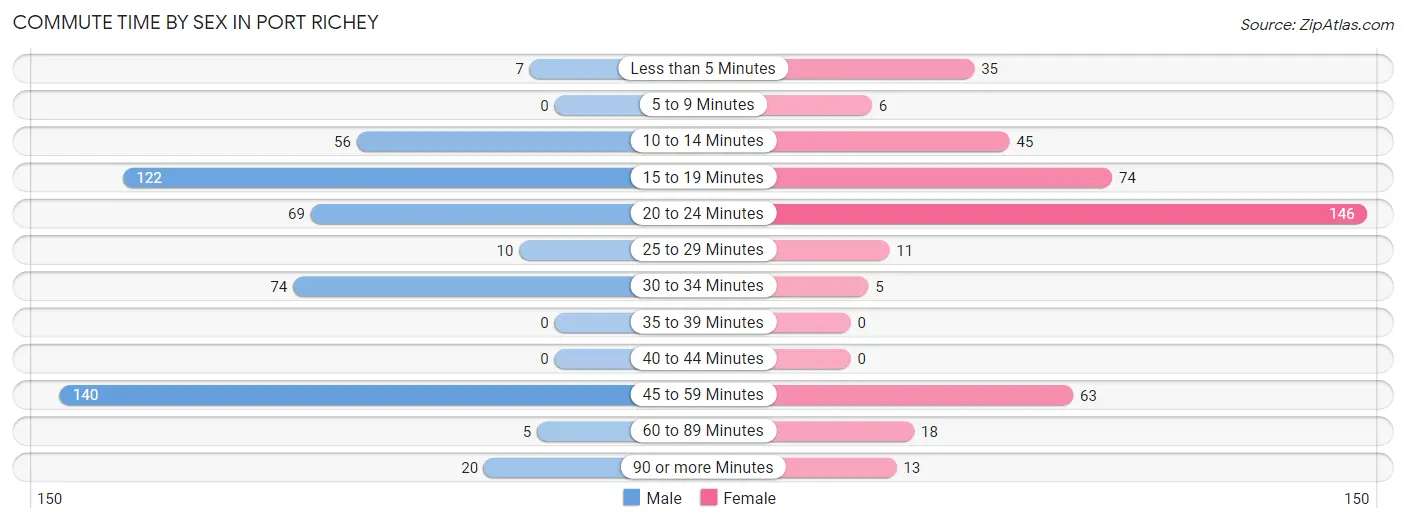
| Commute Time | Male | Female |
| Less than 5 Minutes | 7 (1.4%) | 35 (8.4%) |
| 5 to 9 Minutes | 0 (0.0%) | 6 (1.4%) |
| 10 to 14 Minutes | 56 (11.1%) | 45 (10.8%) |
| 15 to 19 Minutes | 122 (24.2%) | 74 (17.8%) |
| 20 to 24 Minutes | 69 (13.7%) | 146 (35.1%) |
| 25 to 29 Minutes | 10 (2.0%) | 11 (2.6%) |
| 30 to 34 Minutes | 74 (14.7%) | 5 (1.2%) |
| 35 to 39 Minutes | 0 (0.0%) | 0 (0.0%) |
| 40 to 44 Minutes | 0 (0.0%) | 0 (0.0%) |
| 45 to 59 Minutes | 140 (27.8%) | 63 (15.1%) |
| 60 to 89 Minutes | 5 (1.0%) | 18 (4.3%) |
| 90 or more Minutes | 20 (4.0%) | 13 (3.1%) |
Time of Departure to Work by Sex in Port Richey
The most frequent times of departure to work in Port Richey are 7:00 AM to 7:29 AM (108, 21.5%) for males and 7:00 AM to 7:29 AM (92, 22.1%) for females.
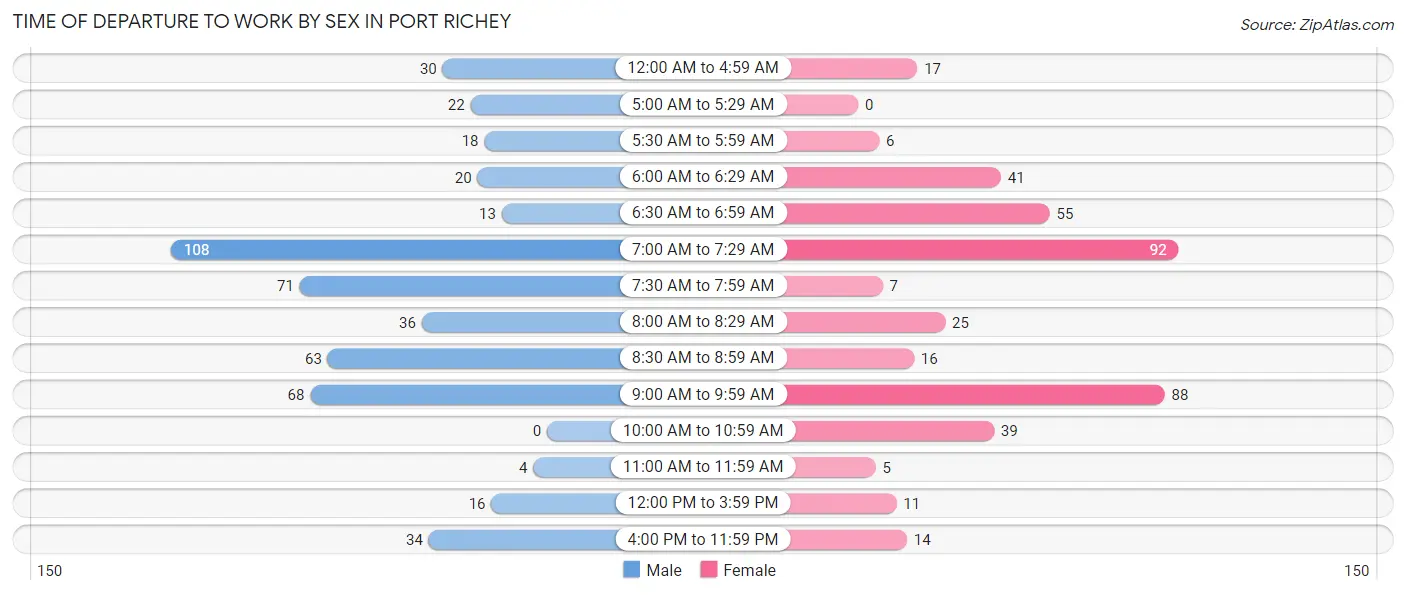
| Time of Departure | Male | Female |
| 12:00 AM to 4:59 AM | 30 (6.0%) | 17 (4.1%) |
| 5:00 AM to 5:29 AM | 22 (4.4%) | 0 (0.0%) |
| 5:30 AM to 5:59 AM | 18 (3.6%) | 6 (1.4%) |
| 6:00 AM to 6:29 AM | 20 (4.0%) | 41 (9.9%) |
| 6:30 AM to 6:59 AM | 13 (2.6%) | 55 (13.2%) |
| 7:00 AM to 7:29 AM | 108 (21.5%) | 92 (22.1%) |
| 7:30 AM to 7:59 AM | 71 (14.1%) | 7 (1.7%) |
| 8:00 AM to 8:29 AM | 36 (7.2%) | 25 (6.0%) |
| 8:30 AM to 8:59 AM | 63 (12.5%) | 16 (3.8%) |
| 9:00 AM to 9:59 AM | 68 (13.5%) | 88 (21.1%) |
| 10:00 AM to 10:59 AM | 0 (0.0%) | 39 (9.4%) |
| 11:00 AM to 11:59 AM | 4 (0.8%) | 5 (1.2%) |
| 12:00 PM to 3:59 PM | 16 (3.2%) | 11 (2.6%) |
| 4:00 PM to 11:59 PM | 34 (6.8%) | 14 (3.4%) |
| Total | 503 (100.0%) | 416 (100.0%) |
Housing Occupancy in Port Richey
Occupancy by Ownership in Port Richey
Of the total 1,458 dwellings in Port Richey, owner-occupied units account for 895 (61.4%), while renter-occupied units make up 563 (38.6%).
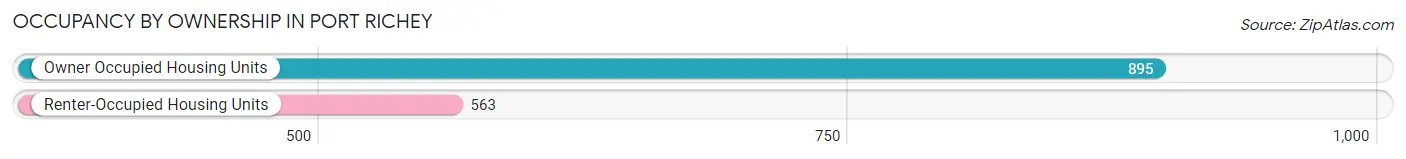
| Occupancy | # Housing Units | % Housing Units |
| Owner Occupied Housing Units | 895 | 61.4% |
| Renter-Occupied Housing Units | 563 | 38.6% |
| Total Occupied Housing Units | 1,458 | 100.0% |
Occupancy by Household Size in Port Richey
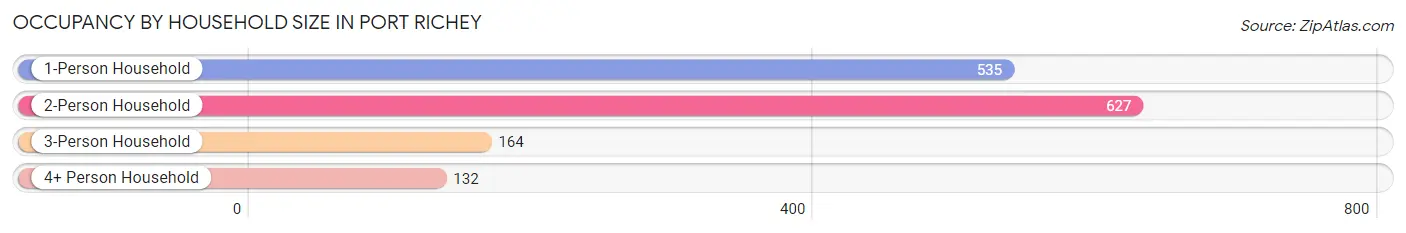
| Household Size | # Housing Units | % Housing Units |
| 1-Person Household | 535 | 36.7% |
| 2-Person Household | 627 | 43.0% |
| 3-Person Household | 164 | 11.3% |
| 4+ Person Household | 132 | 9.0% |
| Total Housing Units | 1,458 | 100.0% |
Occupancy by Ownership by Household Size in Port Richey
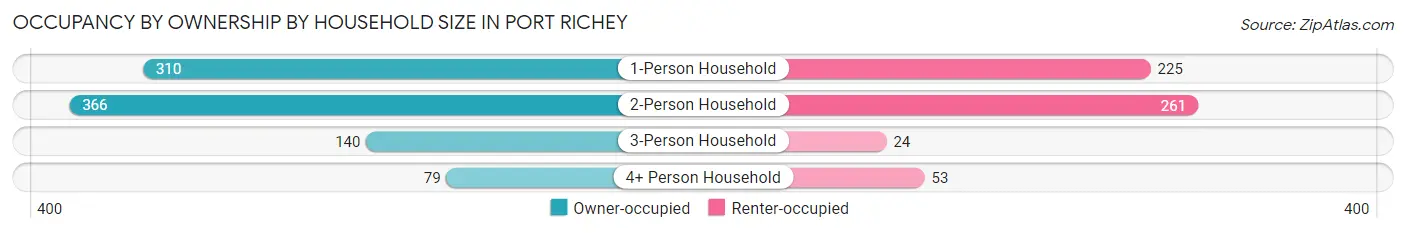
| Household Size | Owner-occupied | Renter-occupied |
| 1-Person Household | 310 (57.9%) | 225 (42.1%) |
| 2-Person Household | 366 (58.4%) | 261 (41.6%) |
| 3-Person Household | 140 (85.4%) | 24 (14.6%) |
| 4+ Person Household | 79 (59.9%) | 53 (40.2%) |
| Total Housing Units | 895 (61.4%) | 563 (38.6%) |
Occupancy by Educational Attainment in Port Richey
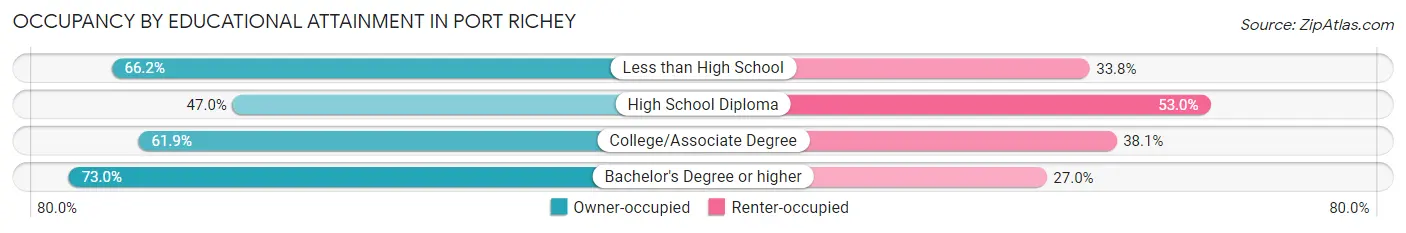
| Household Size | Owner-occupied | Renter-occupied |
| Less than High School | 47 (66.2%) | 24 (33.8%) |
| High School Diploma | 196 (47.0%) | 221 (53.0%) |
| College/Associate Degree | 314 (61.9%) | 193 (38.1%) |
| Bachelor's Degree or higher | 338 (73.0%) | 125 (27.0%) |
Occupancy by Age of Householder in Port Richey
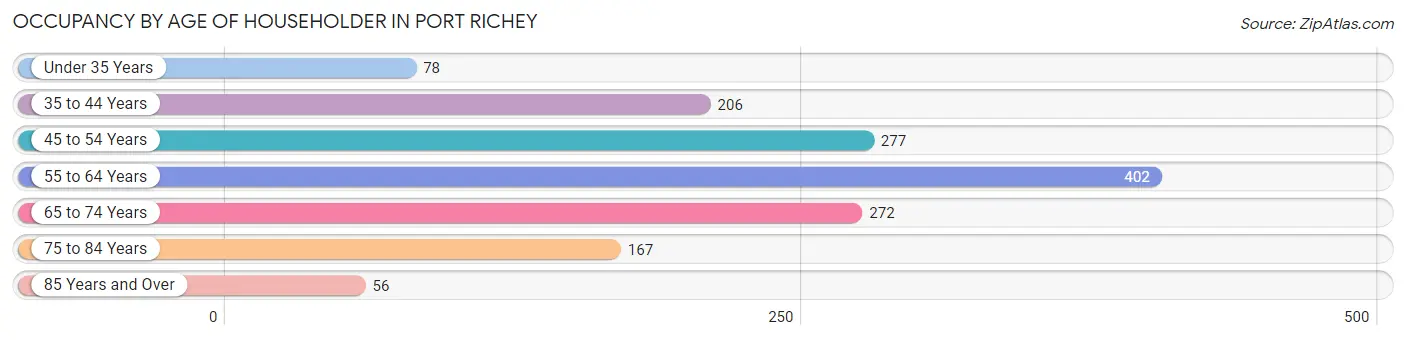
| Age Bracket | # Households | % Households |
| Under 35 Years | 78 | 5.3% |
| 35 to 44 Years | 206 | 14.1% |
| 45 to 54 Years | 277 | 19.0% |
| 55 to 64 Years | 402 | 27.6% |
| 65 to 74 Years | 272 | 18.7% |
| 75 to 84 Years | 167 | 11.5% |
| 85 Years and Over | 56 | 3.8% |
| Total | 1,458 | 100.0% |
Housing Finances in Port Richey
Median Income by Occupancy in Port Richey
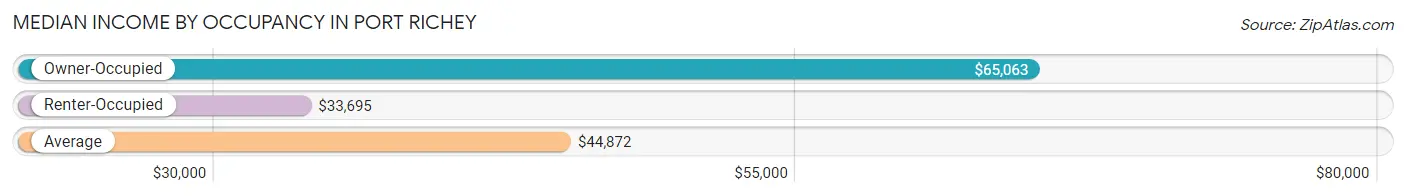
| Occupancy Type | # Households | Median Income |
| Owner-Occupied | 895 (61.4%) | $65,063 |
| Renter-Occupied | 563 (38.6%) | $33,695 |
| Average | 1,458 (100.0%) | $44,872 |
Occupancy by Householder Income Bracket in Port Richey
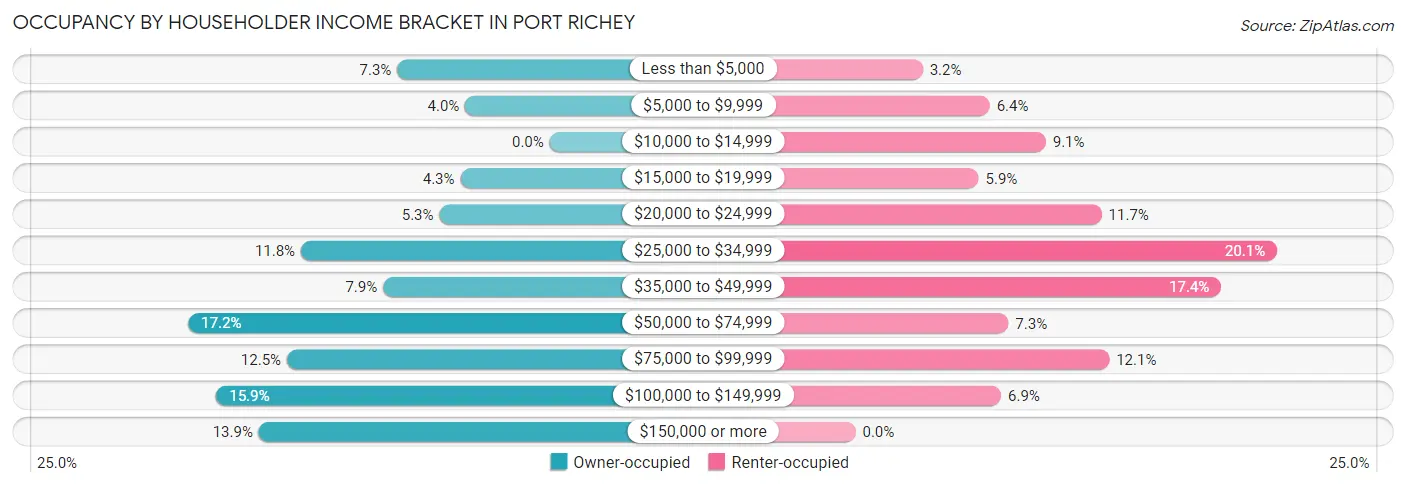
| Income Bracket | Owner-occupied | Renter-occupied |
| Less than $5,000 | 65 (7.3%) | 18 (3.2%) |
| $5,000 to $9,999 | 36 (4.0%) | 36 (6.4%) |
| $10,000 to $14,999 | 0 (0.0%) | 51 (9.1%) |
| $15,000 to $19,999 | 38 (4.3%) | 33 (5.9%) |
| $20,000 to $24,999 | 47 (5.2%) | 66 (11.7%) |
| $25,000 to $34,999 | 106 (11.8%) | 113 (20.1%) |
| $35,000 to $49,999 | 71 (7.9%) | 98 (17.4%) |
| $50,000 to $74,999 | 154 (17.2%) | 41 (7.3%) |
| $75,000 to $99,999 | 112 (12.5%) | 68 (12.1%) |
| $100,000 to $149,999 | 142 (15.9%) | 39 (6.9%) |
| $150,000 or more | 124 (13.9%) | 0 (0.0%) |
| Total | 895 (100.0%) | 563 (100.0%) |
Monthly Housing Cost Tiers in Port Richey
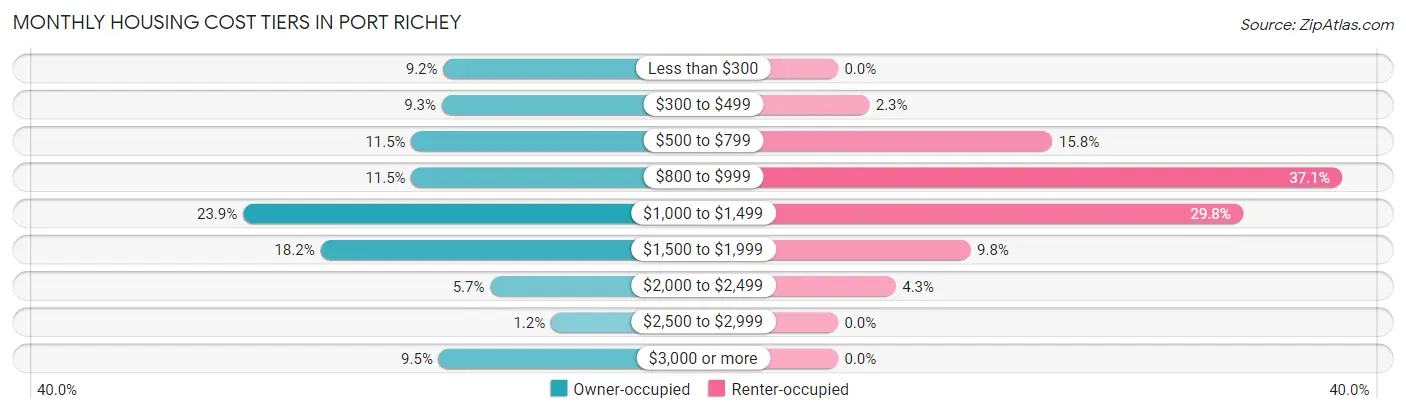
| Monthly Cost | Owner-occupied | Renter-occupied |
| Less than $300 | 82 (9.2%) | 0 (0.0%) |
| $300 to $499 | 83 (9.3%) | 13 (2.3%) |
| $500 to $799 | 103 (11.5%) | 89 (15.8%) |
| $800 to $999 | 103 (11.5%) | 209 (37.1%) |
| $1,000 to $1,499 | 214 (23.9%) | 168 (29.8%) |
| $1,500 to $1,999 | 163 (18.2%) | 55 (9.8%) |
| $2,000 to $2,499 | 51 (5.7%) | 24 (4.3%) |
| $2,500 to $2,999 | 11 (1.2%) | 0 (0.0%) |
| $3,000 or more | 85 (9.5%) | 0 (0.0%) |
| Total | 895 (100.0%) | 563 (100.0%) |
Physical Housing Characteristics in Port Richey
Housing Structures in Port Richey
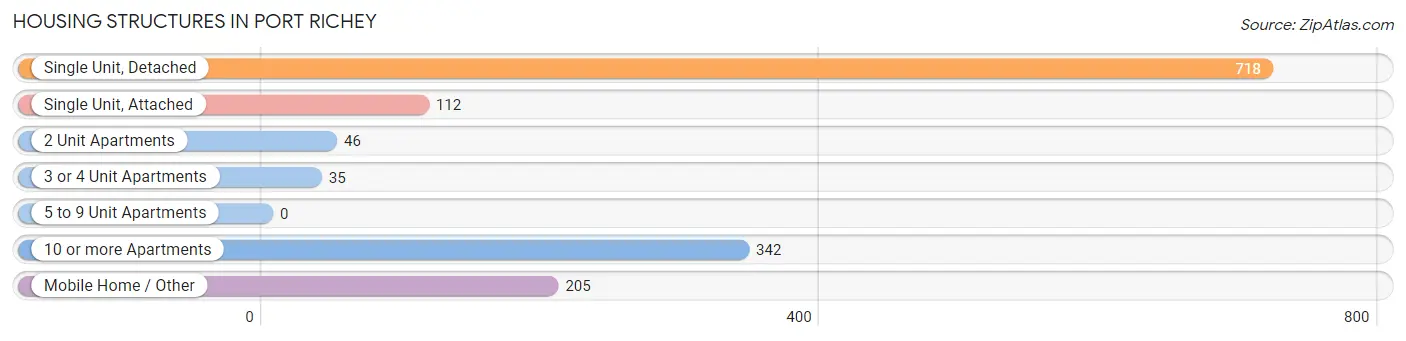
| Structure Type | # Housing Units | % Housing Units |
| Single Unit, Detached | 718 | 49.2% |
| Single Unit, Attached | 112 | 7.7% |
| 2 Unit Apartments | 46 | 3.2% |
| 3 or 4 Unit Apartments | 35 | 2.4% |
| 5 to 9 Unit Apartments | 0 | 0.0% |
| 10 or more Apartments | 342 | 23.5% |
| Mobile Home / Other | 205 | 14.1% |
| Total | 1,458 | 100.0% |
Housing Structures by Occupancy in Port Richey
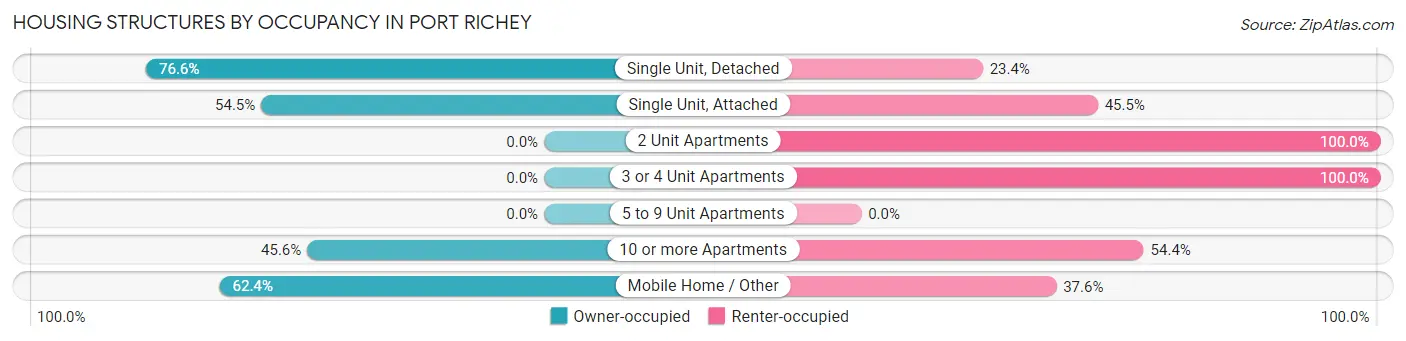
| Structure Type | Owner-occupied | Renter-occupied |
| Single Unit, Detached | 550 (76.6%) | 168 (23.4%) |
| Single Unit, Attached | 61 (54.5%) | 51 (45.5%) |
| 2 Unit Apartments | 0 (0.0%) | 46 (100.0%) |
| 3 or 4 Unit Apartments | 0 (0.0%) | 35 (100.0%) |
| 5 to 9 Unit Apartments | 0 (0.0%) | 0 (0.0%) |
| 10 or more Apartments | 156 (45.6%) | 186 (54.4%) |
| Mobile Home / Other | 128 (62.4%) | 77 (37.6%) |
| Total | 895 (61.4%) | 563 (38.6%) |
Housing Structures by Number of Rooms in Port Richey
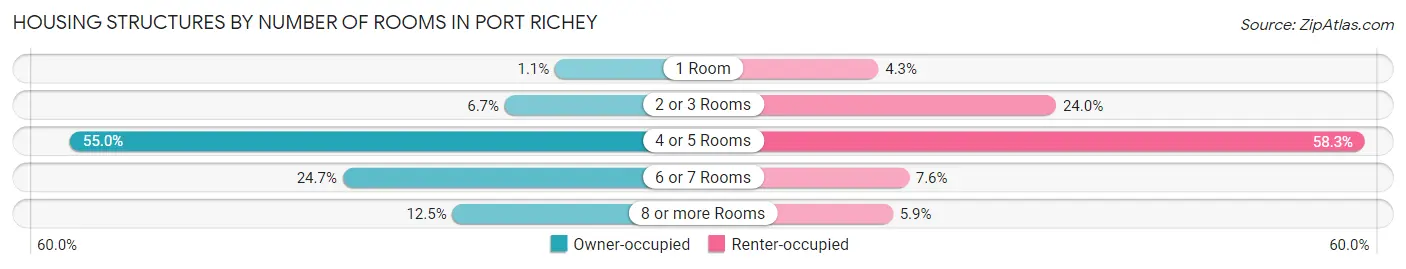
| Number of Rooms | Owner-occupied | Renter-occupied |
| 1 Room | 10 (1.1%) | 24 (4.3%) |
| 2 or 3 Rooms | 60 (6.7%) | 135 (24.0%) |
| 4 or 5 Rooms | 492 (55.0%) | 328 (58.3%) |
| 6 or 7 Rooms | 221 (24.7%) | 43 (7.6%) |
| 8 or more Rooms | 112 (12.5%) | 33 (5.9%) |
| Total | 895 (100.0%) | 563 (100.0%) |
Housing Structure by Heating Type in Port Richey
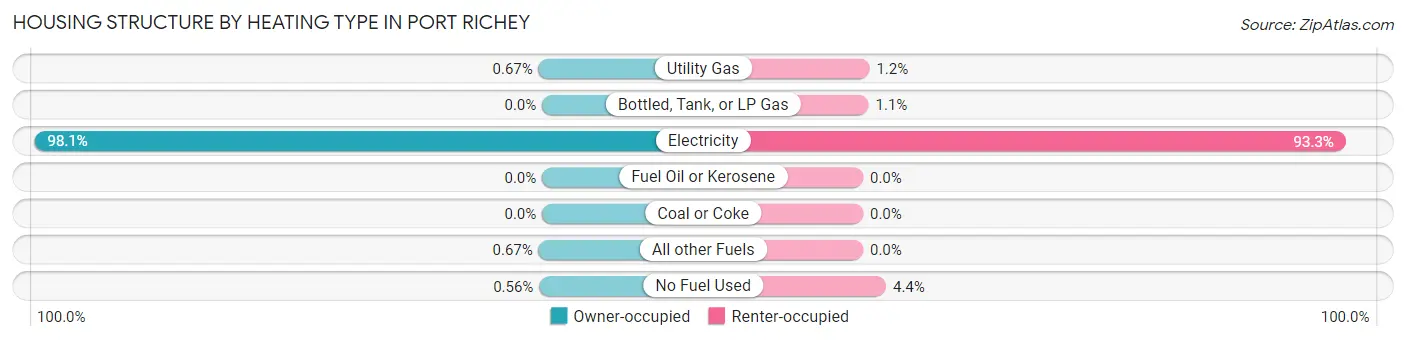
| Heating Type | Owner-occupied | Renter-occupied |
| Utility Gas | 6 (0.7%) | 7 (1.2%) |
| Bottled, Tank, or LP Gas | 0 (0.0%) | 6 (1.1%) |
| Electricity | 878 (98.1%) | 525 (93.2%) |
| Fuel Oil or Kerosene | 0 (0.0%) | 0 (0.0%) |
| Coal or Coke | 0 (0.0%) | 0 (0.0%) |
| All other Fuels | 6 (0.7%) | 0 (0.0%) |
| No Fuel Used | 5 (0.6%) | 25 (4.4%) |
| Total | 895 (100.0%) | 563 (100.0%) |
Household Vehicle Usage in Port Richey
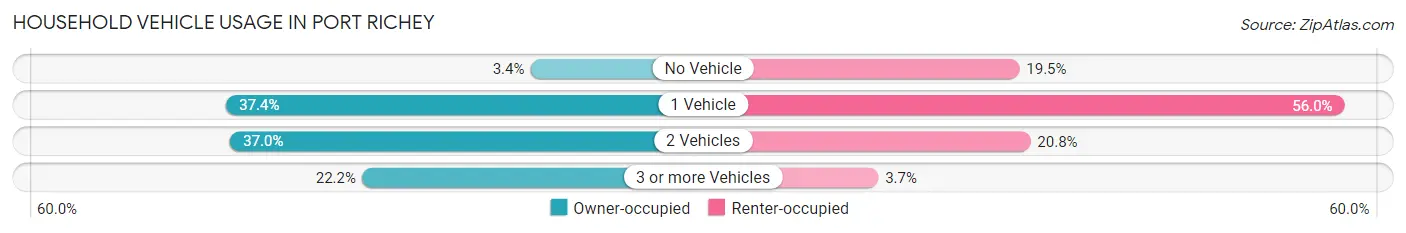
| Vehicles per Household | Owner-occupied | Renter-occupied |
| No Vehicle | 30 (3.4%) | 110 (19.5%) |
| 1 Vehicle | 335 (37.4%) | 315 (55.9%) |
| 2 Vehicles | 331 (37.0%) | 117 (20.8%) |
| 3 or more Vehicles | 199 (22.2%) | 21 (3.7%) |
| Total | 895 (100.0%) | 563 (100.0%) |
Real Estate & Mortgages in Port Richey
Real Estate and Mortgage Overview in Port Richey
| Characteristic | Without Mortgage | With Mortgage |
| Housing Units | 427 | 468 |
| Median Property Value | $211,100 | $264,000 |
| Median Household Income | $43,173 | $78 |
| Monthly Housing Costs | $760 | $69 |
| Real Estate Taxes | $1,707 | $0 |
Property Value by Mortgage Status in Port Richey
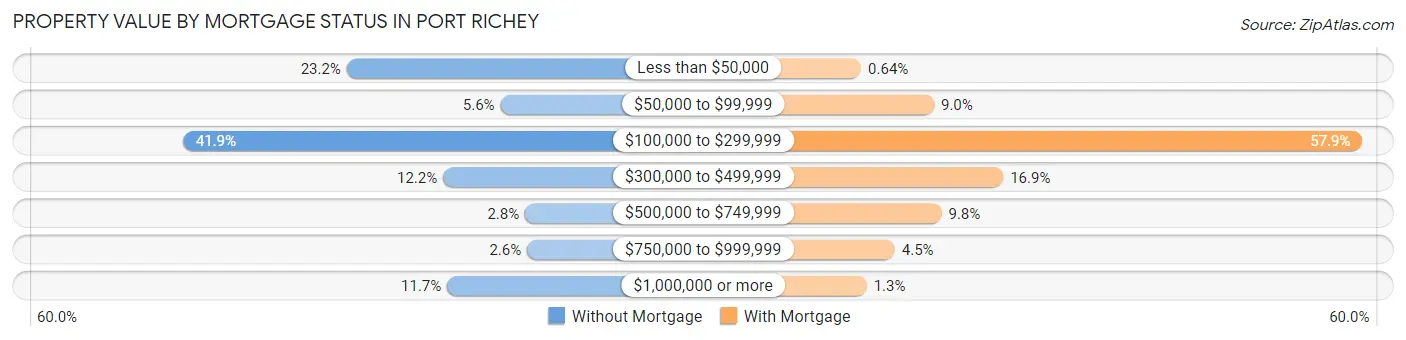
| Property Value | Without Mortgage | With Mortgage |
| Less than $50,000 | 99 (23.2%) | 3 (0.6%) |
| $50,000 to $99,999 | 24 (5.6%) | 42 (9.0%) |
| $100,000 to $299,999 | 179 (41.9%) | 271 (57.9%) |
| $300,000 to $499,999 | 52 (12.2%) | 79 (16.9%) |
| $500,000 to $749,999 | 12 (2.8%) | 46 (9.8%) |
| $750,000 to $999,999 | 11 (2.6%) | 21 (4.5%) |
| $1,000,000 or more | 50 (11.7%) | 6 (1.3%) |
| Total | 427 (100.0%) | 468 (100.0%) |
Household Income by Mortgage Status in Port Richey
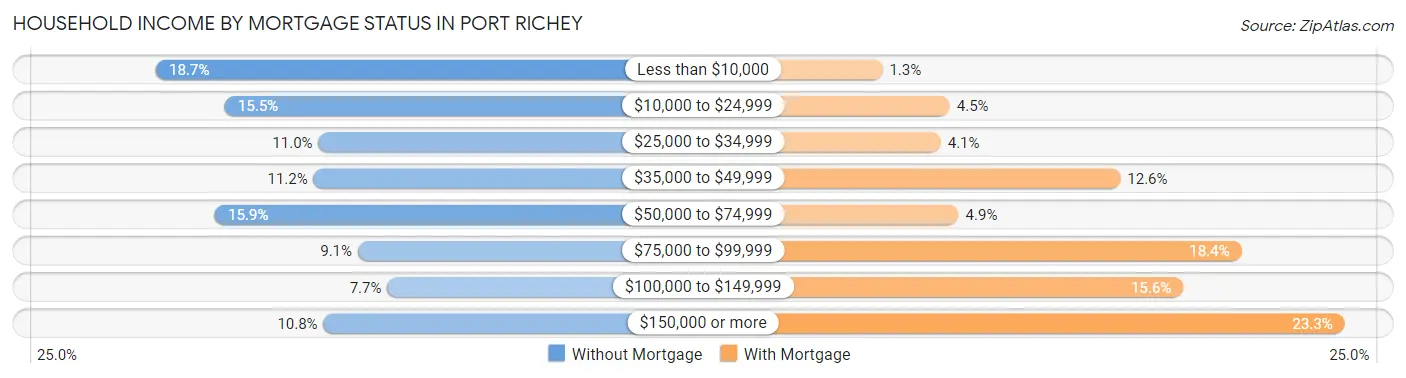
| Household Income | Without Mortgage | With Mortgage |
| Less than $10,000 | 80 (18.7%) | 6 (1.3%) |
| $10,000 to $24,999 | 66 (15.5%) | 21 (4.5%) |
| $25,000 to $34,999 | 47 (11.0%) | 19 (4.1%) |
| $35,000 to $49,999 | 48 (11.2%) | 59 (12.6%) |
| $50,000 to $74,999 | 68 (15.9%) | 23 (4.9%) |
| $75,000 to $99,999 | 39 (9.1%) | 86 (18.4%) |
| $100,000 to $149,999 | 33 (7.7%) | 73 (15.6%) |
| $150,000 or more | 46 (10.8%) | 109 (23.3%) |
| Total | 427 (100.0%) | 468 (100.0%) |
Property Value to Household Income Ratio in Port Richey
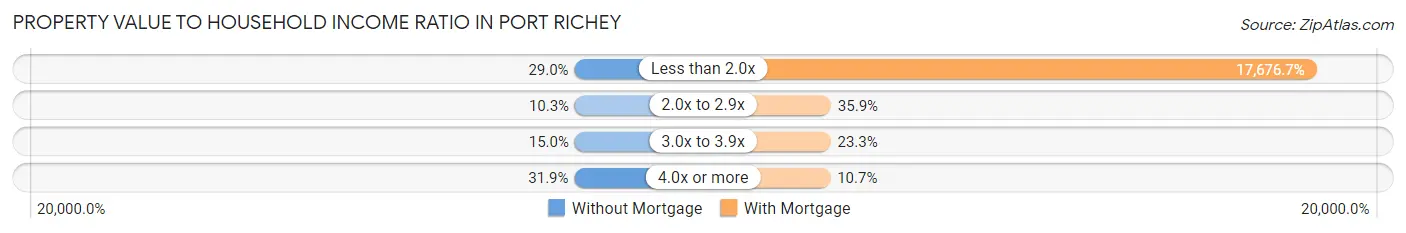
| Value-to-Income Ratio | Without Mortgage | With Mortgage |
| Less than 2.0x | 124 (29.0%) | 82,727 (17,676.7%) |
| 2.0x to 2.9x | 44 (10.3%) | 168 (35.9%) |
| 3.0x to 3.9x | 64 (15.0%) | 109 (23.3%) |
| 4.0x or more | 136 (31.9%) | 50 (10.7%) |
| Total | 427 (100.0%) | 468 (100.0%) |
Real Estate Taxes by Mortgage Status in Port Richey
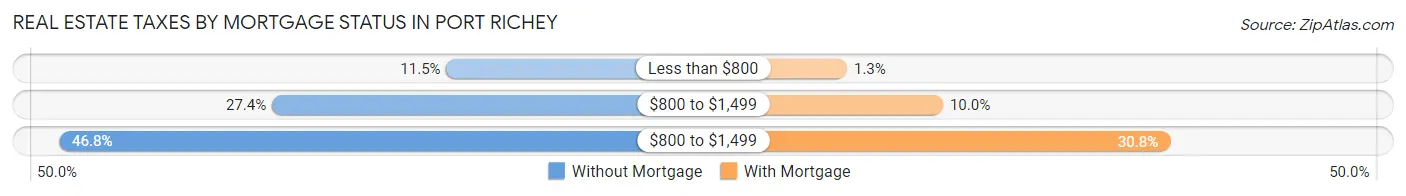
| Property Taxes | Without Mortgage | With Mortgage |
| Less than $800 | 49 (11.5%) | 6 (1.3%) |
| $800 to $1,499 | 117 (27.4%) | 47 (10.0%) |
| $800 to $1,499 | 200 (46.8%) | 144 (30.8%) |
| Total | 427 (100.0%) | 468 (100.0%) |
Health & Disability in Port Richey
Health Insurance Coverage by Age in Port Richey
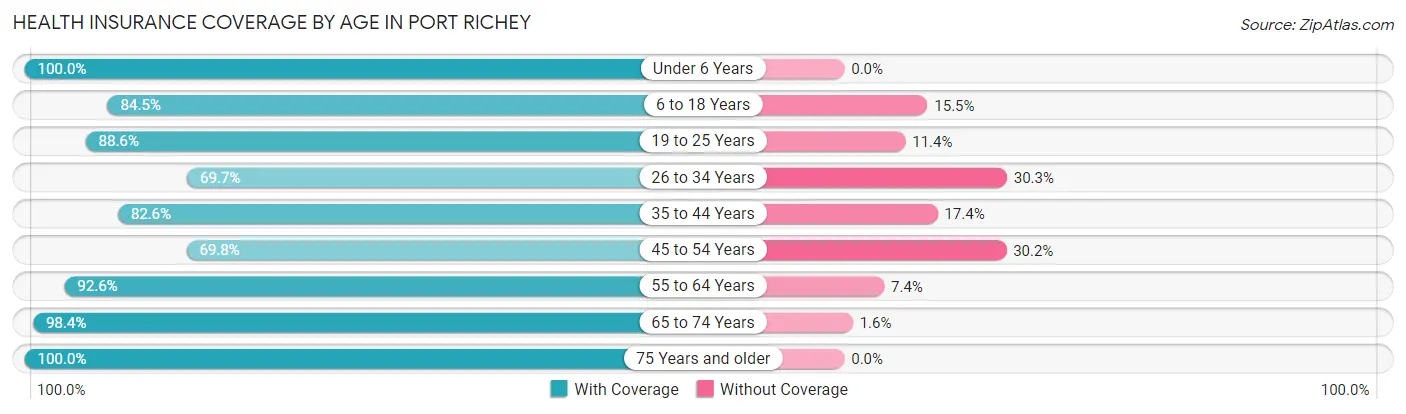
| Age Bracket | With Coverage | Without Coverage |
| Under 6 Years | 124 (100.0%) | 0 (0.0%) |
| 6 to 18 Years | 371 (84.5%) | 68 (15.5%) |
| 19 to 25 Years | 148 (88.6%) | 19 (11.4%) |
| 26 to 34 Years | 138 (69.7%) | 60 (30.3%) |
| 35 to 44 Years | 290 (82.6%) | 61 (17.4%) |
| 45 to 54 Years | 363 (69.8%) | 157 (30.2%) |
| 55 to 64 Years | 548 (92.6%) | 44 (7.4%) |
| 65 to 74 Years | 377 (98.4%) | 6 (1.6%) |
| 75 Years and older | 315 (100.0%) | 0 (0.0%) |
| Total | 2,674 (86.6%) | 415 (13.4%) |
Health Insurance Coverage by Citizenship Status in Port Richey
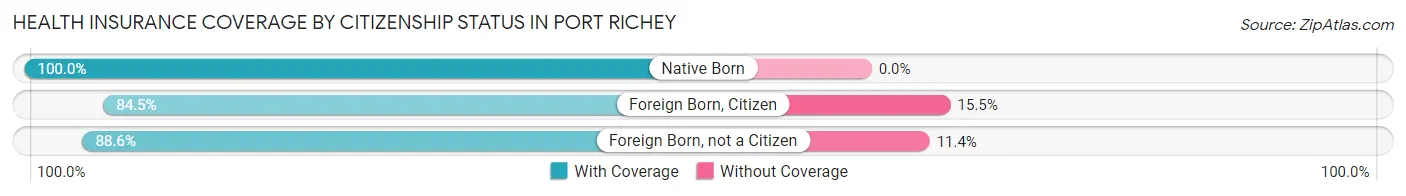
| Citizenship Status | With Coverage | Without Coverage |
| Native Born | 124 (100.0%) | 0 (0.0%) |
| Foreign Born, Citizen | 371 (84.5%) | 68 (15.5%) |
| Foreign Born, not a Citizen | 148 (88.6%) | 19 (11.4%) |
Health Insurance Coverage by Household Income in Port Richey
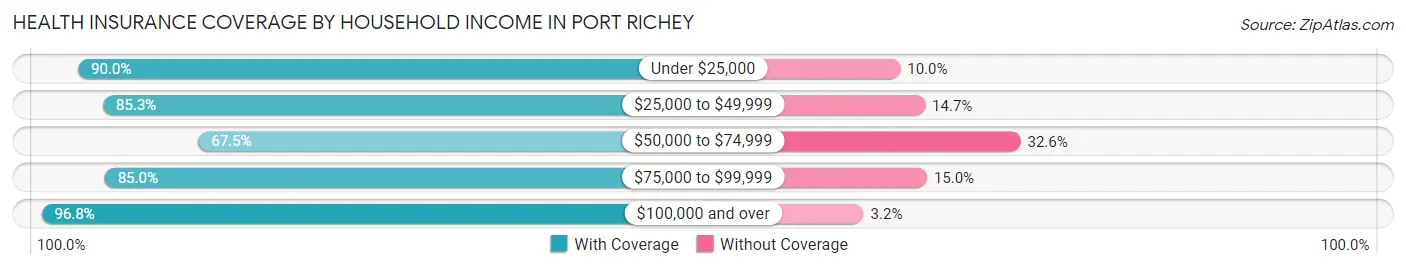
| Household Income | With Coverage | Without Coverage |
| Under $25,000 | 539 (90.0%) | 60 (10.0%) |
| $25,000 to $49,999 | 622 (85.3%) | 107 (14.7%) |
| $50,000 to $74,999 | 315 (67.4%) | 152 (32.6%) |
| $75,000 to $99,999 | 396 (85.0%) | 70 (15.0%) |
| $100,000 and over | 797 (96.8%) | 26 (3.2%) |
Public vs Private Health Insurance Coverage by Age in Port Richey
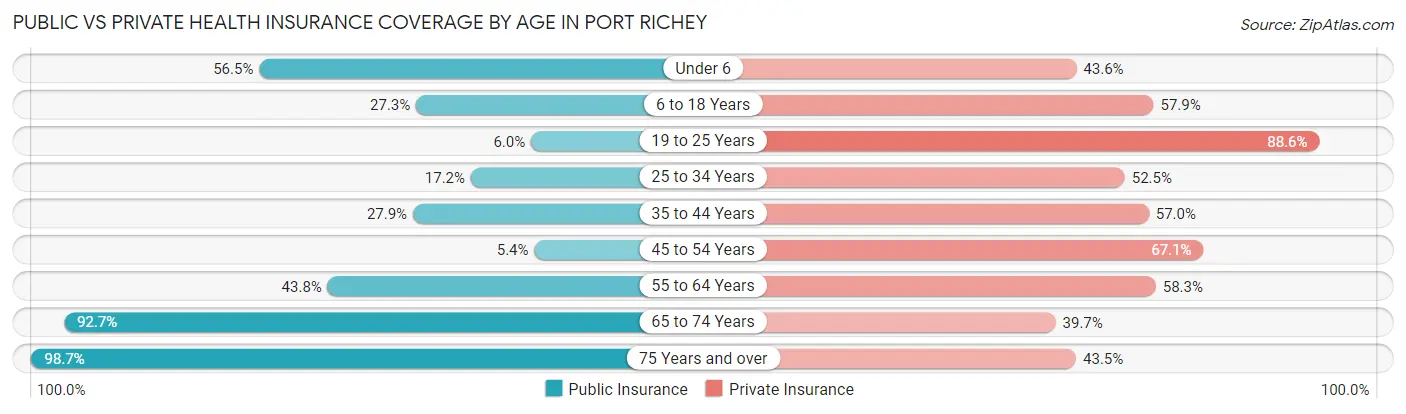
| Age Bracket | Public Insurance | Private Insurance |
| Under 6 | 70 (56.5%) | 54 (43.5%) |
| 6 to 18 Years | 120 (27.3%) | 254 (57.9%) |
| 19 to 25 Years | 10 (6.0%) | 148 (88.6%) |
| 25 to 34 Years | 34 (17.2%) | 104 (52.5%) |
| 35 to 44 Years | 98 (27.9%) | 200 (57.0%) |
| 45 to 54 Years | 28 (5.4%) | 349 (67.1%) |
| 55 to 64 Years | 259 (43.8%) | 345 (58.3%) |
| 65 to 74 Years | 355 (92.7%) | 152 (39.7%) |
| 75 Years and over | 311 (98.7%) | 137 (43.5%) |
| Total | 1,285 (41.6%) | 1,743 (56.4%) |
Disability Status by Sex by Age in Port Richey
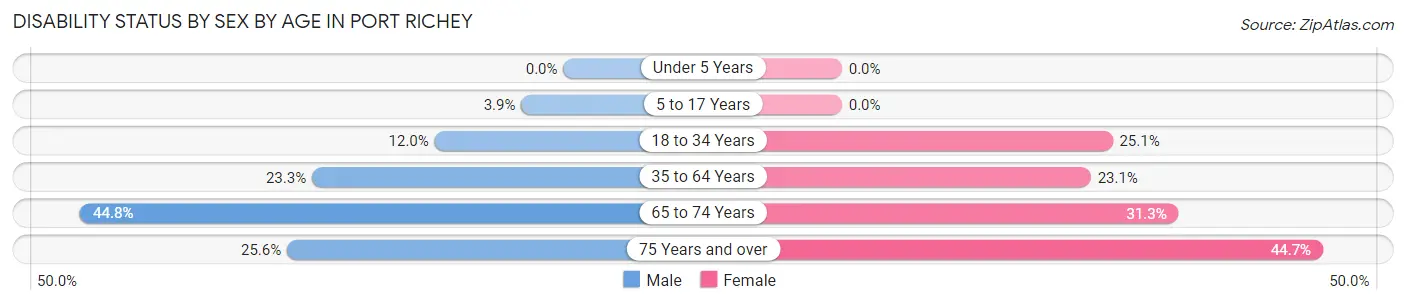
| Age Bracket | Male | Female |
| Under 5 Years | 0 (0.0%) | 0 (0.0%) |
| 5 to 17 Years | 6 (3.9%) | 0 (0.0%) |
| 18 to 34 Years | 35 (11.9%) | 54 (25.1%) |
| 35 to 64 Years | 203 (23.3%) | 137 (23.1%) |
| 65 to 74 Years | 100 (44.8%) | 50 (31.2%) |
| 75 Years and over | 40 (25.6%) | 71 (44.7%) |
Disability Class by Sex by Age in Port Richey
Disability Class: Hearing Difficulty
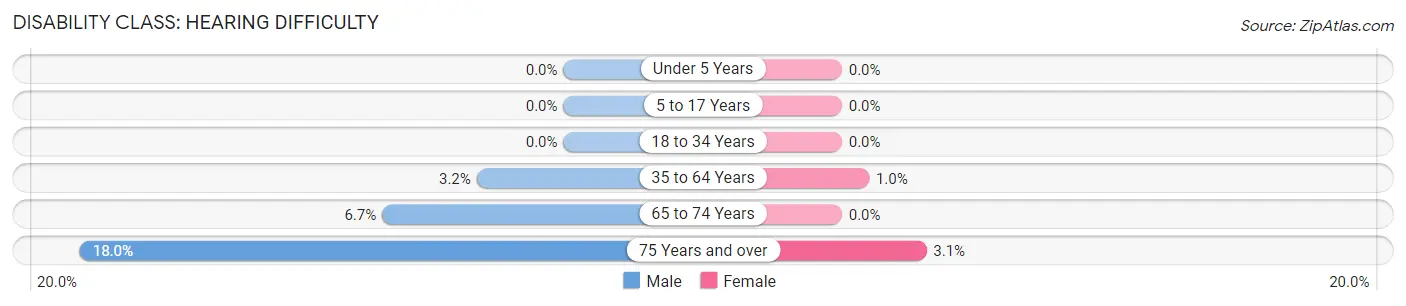
| Age Bracket | Male | Female |
| Under 5 Years | 0 (0.0%) | 0 (0.0%) |
| 5 to 17 Years | 0 (0.0%) | 0 (0.0%) |
| 18 to 34 Years | 0 (0.0%) | 0 (0.0%) |
| 35 to 64 Years | 28 (3.2%) | 6 (1.0%) |
| 65 to 74 Years | 15 (6.7%) | 0 (0.0%) |
| 75 Years and over | 28 (17.9%) | 5 (3.1%) |
Disability Class: Vision Difficulty
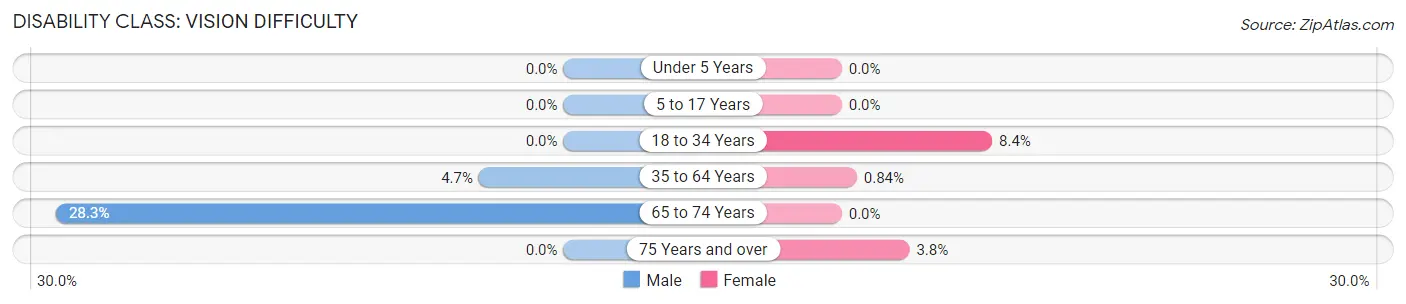
| Age Bracket | Male | Female |
| Under 5 Years | 0 (0.0%) | 0 (0.0%) |
| 5 to 17 Years | 0 (0.0%) | 0 (0.0%) |
| 18 to 34 Years | 0 (0.0%) | 18 (8.4%) |
| 35 to 64 Years | 41 (4.7%) | 5 (0.8%) |
| 65 to 74 Years | 63 (28.2%) | 0 (0.0%) |
| 75 Years and over | 0 (0.0%) | 6 (3.8%) |
Disability Class: Cognitive Difficulty
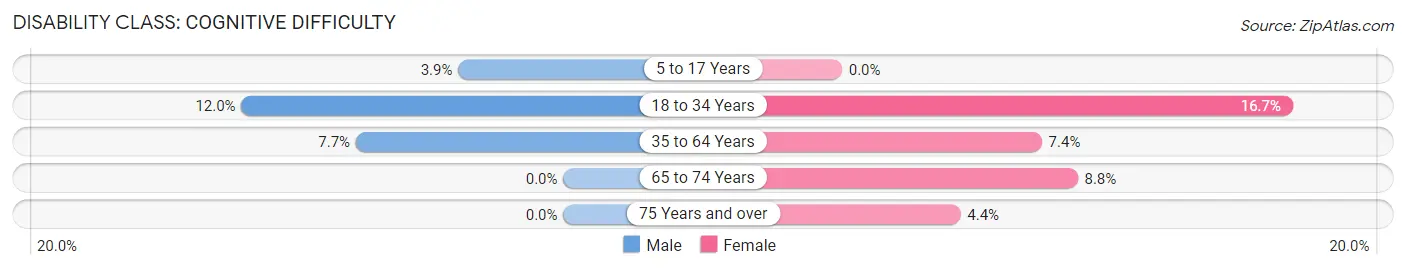
| Age Bracket | Male | Female |
| 5 to 17 Years | 6 (3.9%) | 0 (0.0%) |
| 18 to 34 Years | 35 (11.9%) | 36 (16.7%) |
| 35 to 64 Years | 67 (7.7%) | 44 (7.4%) |
| 65 to 74 Years | 0 (0.0%) | 14 (8.7%) |
| 75 Years and over | 0 (0.0%) | 7 (4.4%) |
Disability Class: Ambulatory Difficulty
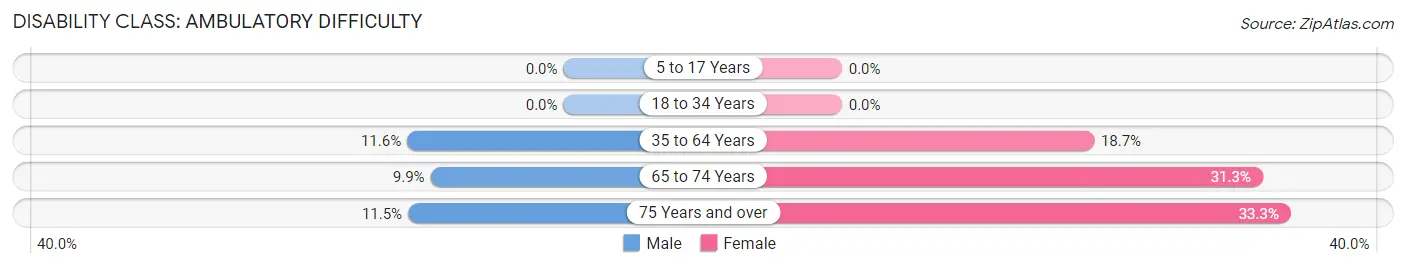
| Age Bracket | Male | Female |
| 5 to 17 Years | 0 (0.0%) | 0 (0.0%) |
| 18 to 34 Years | 0 (0.0%) | 0 (0.0%) |
| 35 to 64 Years | 101 (11.6%) | 111 (18.7%) |
| 65 to 74 Years | 22 (9.9%) | 50 (31.2%) |
| 75 Years and over | 18 (11.5%) | 53 (33.3%) |
Disability Class: Self-Care Difficulty
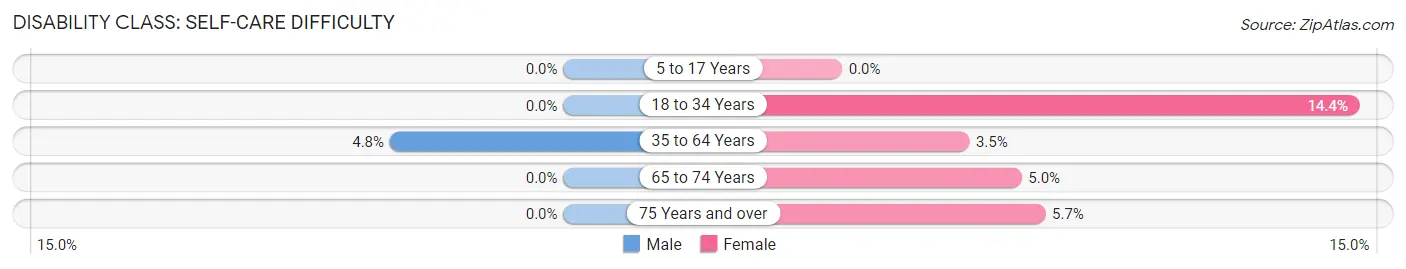
| Age Bracket | Male | Female |
| 5 to 17 Years | 0 (0.0%) | 0 (0.0%) |
| 18 to 34 Years | 0 (0.0%) | 31 (14.4%) |
| 35 to 64 Years | 42 (4.8%) | 21 (3.5%) |
| 65 to 74 Years | 0 (0.0%) | 8 (5.0%) |
| 75 Years and over | 0 (0.0%) | 9 (5.7%) |
Technology Access in Port Richey
Computing Device Access in Port Richey
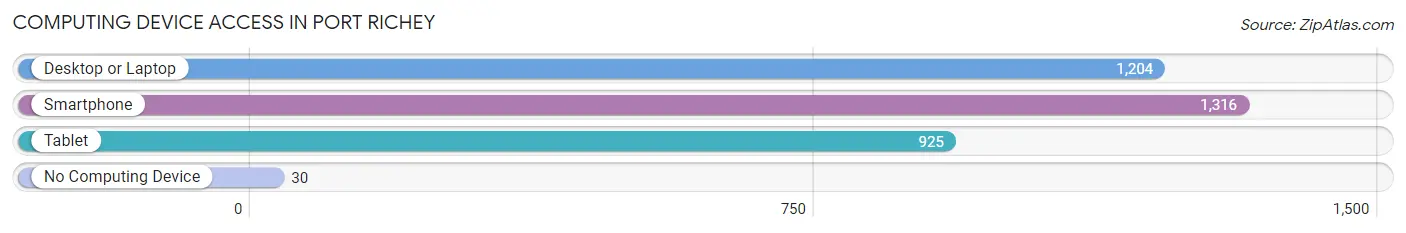
| Device Type | # Households | % Households |
| Desktop or Laptop | 1,204 | 82.6% |
| Smartphone | 1,316 | 90.3% |
| Tablet | 925 | 63.4% |
| No Computing Device | 30 | 2.1% |
| Total | 1,458 | 100.0% |
Internet Access in Port Richey
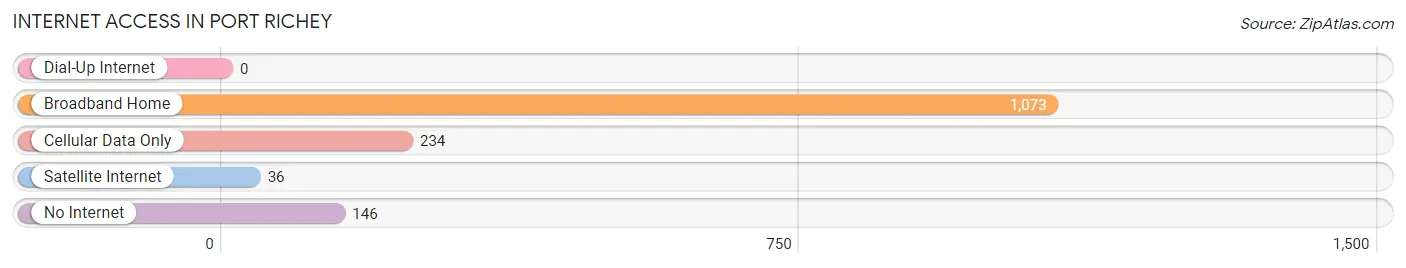
| Internet Type | # Households | % Households |
| Dial-Up Internet | 0 | 0.0% |
| Broadband Home | 1,073 | 73.6% |
| Cellular Data Only | 234 | 16.1% |
| Satellite Internet | 36 | 2.5% |
| No Internet | 146 | 10.0% |
| Total | 1,458 | 100.0% |
Port Richey Summary
Port Richey is a city located in Pasco County, Florida, United States. It is located on the Gulf of Mexico, about 25 miles northwest of Tampa. The population was 2,831 at the 2000 census.
History
Port Richey was founded in 1925 by Captain J.H. Richey, a retired sea captain. He purchased the land from the Port Richey Land Company and named the city after himself. The city was incorporated in 1927.
In the early days, the city was a popular tourist destination, with many people coming to fish and enjoy the beaches. The city was also known for its citrus groves and vegetable farms.
In the 1950s, the city began to experience a population boom as people moved to the area for its warm climate and proximity to the Gulf of Mexico. The city was also a popular retirement destination.
Geography
Port Richey is located at 28°19'N 82°44'W (28.3167, -82.7333). According to the United States Census Bureau, the city has a total area of 2.2 square miles (5.7 km2), of which 2.1 square miles (5.4 km2) is land and 0.1 square miles (0.3 km2) (4.55%) is water.
Economy
Port Richey’s economy is largely based on tourism and retirement. The city is home to several resorts and hotels, as well as a number of restaurants and shops. The city also has a large number of retirees, many of whom are drawn to the area for its warm climate and proximity to the Gulf of Mexico.
Demographics
As of the census of 2000, there were 2,831 people, 1,093 households, and 745 families residing in the city. The population density was 1,346.2 people per square mile (519.7/km2). There were 1,220 housing units at an average density of 576.2 per square mile (223.2/km2). The racial makeup of the city was 94.90% White, 1.90% African American, 0.39% Native American, 0.53% Asian, 0.04% Pacific Islander, 1.45% from other races, and 1.29% from two or more races. Hispanic or Latino of any race were 4.90% of the population.
There were 1,093 households, out of which 24.2% had children under the age of 18 living with them, 54.2% were married couples living together, 10.2% had a female householder with no husband present, and 30.7% were non-families. 24.7% of all households were made up of individuals, and 12.2% had someone living alone who was 65 years of age or older. The average household size was 2.60 and the average family size was 3.09.
In the city, the population was spread out, with 22.2% under the age of 18, 6.7% from 18 to 24, 24.7% from 25 to 44, 24.2% from 45 to 64, and 22.2% who were 65 years of age or older. The median age was 42 years. For every 100 females, there were 95.2 males. For every 100 females age 18 and over, there were 92.2 males.
The median income for a household in the city was $32,917, and the median income for a family was $37,917. Males had a median income of $30,000 versus $21,250 for females. The per capita income for the city was $17,845. About 8.2% of families and 11.2% of the population were below the poverty line, including 15.2% of those under age 18 and 8.2% of those age 65 or over.
Common Questions
What is Per Capita Income in Port Richey?
Per Capita income in Port Richey is $41,726.
What is the Median Family Income in Port Richey?
Median Family Income in Port Richey is $57,438.
What is the Median Household income in Port Richey?
Median Household Income in Port Richey is $44,872.
What is Income or Wage Gap in Port Richey?
Income or Wage Gap in Port Richey is 14.9%.
Women in Port Richey earn 85.1 cents for every dollar earned by a man.
What is Family Income Deficit in Port Richey?
Family Income Deficit in Port Richey is $10,218.
Families that are below poverty line in Port Richey earn $10,218 less on average than the poverty threshold level.
What is Inequality or Gini Index in Port Richey?
Inequality or Gini Index in Port Richey is 0.60.
What is the Total Population of Port Richey?
Total Population of Port Richey is 3,132.
What is the Total Male Population of Port Richey?
Total Male Population of Port Richey is 1,760.
What is the Total Female Population of Port Richey?
Total Female Population of Port Richey is 1,372.
What is the Ratio of Males per 100 Females in Port Richey?
There are 128.28 Males per 100 Females in Port Richey.
What is the Ratio of Females per 100 Males in Port Richey?
There are 77.95 Females per 100 Males in Port Richey.
What is the Median Population Age in Port Richey?
Median Population Age in Port Richey is 49.1 Years.
What is the Average Family Size in Port Richey
Average Family Size in Port Richey is 2.8 People.
What is the Average Household Size in Port Richey
Average Household Size in Port Richey is 2.1 People.
How Large is the Labor Force in Port Richey?
There are 1,241 People in the Labor Forcein in Port Richey.
What is the Percentage of People in the Labor Force in Port Richey?
44.4% of People are in the Labor Force in Port Richey.
What is the Unemployment Rate in Port Richey?
Unemployment Rate in Port Richey is 3.4%.