Pierson, FL Map & Demographics
Pierson Map
Pierson Overview
$23,328
PER CAPITA INCOME
$67,668
AVG FAMILY INCOME
$50,179
AVG HOUSEHOLD INCOME
24.2%
WAGE / INCOME GAP [ % ]
75.8¢/ $1
WAGE / INCOME GAP [ $ ]
0.43
INEQUALITY / GINI INDEX
1,332
TOTAL POPULATION
653
MALE POPULATION
679
FEMALE POPULATION
96.17
MALES / 100 FEMALES
103.98
FEMALES / 100 MALES
45.7
MEDIAN AGE
3.6
AVG FAMILY SIZE
2.9
AVG HOUSEHOLD SIZE
546
LABOR FORCE [ PEOPLE ]
53.1%
PERCENT IN LABOR FORCE
Pierson Zip Codes
Pierson Area Codes
Income in Pierson
Income Overview in Pierson
Per Capita Income in Pierson is $23,328, while median incomes of families and households are $67,668 and $50,179 respectively.
| Characteristic | Number | Measure |
| Per Capita Income | 1,332 | $23,328 |
| Median Family Income | 315 | $67,668 |
| Mean Family Income | 315 | $76,046 |
| Median Household Income | 466 | $50,179 |
| Mean Household Income | 466 | $64,118 |
| Income Deficit | 315 | $0 |
| Wage / Income Gap (%) | 1,332 | 24.25% |
| Wage / Income Gap ($) | 1,332 | 75.75¢ per $1 |
| Gini / Inequality Index | 1,332 | 0.43 |
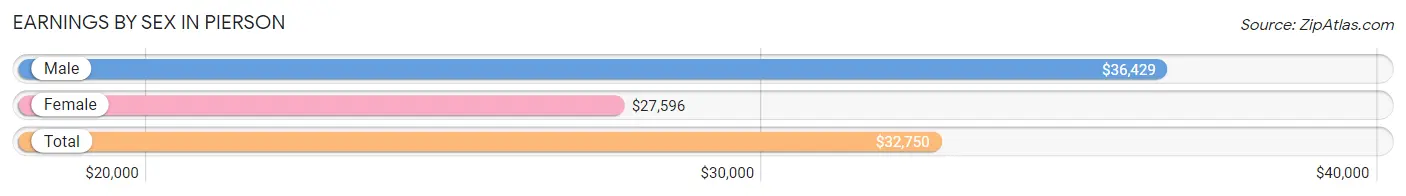
Earnings by Sex in Pierson
Average Earnings in Pierson are $32,750, $36,429 for men and $27,596 for women, a difference of 24.2%.
| Sex | Number | Average Earnings |
| Male | 340 (60.7%) | $36,429 |
| Female | 220 (39.3%) | $27,596 |
| Total | 560 (100.0%) | $32,750 |
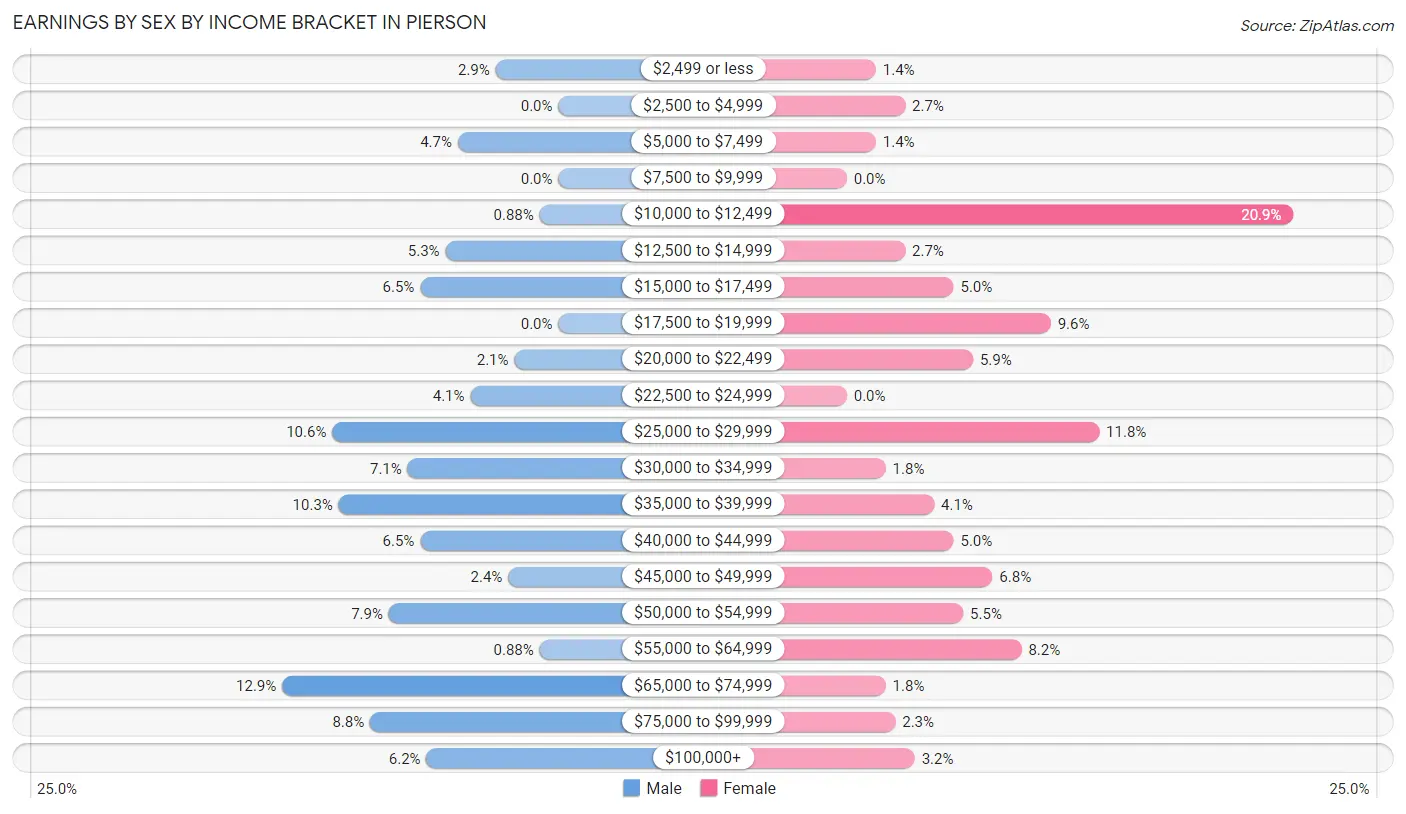
Earnings by Sex by Income Bracket in Pierson
The most common earnings brackets in Pierson are $65,000 to $74,999 for men (44 | 12.9%) and $10,000 to $12,499 for women (46 | 20.9%).
| Income | Male | Female |
| $2,499 or less | 10 (2.9%) | 3 (1.4%) |
| $2,500 to $4,999 | 0 (0.0%) | 6 (2.7%) |
| $5,000 to $7,499 | 16 (4.7%) | 3 (1.4%) |
| $7,500 to $9,999 | 0 (0.0%) | 0 (0.0%) |
| $10,000 to $12,499 | 3 (0.9%) | 46 (20.9%) |
| $12,500 to $14,999 | 18 (5.3%) | 6 (2.7%) |
| $15,000 to $17,499 | 22 (6.5%) | 11 (5.0%) |
| $17,500 to $19,999 | 0 (0.0%) | 21 (9.6%) |
| $20,000 to $22,499 | 7 (2.1%) | 13 (5.9%) |
| $22,500 to $24,999 | 14 (4.1%) | 0 (0.0%) |
| $25,000 to $29,999 | 36 (10.6%) | 26 (11.8%) |
| $30,000 to $34,999 | 24 (7.1%) | 4 (1.8%) |
| $35,000 to $39,999 | 35 (10.3%) | 9 (4.1%) |
| $40,000 to $44,999 | 22 (6.5%) | 11 (5.0%) |
| $45,000 to $49,999 | 8 (2.4%) | 15 (6.8%) |
| $50,000 to $54,999 | 27 (7.9%) | 12 (5.4%) |
| $55,000 to $64,999 | 3 (0.9%) | 18 (8.2%) |
| $65,000 to $74,999 | 44 (12.9%) | 4 (1.8%) |
| $75,000 to $99,999 | 30 (8.8%) | 5 (2.3%) |
| $100,000+ | 21 (6.2%) | 7 (3.2%) |
| Total | 340 (100.0%) | 220 (100.0%) |
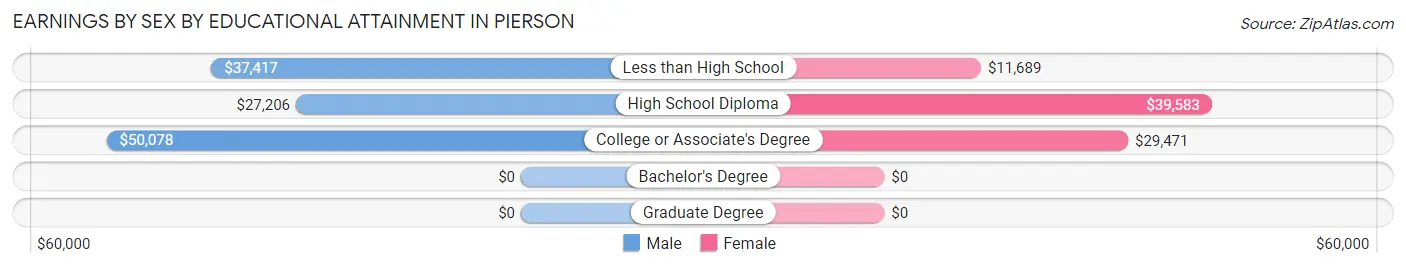
Earnings by Sex by Educational Attainment in Pierson
Average earnings in Pierson are $36,071 for men and $29,712 for women, a difference of 17.6%. Men with an educational attainment of college or associate's degree enjoy the highest average annual earnings of $50,078, while those with high school diploma education earn the least with $27,206. Women with an educational attainment of high school diploma earn the most with the average annual earnings of $39,583, while those with less than high school education have the smallest earnings of $11,689.
| Educational Attainment | Male Income | Female Income |
| Less than High School | $37,417 | $11,689 |
| High School Diploma | $27,206 | $39,583 |
| College or Associate's Degree | $50,078 | $29,471 |
| Bachelor's Degree | - | - |
| Graduate Degree | - | - |
| Total | $36,071 | $29,712 |
Family Income in Pierson
Family Income Brackets in Pierson
According to the Pierson family income data, there are 106 families falling into the $50,000 to $74,999 income range, which is the most common income bracket and makes up 33.7% of all families. Conversely, the $15,000 to $24,999 income bracket is the least frequent group with only 4 families (1.3%) belonging to this category.
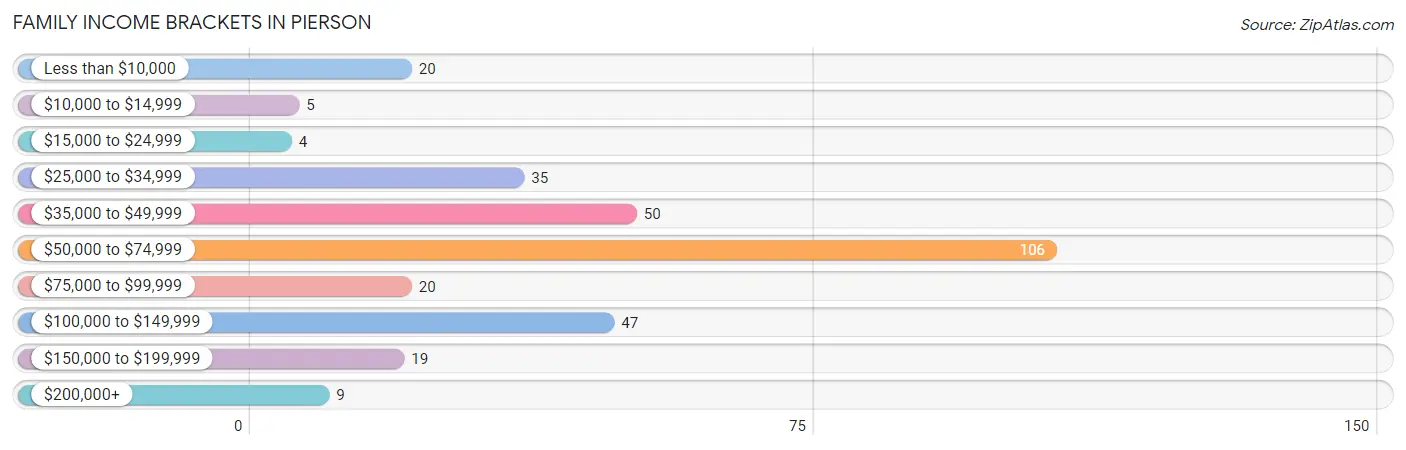
| Income Bracket | # Families | % Families |
| Less than $10,000 | 20 | 6.3% |
| $10,000 to $14,999 | 5 | 1.6% |
| $15,000 to $24,999 | 4 | 1.3% |
| $25,000 to $34,999 | 35 | 11.1% |
| $35,000 to $49,999 | 50 | 15.9% |
| $50,000 to $74,999 | 106 | 33.7% |
| $75,000 to $99,999 | 20 | 6.3% |
| $100,000 to $149,999 | 47 | 14.9% |
| $150,000 to $199,999 | 19 | 6.0% |
| $200,000+ | 9 | 2.9% |
Family Income by Famaliy Size in Pierson
3-person families (94 | 29.8%) account for the highest median family income in Pierson with $74,375 per family, while 2-person families (114 | 36.2%) have the highest median income of $31,875 per family member.
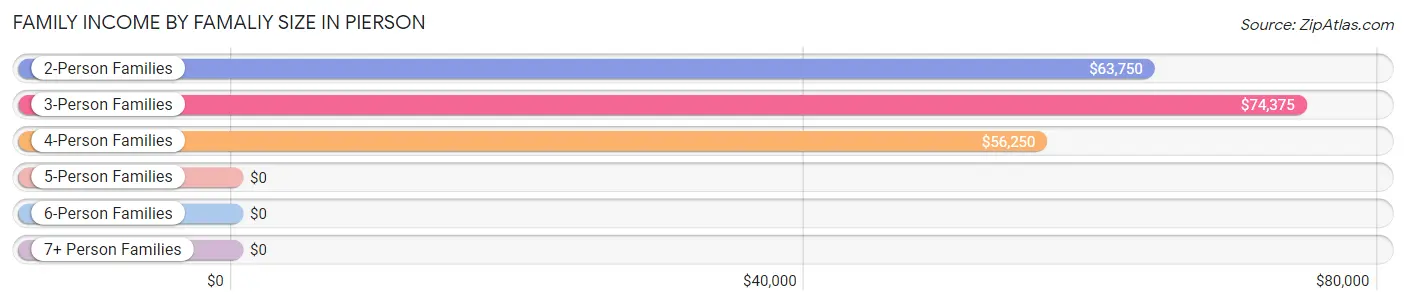
| Income Bracket | # Families | Median Income |
| 2-Person Families | 114 (36.2%) | $63,750 |
| 3-Person Families | 94 (29.8%) | $74,375 |
| 4-Person Families | 24 (7.6%) | $56,250 |
| 5-Person Families | 36 (11.4%) | $0 |
| 6-Person Families | 46 (14.6%) | $0 |
| 7+ Person Families | 1 (0.3%) | $0 |
| Total | 315 (100.0%) | $67,668 |
Family Income by Number of Earners in Pierson
The median family income in Pierson is $67,668, with families comprising 3+ earners (57) having the highest median family income of $123,516, while families with no earners (46) have the lowest median family income of $26,000, accounting for 18.1% and 14.6% of families, respectively.
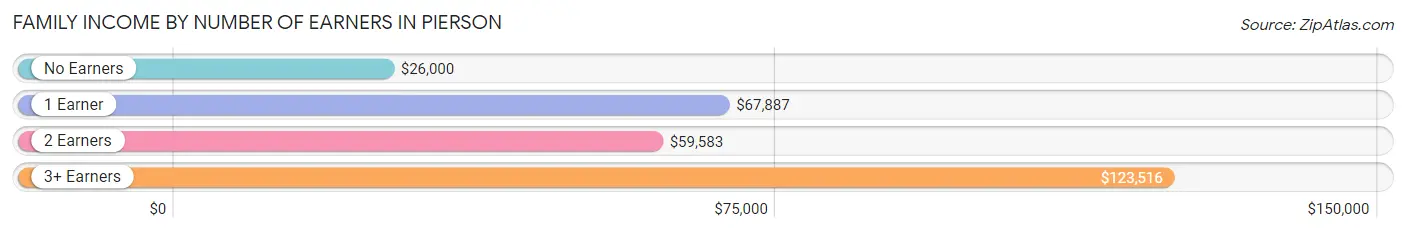
| Number of Earners | # Families | Median Income |
| No Earners | 46 (14.6%) | $26,000 |
| 1 Earner | 119 (37.8%) | $67,887 |
| 2 Earners | 93 (29.5%) | $59,583 |
| 3+ Earners | 57 (18.1%) | $123,516 |
| Total | 315 (100.0%) | $67,668 |
Household Income in Pierson
Household Income Brackets in Pierson
With 121 households falling in the category, the $50,000 to $74,999 income range is the most frequent in Pierson, accounting for 26.0% of all households. In contrast, only 8 households (1.7%) fall into the $10,000 to $14,999 income bracket, making it the least populous group.
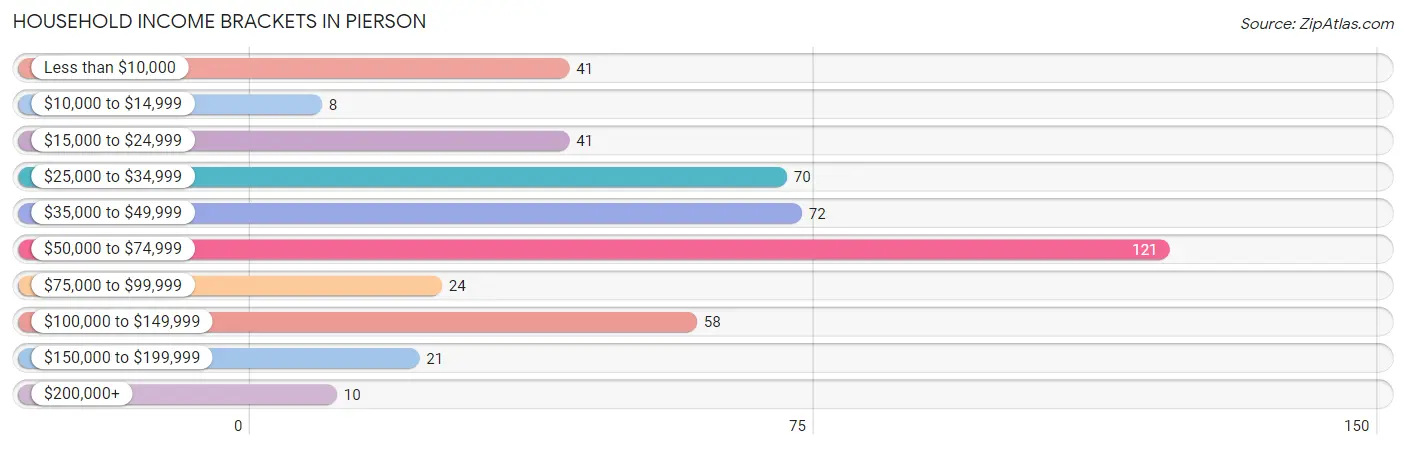
| Income Bracket | # Households | % Households |
| Less than $10,000 | 41 | 8.8% |
| $10,000 to $14,999 | 8 | 1.7% |
| $15,000 to $24,999 | 41 | 8.8% |
| $25,000 to $34,999 | 70 | 15.0% |
| $35,000 to $49,999 | 72 | 15.5% |
| $50,000 to $74,999 | 121 | 26.0% |
| $75,000 to $99,999 | 24 | 5.2% |
| $100,000 to $149,999 | 58 | 12.4% |
| $150,000 to $199,999 | 21 | 4.5% |
| $200,000+ | 10 | 2.1% |
Household Income by Householder Age in Pierson
The median household income in Pierson is $50,179, with the highest median household income of $68,526 found in the 45 to 64 years age bracket for the primary householder. A total of 240 households (51.5%) fall into this category. Meanwhile, the 15 to 24 years age bracket for the primary householder has the lowest median household income of $0, with 18 households (3.9%) in this group.
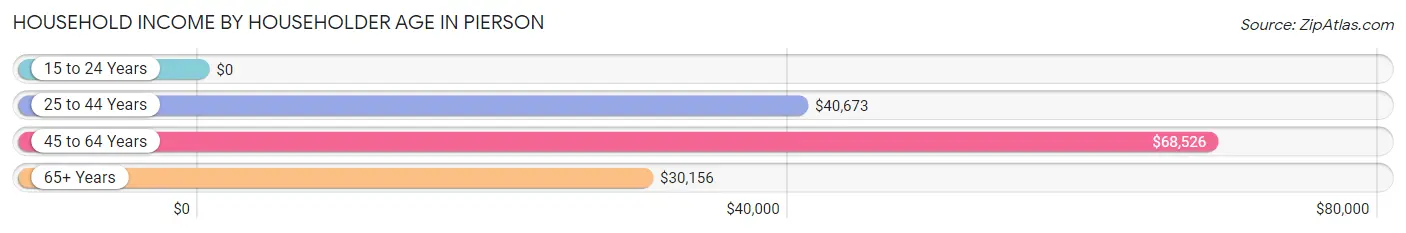
| Income Bracket | # Households | Median Income |
| 15 to 24 Years | 18 (3.9%) | $0 |
| 25 to 44 Years | 59 (12.7%) | $40,673 |
| 45 to 64 Years | 240 (51.5%) | $68,526 |
| 65+ Years | 149 (32.0%) | $30,156 |
| Total | 466 (100.0%) | $50,179 |
Poverty in Pierson
Income Below Poverty by Sex and Age in Pierson
With 14.8% poverty level for males and 21.8% for females among the residents of Pierson, 16 and 17 year old males and 25 to 34 year old females are the most vulnerable to poverty, with 4 males (57.1%) and 43 females (70.5%) in their respective age groups living below the poverty level.
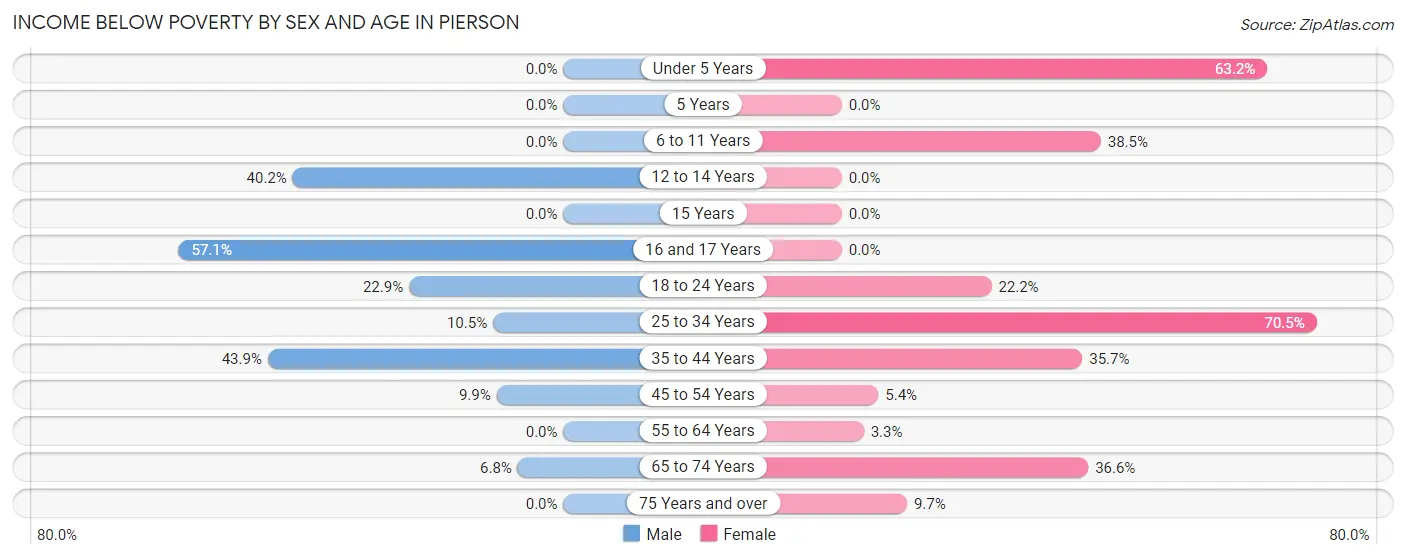
| Age Bracket | Male | Female |
| Under 5 Years | 0 (0.0%) | 12 (63.2%) |
| 5 Years | 0 (0.0%) | 0 (0.0%) |
| 6 to 11 Years | 0 (0.0%) | 30 (38.5%) |
| 12 to 14 Years | 41 (40.2%) | 0 (0.0%) |
| 15 Years | 0 (0.0%) | 0 (0.0%) |
| 16 and 17 Years | 4 (57.1%) | 0 (0.0%) |
| 18 to 24 Years | 11 (22.9%) | 10 (22.2%) |
| 25 to 34 Years | 7 (10.4%) | 43 (70.5%) |
| 35 to 44 Years | 18 (43.9%) | 20 (35.7%) |
| 45 to 54 Years | 12 (9.9%) | 5 (5.4%) |
| 55 to 64 Years | 0 (0.0%) | 4 (3.3%) |
| 65 to 74 Years | 4 (6.8%) | 15 (36.6%) |
| 75 Years and over | 0 (0.0%) | 9 (9.7%) |
| Total | 97 (14.8%) | 148 (21.8%) |
Income Above Poverty by Sex and Age in Pierson
According to the poverty statistics in Pierson, males aged 6 to 11 years and females aged 5 years are the age groups that are most secure financially, with 100.0% of males and 100.0% of females in these age groups living above the poverty line.
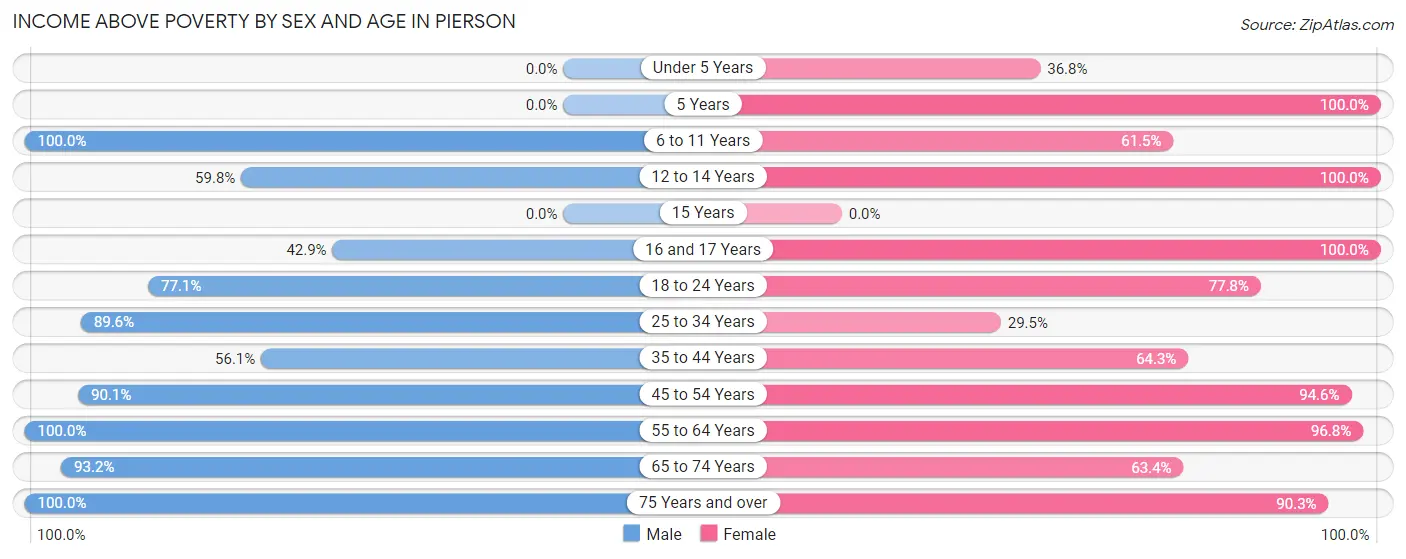
| Age Bracket | Male | Female |
| Under 5 Years | 0 (0.0%) | 7 (36.8%) |
| 5 Years | 0 (0.0%) | 11 (100.0%) |
| 6 to 11 Years | 54 (100.0%) | 48 (61.5%) |
| 12 to 14 Years | 61 (59.8%) | 40 (100.0%) |
| 15 Years | 0 (0.0%) | 0 (0.0%) |
| 16 and 17 Years | 3 (42.9%) | 20 (100.0%) |
| 18 to 24 Years | 37 (77.1%) | 35 (77.8%) |
| 25 to 34 Years | 60 (89.5%) | 18 (29.5%) |
| 35 to 44 Years | 23 (56.1%) | 36 (64.3%) |
| 45 to 54 Years | 109 (90.1%) | 87 (94.6%) |
| 55 to 64 Years | 116 (100.0%) | 119 (96.8%) |
| 65 to 74 Years | 55 (93.2%) | 26 (63.4%) |
| 75 Years and over | 38 (100.0%) | 84 (90.3%) |
| Total | 556 (85.2%) | 531 (78.2%) |
Income Below Poverty Among Married-Couple Families in Pierson
The poverty statistics for married-couple families in Pierson show that 8.9% or 23 of the total 257 families live below the poverty line. Families with 3 or 4 children have the highest poverty rate of 25.5%, comprising of 12 families. On the other hand, families with no children have the lowest poverty rate of 0.0%, which includes 0 families.
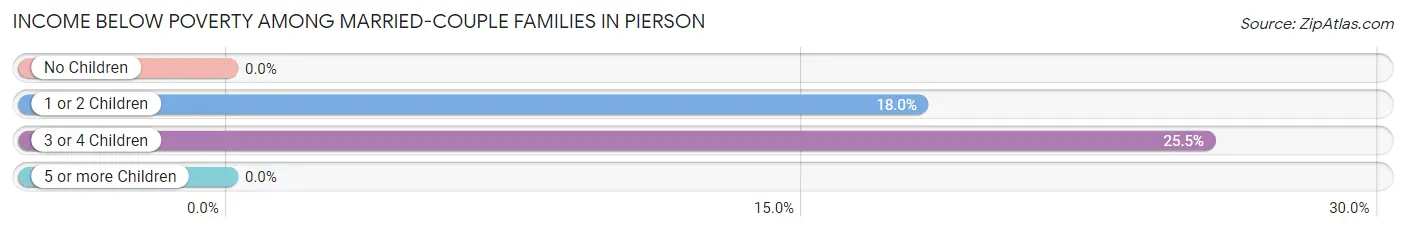
| Children | Above Poverty | Below Poverty |
| No Children | 149 (100.0%) | 0 (0.0%) |
| 1 or 2 Children | 50 (82.0%) | 11 (18.0%) |
| 3 or 4 Children | 35 (74.5%) | 12 (25.5%) |
| 5 or more Children | 0 (0.0%) | 0 (0.0%) |
| Total | 234 (91.0%) | 23 (8.9%) |
Income Below Poverty Among Single-Parent Households in Pierson
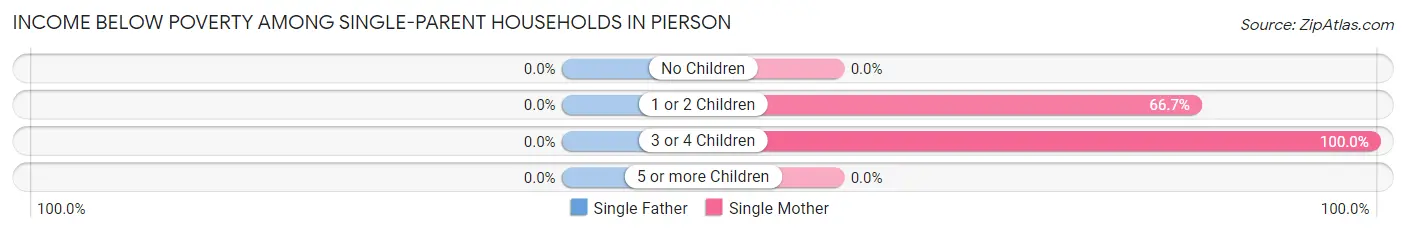
| Children | Single Father | Single Mother |
| No Children | 0 (0.0%) | 0 (0.0%) |
| 1 or 2 Children | 0 (0.0%) | 14 (66.7%) |
| 3 or 4 Children | 0 (0.0%) | 3 (100.0%) |
| 5 or more Children | 0 (0.0%) | 0 (0.0%) |
| Total | 0 (0.0%) | 17 (53.1%) |
Income Below Poverty Among Married-Couple vs Single-Parent Households in Pierson
The poverty data for Pierson shows that 23 of the married-couple family households (8.9%) and 17 of the single-parent households (29.3%) are living below the poverty level. Within the married-couple family households, those with 3 or 4 children have the highest poverty rate, with 12 households (25.5%) falling below the poverty line. Among the single-parent households, those with 3 or 4 children have the highest poverty rate, with 3 household (100.0%) living below poverty.
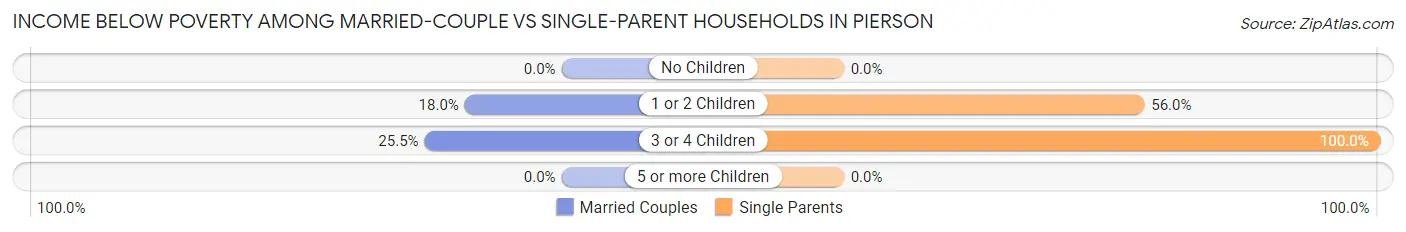
| Children | Married-Couple Families | Single-Parent Households |
| No Children | 0 (0.0%) | 0 (0.0%) |
| 1 or 2 Children | 11 (18.0%) | 14 (56.0%) |
| 3 or 4 Children | 12 (25.5%) | 3 (100.0%) |
| 5 or more Children | 0 (0.0%) | 0 (0.0%) |
| Total | 23 (8.9%) | 17 (29.3%) |
Race in Pierson
The most populous races in Pierson are Hispanic or Latino (833 | 62.5%), White / Caucasian (619 | 46.5%), and Some other Race (563 | 42.3%).
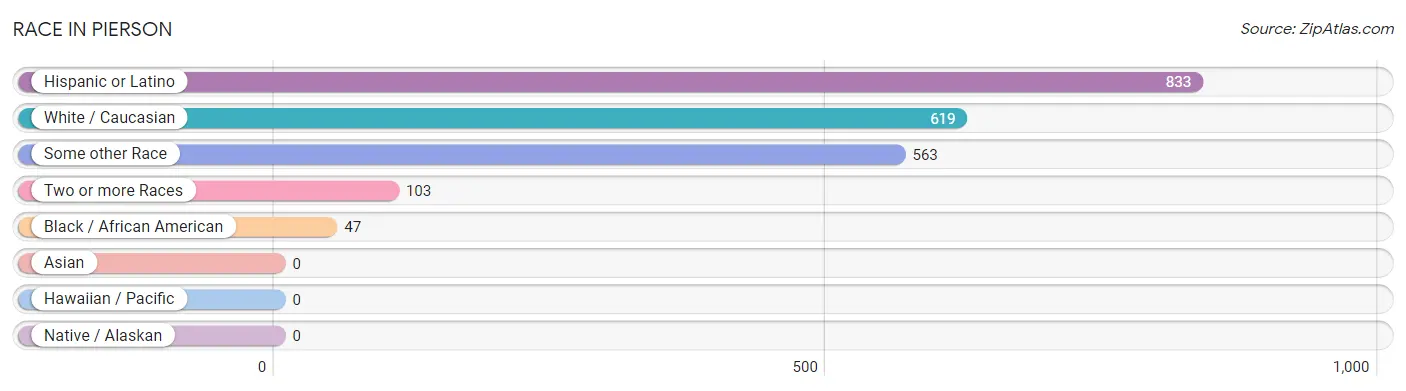
| Race | # Population | % Population |
| Asian | 0 | 0.0% |
| Black / African American | 47 | 3.5% |
| Hawaiian / Pacific | 0 | 0.0% |
| Hispanic or Latino | 833 | 62.5% |
| Native / Alaskan | 0 | 0.0% |
| White / Caucasian | 619 | 46.5% |
| Two or more Races | 103 | 7.7% |
| Some other Race | 563 | 42.3% |
| Total | 1,332 | 100.0% |
Ancestry in Pierson
The most populous ancestries reported in Pierson are Mexican (795 | 59.7%), American (60 | 4.5%), English (57 | 4.3%), Irish (36 | 2.7%), and German (28 | 2.1%), together accounting for 73.3% of all Pierson residents.
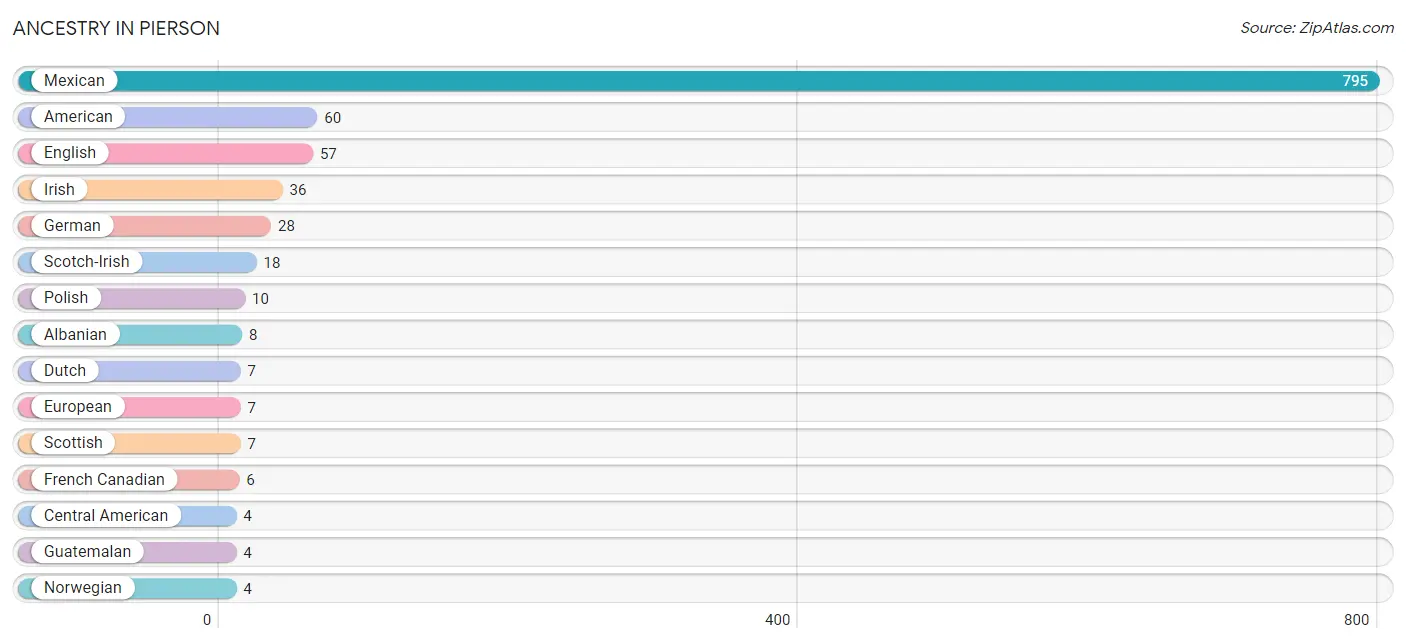
| Ancestry | # Population | % Population |
| Albanian | 8 | 0.6% |
| American | 60 | 4.5% |
| British | 2 | 0.2% |
| Central American | 4 | 0.3% |
| Dutch | 7 | 0.5% |
| English | 57 | 4.3% |
| European | 7 | 0.5% |
| French | 3 | 0.2% |
| French Canadian | 6 | 0.4% |
| German | 28 | 2.1% |
| Guatemalan | 4 | 0.3% |
| Irish | 36 | 2.7% |
| Italian | 2 | 0.2% |
| Mexican | 795 | 59.7% |
| Norwegian | 4 | 0.3% |
| Polish | 10 | 0.7% |
| Portuguese | 4 | 0.3% |
| Puerto Rican | 4 | 0.3% |
| Scotch-Irish | 18 | 1.3% |
| Scottish | 7 | 0.5% |
| Swedish | 4 | 0.3% |
| Welsh | 4 | 0.3% | View All 22 Rows |
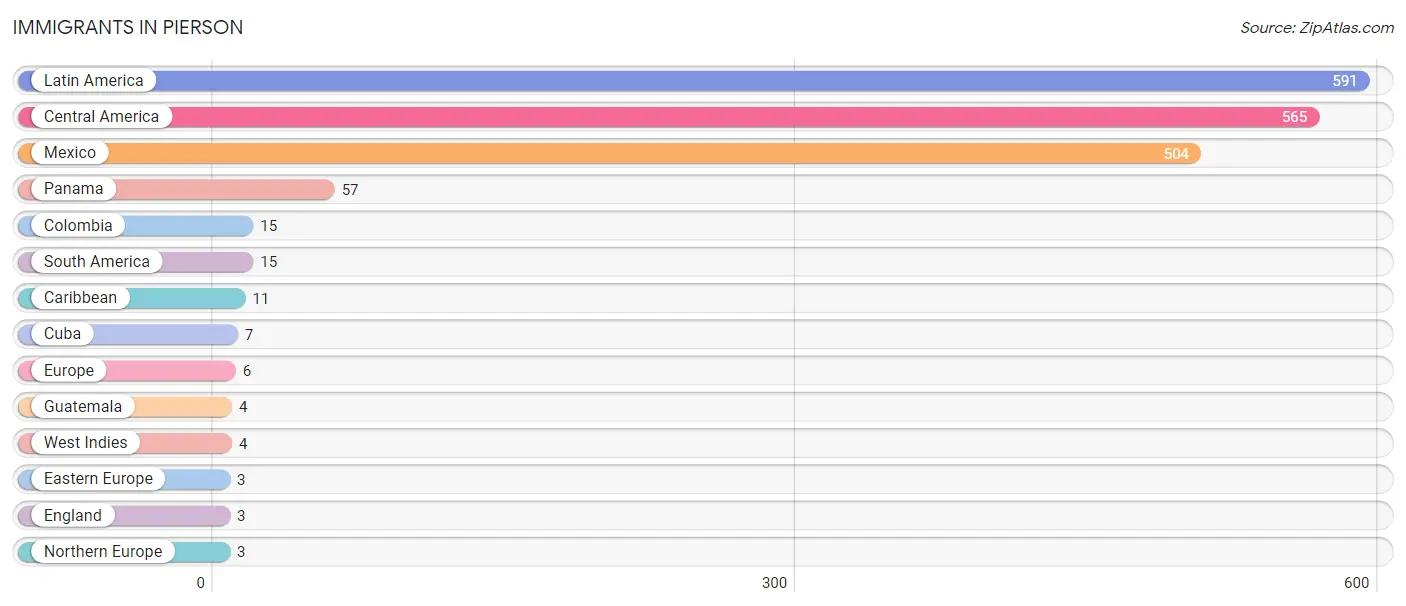
Immigrants in Pierson
The most numerous immigrant groups reported in Pierson came from Latin America (591 | 44.4%), Central America (565 | 42.4%), Mexico (504 | 37.8%), Panama (57 | 4.3%), and Colombia (15 | 1.1%), together accounting for 130.0% of all Pierson residents.
| Immigration Origin | # Population | % Population |
| Caribbean | 11 | 0.8% |
| Central America | 565 | 42.4% |
| Colombia | 15 | 1.1% |
| Cuba | 7 | 0.5% |
| Eastern Europe | 3 | 0.2% |
| England | 3 | 0.2% |
| Europe | 6 | 0.4% |
| Guatemala | 4 | 0.3% |
| Latin America | 591 | 44.4% |
| Mexico | 504 | 37.8% |
| Northern Europe | 3 | 0.2% |
| Panama | 57 | 4.3% |
| South America | 15 | 1.1% |
| West Indies | 4 | 0.3% | View All 14 Rows |
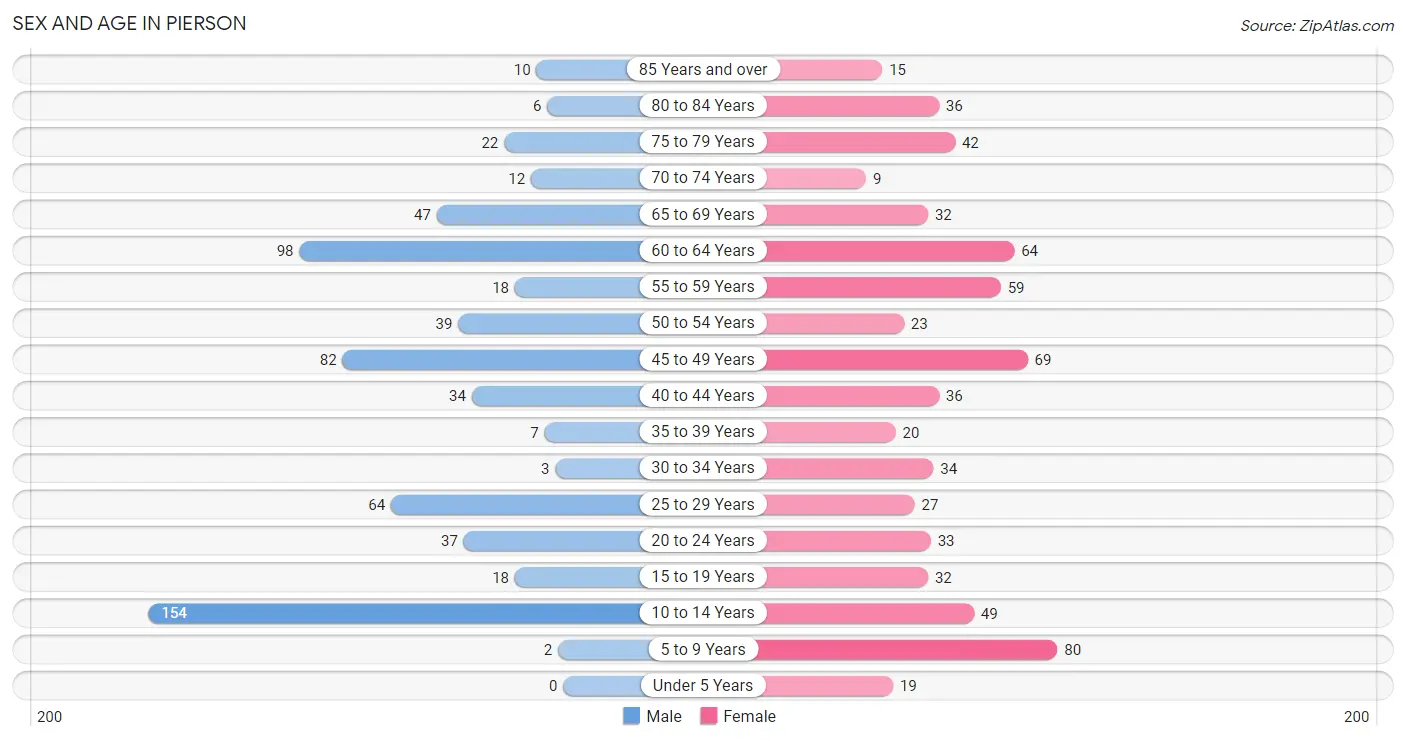
Sex and Age in Pierson
Sex and Age in Pierson
The most populous age groups in Pierson are 10 to 14 Years (154 | 23.6%) for men and 5 to 9 Years (80 | 11.8%) for women.
| Age Bracket | Male | Female |
| Under 5 Years | 0 (0.0%) | 19 (2.8%) |
| 5 to 9 Years | 2 (0.3%) | 80 (11.8%) |
| 10 to 14 Years | 154 (23.6%) | 49 (7.2%) |
| 15 to 19 Years | 18 (2.8%) | 32 (4.7%) |
| 20 to 24 Years | 37 (5.7%) | 33 (4.9%) |
| 25 to 29 Years | 64 (9.8%) | 27 (4.0%) |
| 30 to 34 Years | 3 (0.5%) | 34 (5.0%) |
| 35 to 39 Years | 7 (1.1%) | 20 (2.9%) |
| 40 to 44 Years | 34 (5.2%) | 36 (5.3%) |
| 45 to 49 Years | 82 (12.6%) | 69 (10.2%) |
| 50 to 54 Years | 39 (6.0%) | 23 (3.4%) |
| 55 to 59 Years | 18 (2.8%) | 59 (8.7%) |
| 60 to 64 Years | 98 (15.0%) | 64 (9.4%) |
| 65 to 69 Years | 47 (7.2%) | 32 (4.7%) |
| 70 to 74 Years | 12 (1.8%) | 9 (1.3%) |
| 75 to 79 Years | 22 (3.4%) | 42 (6.2%) |
| 80 to 84 Years | 6 (0.9%) | 36 (5.3%) |
| 85 Years and over | 10 (1.5%) | 15 (2.2%) |
| Total | 653 (100.0%) | 679 (100.0%) |
Families and Households in Pierson
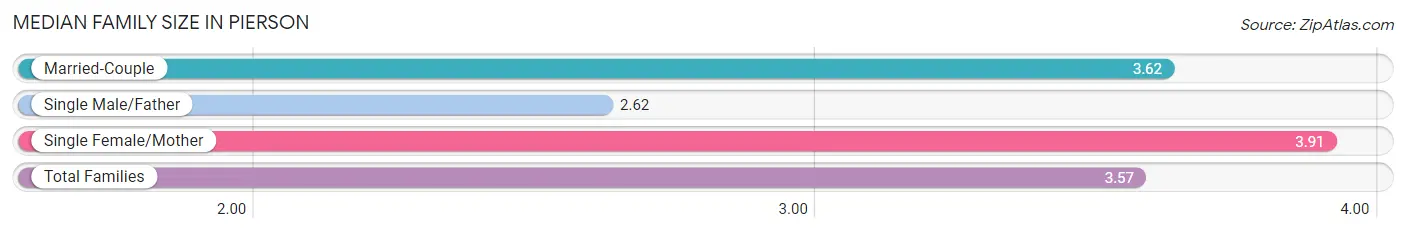
Median Family Size in Pierson
The median family size in Pierson is 3.57 persons per family, with single female/mother families (32 | 10.2%) accounting for the largest median family size of 3.91 persons per family. On the other hand, single male/father families (26 | 8.3%) represent the smallest median family size with 2.62 persons per family.
| Family Type | # Families | Family Size |
| Married-Couple | 257 (81.6%) | 3.62 |
| Single Male/Father | 26 (8.3%) | 2.62 |
| Single Female/Mother | 32 (10.2%) | 3.91 |
| Total Families | 315 (100.0%) | 3.57 |
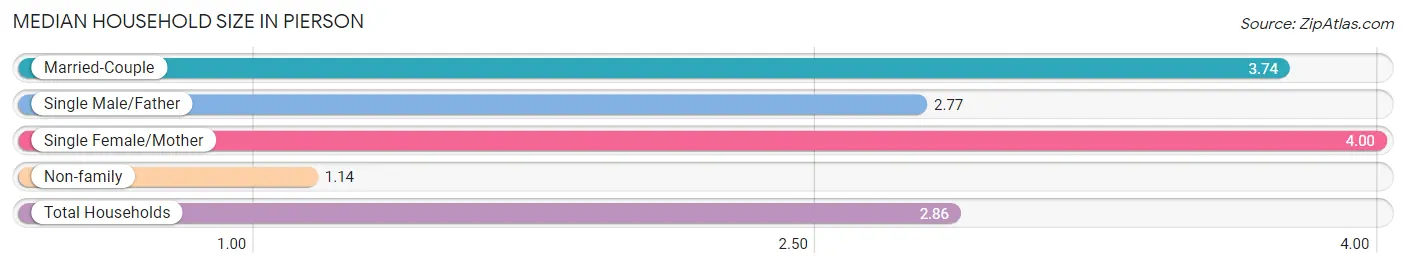
Median Household Size in Pierson
The median household size in Pierson is 2.86 persons per household, with single female/mother households (32 | 6.9%) accounting for the largest median household size of 4 persons per household. non-family households (151 | 32.4%) represent the smallest median household size with 1.14 persons per household.
| Household Type | # Households | Household Size |
| Married-Couple | 257 (55.1%) | 3.74 |
| Single Male/Father | 26 (5.6%) | 2.77 |
| Single Female/Mother | 32 (6.9%) | 4.00 |
| Non-family | 151 (32.4%) | 1.14 |
| Total Households | 466 (100.0%) | 2.86 |
Household Size by Marriage Status in Pierson
Out of a total of 466 households in Pierson, 315 (67.6%) are family households, while 151 (32.4%) are nonfamily households. The most numerous type of family households are 2-person households, comprising 102, and the most common type of nonfamily households are 1-person households, comprising 133.
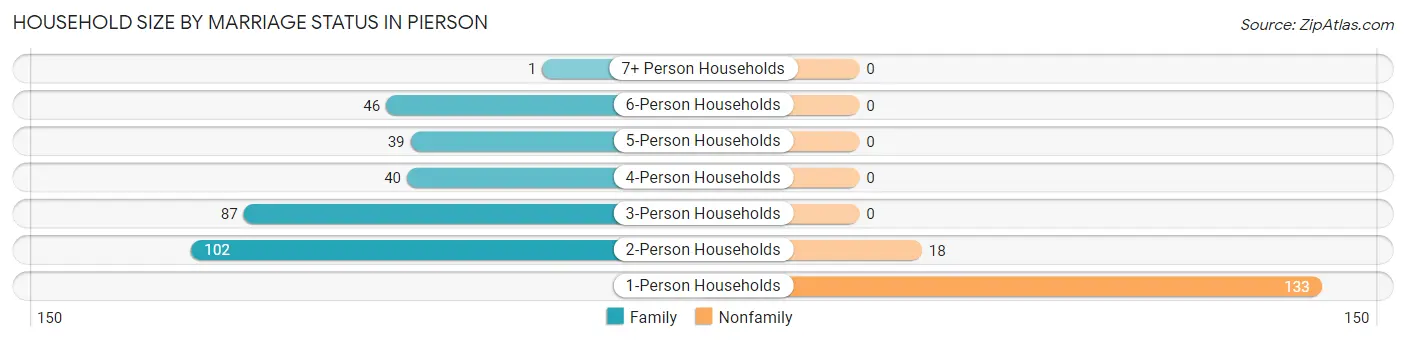
| Household Size | Family Households | Nonfamily Households |
| 1-Person Households | - | 133 (28.5%) |
| 2-Person Households | 102 (21.9%) | 18 (3.9%) |
| 3-Person Households | 87 (18.7%) | 0 (0.0%) |
| 4-Person Households | 40 (8.6%) | 0 (0.0%) |
| 5-Person Households | 39 (8.4%) | 0 (0.0%) |
| 6-Person Households | 46 (9.9%) | 0 (0.0%) |
| 7+ Person Households | 1 (0.2%) | 0 (0.0%) |
| Total | 315 (67.6%) | 151 (32.4%) |
Female Fertility in Pierson
Fertility by Age in Pierson
| Age Bracket | Women with Births | Births / 1,000 Women |
| 15 to 19 years | 0 (0.0%) | 0.0 |
| 20 to 34 years | 0 (0.0%) | 0.0 |
| 35 to 50 years | 0 (0.0%) | 0.0 |
| Total | 0 (0.0%) | 0.0 |
Fertility by Age by Marriage Status in Pierson
| Age Bracket | Married | Unmarried |
| 15 to 19 years | 0 (0.0%) | 0 (0.0%) |
| 20 to 34 years | 0 (0.0%) | 0 (0.0%) |
| 35 to 50 years | 0 (0.0%) | 0 (0.0%) |
| Total | 0 (0.0%) | 0 (0.0%) |
Fertility by Education in Pierson
| Educational Attainment | Women with Births | Births / 1,000 Women |
| Less than High School | 0 (0.0%) | 0.0 |
| High School Diploma | 0 (0.0%) | 0.0 |
| College or Associate's Degree | 0 (0.0%) | 0.0 |
| Bachelor's Degree | 0 (0.0%) | 0.0 |
| Graduate Degree | 0 (0.0%) | 0.0 |
| Total | 0 (0.0%) | 0.0 |
Fertility by Education by Marriage Status in Pierson
| Educational Attainment | Married | Unmarried |
| Less than High School | 0 (0.0%) | 0 (0.0%) |
| High School Diploma | 0 (0.0%) | 0 (0.0%) |
| College or Associate's Degree | 0 (0.0%) | 0 (0.0%) |
| Bachelor's Degree | 0 (0.0%) | 0 (0.0%) |
| Graduate Degree | 0 (0.0%) | 0 (0.0%) |
| Total | 0 (0.0%) | 0 (0.0%) |
Employment Characteristics in Pierson
Employment by Class of Employer in Pierson
Among the 541 employed individuals in Pierson, private company employees (406 | 75.0%), not-for-profit organizations (45 | 8.3%), and federal government employees (35 | 6.5%) make up the most common classes of employment.
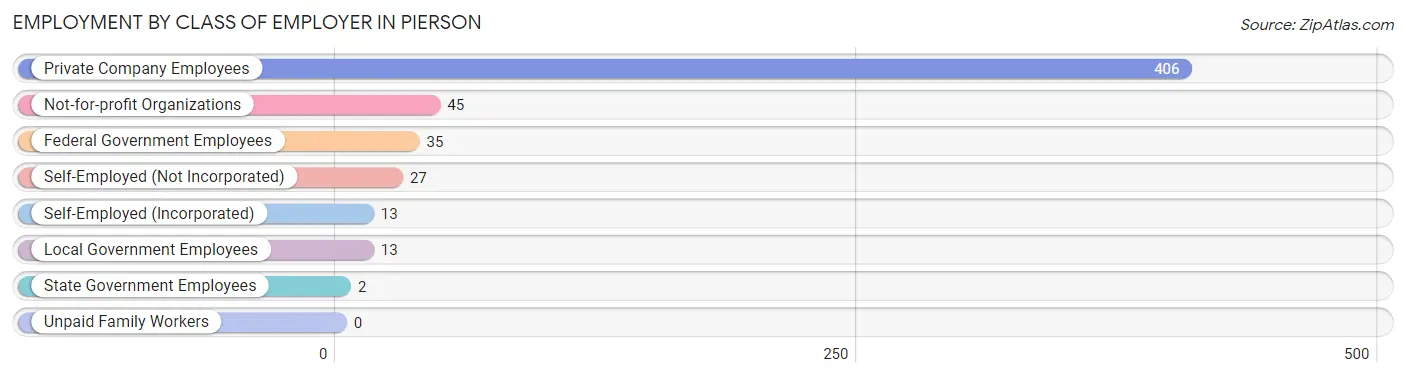
| Employer Class | # Employees | % Employees |
| Private Company Employees | 406 | 75.0% |
| Self-Employed (Incorporated) | 13 | 2.4% |
| Self-Employed (Not Incorporated) | 27 | 5.0% |
| Not-for-profit Organizations | 45 | 8.3% |
| Local Government Employees | 13 | 2.4% |
| State Government Employees | 2 | 0.4% |
| Federal Government Employees | 35 | 6.5% |
| Unpaid Family Workers | 0 | 0.0% |
| Total | 541 | 100.0% |
Employment Status by Age in Pierson
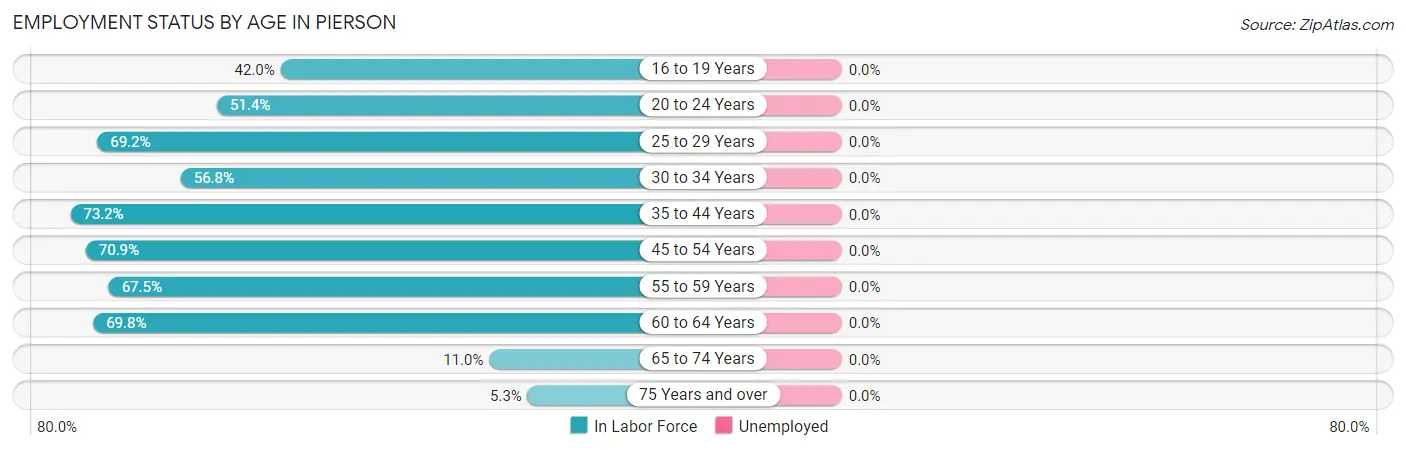
| Age Bracket | In Labor Force | Unemployed |
| 16 to 19 Years | 21 (42.0%) | 0 (0.0%) |
| 20 to 24 Years | 36 (51.4%) | 0 (0.0%) |
| 25 to 29 Years | 63 (69.2%) | 0 (0.0%) |
| 30 to 34 Years | 21 (56.8%) | 0 (0.0%) |
| 35 to 44 Years | 71 (73.2%) | 0 (0.0%) |
| 45 to 54 Years | 151 (70.9%) | 0 (0.0%) |
| 55 to 59 Years | 52 (67.5%) | 0 (0.0%) |
| 60 to 64 Years | 113 (69.8%) | 0 (0.0%) |
| 65 to 74 Years | 11 (11.0%) | 0 (0.0%) |
| 75 Years and over | 7 (5.3%) | 0 (0.0%) |
| Total | 546 (53.1%) | 0 (0.0%) |
Employment Status by Educational Attainment in Pierson
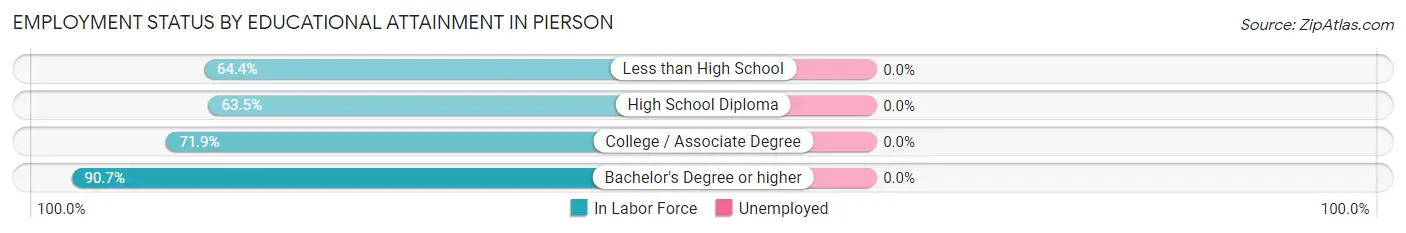
| Educational Attainment | In Labor Force | Unemployed |
| Less than High School | 143 (64.4%) | 0 (0.0%) |
| High School Diploma | 101 (63.5%) | 0 (0.0%) |
| College / Associate Degree | 159 (71.9%) | 0 (0.0%) |
| Bachelor's Degree or higher | 68 (90.7%) | 0 (0.0%) |
| Total | 471 (69.6%) | 0 (0.0%) |
Employment Occupations by Sex in Pierson
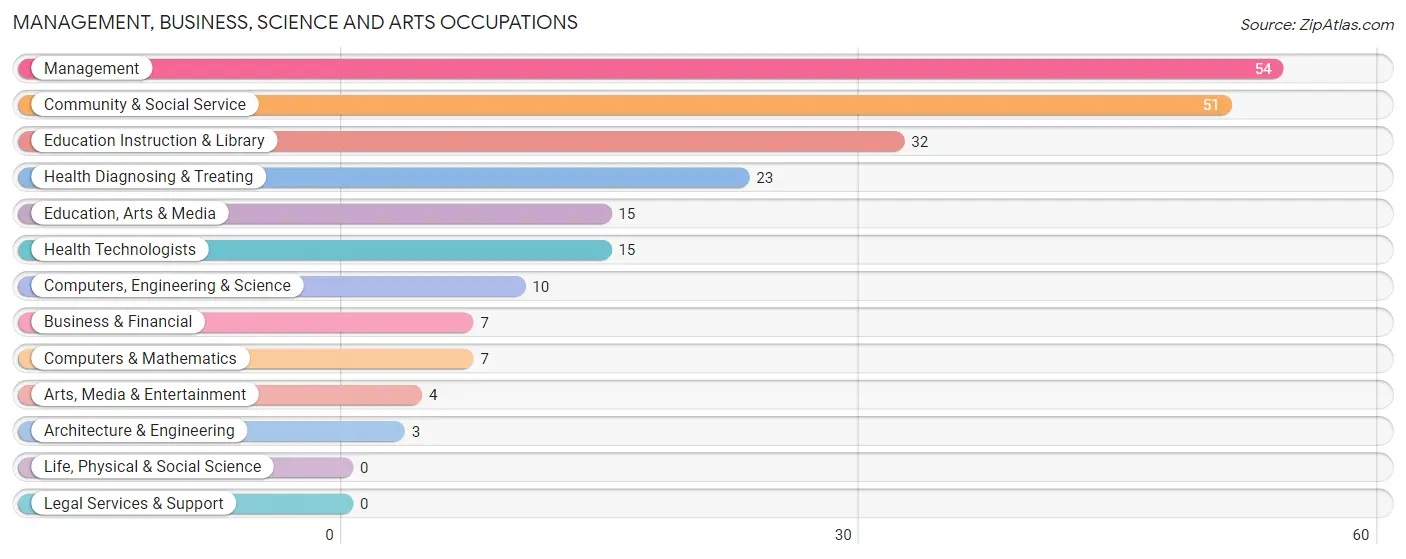
Management, Business, Science and Arts Occupations
The most common Management, Business, Science and Arts occupations in Pierson are Management (54 | 9.9%), Community & Social Service (51 | 9.3%), Education Instruction & Library (32 | 5.9%), Health Diagnosing & Treating (23 | 4.2%), and Education, Arts & Media (15 | 2.8%).
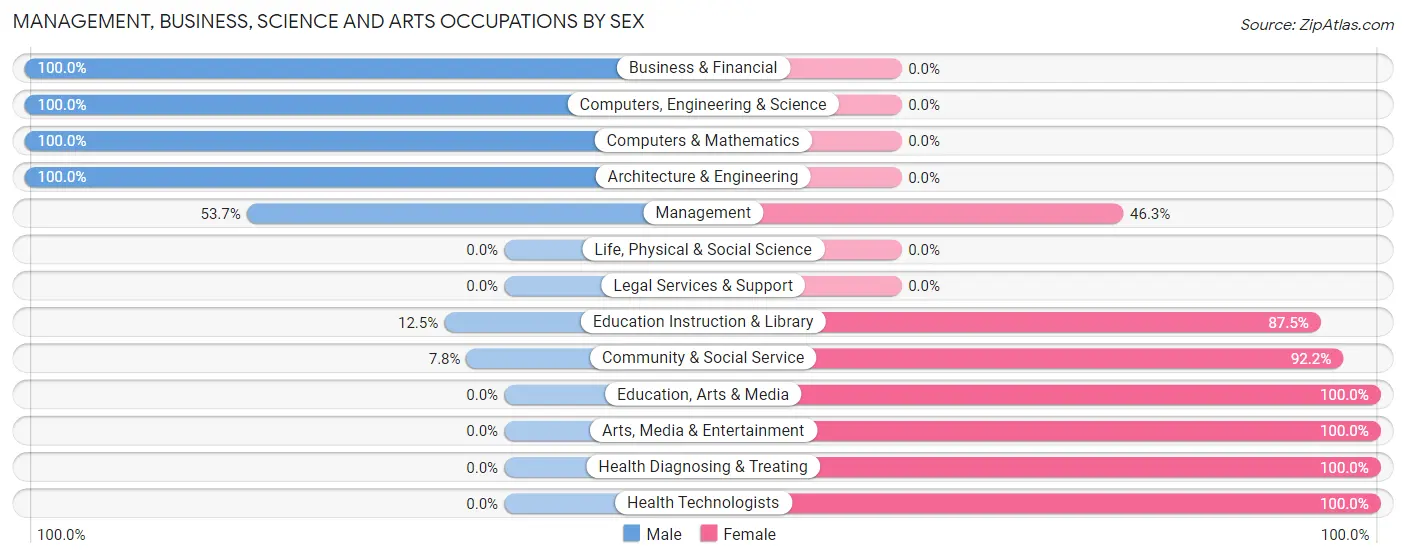
Management, Business, Science and Arts Occupations by Sex
Within the Management, Business, Science and Arts occupations in Pierson, the most male-oriented occupations are Business & Financial (100.0%), Computers, Engineering & Science (100.0%), and Computers & Mathematics (100.0%), while the most female-oriented occupations are Education, Arts & Media (100.0%), Arts, Media & Entertainment (100.0%), and Health Diagnosing & Treating (100.0%).
| Occupation | Male | Female |
| Management | 29 (53.7%) | 25 (46.3%) |
| Business & Financial | 7 (100.0%) | 0 (0.0%) |
| Computers, Engineering & Science | 10 (100.0%) | 0 (0.0%) |
| Computers & Mathematics | 7 (100.0%) | 0 (0.0%) |
| Architecture & Engineering | 3 (100.0%) | 0 (0.0%) |
| Life, Physical & Social Science | 0 (0.0%) | 0 (0.0%) |
| Community & Social Service | 4 (7.8%) | 47 (92.2%) |
| Education, Arts & Media | 0 (0.0%) | 15 (100.0%) |
| Legal Services & Support | 0 (0.0%) | 0 (0.0%) |
| Education Instruction & Library | 4 (12.5%) | 28 (87.5%) |
| Arts, Media & Entertainment | 0 (0.0%) | 4 (100.0%) |
| Health Diagnosing & Treating | 0 (0.0%) | 23 (100.0%) |
| Health Technologists | 0 (0.0%) | 15 (100.0%) |
| Total (Category) | 50 (34.5%) | 95 (65.5%) |
| Total (Overall) | 329 (60.3%) | 217 (39.7%) |
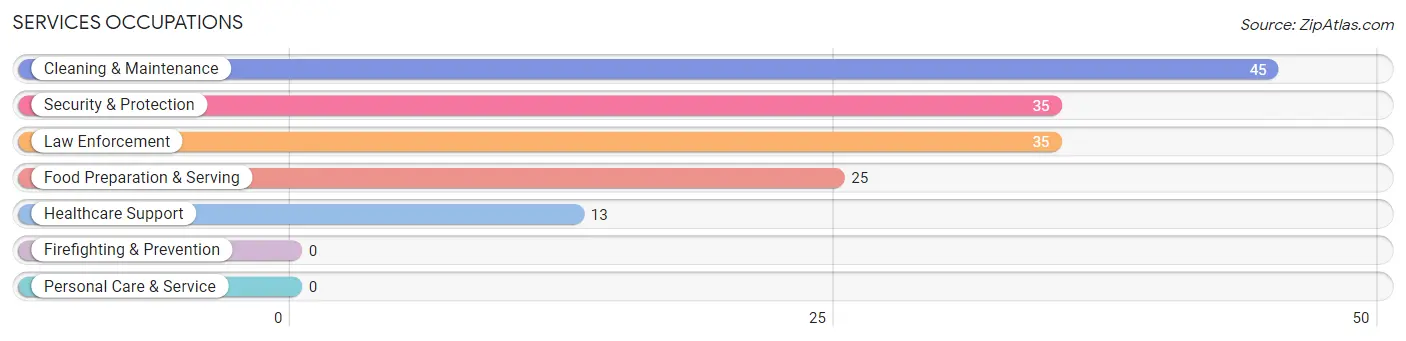
Services Occupations
The most common Services occupations in Pierson are Cleaning & Maintenance (45 | 8.2%), Security & Protection (35 | 6.4%), Law Enforcement (35 | 6.4%), Food Preparation & Serving (25 | 4.6%), and Healthcare Support (13 | 2.4%).
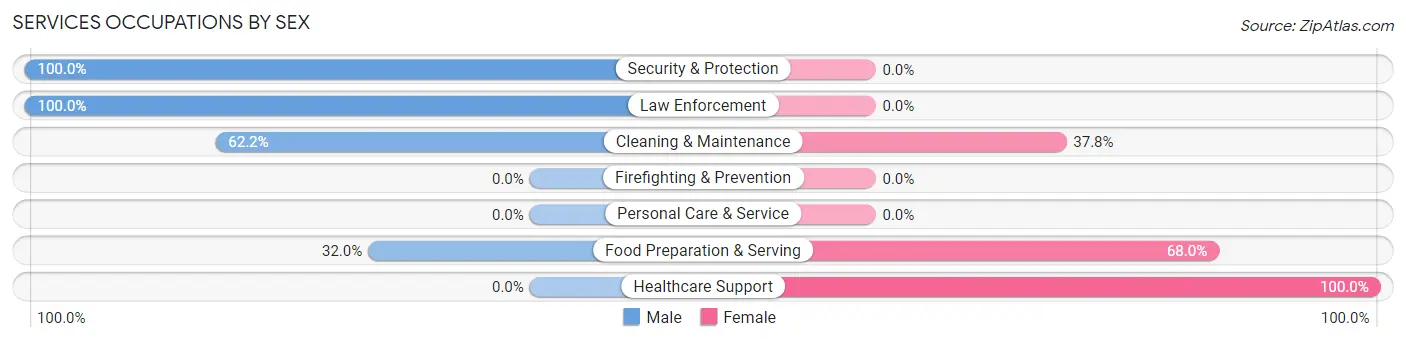
Services Occupations by Sex
Within the Services occupations in Pierson, the most male-oriented occupations are Security & Protection (100.0%), Law Enforcement (100.0%), and Cleaning & Maintenance (62.2%), while the most female-oriented occupations are Healthcare Support (100.0%), Food Preparation & Serving (68.0%), and Cleaning & Maintenance (37.8%).
| Occupation | Male | Female |
| Healthcare Support | 0 (0.0%) | 13 (100.0%) |
| Security & Protection | 35 (100.0%) | 0 (0.0%) |
| Firefighting & Prevention | 0 (0.0%) | 0 (0.0%) |
| Law Enforcement | 35 (100.0%) | 0 (0.0%) |
| Food Preparation & Serving | 8 (32.0%) | 17 (68.0%) |
| Cleaning & Maintenance | 28 (62.2%) | 17 (37.8%) |
| Personal Care & Service | 0 (0.0%) | 0 (0.0%) |
| Total (Category) | 71 (60.2%) | 47 (39.8%) |
| Total (Overall) | 329 (60.3%) | 217 (39.7%) |
Sales and Office Occupations
The most common Sales and Office occupations in Pierson are Sales & Related (18 | 3.3%), and Office & Administration (15 | 2.8%).
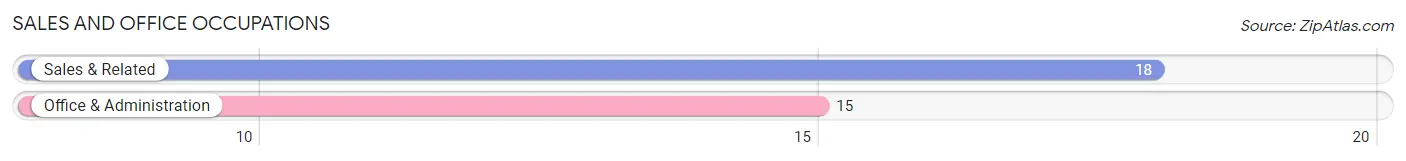
Sales and Office Occupations by Sex
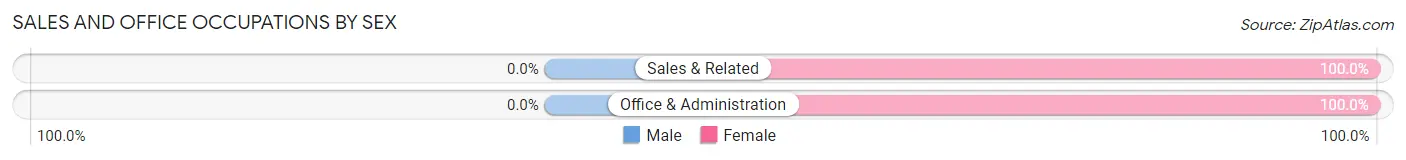
| Occupation | Male | Female |
| Sales & Related | 0 (0.0%) | 18 (100.0%) |
| Office & Administration | 0 (0.0%) | 15 (100.0%) |
| Total (Category) | 0 (0.0%) | 33 (100.0%) |
| Total (Overall) | 329 (60.3%) | 217 (39.7%) |
Natural Resources, Construction and Maintenance Occupations
The most common Natural Resources, Construction and Maintenance occupations in Pierson are Farming, Fishing & Forestry (98 | 17.9%), Construction & Extraction (88 | 16.1%), and Installation, Maintenance & Repair (14 | 2.6%).
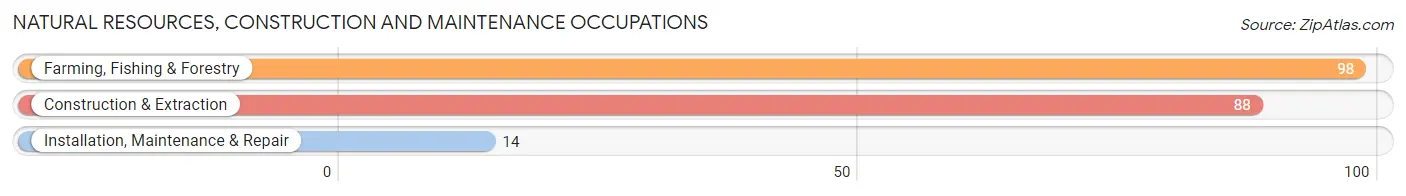
Natural Resources, Construction and Maintenance Occupations by Sex
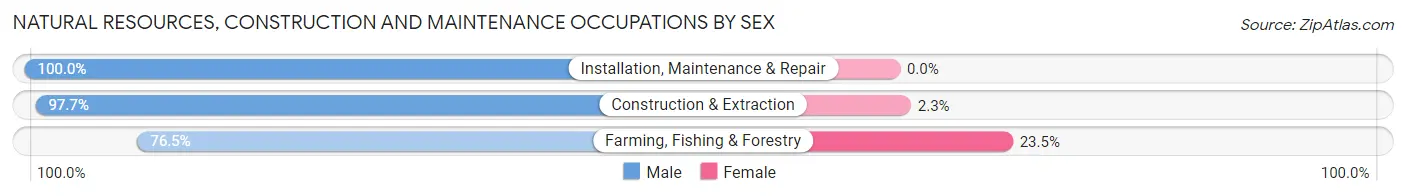
| Occupation | Male | Female |
| Farming, Fishing & Forestry | 75 (76.5%) | 23 (23.5%) |
| Construction & Extraction | 86 (97.7%) | 2 (2.3%) |
| Installation, Maintenance & Repair | 14 (100.0%) | 0 (0.0%) |
| Total (Category) | 175 (87.5%) | 25 (12.5%) |
| Total (Overall) | 329 (60.3%) | 217 (39.7%) |
Production, Transportation and Moving Occupations
The most common Production, Transportation and Moving occupations in Pierson are Transportation (25 | 4.6%), Production (18 | 3.3%), and Material Moving (7 | 1.3%).
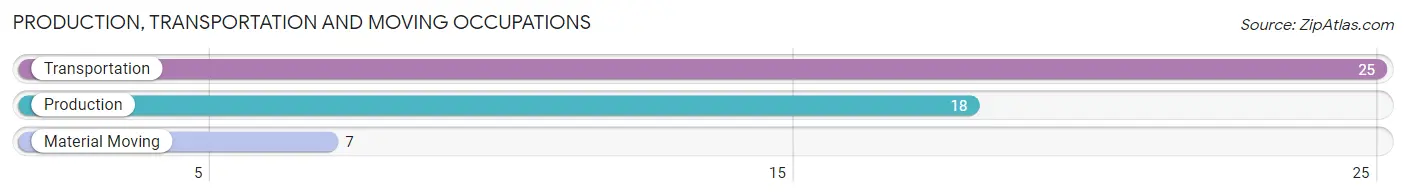
Production, Transportation and Moving Occupations by Sex
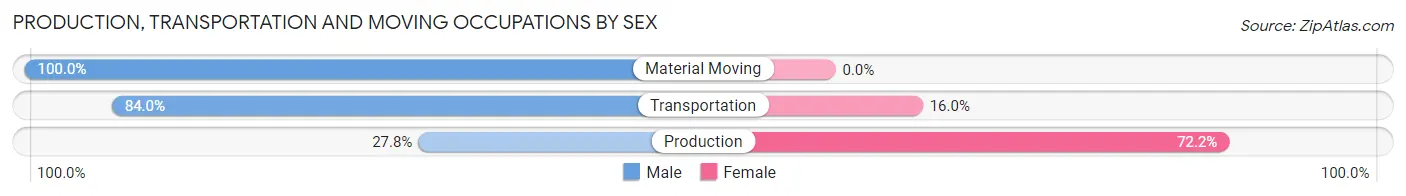
| Occupation | Male | Female |
| Production | 5 (27.8%) | 13 (72.2%) |
| Transportation | 21 (84.0%) | 4 (16.0%) |
| Material Moving | 7 (100.0%) | 0 (0.0%) |
| Total (Category) | 33 (66.0%) | 17 (34.0%) |
| Total (Overall) | 329 (60.3%) | 217 (39.7%) |
Employment Industries by Sex in Pierson
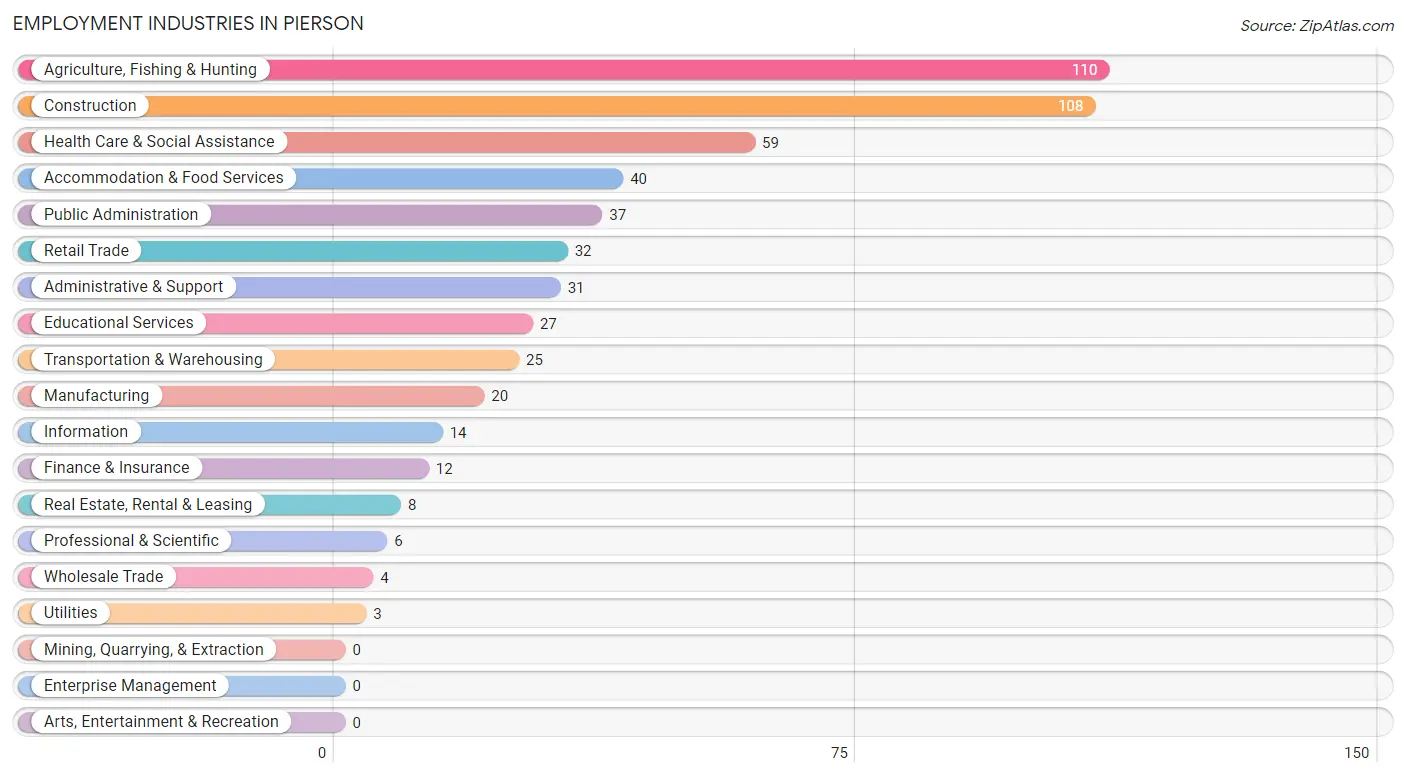
Employment Industries in Pierson
The major employment industries in Pierson include Agriculture, Fishing & Hunting (110 | 20.2%), Construction (108 | 19.8%), Health Care & Social Assistance (59 | 10.8%), Accommodation & Food Services (40 | 7.3%), and Public Administration (37 | 6.8%).
Employment Industries by Sex in Pierson
The Pierson industries that see more men than women are Wholesale Trade (100.0%), Utilities (100.0%), and Information (100.0%), whereas the industries that tend to have a higher number of women are Health Care & Social Assistance (100.0%), Accommodation & Food Services (100.0%), and Manufacturing (85.0%).
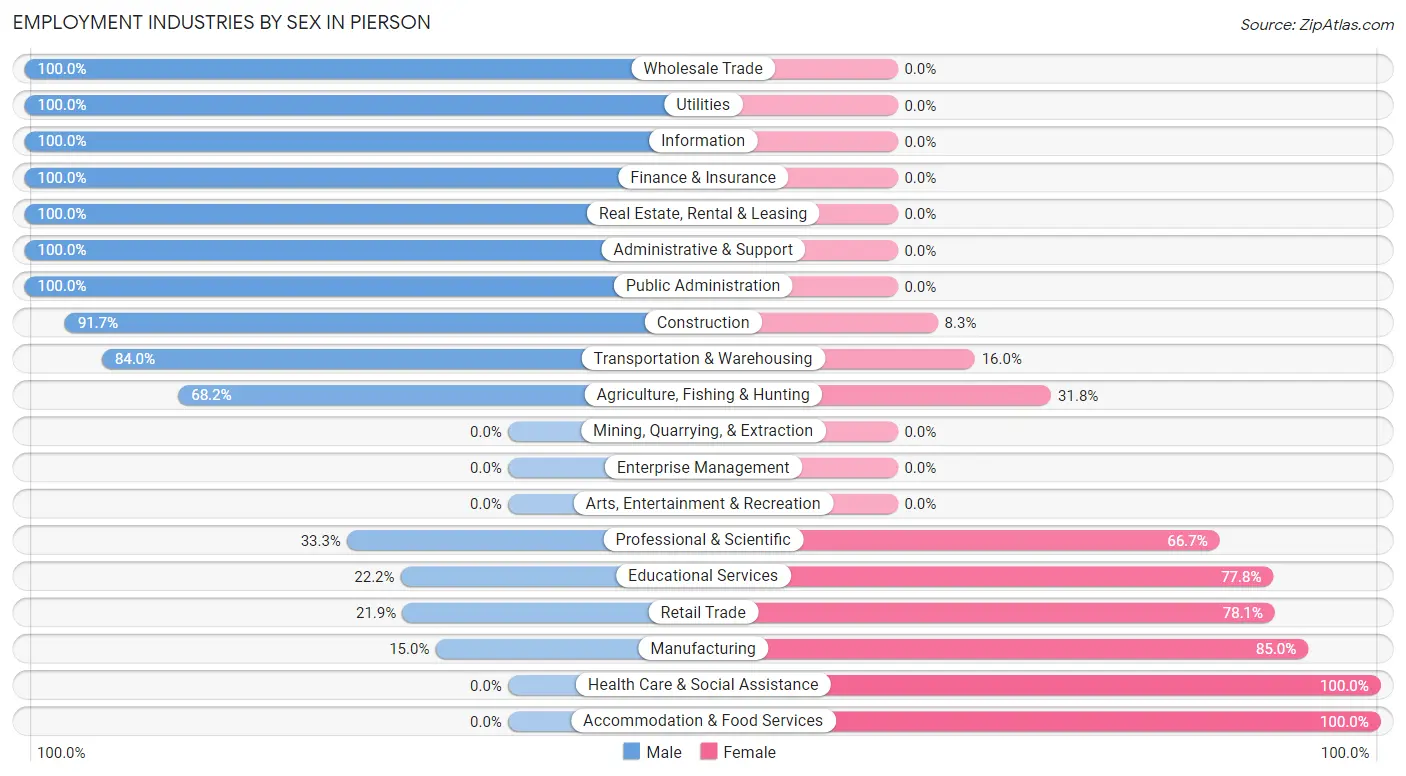
| Industry | Male | Female |
| Agriculture, Fishing & Hunting | 75 (68.2%) | 35 (31.8%) |
| Mining, Quarrying, & Extraction | 0 (0.0%) | 0 (0.0%) |
| Construction | 99 (91.7%) | 9 (8.3%) |
| Manufacturing | 3 (15.0%) | 17 (85.0%) |
| Wholesale Trade | 4 (100.0%) | 0 (0.0%) |
| Retail Trade | 7 (21.9%) | 25 (78.1%) |
| Transportation & Warehousing | 21 (84.0%) | 4 (16.0%) |
| Utilities | 3 (100.0%) | 0 (0.0%) |
| Information | 14 (100.0%) | 0 (0.0%) |
| Finance & Insurance | 12 (100.0%) | 0 (0.0%) |
| Real Estate, Rental & Leasing | 8 (100.0%) | 0 (0.0%) |
| Professional & Scientific | 2 (33.3%) | 4 (66.7%) |
| Enterprise Management | 0 (0.0%) | 0 (0.0%) |
| Administrative & Support | 31 (100.0%) | 0 (0.0%) |
| Educational Services | 6 (22.2%) | 21 (77.8%) |
| Health Care & Social Assistance | 0 (0.0%) | 59 (100.0%) |
| Arts, Entertainment & Recreation | 0 (0.0%) | 0 (0.0%) |
| Accommodation & Food Services | 0 (0.0%) | 40 (100.0%) |
| Public Administration | 37 (100.0%) | 0 (0.0%) |
| Total | 329 (60.3%) | 217 (39.7%) |
Education in Pierson
School Enrollment in Pierson
The most common levels of schooling among the 368 students in Pierson are middle school (147 | 40.0%), high school (90 | 24.5%), and elementary school (69 | 18.8%).
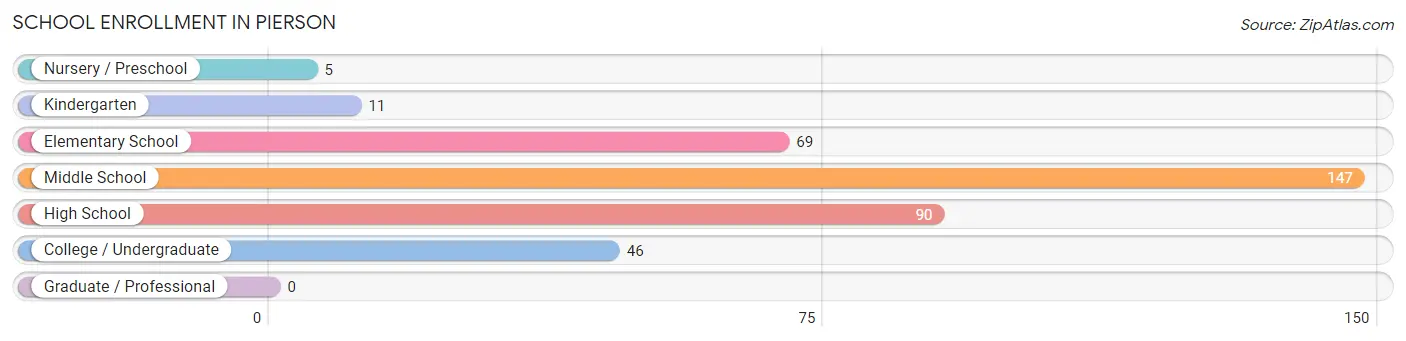
| School Level | # Students | % Students |
| Nursery / Preschool | 5 | 1.4% |
| Kindergarten | 11 | 3.0% |
| Elementary School | 69 | 18.8% |
| Middle School | 147 | 40.0% |
| High School | 90 | 24.5% |
| College / Undergraduate | 46 | 12.5% |
| Graduate / Professional | 0 | 0.0% |
| Total | 368 | 100.0% |
School Enrollment by Age by Funding Source in Pierson
Out of a total of 368 students who are enrolled in schools in Pierson, 7 (1.9%) attend a private institution, while the remaining 361 (98.1%) are enrolled in public schools. The age group of 25 to 34 year olds has the highest likelihood of being enrolled in private schools, with 7 (100.0% in the age bracket) enrolled. Conversely, the age group of 3 to 4 year olds has the lowest likelihood of being enrolled in a private school, with 5 (100.0% in the age bracket) attending a public institution.
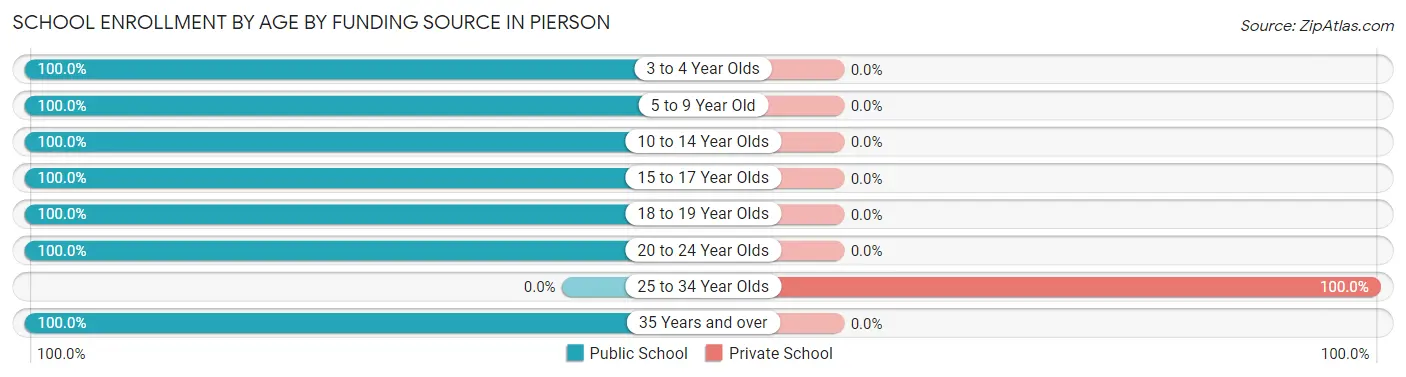
| Age Bracket | Public School | Private School |
| 3 to 4 Year Olds | 5 (100.0%) | 0 (0.0%) |
| 5 to 9 Year Old | 82 (100.0%) | 0 (0.0%) |
| 10 to 14 Year Olds | 197 (100.0%) | 0 (0.0%) |
| 15 to 17 Year Olds | 27 (100.0%) | 0 (0.0%) |
| 18 to 19 Year Olds | 22 (100.0%) | 0 (0.0%) |
| 20 to 24 Year Olds | 21 (100.0%) | 0 (0.0%) |
| 25 to 34 Year Olds | 0 (0.0%) | 7 (100.0%) |
| 35 Years and over | 7 (100.0%) | 0 (0.0%) |
| Total | 361 (98.1%) | 7 (1.9%) |
Educational Attainment by Field of Study in Pierson
Business (68 | 47.9%), science & technology (19 | 13.4%), bio, nature & agricultural (12 | 8.5%), social sciences (12 | 8.5%), and engineering (7 | 4.9%) are the most common fields of study among 142 individuals in Pierson who have obtained a bachelor's degree or higher.
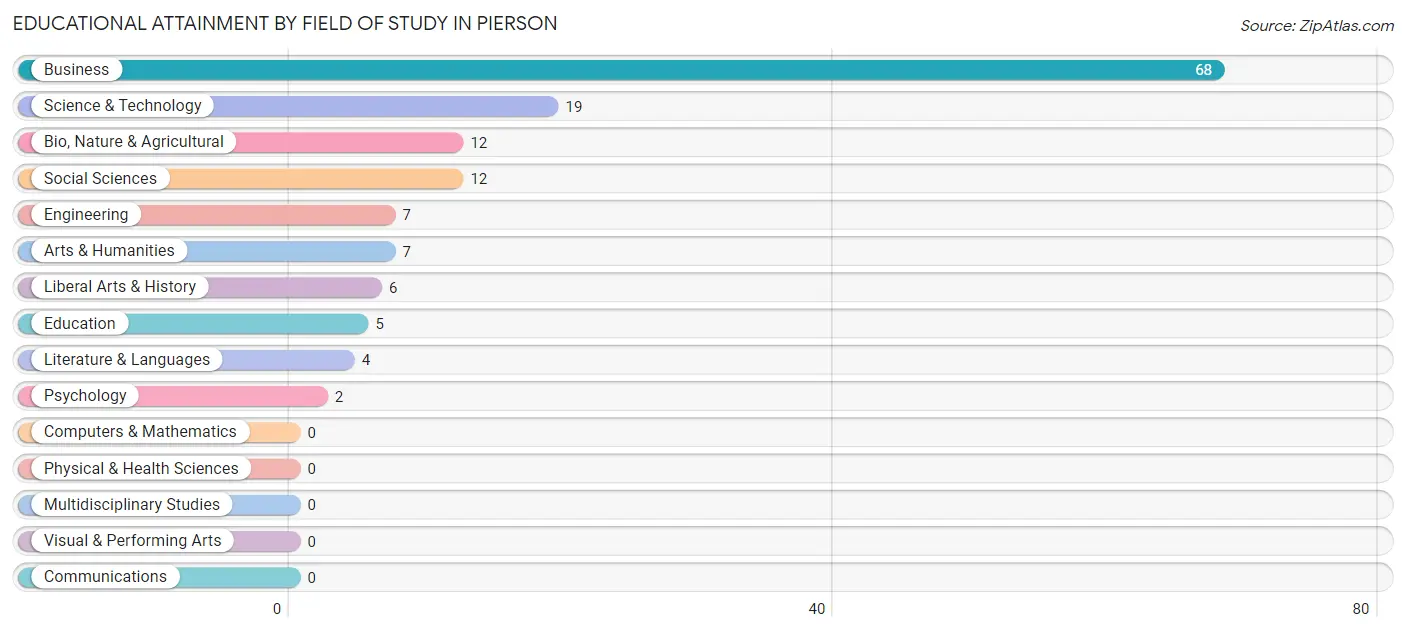
| Field of Study | # Graduates | % Graduates |
| Computers & Mathematics | 0 | 0.0% |
| Bio, Nature & Agricultural | 12 | 8.5% |
| Physical & Health Sciences | 0 | 0.0% |
| Psychology | 2 | 1.4% |
| Social Sciences | 12 | 8.5% |
| Engineering | 7 | 4.9% |
| Multidisciplinary Studies | 0 | 0.0% |
| Science & Technology | 19 | 13.4% |
| Business | 68 | 47.9% |
| Education | 5 | 3.5% |
| Literature & Languages | 4 | 2.8% |
| Liberal Arts & History | 6 | 4.2% |
| Visual & Performing Arts | 0 | 0.0% |
| Communications | 0 | 0.0% |
| Arts & Humanities | 7 | 4.9% |
| Total | 142 | 100.0% |
Transportation & Commute in Pierson
Vehicle Availability by Sex in Pierson
The most prevalent vehicle ownership categories in Pierson are males with 1 vehicle (90, accounting for 27.4%) and females with 1 vehicle (12, making up 42.4%).
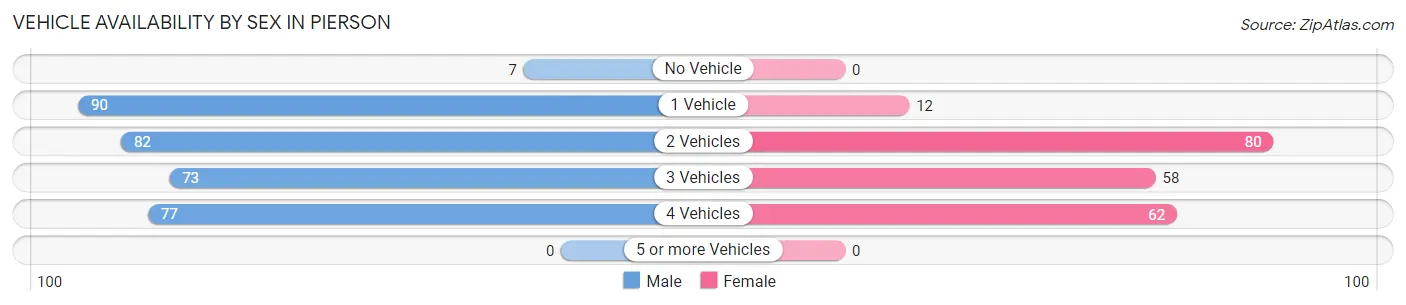
| Vehicles Available | Male | Female |
| No Vehicle | 7 (2.1%) | 0 (0.0%) |
| 1 Vehicle | 90 (27.4%) | 12 (5.7%) |
| 2 Vehicles | 82 (24.9%) | 80 (37.7%) |
| 3 Vehicles | 73 (22.2%) | 58 (27.4%) |
| 4 Vehicles | 77 (23.4%) | 62 (29.2%) |
| 5 or more Vehicles | 0 (0.0%) | 0 (0.0%) |
| Total | 329 (100.0%) | 212 (100.0%) |
Commute Time in Pierson
The most frequently occuring commute durations in Pierson are 10 to 14 minutes (109 commuters, 20.9%), 60 to 89 minutes (89 commuters, 17.1%), and 15 to 19 minutes (69 commuters, 13.2%).
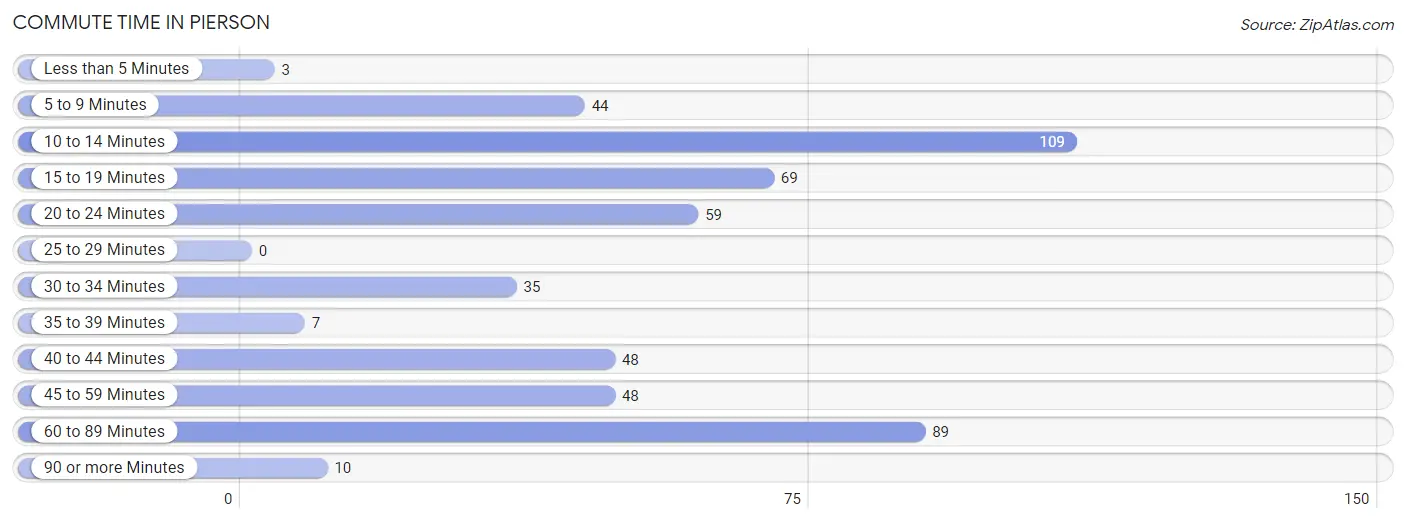
| Commute Time | # Commuters | % Commuters |
| Less than 5 Minutes | 3 | 0.6% |
| 5 to 9 Minutes | 44 | 8.5% |
| 10 to 14 Minutes | 109 | 20.9% |
| 15 to 19 Minutes | 69 | 13.2% |
| 20 to 24 Minutes | 59 | 11.3% |
| 25 to 29 Minutes | 0 | 0.0% |
| 30 to 34 Minutes | 35 | 6.7% |
| 35 to 39 Minutes | 7 | 1.3% |
| 40 to 44 Minutes | 48 | 9.2% |
| 45 to 59 Minutes | 48 | 9.2% |
| 60 to 89 Minutes | 89 | 17.1% |
| 90 or more Minutes | 10 | 1.9% |
Commute Time by Sex in Pierson
The most common commute times in Pierson are 60 to 89 minutes (78 commuters, 25.0%) for males and 15 to 19 minutes (40 commuters, 19.1%) for females.
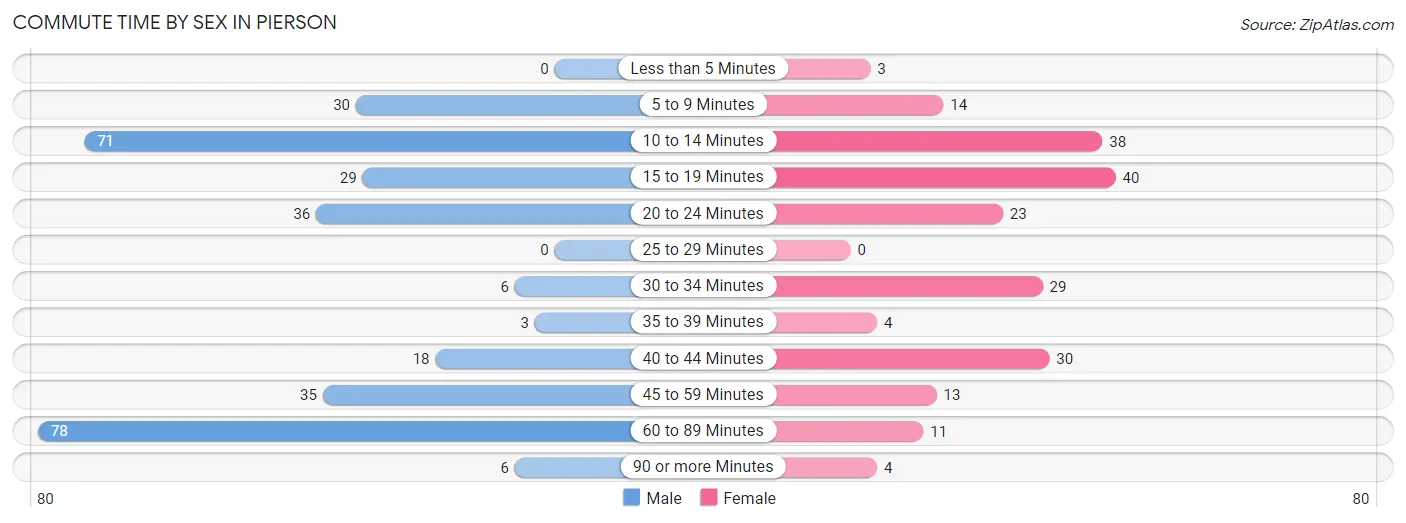
| Commute Time | Male | Female |
| Less than 5 Minutes | 0 (0.0%) | 3 (1.4%) |
| 5 to 9 Minutes | 30 (9.6%) | 14 (6.7%) |
| 10 to 14 Minutes | 71 (22.8%) | 38 (18.2%) |
| 15 to 19 Minutes | 29 (9.3%) | 40 (19.1%) |
| 20 to 24 Minutes | 36 (11.5%) | 23 (11.0%) |
| 25 to 29 Minutes | 0 (0.0%) | 0 (0.0%) |
| 30 to 34 Minutes | 6 (1.9%) | 29 (13.9%) |
| 35 to 39 Minutes | 3 (1.0%) | 4 (1.9%) |
| 40 to 44 Minutes | 18 (5.8%) | 30 (14.3%) |
| 45 to 59 Minutes | 35 (11.2%) | 13 (6.2%) |
| 60 to 89 Minutes | 78 (25.0%) | 11 (5.3%) |
| 90 or more Minutes | 6 (1.9%) | 4 (1.9%) |
Time of Departure to Work by Sex in Pierson
The most frequent times of departure to work in Pierson are 8:00 AM to 8:29 AM (53, 17.0%) for males and 8:00 AM to 8:29 AM (68, 32.5%) for females.
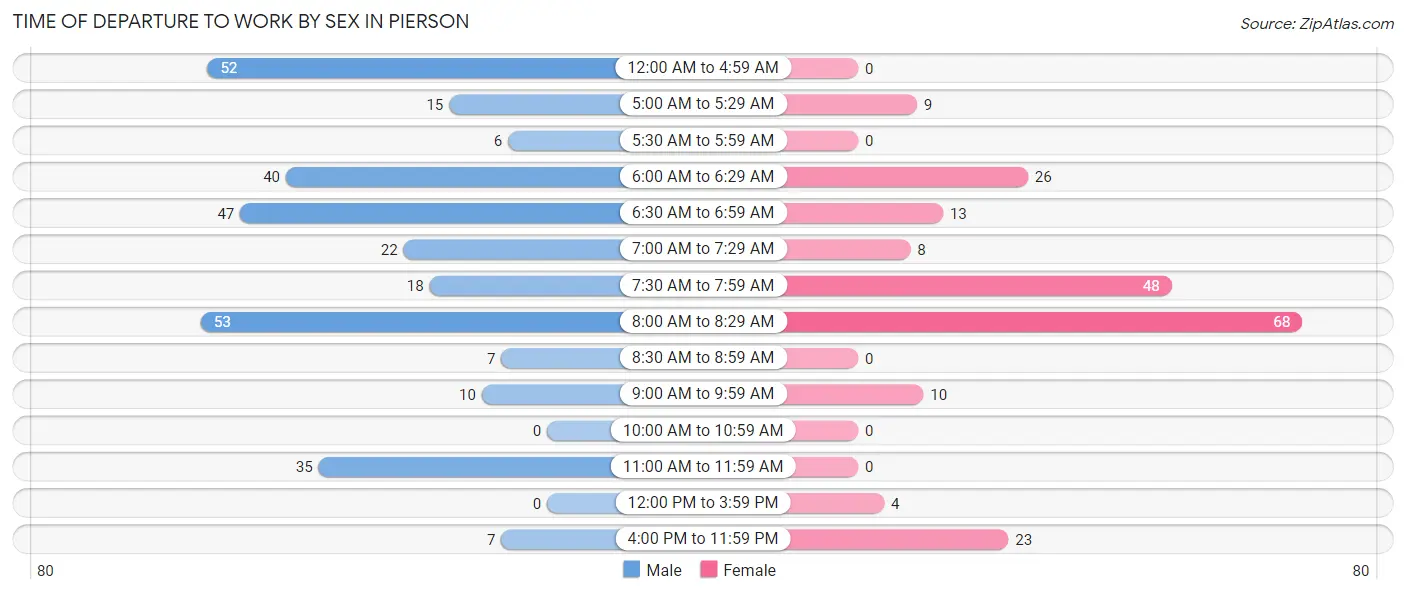
| Time of Departure | Male | Female |
| 12:00 AM to 4:59 AM | 52 (16.7%) | 0 (0.0%) |
| 5:00 AM to 5:29 AM | 15 (4.8%) | 9 (4.3%) |
| 5:30 AM to 5:59 AM | 6 (1.9%) | 0 (0.0%) |
| 6:00 AM to 6:29 AM | 40 (12.8%) | 26 (12.4%) |
| 6:30 AM to 6:59 AM | 47 (15.1%) | 13 (6.2%) |
| 7:00 AM to 7:29 AM | 22 (7.0%) | 8 (3.8%) |
| 7:30 AM to 7:59 AM | 18 (5.8%) | 48 (23.0%) |
| 8:00 AM to 8:29 AM | 53 (17.0%) | 68 (32.5%) |
| 8:30 AM to 8:59 AM | 7 (2.2%) | 0 (0.0%) |
| 9:00 AM to 9:59 AM | 10 (3.2%) | 10 (4.8%) |
| 10:00 AM to 10:59 AM | 0 (0.0%) | 0 (0.0%) |
| 11:00 AM to 11:59 AM | 35 (11.2%) | 0 (0.0%) |
| 12:00 PM to 3:59 PM | 0 (0.0%) | 4 (1.9%) |
| 4:00 PM to 11:59 PM | 7 (2.2%) | 23 (11.0%) |
| Total | 312 (100.0%) | 209 (100.0%) |
Housing Occupancy in Pierson
Occupancy by Ownership in Pierson
Of the total 466 dwellings in Pierson, owner-occupied units account for 327 (70.2%), while renter-occupied units make up 139 (29.8%).
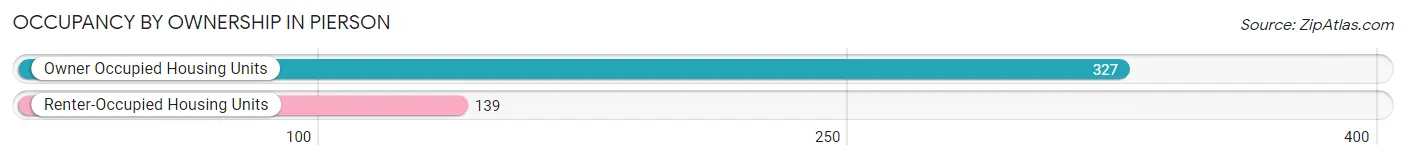
| Occupancy | # Housing Units | % Housing Units |
| Owner Occupied Housing Units | 327 | 70.2% |
| Renter-Occupied Housing Units | 139 | 29.8% |
| Total Occupied Housing Units | 466 | 100.0% |
Occupancy by Household Size in Pierson
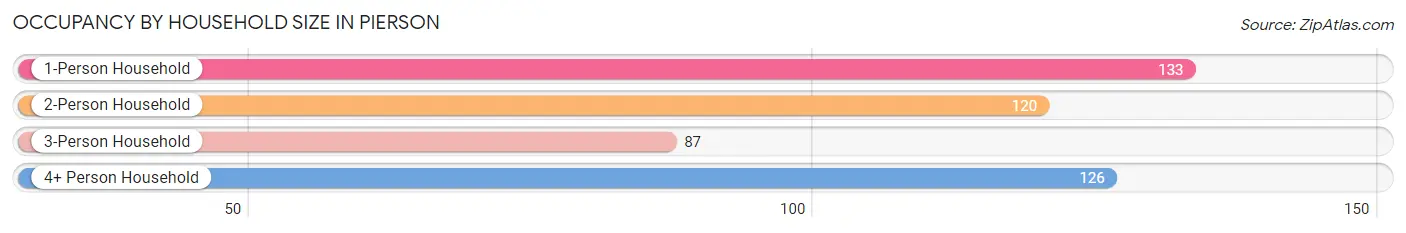
| Household Size | # Housing Units | % Housing Units |
| 1-Person Household | 133 | 28.5% |
| 2-Person Household | 120 | 25.8% |
| 3-Person Household | 87 | 18.7% |
| 4+ Person Household | 126 | 27.0% |
| Total Housing Units | 466 | 100.0% |
Occupancy by Ownership by Household Size in Pierson
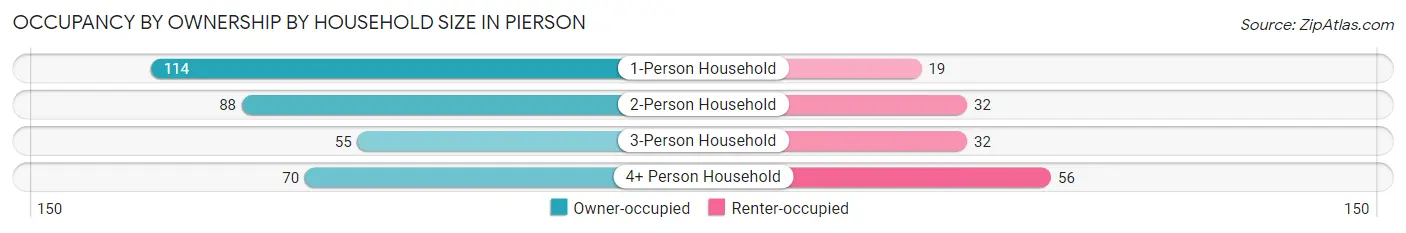
| Household Size | Owner-occupied | Renter-occupied |
| 1-Person Household | 114 (85.7%) | 19 (14.3%) |
| 2-Person Household | 88 (73.3%) | 32 (26.7%) |
| 3-Person Household | 55 (63.2%) | 32 (36.8%) |
| 4+ Person Household | 70 (55.6%) | 56 (44.4%) |
| Total Housing Units | 327 (70.2%) | 139 (29.8%) |
Occupancy by Educational Attainment in Pierson
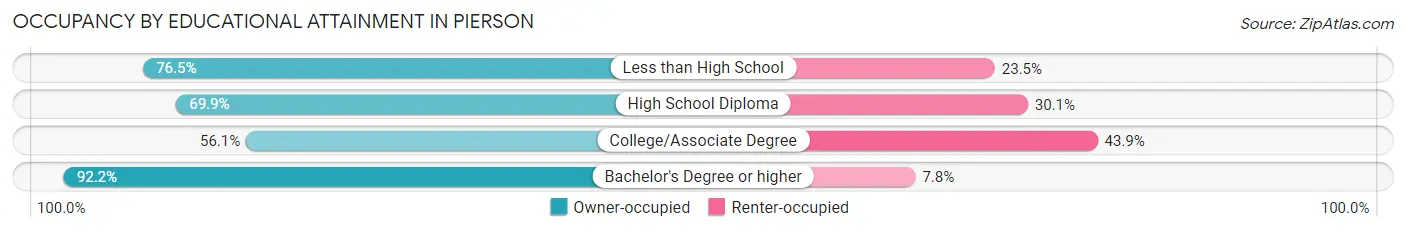
| Household Size | Owner-occupied | Renter-occupied |
| Less than High School | 78 (76.5%) | 24 (23.5%) |
| High School Diploma | 86 (69.9%) | 37 (30.1%) |
| College/Associate Degree | 92 (56.1%) | 72 (43.9%) |
| Bachelor's Degree or higher | 71 (92.2%) | 6 (7.8%) |
Occupancy by Age of Householder in Pierson
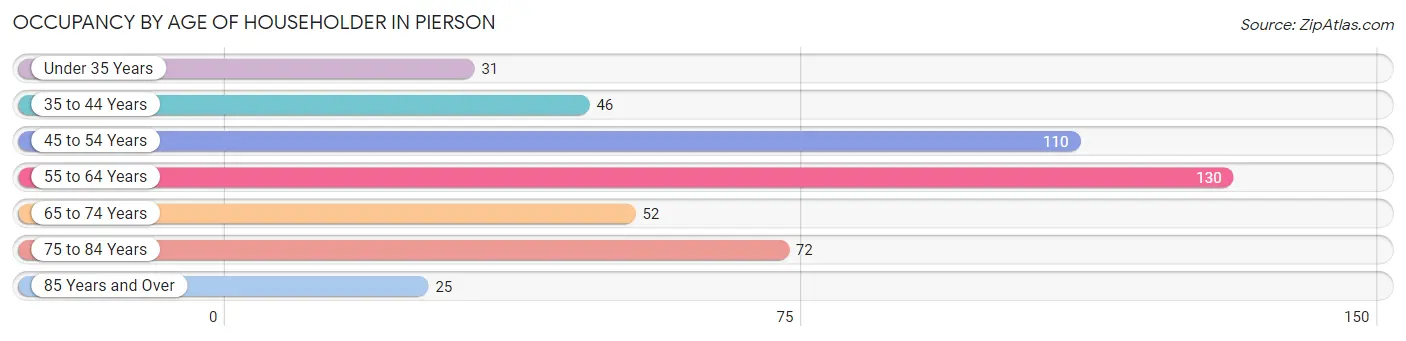
| Age Bracket | # Households | % Households |
| Under 35 Years | 31 | 6.7% |
| 35 to 44 Years | 46 | 9.9% |
| 45 to 54 Years | 110 | 23.6% |
| 55 to 64 Years | 130 | 27.9% |
| 65 to 74 Years | 52 | 11.2% |
| 75 to 84 Years | 72 | 15.4% |
| 85 Years and Over | 25 | 5.4% |
| Total | 466 | 100.0% |
Housing Finances in Pierson
Median Income by Occupancy in Pierson
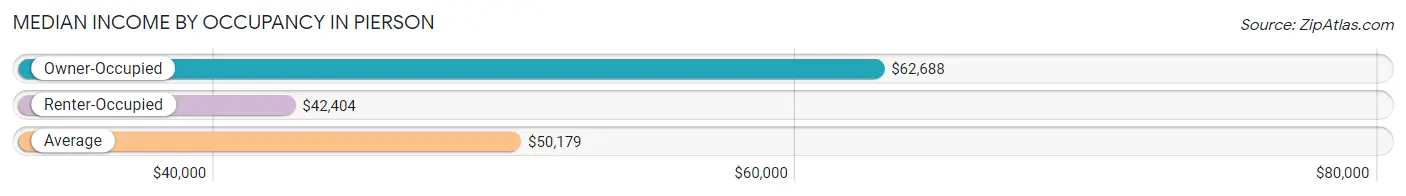
| Occupancy Type | # Households | Median Income |
| Owner-Occupied | 327 (70.2%) | $62,688 |
| Renter-Occupied | 139 (29.8%) | $42,404 |
| Average | 466 (100.0%) | $50,179 |
Occupancy by Householder Income Bracket in Pierson
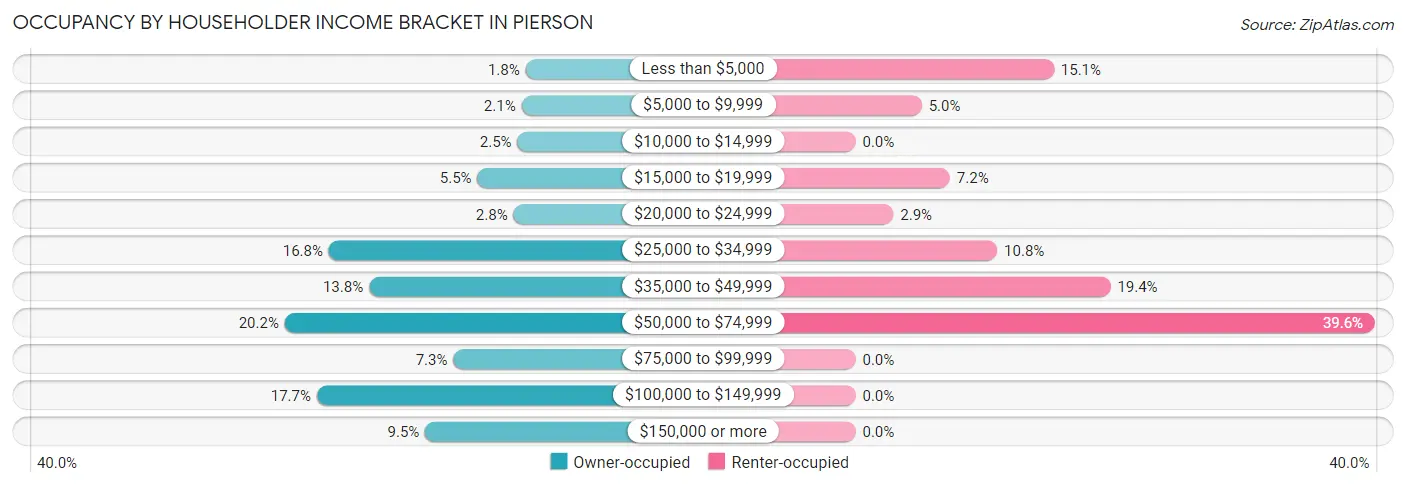
| Income Bracket | Owner-occupied | Renter-occupied |
| Less than $5,000 | 6 (1.8%) | 21 (15.1%) |
| $5,000 to $9,999 | 7 (2.1%) | 7 (5.0%) |
| $10,000 to $14,999 | 8 (2.5%) | 0 (0.0%) |
| $15,000 to $19,999 | 18 (5.5%) | 10 (7.2%) |
| $20,000 to $24,999 | 9 (2.8%) | 4 (2.9%) |
| $25,000 to $34,999 | 55 (16.8%) | 15 (10.8%) |
| $35,000 to $49,999 | 45 (13.8%) | 27 (19.4%) |
| $50,000 to $74,999 | 66 (20.2%) | 55 (39.6%) |
| $75,000 to $99,999 | 24 (7.3%) | 0 (0.0%) |
| $100,000 to $149,999 | 58 (17.7%) | 0 (0.0%) |
| $150,000 or more | 31 (9.5%) | 0 (0.0%) |
| Total | 327 (100.0%) | 139 (100.0%) |
Monthly Housing Cost Tiers in Pierson
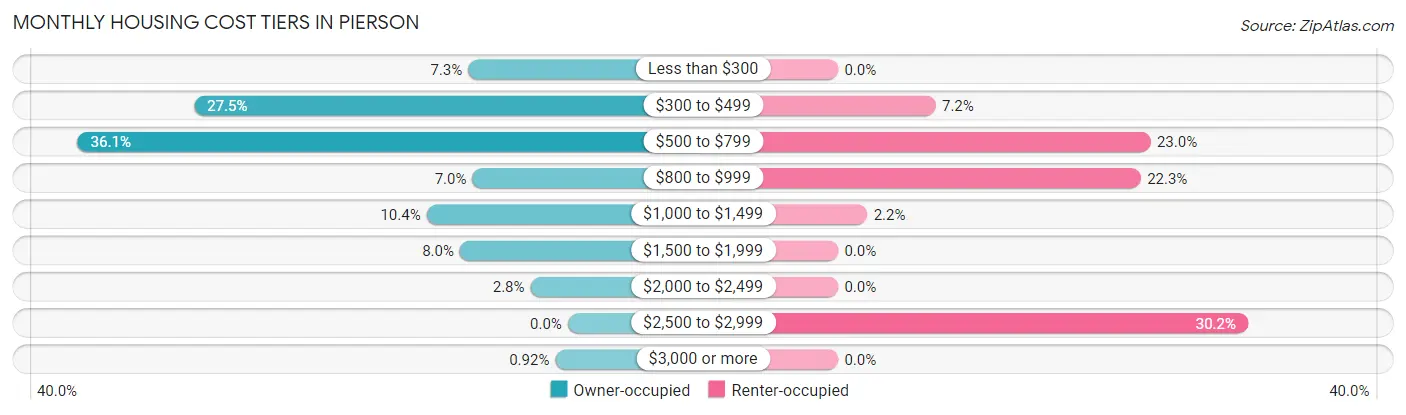
| Monthly Cost | Owner-occupied | Renter-occupied |
| Less than $300 | 24 (7.3%) | 0 (0.0%) |
| $300 to $499 | 90 (27.5%) | 10 (7.2%) |
| $500 to $799 | 118 (36.1%) | 32 (23.0%) |
| $800 to $999 | 23 (7.0%) | 31 (22.3%) |
| $1,000 to $1,499 | 34 (10.4%) | 3 (2.2%) |
| $1,500 to $1,999 | 26 (8.0%) | 0 (0.0%) |
| $2,000 to $2,499 | 9 (2.8%) | 0 (0.0%) |
| $2,500 to $2,999 | 0 (0.0%) | 42 (30.2%) |
| $3,000 or more | 3 (0.9%) | 0 (0.0%) |
| Total | 327 (100.0%) | 139 (100.0%) |
Physical Housing Characteristics in Pierson
Housing Structures in Pierson
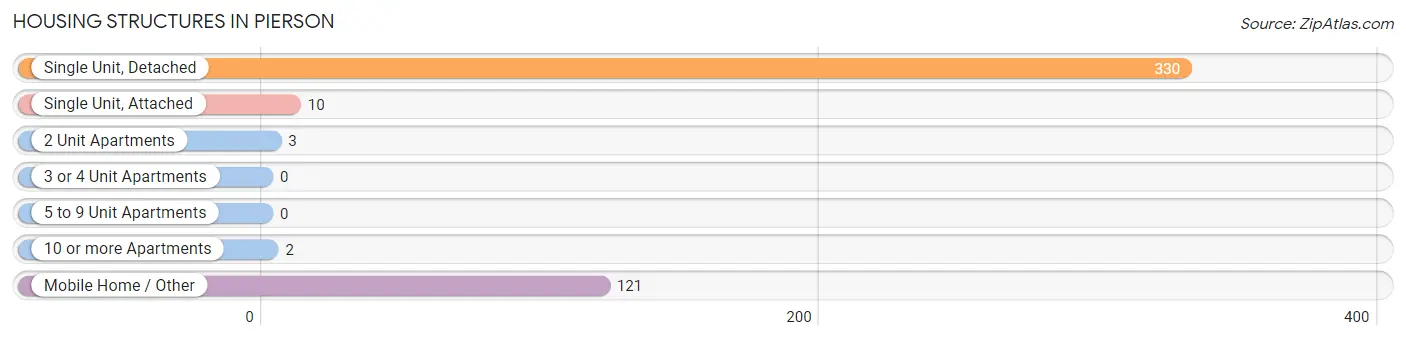
| Structure Type | # Housing Units | % Housing Units |
| Single Unit, Detached | 330 | 70.8% |
| Single Unit, Attached | 10 | 2.1% |
| 2 Unit Apartments | 3 | 0.6% |
| 3 or 4 Unit Apartments | 0 | 0.0% |
| 5 to 9 Unit Apartments | 0 | 0.0% |
| 10 or more Apartments | 2 | 0.4% |
| Mobile Home / Other | 121 | 26.0% |
| Total | 466 | 100.0% |
Housing Structures by Occupancy in Pierson
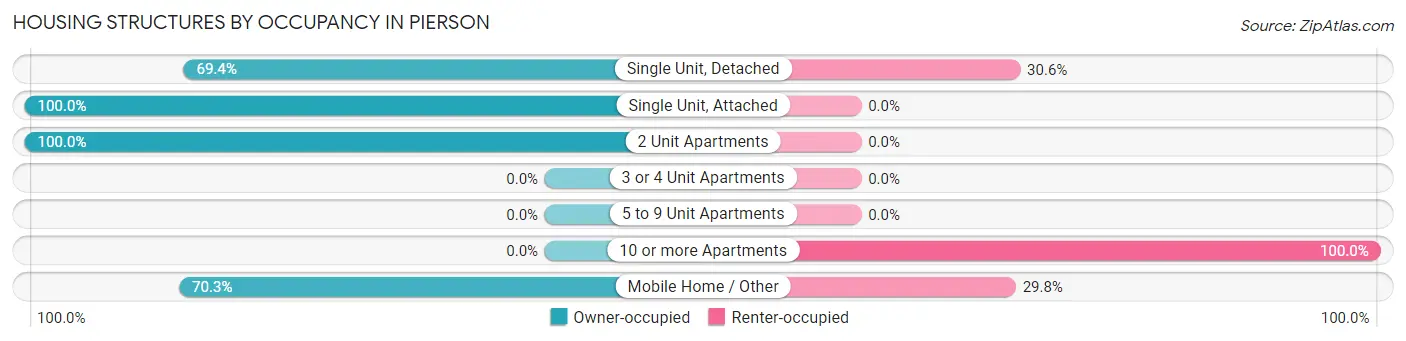
| Structure Type | Owner-occupied | Renter-occupied |
| Single Unit, Detached | 229 (69.4%) | 101 (30.6%) |
| Single Unit, Attached | 10 (100.0%) | 0 (0.0%) |
| 2 Unit Apartments | 3 (100.0%) | 0 (0.0%) |
| 3 or 4 Unit Apartments | 0 (0.0%) | 0 (0.0%) |
| 5 to 9 Unit Apartments | 0 (0.0%) | 0 (0.0%) |
| 10 or more Apartments | 0 (0.0%) | 2 (100.0%) |
| Mobile Home / Other | 85 (70.3%) | 36 (29.7%) |
| Total | 327 (70.2%) | 139 (29.8%) |
Housing Structures by Number of Rooms in Pierson
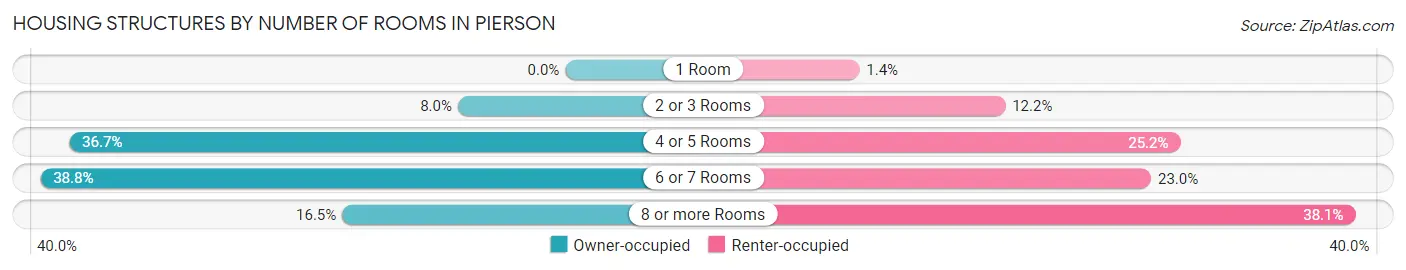
| Number of Rooms | Owner-occupied | Renter-occupied |
| 1 Room | 0 (0.0%) | 2 (1.4%) |
| 2 or 3 Rooms | 26 (8.0%) | 17 (12.2%) |
| 4 or 5 Rooms | 120 (36.7%) | 35 (25.2%) |
| 6 or 7 Rooms | 127 (38.8%) | 32 (23.0%) |
| 8 or more Rooms | 54 (16.5%) | 53 (38.1%) |
| Total | 327 (100.0%) | 139 (100.0%) |
Housing Structure by Heating Type in Pierson
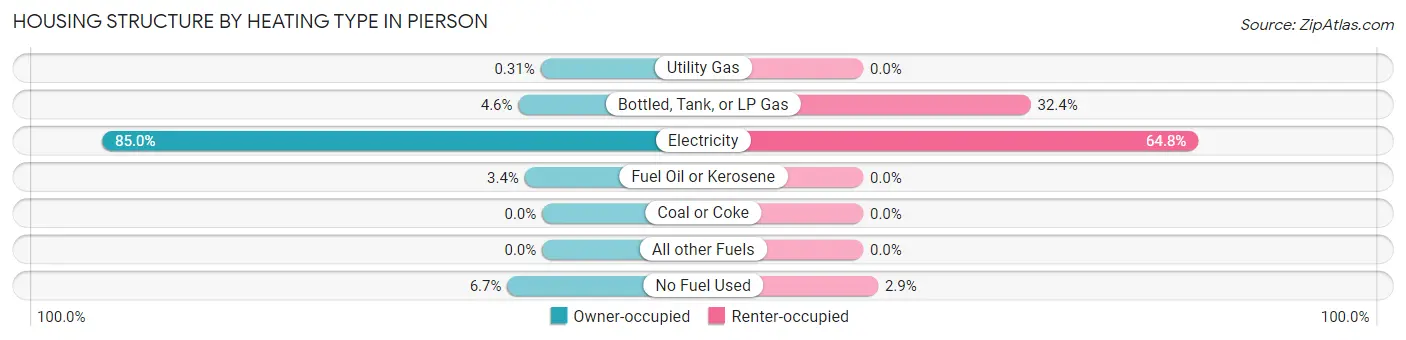
| Heating Type | Owner-occupied | Renter-occupied |
| Utility Gas | 1 (0.3%) | 0 (0.0%) |
| Bottled, Tank, or LP Gas | 15 (4.6%) | 45 (32.4%) |
| Electricity | 278 (85.0%) | 90 (64.7%) |
| Fuel Oil or Kerosene | 11 (3.4%) | 0 (0.0%) |
| Coal or Coke | 0 (0.0%) | 0 (0.0%) |
| All other Fuels | 0 (0.0%) | 0 (0.0%) |
| No Fuel Used | 22 (6.7%) | 4 (2.9%) |
| Total | 327 (100.0%) | 139 (100.0%) |
Household Vehicle Usage in Pierson
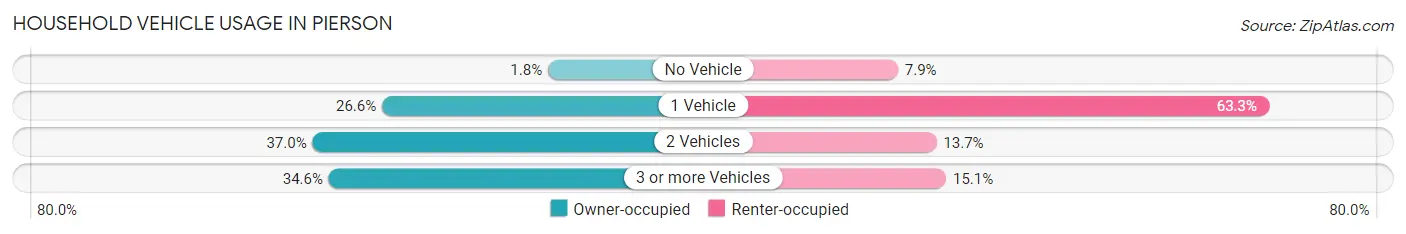
| Vehicles per Household | Owner-occupied | Renter-occupied |
| No Vehicle | 6 (1.8%) | 11 (7.9%) |
| 1 Vehicle | 87 (26.6%) | 88 (63.3%) |
| 2 Vehicles | 121 (37.0%) | 19 (13.7%) |
| 3 or more Vehicles | 113 (34.6%) | 21 (15.1%) |
| Total | 327 (100.0%) | 139 (100.0%) |
Real Estate & Mortgages in Pierson
Real Estate and Mortgage Overview in Pierson
| Characteristic | Without Mortgage | With Mortgage |
| Housing Units | 231 | 96 |
| Median Property Value | $214,100 | $219,700 |
| Median Household Income | $52,250 | $6 |
| Monthly Housing Costs | $532 | $3 |
| Real Estate Taxes | $1,413 | $4 |
Property Value by Mortgage Status in Pierson
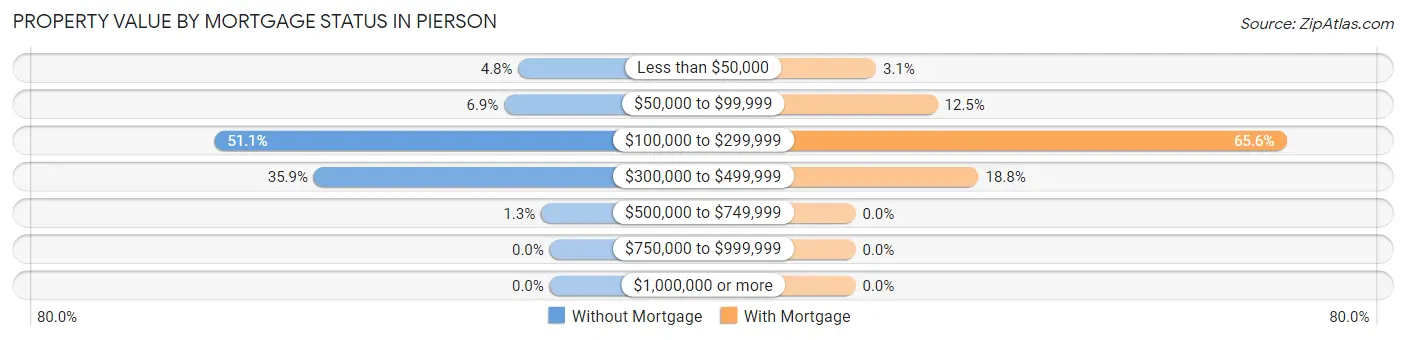
| Property Value | Without Mortgage | With Mortgage |
| Less than $50,000 | 11 (4.8%) | 3 (3.1%) |
| $50,000 to $99,999 | 16 (6.9%) | 12 (12.5%) |
| $100,000 to $299,999 | 118 (51.1%) | 63 (65.6%) |
| $300,000 to $499,999 | 83 (35.9%) | 18 (18.8%) |
| $500,000 to $749,999 | 3 (1.3%) | 0 (0.0%) |
| $750,000 to $999,999 | 0 (0.0%) | 0 (0.0%) |
| $1,000,000 or more | 0 (0.0%) | 0 (0.0%) |
| Total | 231 (100.0%) | 96 (100.0%) |
Household Income by Mortgage Status in Pierson
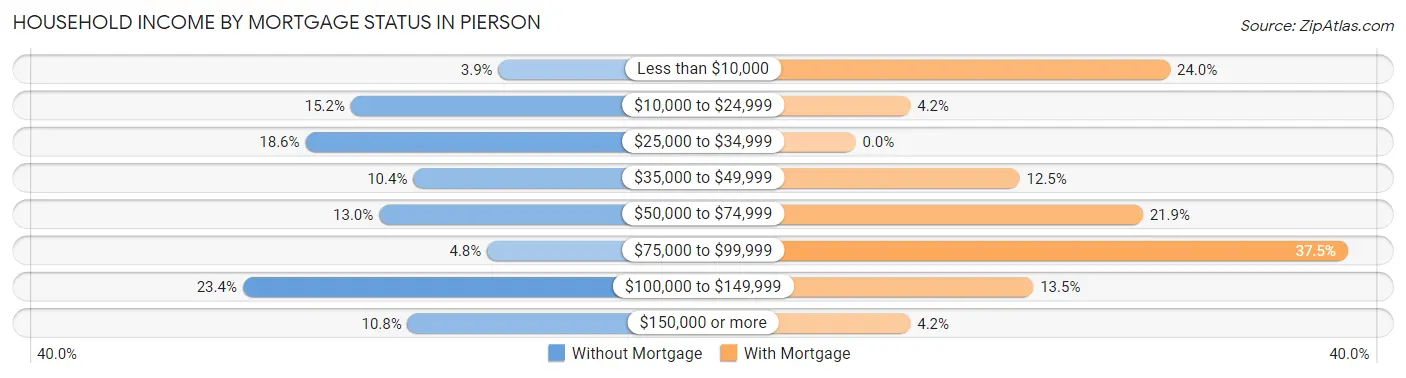
| Household Income | Without Mortgage | With Mortgage |
| Less than $10,000 | 9 (3.9%) | 23 (24.0%) |
| $10,000 to $24,999 | 35 (15.1%) | 4 (4.2%) |
| $25,000 to $34,999 | 43 (18.6%) | 0 (0.0%) |
| $35,000 to $49,999 | 24 (10.4%) | 12 (12.5%) |
| $50,000 to $74,999 | 30 (13.0%) | 21 (21.9%) |
| $75,000 to $99,999 | 11 (4.8%) | 36 (37.5%) |
| $100,000 to $149,999 | 54 (23.4%) | 13 (13.5%) |
| $150,000 or more | 25 (10.8%) | 4 (4.2%) |
| Total | 231 (100.0%) | 96 (100.0%) |
Property Value to Household Income Ratio in Pierson
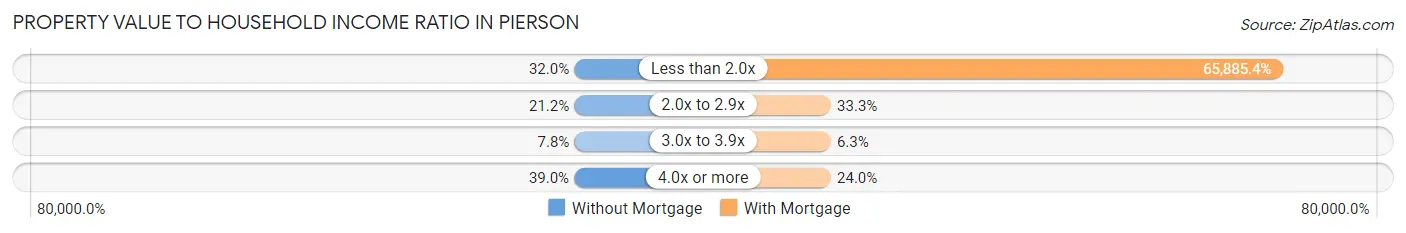
| Value-to-Income Ratio | Without Mortgage | With Mortgage |
| Less than 2.0x | 74 (32.0%) | 63,250 (65,885.4%) |
| 2.0x to 2.9x | 49 (21.2%) | 32 (33.3%) |
| 3.0x to 3.9x | 18 (7.8%) | 6 (6.2%) |
| 4.0x or more | 90 (39.0%) | 23 (24.0%) |
| Total | 231 (100.0%) | 96 (100.0%) |
Real Estate Taxes by Mortgage Status in Pierson
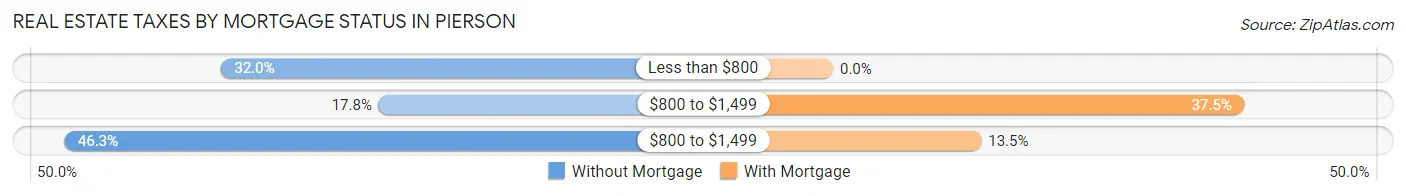
| Property Taxes | Without Mortgage | With Mortgage |
| Less than $800 | 74 (32.0%) | 0 (0.0%) |
| $800 to $1,499 | 41 (17.7%) | 36 (37.5%) |
| $800 to $1,499 | 107 (46.3%) | 13 (13.5%) |
| Total | 231 (100.0%) | 96 (100.0%) |
Health & Disability in Pierson
Health Insurance Coverage by Age in Pierson
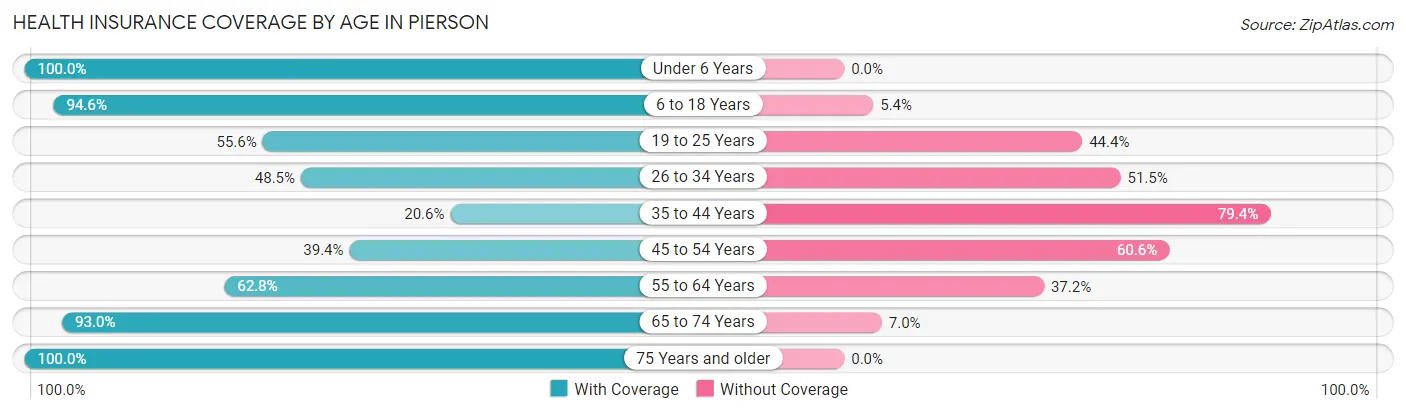
| Age Bracket | With Coverage | Without Coverage |
| Under 6 Years | 30 (100.0%) | 0 (0.0%) |
| 6 to 18 Years | 297 (94.6%) | 17 (5.4%) |
| 19 to 25 Years | 79 (55.6%) | 63 (44.4%) |
| 26 to 34 Years | 32 (48.5%) | 34 (51.5%) |
| 35 to 44 Years | 20 (20.6%) | 77 (79.4%) |
| 45 to 54 Years | 84 (39.4%) | 129 (60.6%) |
| 55 to 64 Years | 150 (62.8%) | 89 (37.2%) |
| 65 to 74 Years | 93 (93.0%) | 7 (7.0%) |
| 75 Years and older | 131 (100.0%) | 0 (0.0%) |
| Total | 916 (68.8%) | 416 (31.2%) |
Health Insurance Coverage by Citizenship Status in Pierson
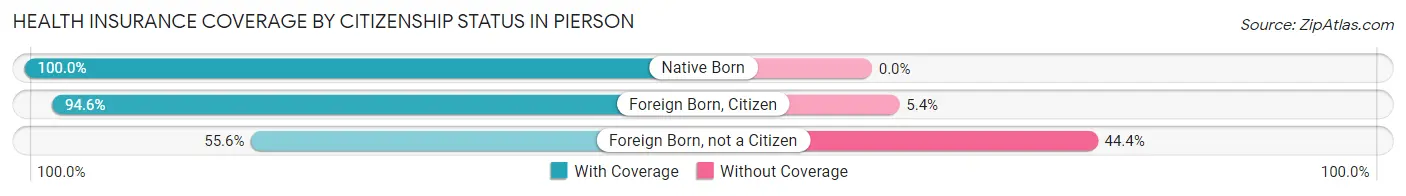
| Citizenship Status | With Coverage | Without Coverage |
| Native Born | 30 (100.0%) | 0 (0.0%) |
| Foreign Born, Citizen | 297 (94.6%) | 17 (5.4%) |
| Foreign Born, not a Citizen | 79 (55.6%) | 63 (44.4%) |
Health Insurance Coverage by Household Income in Pierson
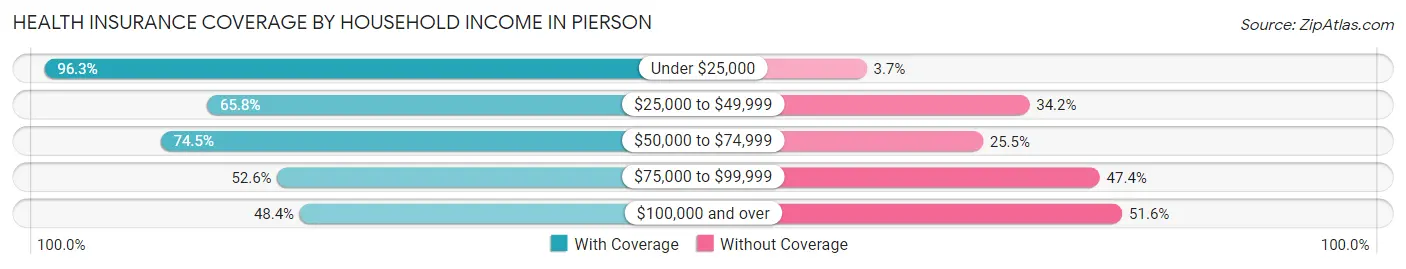
| Household Income | With Coverage | Without Coverage |
| Under $25,000 | 182 (96.3%) | 7 (3.7%) |
| $25,000 to $49,999 | 206 (65.8%) | 107 (34.2%) |
| $50,000 to $74,999 | 351 (74.5%) | 120 (25.5%) |
| $75,000 to $99,999 | 40 (52.6%) | 36 (47.4%) |
| $100,000 and over | 137 (48.4%) | 146 (51.6%) |
Public vs Private Health Insurance Coverage by Age in Pierson
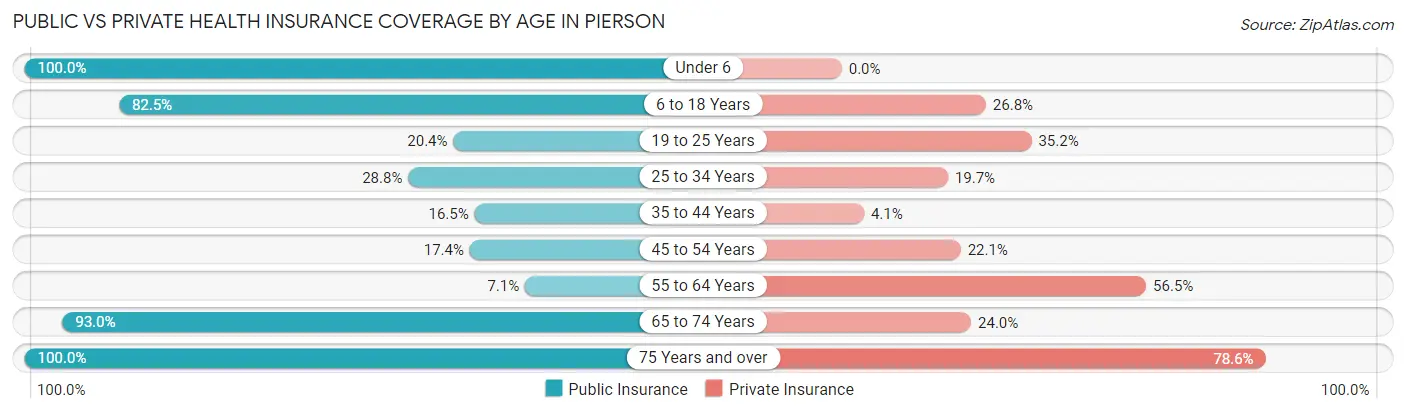
| Age Bracket | Public Insurance | Private Insurance |
| Under 6 | 30 (100.0%) | 0 (0.0%) |
| 6 to 18 Years | 259 (82.5%) | 84 (26.8%) |
| 19 to 25 Years | 29 (20.4%) | 50 (35.2%) |
| 25 to 34 Years | 19 (28.8%) | 13 (19.7%) |
| 35 to 44 Years | 16 (16.5%) | 4 (4.1%) |
| 45 to 54 Years | 37 (17.4%) | 47 (22.1%) |
| 55 to 64 Years | 17 (7.1%) | 135 (56.5%) |
| 65 to 74 Years | 93 (93.0%) | 24 (24.0%) |
| 75 Years and over | 131 (100.0%) | 103 (78.6%) |
| Total | 631 (47.4%) | 460 (34.5%) |
Disability Status by Sex by Age in Pierson
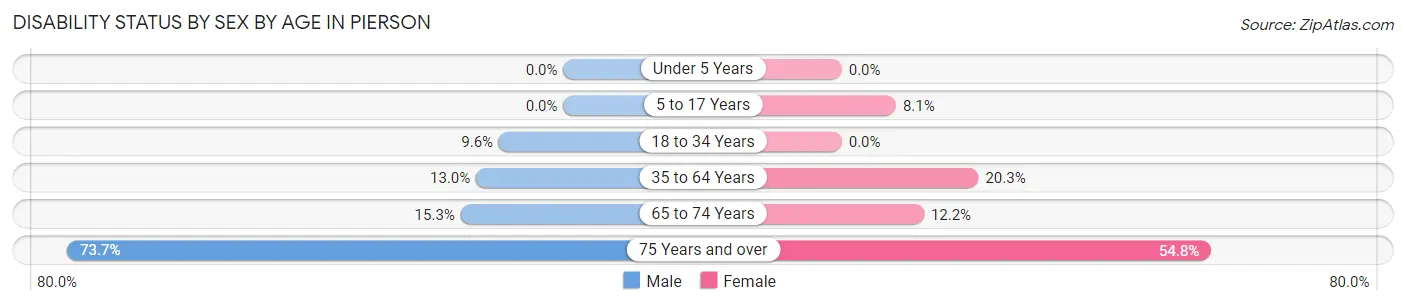
| Age Bracket | Male | Female |
| Under 5 Years | 0 (0.0%) | 0 (0.0%) |
| 5 to 17 Years | 0 (0.0%) | 12 (8.1%) |
| 18 to 34 Years | 11 (9.6%) | 0 (0.0%) |
| 35 to 64 Years | 36 (13.0%) | 55 (20.3%) |
| 65 to 74 Years | 9 (15.2%) | 5 (12.2%) |
| 75 Years and over | 28 (73.7%) | 51 (54.8%) |
Disability Class by Sex by Age in Pierson
Disability Class: Hearing Difficulty
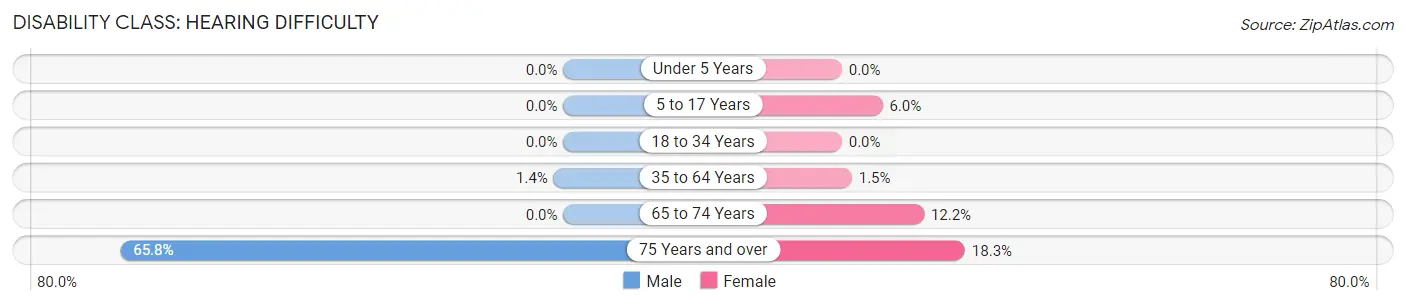
| Age Bracket | Male | Female |
| Under 5 Years | 0 (0.0%) | 0 (0.0%) |
| 5 to 17 Years | 0 (0.0%) | 9 (6.0%) |
| 18 to 34 Years | 0 (0.0%) | 0 (0.0%) |
| 35 to 64 Years | 4 (1.4%) | 4 (1.5%) |
| 65 to 74 Years | 0 (0.0%) | 5 (12.2%) |
| 75 Years and over | 25 (65.8%) | 17 (18.3%) |
Disability Class: Vision Difficulty
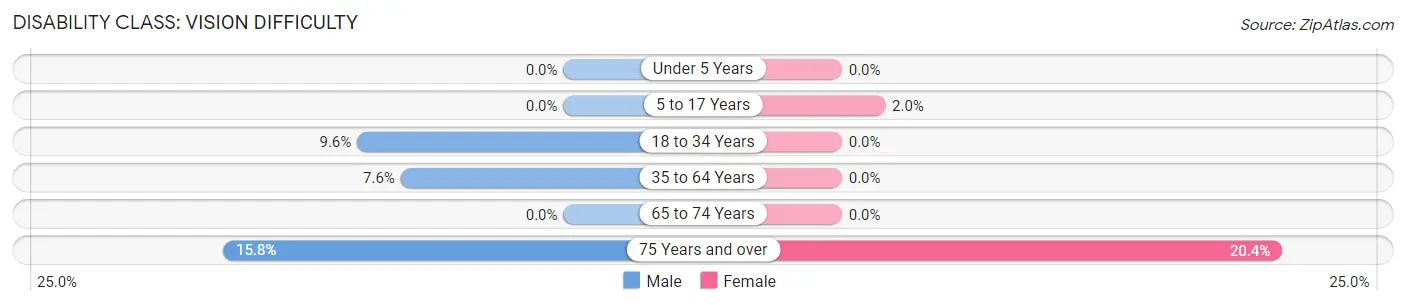
| Age Bracket | Male | Female |
| Under 5 Years | 0 (0.0%) | 0 (0.0%) |
| 5 to 17 Years | 0 (0.0%) | 3 (2.0%) |
| 18 to 34 Years | 11 (9.6%) | 0 (0.0%) |
| 35 to 64 Years | 21 (7.5%) | 0 (0.0%) |
| 65 to 74 Years | 0 (0.0%) | 0 (0.0%) |
| 75 Years and over | 6 (15.8%) | 19 (20.4%) |
Disability Class: Cognitive Difficulty
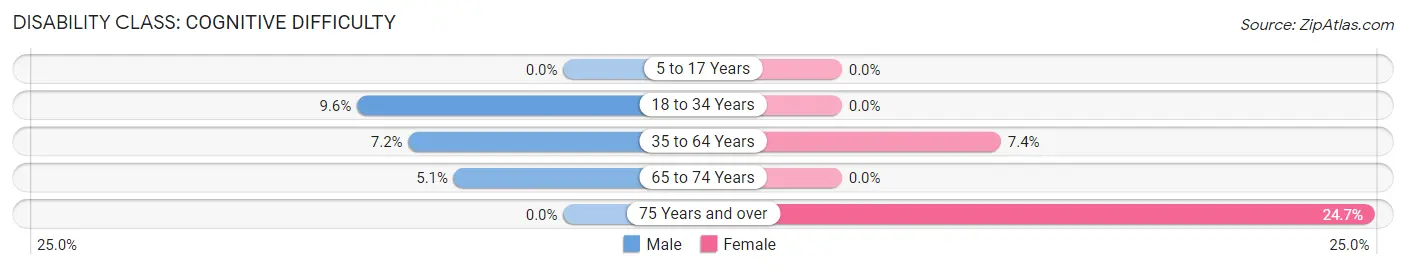
| Age Bracket | Male | Female |
| 5 to 17 Years | 0 (0.0%) | 0 (0.0%) |
| 18 to 34 Years | 11 (9.6%) | 0 (0.0%) |
| 35 to 64 Years | 20 (7.2%) | 20 (7.4%) |
| 65 to 74 Years | 3 (5.1%) | 0 (0.0%) |
| 75 Years and over | 0 (0.0%) | 23 (24.7%) |
Disability Class: Ambulatory Difficulty
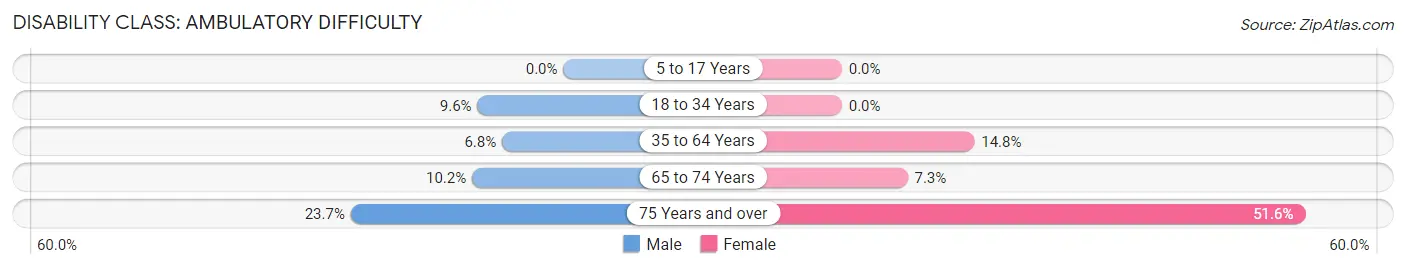
| Age Bracket | Male | Female |
| 5 to 17 Years | 0 (0.0%) | 0 (0.0%) |
| 18 to 34 Years | 11 (9.6%) | 0 (0.0%) |
| 35 to 64 Years | 19 (6.8%) | 40 (14.8%) |
| 65 to 74 Years | 6 (10.2%) | 3 (7.3%) |
| 75 Years and over | 9 (23.7%) | 48 (51.6%) |
Disability Class: Self-Care Difficulty
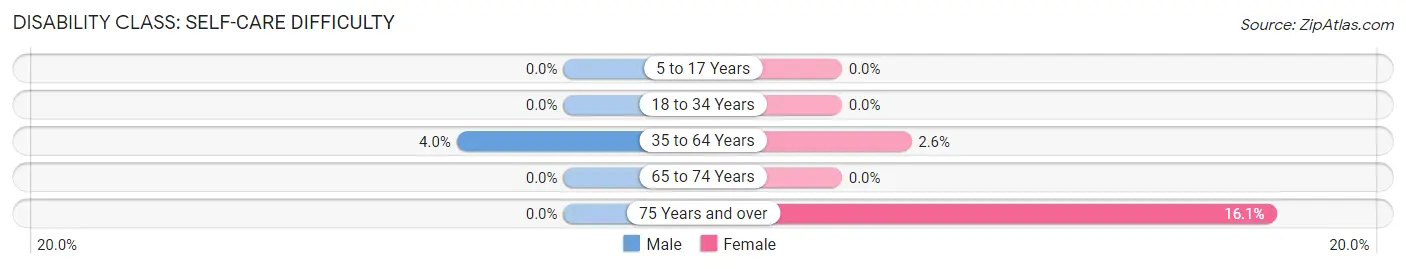
| Age Bracket | Male | Female |
| 5 to 17 Years | 0 (0.0%) | 0 (0.0%) |
| 18 to 34 Years | 0 (0.0%) | 0 (0.0%) |
| 35 to 64 Years | 11 (4.0%) | 7 (2.6%) |
| 65 to 74 Years | 0 (0.0%) | 0 (0.0%) |
| 75 Years and over | 0 (0.0%) | 15 (16.1%) |
Technology Access in Pierson
Computing Device Access in Pierson
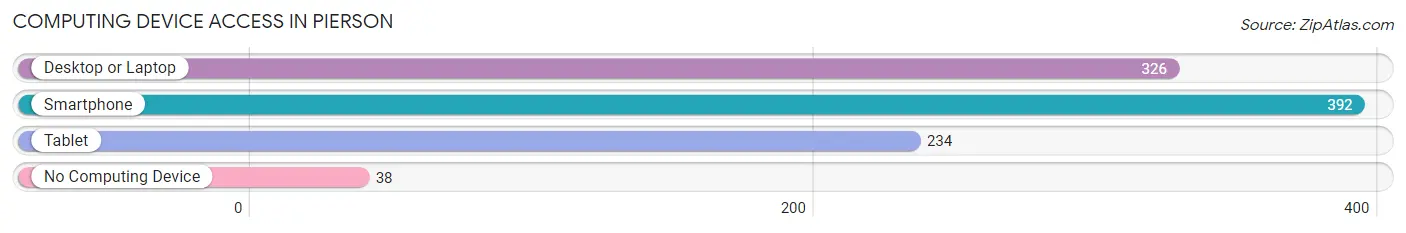
| Device Type | # Households | % Households |
| Desktop or Laptop | 326 | 70.0% |
| Smartphone | 392 | 84.1% |
| Tablet | 234 | 50.2% |
| No Computing Device | 38 | 8.2% |
| Total | 466 | 100.0% |
Internet Access in Pierson
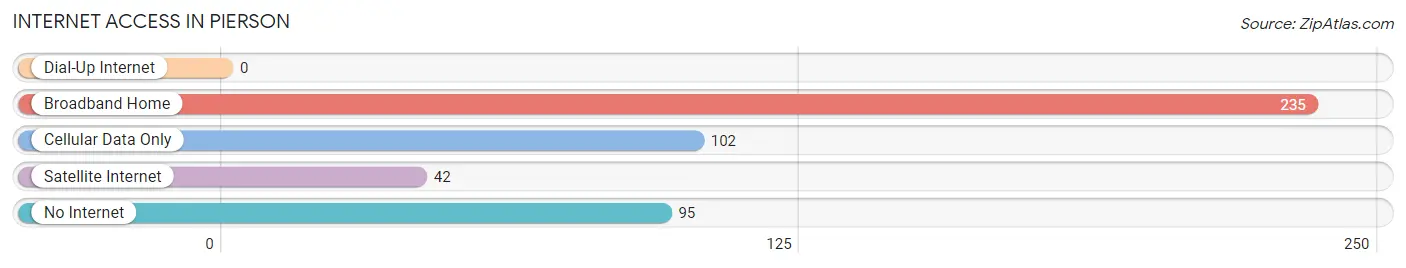
| Internet Type | # Households | % Households |
| Dial-Up Internet | 0 | 0.0% |
| Broadband Home | 235 | 50.4% |
| Cellular Data Only | 102 | 21.9% |
| Satellite Internet | 42 | 9.0% |
| No Internet | 95 | 20.4% |
| Total | 466 | 100.0% |
Pierson Summary
Pierson is a small town located in Volusia County, Florida. It is situated in the northern part of the county, about 25 miles west of Daytona Beach. The town has a population of 1,749 people, according to the 2010 census.
History
The area that is now Pierson was first settled in the late 1800s by settlers from the North. The town was originally known as “Pine Level” and was a small farming community. In 1882, the town was renamed “Pierson” after the first postmaster, William Pierson. The town was incorporated in 1887 and was the first incorporated town in Volusia County.
In the early 1900s, the town was a major citrus producer and was known as the “Citrus Capital of the World.” The town was also home to a large sawmill and a turpentine still. The town’s economy was largely based on the production of citrus and timber.
In the 1950s, the town began to decline as the citrus industry moved away from the area. The sawmill and turpentine still closed and the town’s population began to decline. In the late 1970s, the town began to experience a resurgence as new businesses moved into the area.
Geography
Pierson is located in northern Volusia County, about 25 miles west of Daytona Beach. The town is situated on the banks of the St. Johns River and is surrounded by a number of small lakes. The town is located in a flat, sandy area and is mostly covered in pine forests.
The town is located in a humid subtropical climate zone and experiences hot, humid summers and mild winters. The average temperature in the summer is around 90 degrees Fahrenheit and the average temperature in the winter is around 60 degrees Fahrenheit.
Economy
The economy of Pierson is largely based on agriculture and tourism. The town is home to a number of citrus groves and is a major producer of oranges, grapefruits, and tangerines. The town is also home to a number of small businesses, including restaurants, retail stores, and service providers.
The town is also a popular tourist destination. The town is home to a number of historic sites, including the Pierson Depot Museum and the Pierson Historical Society. The town is also home to a number of outdoor recreation areas, including the St. Johns River and the nearby Lake George.
Demographics
According to the 2010 census, the population of Pierson was 1,749 people. The town is predominantly white, with a population that is 94.3% white, 2.2% African American, 0.7% Hispanic, and 0.8% Asian. The median household income in the town is $37,917 and the median home value is $117,400.
The town is served by the Volusia County School District and is home to a number of public schools, including Pierson Elementary School, Pierson Middle School, and Pierson High School. The town is also home to a number of private schools, including Pierson Christian Academy and Pierson Montessori School.
Common Questions
What is Per Capita Income in Pierson?
Per Capita income in Pierson is $23,328.
What is the Median Family Income in Pierson?
Median Family Income in Pierson is $67,668.
What is the Median Household income in Pierson?
Median Household Income in Pierson is $50,179.
What is Income or Wage Gap in Pierson?
Income or Wage Gap in Pierson is 24.2%.
Women in Pierson earn 75.8 cents for every dollar earned by a man.
What is Inequality or Gini Index in Pierson?
Inequality or Gini Index in Pierson is 0.43.
What is the Total Population of Pierson?
Total Population of Pierson is 1,332.
What is the Total Male Population of Pierson?
Total Male Population of Pierson is 653.
What is the Total Female Population of Pierson?
Total Female Population of Pierson is 679.
What is the Ratio of Males per 100 Females in Pierson?
There are 96.17 Males per 100 Females in Pierson.
What is the Ratio of Females per 100 Males in Pierson?
There are 103.98 Females per 100 Males in Pierson.
What is the Median Population Age in Pierson?
Median Population Age in Pierson is 45.7 Years.
What is the Average Family Size in Pierson
Average Family Size in Pierson is 3.6 People.
What is the Average Household Size in Pierson
Average Household Size in Pierson is 2.9 People.
How Large is the Labor Force in Pierson?
There are 546 People in the Labor Forcein in Pierson.
What is the Percentage of People in the Labor Force in Pierson?
53.1% of People are in the Labor Force in Pierson.