Palm Beach Gardens, FL Map & Demographics
Palm Beach Gardens Map
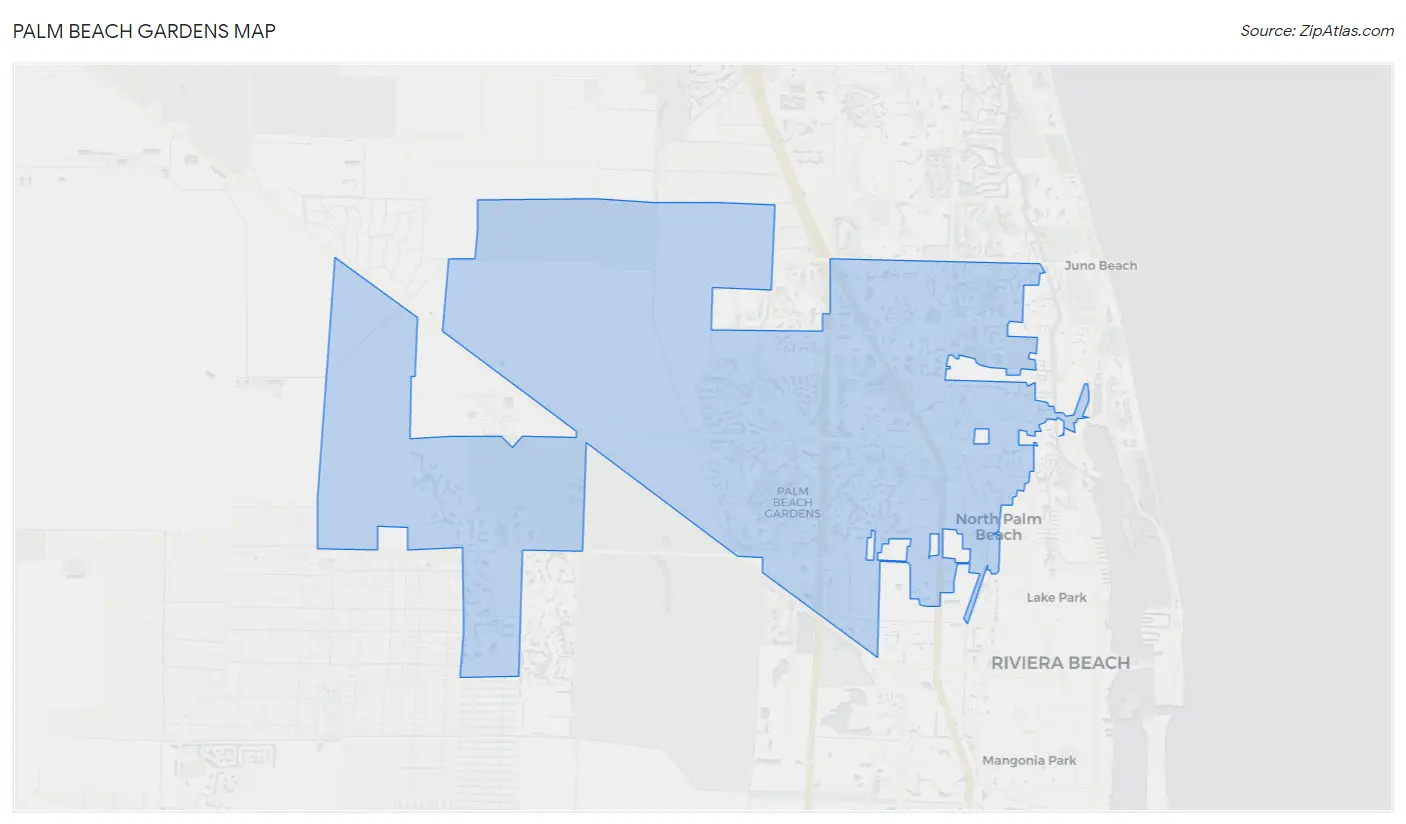
Palm Beach Gardens Overview
$79,036
PER CAPITA INCOME
$146,667
AVG FAMILY INCOME
$106,544
AVG HOUSEHOLD INCOME
25.0%
WAGE / INCOME GAP [ % ]
75.0¢/ $1
WAGE / INCOME GAP [ $ ]
$10,049
FAMILY INCOME DEFICIT
0.55
INEQUALITY / GINI INDEX
59,088
TOTAL POPULATION
27,904
MALE POPULATION
31,184
FEMALE POPULATION
89.48
MALES / 100 FEMALES
111.75
FEMALES / 100 MALES
51.2
MEDIAN AGE
2.8
AVG FAMILY SIZE
2.2
AVG HOUSEHOLD SIZE
28,475
LABOR FORCE [ PEOPLE ]
56.6%
PERCENT IN LABOR FORCE
3.5%
UNEMPLOYMENT RATE
Palm Beach Gardens Area Codes
Income in Palm Beach Gardens
Income Overview in Palm Beach Gardens
Per Capita Income in Palm Beach Gardens is $79,036, while median incomes of families and households are $146,667 and $106,544 respectively.
| Characteristic | Number | Measure |
| Per Capita Income | 59,088 | $79,036 |
| Median Family Income | 16,420 | $146,667 |
| Mean Family Income | 16,420 | $220,173 |
| Median Household Income | 25,959 | $106,544 |
| Mean Household Income | 25,959 | $175,035 |
| Income Deficit | 16,420 | $10,049 |
| Wage / Income Gap (%) | 59,088 | 25.00% |
| Wage / Income Gap ($) | 59,088 | 75.00¢ per $1 |
| Gini / Inequality Index | 59,088 | 0.55 |
Earnings by Sex in Palm Beach Gardens
Average Earnings in Palm Beach Gardens are $52,854, $61,582 for men and $46,184 for women, a difference of 25.0%.
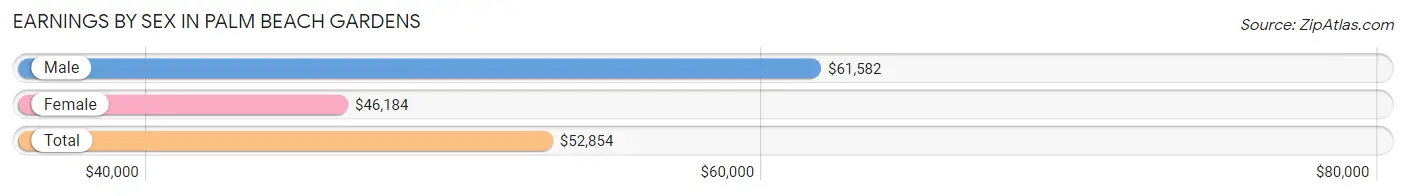
| Sex | Number | Average Earnings |
| Male | 15,591 (52.4%) | $61,582 |
| Female | 14,158 (47.6%) | $46,184 |
| Total | 29,749 (100.0%) | $52,854 |
Earnings by Sex by Income Bracket in Palm Beach Gardens
The most common earnings brackets in Palm Beach Gardens are $100,000+ for men (5,396 | 34.6%) and $100,000+ for women (2,480 | 17.5%).
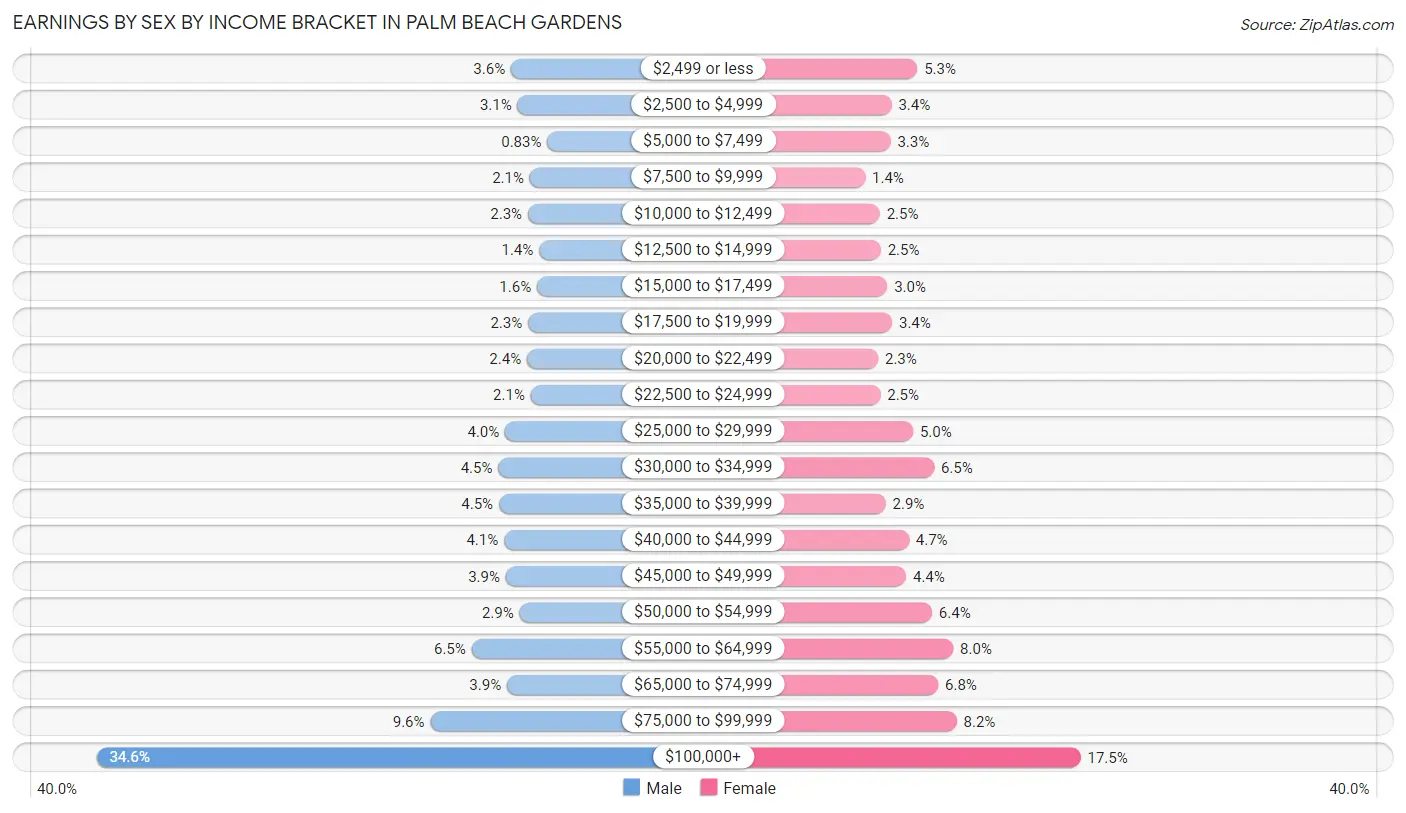
| Income | Male | Female |
| $2,499 or less | 554 (3.5%) | 748 (5.3%) |
| $2,500 to $4,999 | 477 (3.1%) | 474 (3.4%) |
| $5,000 to $7,499 | 130 (0.8%) | 463 (3.3%) |
| $7,500 to $9,999 | 333 (2.1%) | 194 (1.4%) |
| $10,000 to $12,499 | 355 (2.3%) | 350 (2.5%) |
| $12,500 to $14,999 | 225 (1.4%) | 360 (2.5%) |
| $15,000 to $17,499 | 249 (1.6%) | 429 (3.0%) |
| $17,500 to $19,999 | 354 (2.3%) | 480 (3.4%) |
| $20,000 to $22,499 | 366 (2.4%) | 331 (2.3%) |
| $22,500 to $24,999 | 323 (2.1%) | 356 (2.5%) |
| $25,000 to $29,999 | 622 (4.0%) | 702 (5.0%) |
| $30,000 to $34,999 | 702 (4.5%) | 925 (6.5%) |
| $35,000 to $39,999 | 694 (4.4%) | 412 (2.9%) |
| $40,000 to $44,999 | 635 (4.1%) | 659 (4.6%) |
| $45,000 to $49,999 | 614 (3.9%) | 629 (4.4%) |
| $50,000 to $54,999 | 453 (2.9%) | 903 (6.4%) |
| $55,000 to $64,999 | 1,014 (6.5%) | 1,129 (8.0%) |
| $65,000 to $74,999 | 600 (3.8%) | 969 (6.8%) |
| $75,000 to $99,999 | 1,495 (9.6%) | 1,165 (8.2%) |
| $100,000+ | 5,396 (34.6%) | 2,480 (17.5%) |
| Total | 15,591 (100.0%) | 14,158 (100.0%) |
Earnings by Sex by Educational Attainment in Palm Beach Gardens
Average earnings in Palm Beach Gardens are $73,118 for men and $51,480 for women, a difference of 29.6%. Men with an educational attainment of graduate degree enjoy the highest average annual earnings of $132,955, while those with less than high school education earn the least with $34,519. Women with an educational attainment of graduate degree earn the most with the average annual earnings of $81,848, while those with less than high school education have the smallest earnings of $27,279.
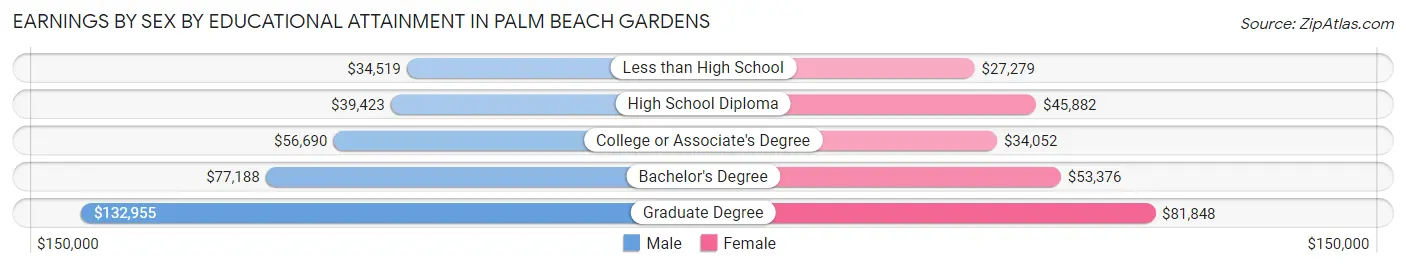
| Educational Attainment | Male Income | Female Income |
| Less than High School | $34,519 | $27,279 |
| High School Diploma | $39,423 | $45,882 |
| College or Associate's Degree | $56,690 | $34,052 |
| Bachelor's Degree | $77,188 | $53,376 |
| Graduate Degree | $132,955 | $81,848 |
| Total | $73,118 | $51,480 |
Family Income in Palm Beach Gardens
Family Income Brackets in Palm Beach Gardens
According to the Palm Beach Gardens family income data, there are 5,550 families falling into the $200,000+ income range, which is the most common income bracket and makes up 33.8% of all families. Conversely, the $10,000 to $14,999 income bracket is the least frequent group with only 148 families (0.9%) belonging to this category.
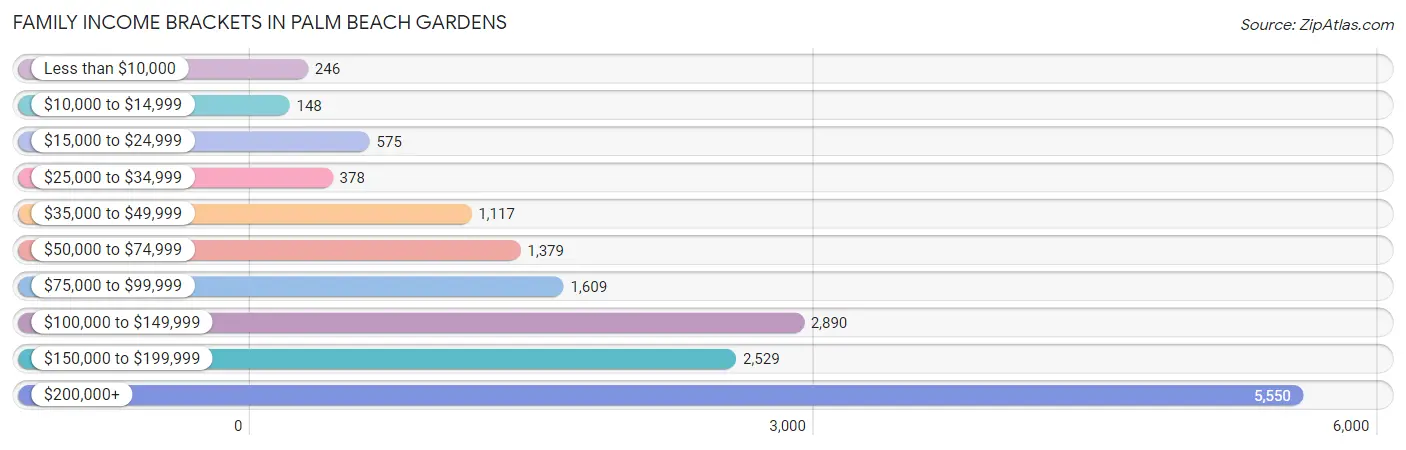
| Income Bracket | # Families | % Families |
| Less than $10,000 | 246 | 1.5% |
| $10,000 to $14,999 | 148 | 0.9% |
| $15,000 to $24,999 | 575 | 3.5% |
| $25,000 to $34,999 | 378 | 2.3% |
| $35,000 to $49,999 | 1,117 | 6.8% |
| $50,000 to $74,999 | 1,379 | 8.4% |
| $75,000 to $99,999 | 1,609 | 9.8% |
| $100,000 to $149,999 | 2,890 | 17.6% |
| $150,000 to $199,999 | 2,529 | 15.4% |
| $200,000+ | 5,550 | 33.8% |
Family Income by Famaliy Size in Palm Beach Gardens
4-person families (2,241 | 13.7%) account for the highest median family income in Palm Beach Gardens with $209,072 per family, while 2-person families (10,100 | 61.5%) have the highest median income of $68,396 per family member.
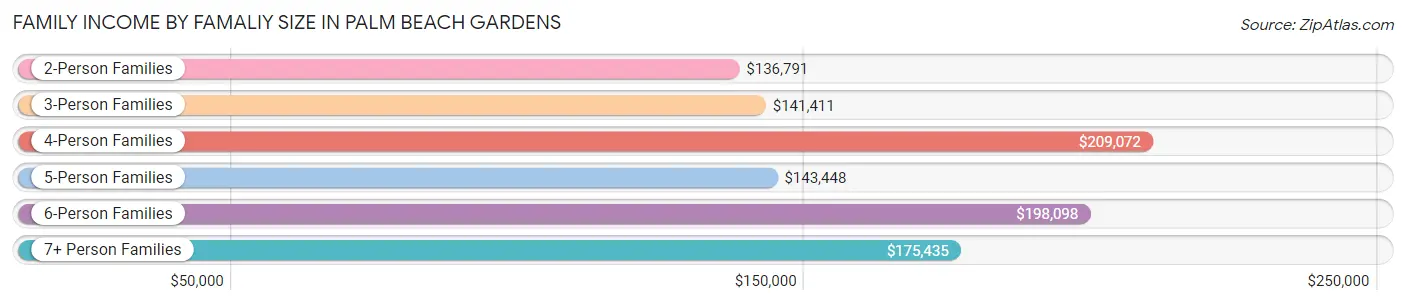
| Income Bracket | # Families | Median Income |
| 2-Person Families | 10,100 (61.5%) | $136,791 |
| 3-Person Families | 3,103 (18.9%) | $141,411 |
| 4-Person Families | 2,241 (13.7%) | $209,072 |
| 5-Person Families | 782 (4.8%) | $143,448 |
| 6-Person Families | 144 (0.9%) | $198,098 |
| 7+ Person Families | 50 (0.3%) | $175,435 |
| Total | 16,420 (100.0%) | $146,667 |
Family Income by Number of Earners in Palm Beach Gardens
The median family income in Palm Beach Gardens is $146,667, with families comprising 3+ earners (1,489) having the highest median family income of $181,984, while families with 1 earner (4,589) have the lowest median family income of $108,224, accounting for 9.1% and 28.0% of families, respectively.
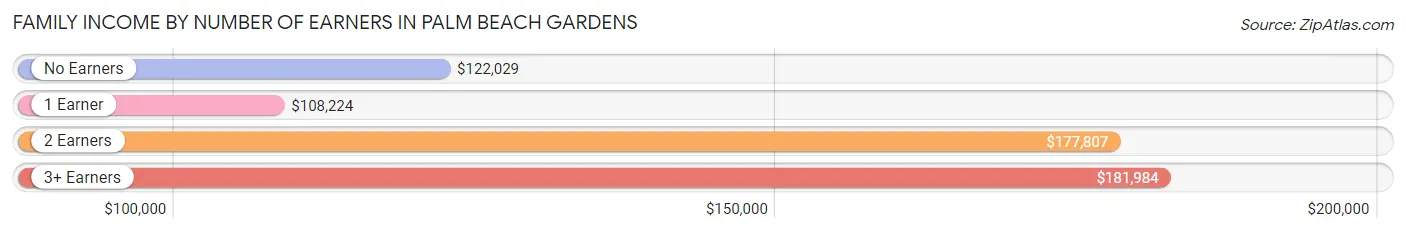
| Number of Earners | # Families | Median Income |
| No Earners | 4,389 (26.7%) | $122,029 |
| 1 Earner | 4,589 (28.0%) | $108,224 |
| 2 Earners | 5,953 (36.2%) | $177,807 |
| 3+ Earners | 1,489 (9.1%) | $181,984 |
| Total | 16,420 (100.0%) | $146,667 |
Household Income in Palm Beach Gardens
Household Income Brackets in Palm Beach Gardens
With 6,568 households falling in the category, the $200,000+ income range is the most frequent in Palm Beach Gardens, accounting for 25.3% of all households. In contrast, only 623 households (2.4%) fall into the $10,000 to $14,999 income bracket, making it the least populous group.
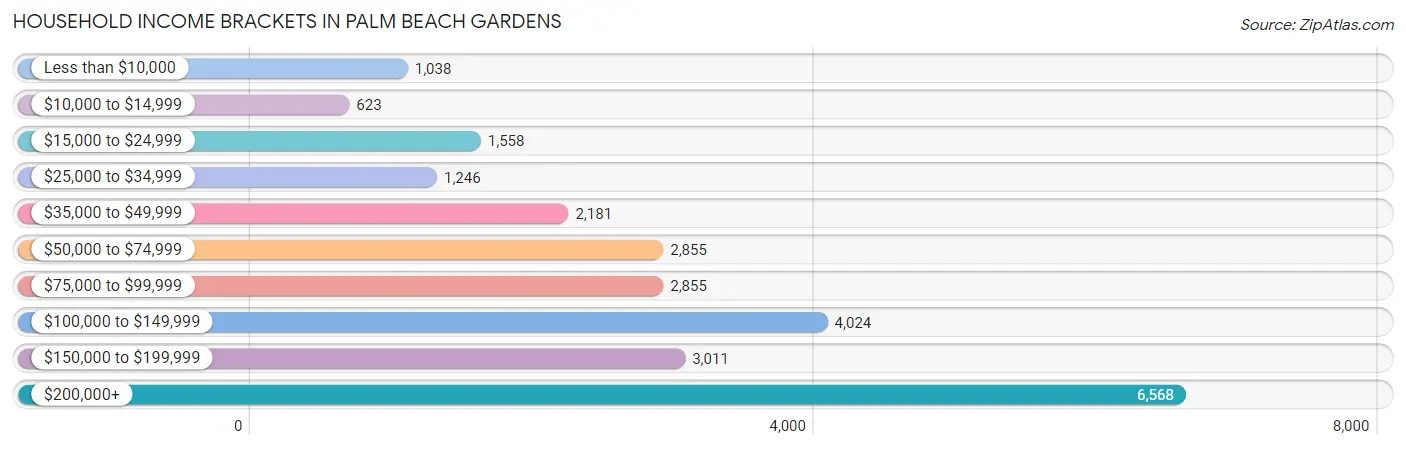
| Income Bracket | # Households | % Households |
| Less than $10,000 | 1,038 | 4.0% |
| $10,000 to $14,999 | 623 | 2.4% |
| $15,000 to $24,999 | 1,558 | 6.0% |
| $25,000 to $34,999 | 1,246 | 4.8% |
| $35,000 to $49,999 | 2,181 | 8.4% |
| $50,000 to $74,999 | 2,855 | 11.0% |
| $75,000 to $99,999 | 2,855 | 11.0% |
| $100,000 to $149,999 | 4,024 | 15.5% |
| $150,000 to $199,999 | 3,011 | 11.6% |
| $200,000+ | 6,568 | 25.3% |
Household Income by Householder Age in Palm Beach Gardens
The median household income in Palm Beach Gardens is $106,544, with the highest median household income of $120,223 found in the 45 to 64 years age bracket for the primary householder. A total of 8,188 households (31.5%) fall into this category. Meanwhile, the 65+ years age bracket for the primary householder has the lowest median household income of $86,856, with 11,648 households (44.9%) in this group.
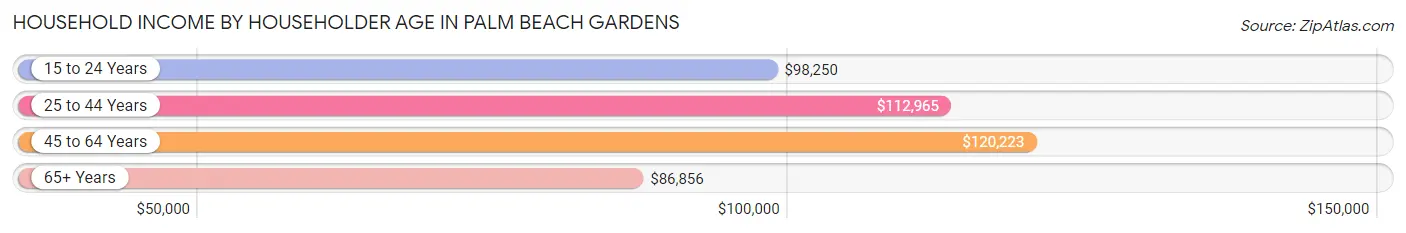
| Income Bracket | # Households | Median Income |
| 15 to 24 Years | 379 (1.5%) | $98,250 |
| 25 to 44 Years | 5,744 (22.1%) | $112,965 |
| 45 to 64 Years | 8,188 (31.5%) | $120,223 |
| 65+ Years | 11,648 (44.9%) | $86,856 |
| Total | 25,959 (100.0%) | $106,544 |
Poverty in Palm Beach Gardens
Income Below Poverty by Sex and Age in Palm Beach Gardens
With 5.6% poverty level for males and 6.9% for females among the residents of Palm Beach Gardens, under 5 year old males and 18 to 24 year old females are the most vulnerable to poverty, with 148 males (11.9%) and 148 females (11.7%) in their respective age groups living below the poverty level.
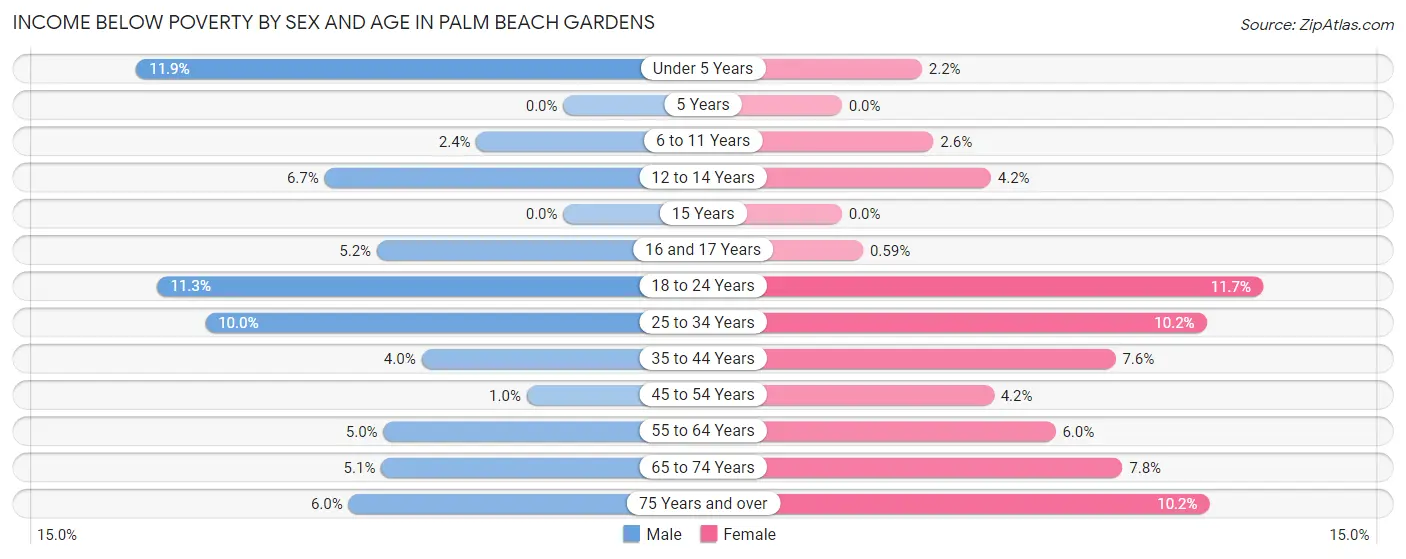
| Age Bracket | Male | Female |
| Under 5 Years | 148 (11.9%) | 29 (2.2%) |
| 5 Years | 0 (0.0%) | 0 (0.0%) |
| 6 to 11 Years | 43 (2.4%) | 48 (2.5%) |
| 12 to 14 Years | 43 (6.7%) | 24 (4.2%) |
| 15 Years | 0 (0.0%) | 0 (0.0%) |
| 16 and 17 Years | 30 (5.2%) | 6 (0.6%) |
| 18 to 24 Years | 216 (11.3%) | 148 (11.7%) |
| 25 to 34 Years | 268 (10.0%) | 337 (10.2%) |
| 35 to 44 Years | 127 (4.0%) | 213 (7.6%) |
| 45 to 54 Years | 34 (1.0%) | 153 (4.2%) |
| 55 to 64 Years | 180 (5.0%) | 260 (5.9%) |
| 65 to 74 Years | 176 (5.1%) | 354 (7.8%) |
| 75 Years and over | 286 (6.0%) | 545 (10.2%) |
| Total | 1,551 (5.6%) | 2,117 (6.9%) |
Income Above Poverty by Sex and Age in Palm Beach Gardens
According to the poverty statistics in Palm Beach Gardens, males aged 5 years and females aged 5 years are the age groups that are most secure financially, with 100.0% of males and 100.0% of females in these age groups living above the poverty line.
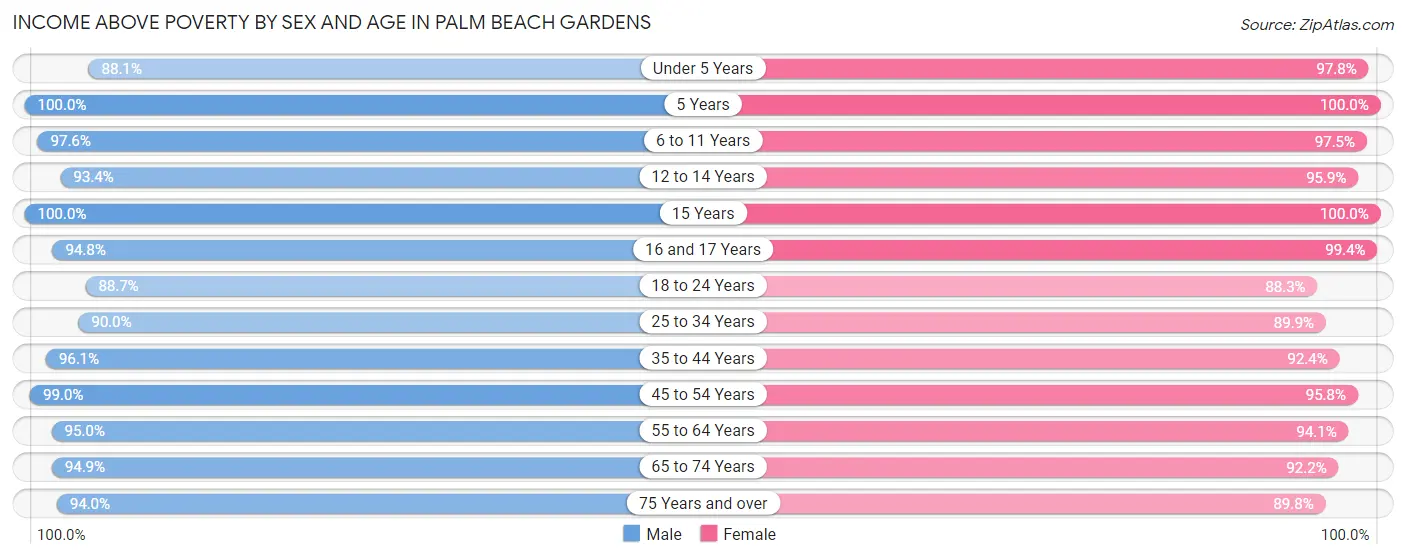
| Age Bracket | Male | Female |
| Under 5 Years | 1,097 (88.1%) | 1,274 (97.8%) |
| 5 Years | 251 (100.0%) | 183 (100.0%) |
| 6 to 11 Years | 1,733 (97.6%) | 1,837 (97.5%) |
| 12 to 14 Years | 604 (93.3%) | 555 (95.9%) |
| 15 Years | 179 (100.0%) | 599 (100.0%) |
| 16 and 17 Years | 548 (94.8%) | 1,015 (99.4%) |
| 18 to 24 Years | 1,695 (88.7%) | 1,115 (88.3%) |
| 25 to 34 Years | 2,421 (90.0%) | 2,983 (89.8%) |
| 35 to 44 Years | 3,090 (96.1%) | 2,582 (92.4%) |
| 45 to 54 Years | 3,314 (99.0%) | 3,461 (95.8%) |
| 55 to 64 Years | 3,415 (95.0%) | 4,110 (94.1%) |
| 65 to 74 Years | 3,294 (94.9%) | 4,177 (92.2%) |
| 75 Years and over | 4,497 (94.0%) | 4,784 (89.8%) |
| Total | 26,138 (94.4%) | 28,675 (93.1%) |
Income Below Poverty Among Married-Couple Families in Palm Beach Gardens
The poverty statistics for married-couple families in Palm Beach Gardens show that 3.0% or 413 of the total 13,631 families live below the poverty line. Families with 1 or 2 children have the highest poverty rate of 3.7%, comprising of 143 families. On the other hand, families with 3 or 4 children have the lowest poverty rate of 0.0%, which includes 0 families.
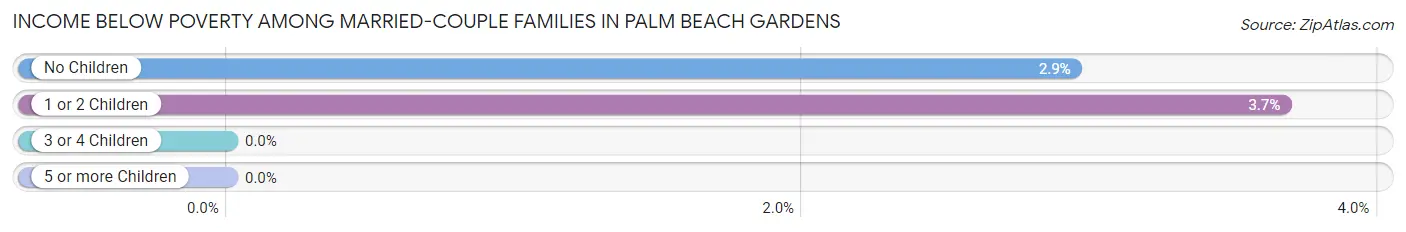
| Children | Above Poverty | Below Poverty |
| No Children | 8,924 (97.1%) | 270 (2.9%) |
| 1 or 2 Children | 3,756 (96.3%) | 143 (3.7%) |
| 3 or 4 Children | 538 (100.0%) | 0 (0.0%) |
| 5 or more Children | 0 (0.0%) | 0 (0.0%) |
| Total | 13,218 (97.0%) | 413 (3.0%) |
Income Below Poverty Among Single-Parent Households in Palm Beach Gardens
According to the poverty data in Palm Beach Gardens, 5.1% or 38 single-father households and 6.9% or 140 single-mother households are living below the poverty line. Among single-father households, those with no children have the highest poverty rate, with 30 households (7.4%) experiencing poverty. Likewise, among single-mother households, those with 1 or 2 children have the highest poverty rate, with 82 households (9.3%) falling below the poverty line.
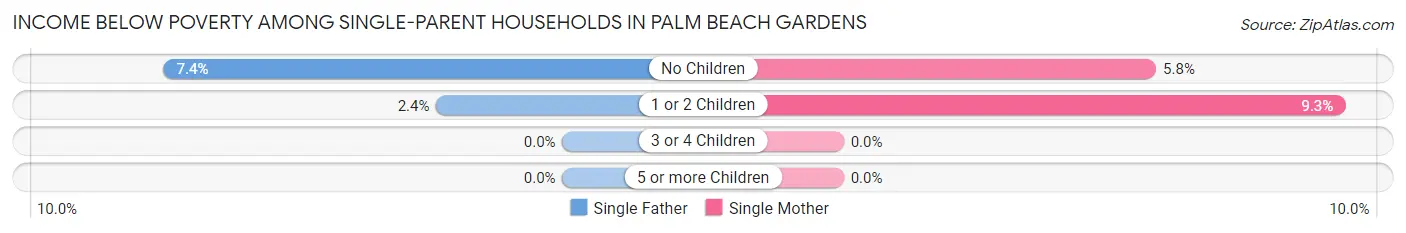
| Children | Single Father | Single Mother |
| No Children | 30 (7.4%) | 58 (5.8%) |
| 1 or 2 Children | 8 (2.4%) | 82 (9.3%) |
| 3 or 4 Children | 0 (0.0%) | 0 (0.0%) |
| 5 or more Children | 0 (0.0%) | 0 (0.0%) |
| Total | 38 (5.1%) | 140 (6.9%) |
Income Below Poverty Among Married-Couple vs Single-Parent Households in Palm Beach Gardens
The poverty data for Palm Beach Gardens shows that 413 of the married-couple family households (3.0%) and 178 of the single-parent households (6.4%) are living below the poverty level. Within the married-couple family households, those with 1 or 2 children have the highest poverty rate, with 143 households (3.7%) falling below the poverty line. Among the single-parent households, those with 1 or 2 children have the highest poverty rate, with 90 household (7.4%) living below poverty.
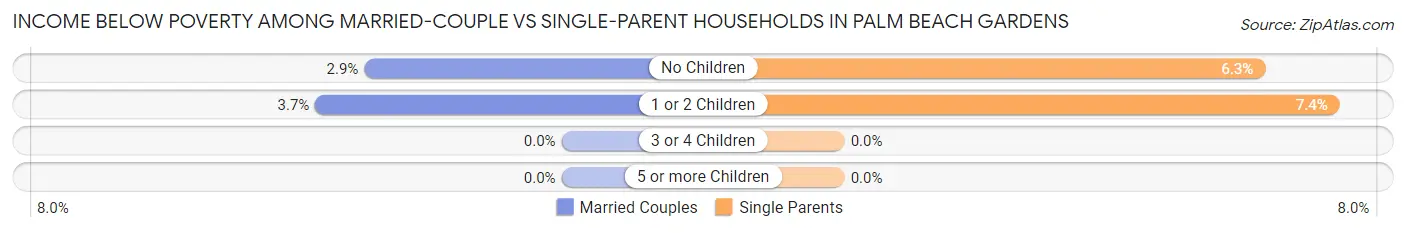
| Children | Married-Couple Families | Single-Parent Households |
| No Children | 270 (2.9%) | 88 (6.3%) |
| 1 or 2 Children | 143 (3.7%) | 90 (7.4%) |
| 3 or 4 Children | 0 (0.0%) | 0 (0.0%) |
| 5 or more Children | 0 (0.0%) | 0 (0.0%) |
| Total | 413 (3.0%) | 178 (6.4%) |
Race in Palm Beach Gardens
The most populous races in Palm Beach Gardens are White / Caucasian (48,961 | 82.9%), Hispanic or Latino (5,185 | 8.8%), and Two or more Races (3,691 | 6.2%).
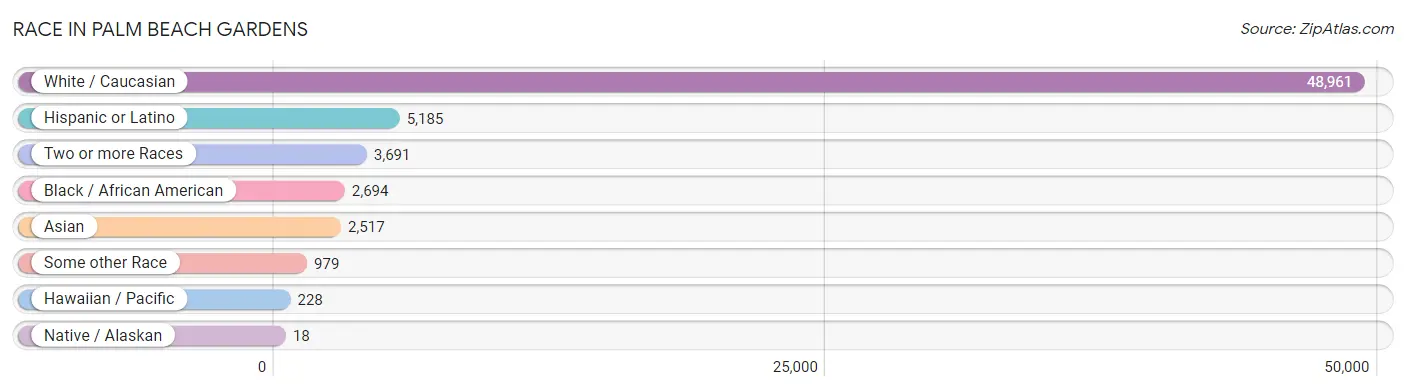
| Race | # Population | % Population |
| Asian | 2,517 | 4.3% |
| Black / African American | 2,694 | 4.6% |
| Hawaiian / Pacific | 228 | 0.4% |
| Hispanic or Latino | 5,185 | 8.8% |
| Native / Alaskan | 18 | 0.0% |
| White / Caucasian | 48,961 | 82.9% |
| Two or more Races | 3,691 | 6.2% |
| Some other Race | 979 | 1.7% |
| Total | 59,088 | 100.0% |
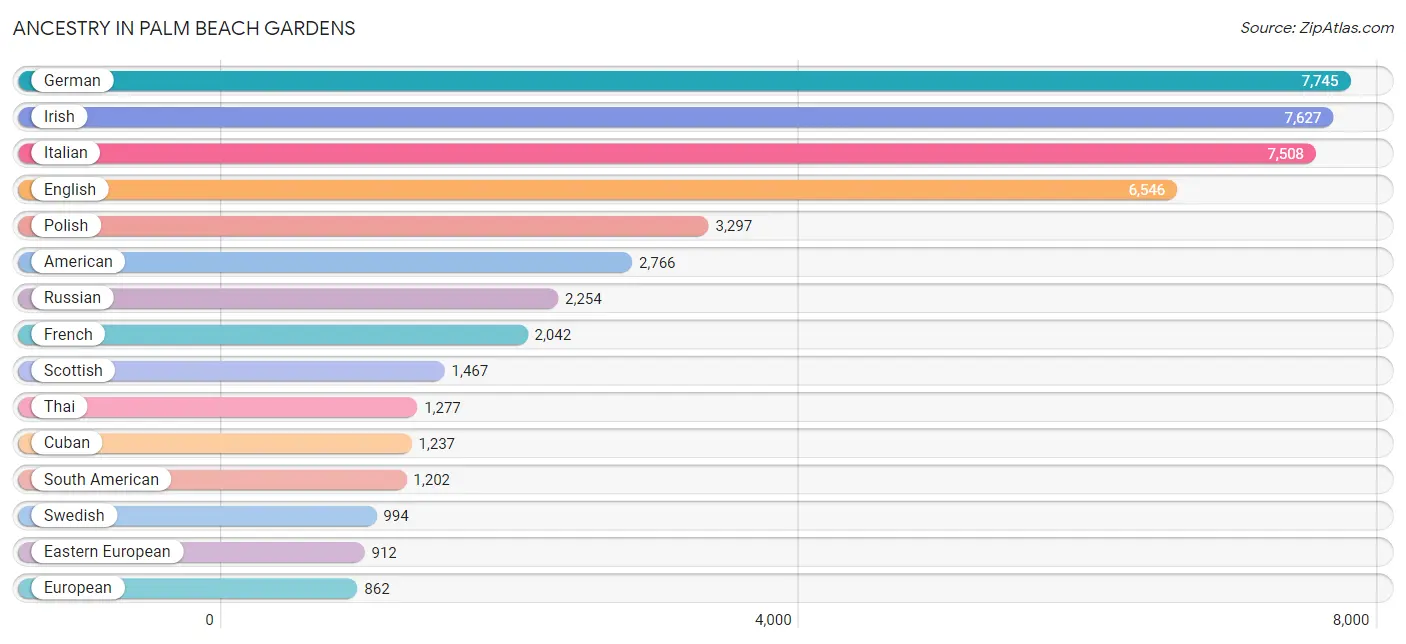
Ancestry in Palm Beach Gardens
The most populous ancestries reported in Palm Beach Gardens are German (7,745 | 13.1%), Irish (7,627 | 12.9%), Italian (7,508 | 12.7%), English (6,546 | 11.1%), and Polish (3,297 | 5.6%), together accounting for 55.4% of all Palm Beach Gardens residents.
| Ancestry | # Population | % Population |
| African | 126 | 0.2% |
| Albanian | 83 | 0.1% |
| American | 2,766 | 4.7% |
| Apache | 78 | 0.1% |
| Arab | 702 | 1.2% |
| Argentinean | 14 | 0.0% |
| Armenian | 86 | 0.2% |
| Austrian | 829 | 1.4% |
| Bahamian | 54 | 0.1% |
| Basque | 14 | 0.0% |
| Belgian | 37 | 0.1% |
| Belizean | 8 | 0.0% |
| Bhutanese | 183 | 0.3% |
| Bolivian | 45 | 0.1% |
| Brazilian | 58 | 0.1% |
| British | 480 | 0.8% |
| Bulgarian | 102 | 0.2% |
| Burmese | 269 | 0.5% |
| Canadian | 298 | 0.5% |
| Celtic | 29 | 0.1% |
| Central American | 440 | 0.7% |
| Cherokee | 148 | 0.3% |
| Chilean | 127 | 0.2% |
| Choctaw | 15 | 0.0% |
| Colombian | 608 | 1.0% |
| Costa Rican | 20 | 0.0% |
| Croatian | 15 | 0.0% |
| Cuban | 1,237 | 2.1% |
| Czech | 222 | 0.4% |
| Czechoslovakian | 55 | 0.1% |
| Danish | 194 | 0.3% |
| Dominican | 311 | 0.5% |
| Dutch | 818 | 1.4% |
| Eastern European | 912 | 1.5% |
| Ecuadorian | 80 | 0.1% |
| Egyptian | 56 | 0.1% |
| English | 6,546 | 11.1% |
| Estonian | 11 | 0.0% |
| European | 862 | 1.5% |
| Filipino | 14 | 0.0% |
| Finnish | 49 | 0.1% |
| French | 2,042 | 3.5% |
| French Canadian | 417 | 0.7% |
| German | 7,745 | 13.1% |
| Ghanaian | 38 | 0.1% |
| Greek | 411 | 0.7% |
| Guamanian / Chamorro | 1 | 0.0% |
| Guatemalan | 202 | 0.3% |
| Haitian | 597 | 1.0% |
| Honduran | 11 | 0.0% |
| Hungarian | 539 | 0.9% |
| Indian (Asian) | 288 | 0.5% |
| Iraqi | 11 | 0.0% |
| Irish | 7,627 | 12.9% |
| Iroquois | 70 | 0.1% |
| Israeli | 45 | 0.1% |
| Italian | 7,508 | 12.7% |
| Jamaican | 350 | 0.6% |
| Japanese | 15 | 0.0% |
| Jordanian | 11 | 0.0% |
| Korean | 301 | 0.5% |
| Latvian | 13 | 0.0% |
| Lebanese | 461 | 0.8% |
| Lithuanian | 279 | 0.5% |
| Mexican | 345 | 0.6% |
| Moroccan | 12 | 0.0% |
| Nicaraguan | 54 | 0.1% |
| Nigerian | 33 | 0.1% |
| Northern European | 16 | 0.0% |
| Norwegian | 643 | 1.1% |
| Pakistani | 200 | 0.3% |
| Palestinian | 45 | 0.1% |
| Panamanian | 99 | 0.2% |
| Paraguayan | 8 | 0.0% |
| Pennsylvania German | 124 | 0.2% |
| Peruvian | 101 | 0.2% |
| Polish | 3,297 | 5.6% |
| Portuguese | 62 | 0.1% |
| Puerto Rican | 847 | 1.4% |
| Romanian | 153 | 0.3% |
| Russian | 2,254 | 3.8% |
| Salvadoran | 38 | 0.1% |
| Samoan | 218 | 0.4% |
| Scandinavian | 161 | 0.3% |
| Scotch-Irish | 628 | 1.1% |
| Scottish | 1,467 | 2.5% |
| Seminole | 24 | 0.0% |
| Sioux | 61 | 0.1% |
| Slavic | 30 | 0.1% |
| Slovak | 93 | 0.2% |
| Slovene | 37 | 0.1% |
| South African | 28 | 0.1% |
| South American | 1,202 | 2.0% |
| Spaniard | 267 | 0.4% |
| Spanish | 293 | 0.5% |
| Spanish American | 24 | 0.0% |
| Sri Lankan | 176 | 0.3% |
| Subsaharan African | 225 | 0.4% |
| Swedish | 994 | 1.7% |
| Swiss | 175 | 0.3% |
| Syrian | 38 | 0.1% |
| Thai | 1,277 | 2.2% |
| Trinidadian and Tobagonian | 51 | 0.1% |
| Turkish | 70 | 0.1% |
| Ukrainian | 214 | 0.4% |
| Uruguayan | 50 | 0.1% |
| Venezuelan | 169 | 0.3% |
| Welsh | 403 | 0.7% |
| Yugoslavian | 13 | 0.0% | View All 109 Rows |
Immigrants in Palm Beach Gardens
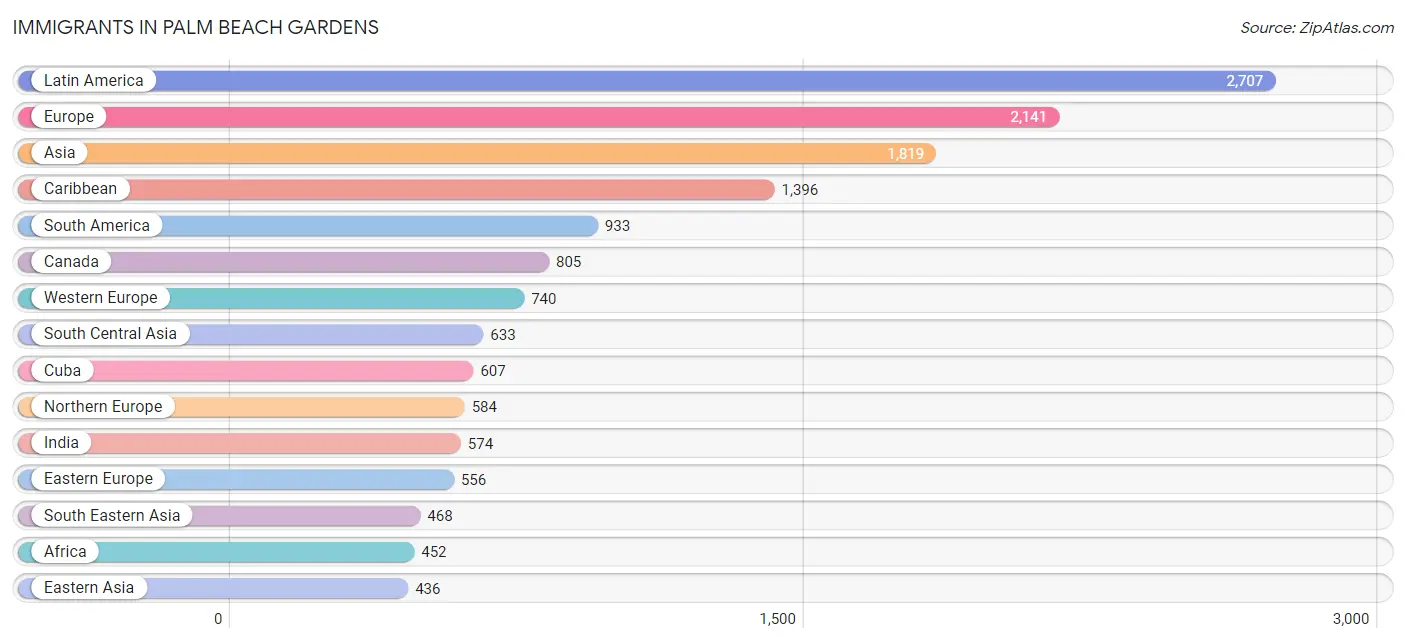
The most numerous immigrant groups reported in Palm Beach Gardens came from Latin America (2,707 | 4.6%), Europe (2,141 | 3.6%), Asia (1,819 | 3.1%), Caribbean (1,396 | 2.4%), and South America (933 | 1.6%), together accounting for 15.2% of all Palm Beach Gardens residents.
| Immigration Origin | # Population | % Population |
| Africa | 452 | 0.8% |
| Argentina | 26 | 0.0% |
| Asia | 1,819 | 3.1% |
| Austria | 173 | 0.3% |
| Bahamas | 54 | 0.1% |
| Belgium | 8 | 0.0% |
| Bolivia | 18 | 0.0% |
| Brazil | 115 | 0.2% |
| Bulgaria | 102 | 0.2% |
| Cambodia | 15 | 0.0% |
| Canada | 805 | 1.4% |
| Caribbean | 1,396 | 2.4% |
| Central America | 378 | 0.6% |
| Chile | 58 | 0.1% |
| China | 177 | 0.3% |
| Colombia | 404 | 0.7% |
| Croatia | 9 | 0.0% |
| Cuba | 607 | 1.0% |
| Dominican Republic | 127 | 0.2% |
| Eastern Africa | 206 | 0.4% |
| Eastern Asia | 436 | 0.7% |
| Eastern Europe | 556 | 0.9% |
| Ecuador | 25 | 0.0% |
| Egypt | 112 | 0.2% |
| El Salvador | 8 | 0.0% |
| England | 143 | 0.2% |
| Europe | 2,141 | 3.6% |
| France | 126 | 0.2% |
| Germany | 301 | 0.5% |
| Ghana | 27 | 0.1% |
| Greece | 47 | 0.1% |
| Guatemala | 108 | 0.2% |
| Guyana | 23 | 0.0% |
| Haiti | 288 | 0.5% |
| Hungary | 28 | 0.1% |
| India | 574 | 1.0% |
| Indonesia | 5 | 0.0% |
| Iran | 11 | 0.0% |
| Ireland | 146 | 0.3% |
| Israel | 123 | 0.2% |
| Italy | 157 | 0.3% |
| Jamaica | 216 | 0.4% |
| Japan | 91 | 0.2% |
| Kazakhstan | 35 | 0.1% |
| Kenya | 7 | 0.0% |
| Korea | 168 | 0.3% |
| Laos | 9 | 0.0% |
| Latin America | 2,707 | 4.6% |
| Lebanon | 76 | 0.1% |
| Malaysia | 6 | 0.0% |
| Mexico | 185 | 0.3% |
| Netherlands | 78 | 0.1% |
| Nicaragua | 30 | 0.1% |
| Nigeria | 33 | 0.1% |
| Northern Africa | 112 | 0.2% |
| Northern Europe | 584 | 1.0% |
| Norway | 150 | 0.3% |
| Oceania | 85 | 0.1% |
| Panama | 47 | 0.1% |
| Peru | 111 | 0.2% |
| Philippines | 189 | 0.3% |
| Poland | 180 | 0.3% |
| Portugal | 31 | 0.1% |
| Romania | 103 | 0.2% |
| Russia | 76 | 0.1% |
| Saudi Arabia | 51 | 0.1% |
| Scotland | 33 | 0.1% |
| South Africa | 64 | 0.1% |
| South America | 933 | 1.6% |
| South Central Asia | 633 | 1.1% |
| South Eastern Asia | 468 | 0.8% |
| Southern Europe | 261 | 0.4% |
| Spain | 26 | 0.0% |
| Sweden | 31 | 0.1% |
| Switzerland | 54 | 0.1% |
| Taiwan | 14 | 0.0% |
| Thailand | 146 | 0.3% |
| Trinidad and Tobago | 104 | 0.2% |
| Turkey | 32 | 0.1% |
| Ukraine | 51 | 0.1% |
| Uruguay | 50 | 0.1% |
| Uzbekistan | 13 | 0.0% |
| Venezuela | 95 | 0.2% |
| Vietnam | 98 | 0.2% |
| Western Africa | 70 | 0.1% |
| Western Asia | 282 | 0.5% |
| Western Europe | 740 | 1.3% |
| Zimbabwe | 195 | 0.3% | View All 88 Rows |
Sex and Age in Palm Beach Gardens
Sex and Age in Palm Beach Gardens
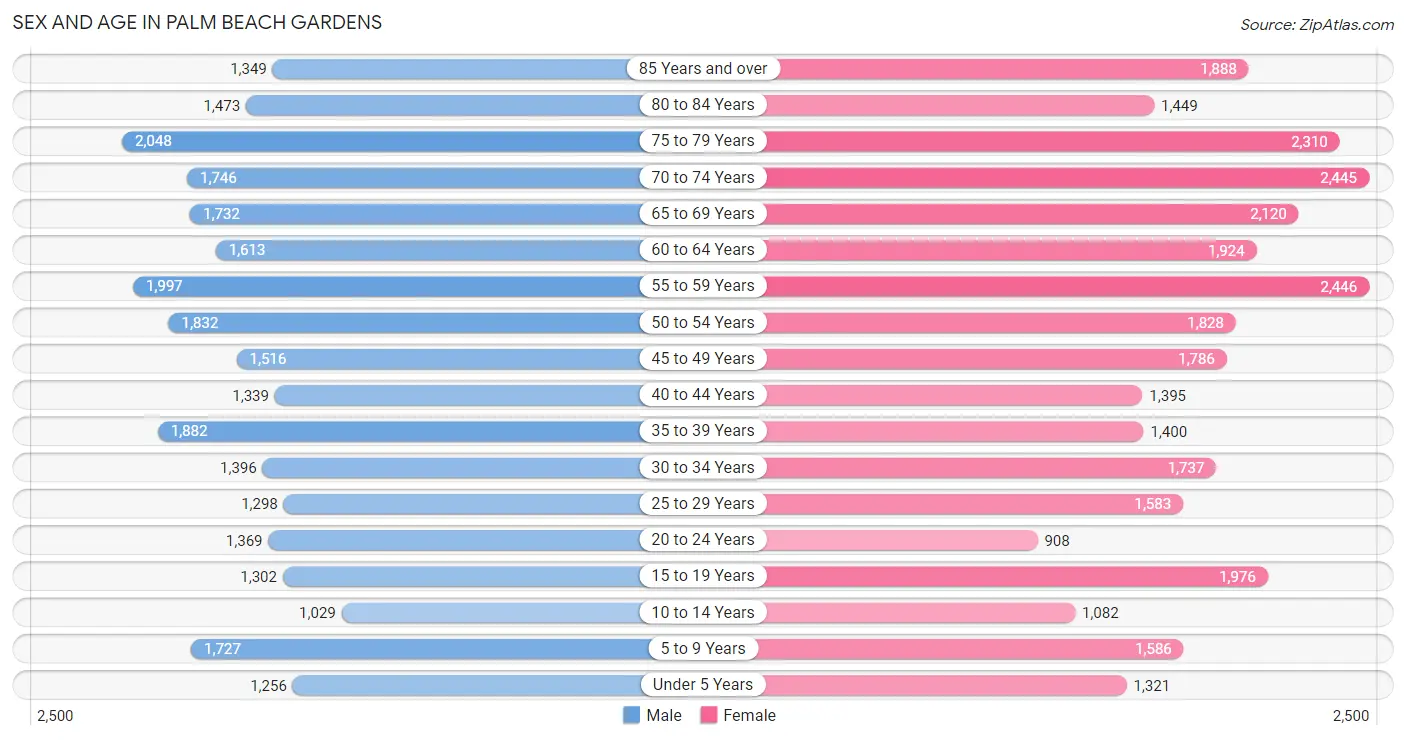
The most populous age groups in Palm Beach Gardens are 75 to 79 Years (2,048 | 7.3%) for men and 55 to 59 Years (2,446 | 7.8%) for women.
| Age Bracket | Male | Female |
| Under 5 Years | 1,256 (4.5%) | 1,321 (4.2%) |
| 5 to 9 Years | 1,727 (6.2%) | 1,586 (5.1%) |
| 10 to 14 Years | 1,029 (3.7%) | 1,082 (3.5%) |
| 15 to 19 Years | 1,302 (4.7%) | 1,976 (6.3%) |
| 20 to 24 Years | 1,369 (4.9%) | 908 (2.9%) |
| 25 to 29 Years | 1,298 (4.6%) | 1,583 (5.1%) |
| 30 to 34 Years | 1,396 (5.0%) | 1,737 (5.6%) |
| 35 to 39 Years | 1,882 (6.7%) | 1,400 (4.5%) |
| 40 to 44 Years | 1,339 (4.8%) | 1,395 (4.5%) |
| 45 to 49 Years | 1,516 (5.4%) | 1,786 (5.7%) |
| 50 to 54 Years | 1,832 (6.6%) | 1,828 (5.9%) |
| 55 to 59 Years | 1,997 (7.2%) | 2,446 (7.8%) |
| 60 to 64 Years | 1,613 (5.8%) | 1,924 (6.2%) |
| 65 to 69 Years | 1,732 (6.2%) | 2,120 (6.8%) |
| 70 to 74 Years | 1,746 (6.3%) | 2,445 (7.8%) |
| 75 to 79 Years | 2,048 (7.3%) | 2,310 (7.4%) |
| 80 to 84 Years | 1,473 (5.3%) | 1,449 (4.6%) |
| 85 Years and over | 1,349 (4.8%) | 1,888 (6.0%) |
| Total | 27,904 (100.0%) | 31,184 (100.0%) |
Families and Households in Palm Beach Gardens
Median Family Size in Palm Beach Gardens
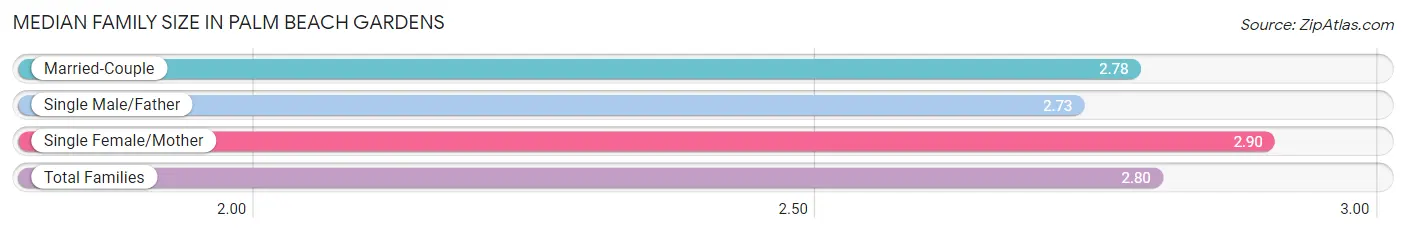
The median family size in Palm Beach Gardens is 2.80 persons per family, with single female/mother families (2,037 | 12.4%) accounting for the largest median family size of 2.9 persons per family. On the other hand, single male/father families (752 | 4.6%) represent the smallest median family size with 2.73 persons per family.
| Family Type | # Families | Family Size |
| Married-Couple | 13,631 (83.0%) | 2.78 |
| Single Male/Father | 752 (4.6%) | 2.73 |
| Single Female/Mother | 2,037 (12.4%) | 2.90 |
| Total Families | 16,420 (100.0%) | 2.80 |
Median Household Size in Palm Beach Gardens
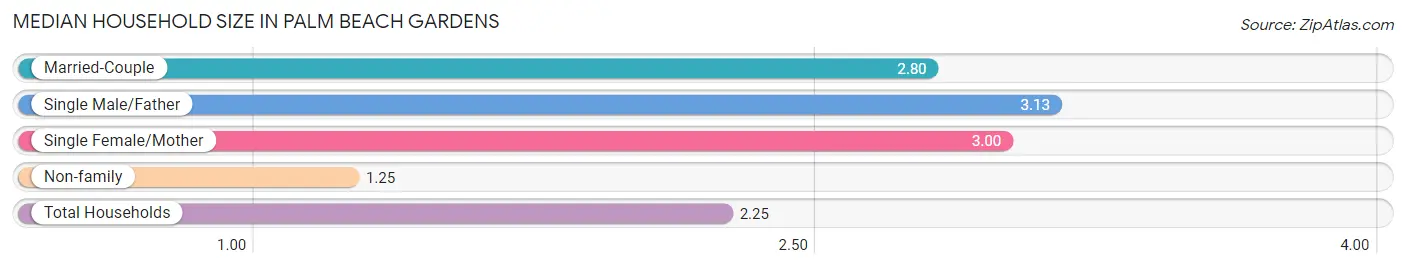
The median household size in Palm Beach Gardens is 2.25 persons per household, with single male/father households (752 | 2.9%) accounting for the largest median household size of 3.13 persons per household. non-family households (9,539 | 36.7%) represent the smallest median household size with 1.25 persons per household.
| Household Type | # Households | Household Size |
| Married-Couple | 13,631 (52.5%) | 2.80 |
| Single Male/Father | 752 (2.9%) | 3.13 |
| Single Female/Mother | 2,037 (7.9%) | 3.00 |
| Non-family | 9,539 (36.7%) | 1.25 |
| Total Households | 25,959 (100.0%) | 2.25 |
Household Size by Marriage Status in Palm Beach Gardens
Out of a total of 25,959 households in Palm Beach Gardens, 16,420 (63.2%) are family households, while 9,539 (36.7%) are nonfamily households. The most numerous type of family households are 2-person households, comprising 9,784, and the most common type of nonfamily households are 1-person households, comprising 7,873.
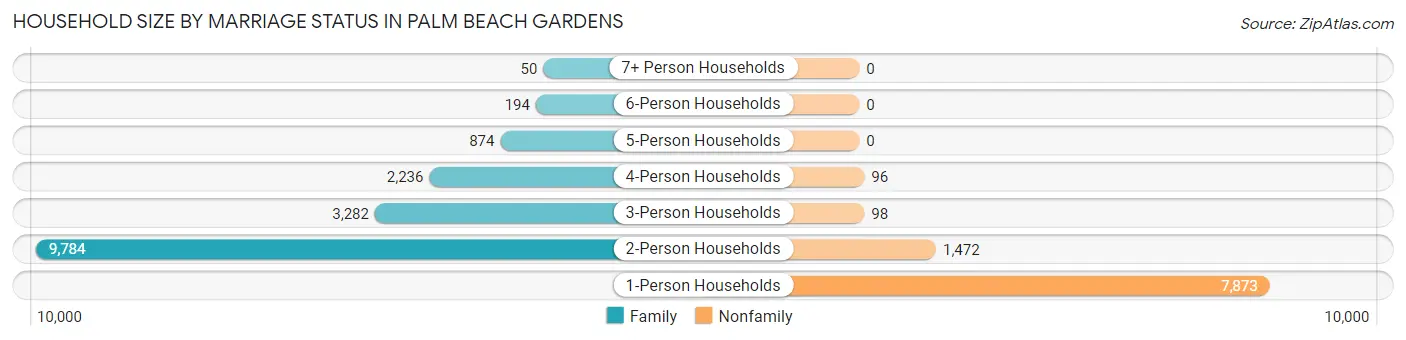
| Household Size | Family Households | Nonfamily Households |
| 1-Person Households | - | 7,873 (30.3%) |
| 2-Person Households | 9,784 (37.7%) | 1,472 (5.7%) |
| 3-Person Households | 3,282 (12.6%) | 98 (0.4%) |
| 4-Person Households | 2,236 (8.6%) | 96 (0.4%) |
| 5-Person Households | 874 (3.4%) | 0 (0.0%) |
| 6-Person Households | 194 (0.7%) | 0 (0.0%) |
| 7+ Person Households | 50 (0.2%) | 0 (0.0%) |
| Total | 16,420 (63.2%) | 9,539 (36.7%) |
Female Fertility in Palm Beach Gardens
Fertility by Age in Palm Beach Gardens
Average fertility rate in Palm Beach Gardens is 49.0 births per 1,000 women. Women in the age bracket of 20 to 34 years have the highest fertility rate with 66.0 births per 1,000 women. Women in the age bracket of 20 to 34 years acount for 50.8% of all women with births.
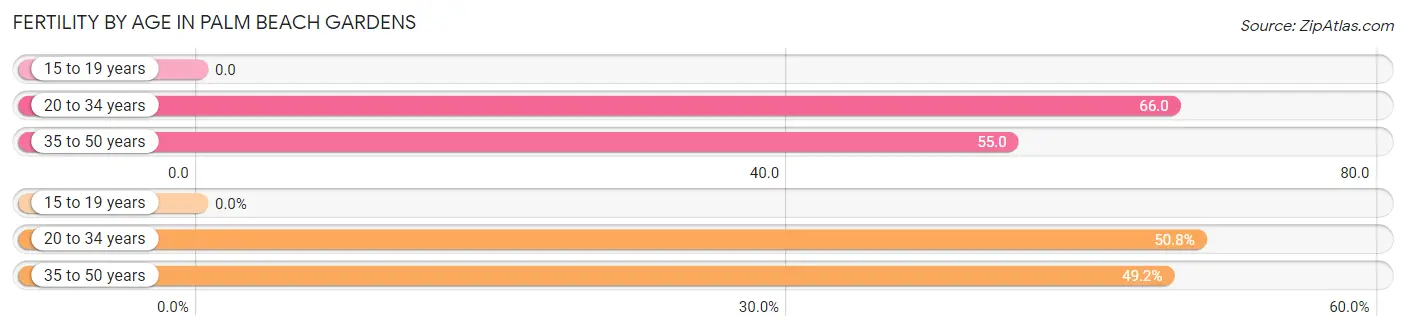
| Age Bracket | Women with Births | Births / 1,000 Women |
| 15 to 19 years | 0 (0.0%) | 0.0 |
| 20 to 34 years | 278 (50.8%) | 66.0 |
| 35 to 50 years | 269 (49.2%) | 55.0 |
| Total | 547 (100.0%) | 49.0 |
Fertility by Age by Marriage Status in Palm Beach Gardens
87.4% of women with births (547) in Palm Beach Gardens are married. The highest percentage of unmarried women with births falls into 20 to 34 years age bracket with 24.8% of them unmarried at the time of birth, while the lowest percentage of unmarried women with births belong to 35 to 50 years age bracket with 0.0% of them unmarried.
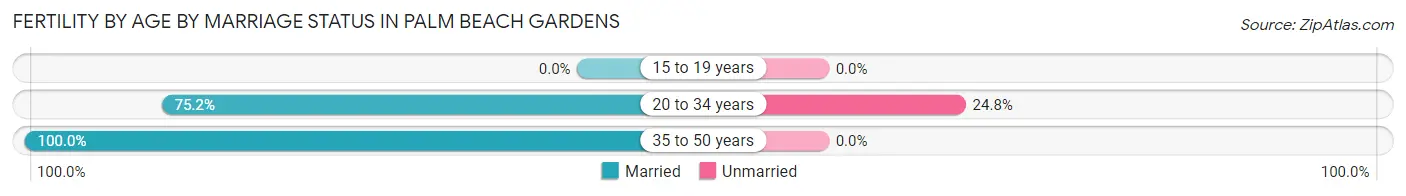
| Age Bracket | Married | Unmarried |
| 15 to 19 years | 0 (0.0%) | 0 (0.0%) |
| 20 to 34 years | 209 (75.2%) | 69 (24.8%) |
| 35 to 50 years | 269 (100.0%) | 0 (0.0%) |
| Total | 478 (87.4%) | 69 (12.6%) |
Fertility by Education in Palm Beach Gardens
Average fertility rate in Palm Beach Gardens is 49.0 births per 1,000 women. Women with the education attainment of bachelor's degree have the highest fertility rate of 67.0 births per 1,000 women, while women with the education attainment of less than high school have the lowest fertility at 2.0 births per 1,000 women. Women with the education attainment of bachelor's degree represent 41.3% of all women with births.
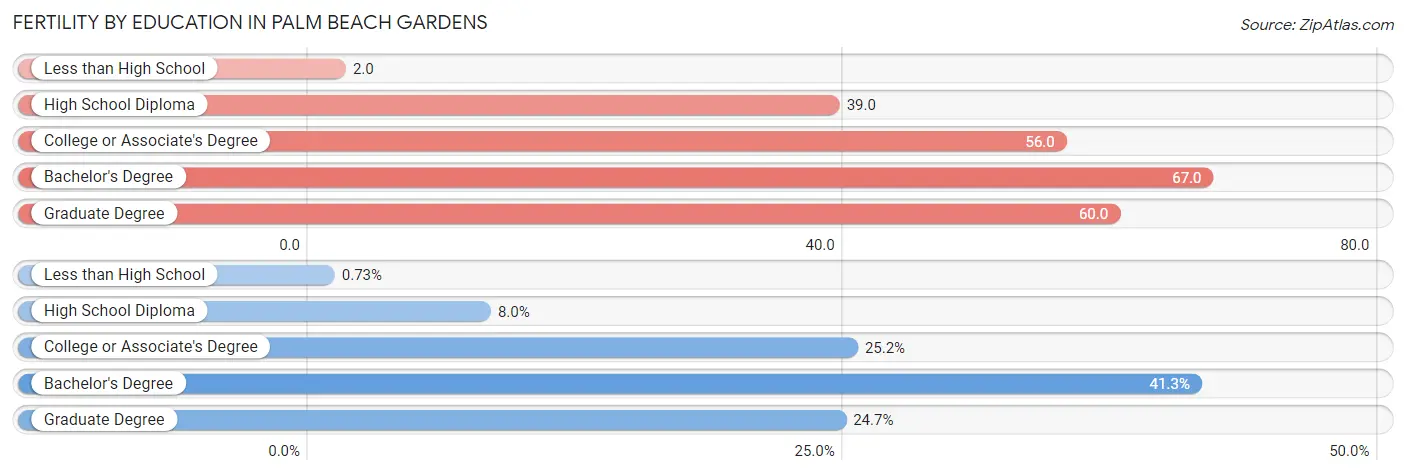
| Educational Attainment | Women with Births | Births / 1,000 Women |
| Less than High School | 4 (0.7%) | 2.0 |
| High School Diploma | 44 (8.0%) | 39.0 |
| College or Associate's Degree | 138 (25.2%) | 56.0 |
| Bachelor's Degree | 226 (41.3%) | 67.0 |
| Graduate Degree | 135 (24.7%) | 60.0 |
| Total | 547 (100.0%) | 49.0 |
Fertility by Education by Marriage Status in Palm Beach Gardens
12.6% of women with births in Palm Beach Gardens are unmarried. Women with the educational attainment of bachelor's degree are most likely to be married with 100.0% of them married at childbirth, while women with the educational attainment of less than high school are least likely to be married with 100.0% of them unmarried at childbirth.
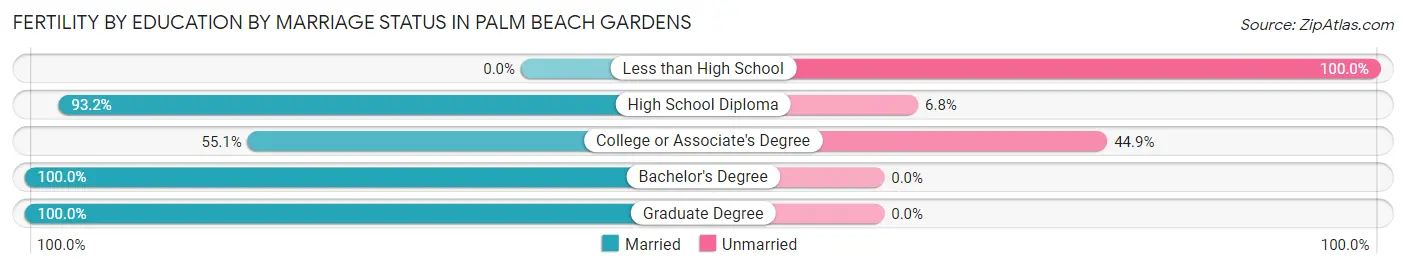
| Educational Attainment | Married | Unmarried |
| Less than High School | 0 (0.0%) | 4 (100.0%) |
| High School Diploma | 41 (93.2%) | 3 (6.8%) |
| College or Associate's Degree | 76 (55.1%) | 62 (44.9%) |
| Bachelor's Degree | 226 (100.0%) | 0 (0.0%) |
| Graduate Degree | 135 (100.0%) | 0 (0.0%) |
| Total | 478 (87.4%) | 69 (12.6%) |
Employment Characteristics in Palm Beach Gardens
Employment by Class of Employer in Palm Beach Gardens
Among the 27,057 employed individuals in Palm Beach Gardens, private company employees (17,527 | 64.8%), self-employed (incorporated) (3,720 | 13.8%), and not-for-profit organizations (1,808 | 6.7%) make up the most common classes of employment.
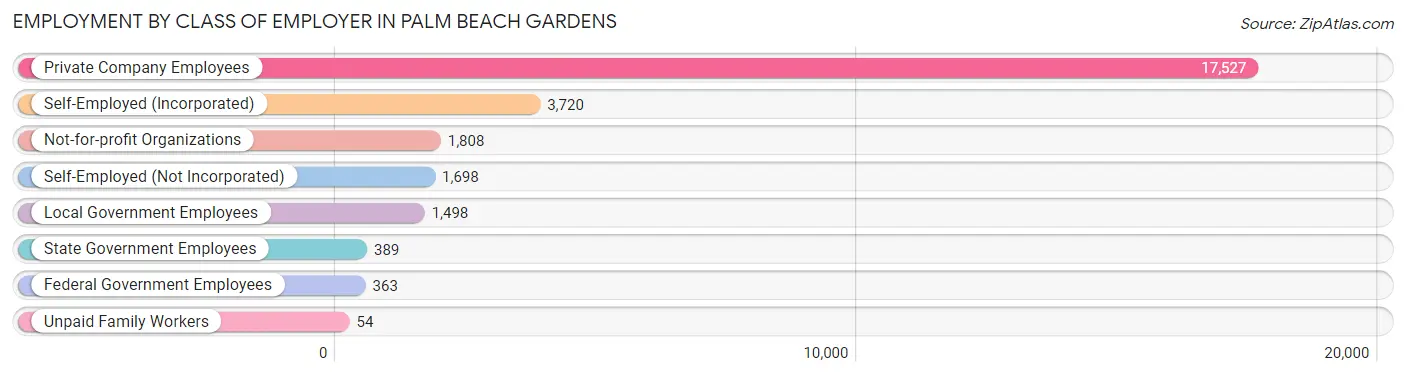
| Employer Class | # Employees | % Employees |
| Private Company Employees | 17,527 | 64.8% |
| Self-Employed (Incorporated) | 3,720 | 13.8% |
| Self-Employed (Not Incorporated) | 1,698 | 6.3% |
| Not-for-profit Organizations | 1,808 | 6.7% |
| Local Government Employees | 1,498 | 5.5% |
| State Government Employees | 389 | 1.4% |
| Federal Government Employees | 363 | 1.3% |
| Unpaid Family Workers | 54 | 0.2% |
| Total | 27,057 | 100.0% |
Employment Status by Age in Palm Beach Gardens
According to the labor force statistics for Palm Beach Gardens, out of the total population over 16 years of age (50,309), 56.6% or 28,475 individuals are in the labor force, with 3.5% or 997 of them unemployed. The age group with the highest labor force participation rate is 25 to 29 years, with 91.0% or 2,622 individuals in the labor force. Within the labor force, the 20 to 24 years age range has the highest percentage of unemployed individuals, with 7.3% or 135 of them being unemployed.
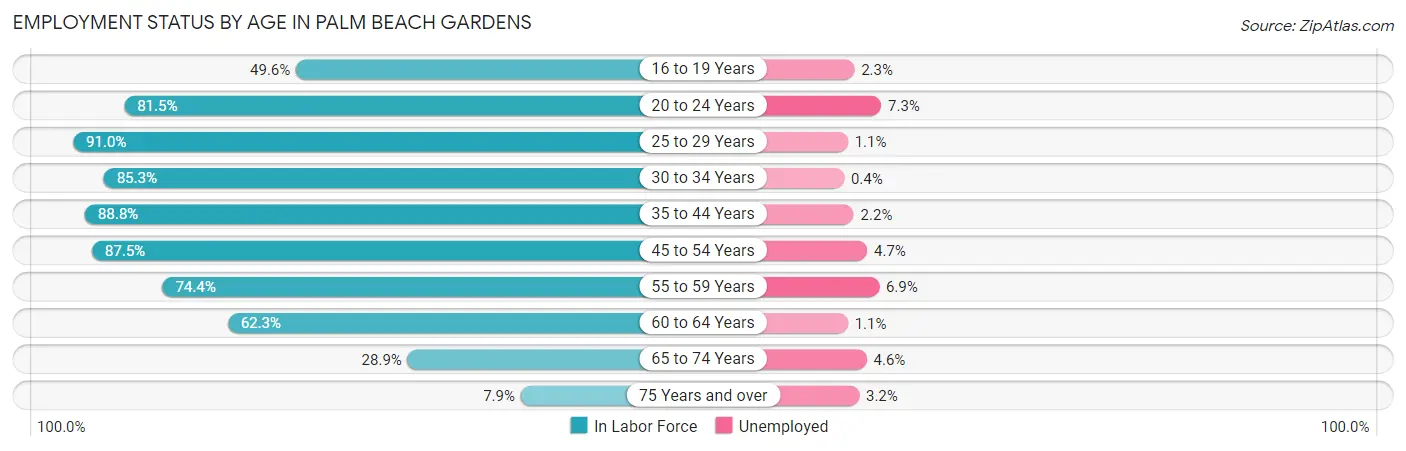
| Age Bracket | In Labor Force | Unemployed |
| 16 to 19 Years | 1,240 (49.6%) | 29 (2.3%) |
| 20 to 24 Years | 1,856 (81.5%) | 135 (7.3%) |
| 25 to 29 Years | 2,622 (91.0%) | 29 (1.1%) |
| 30 to 34 Years | 2,672 (85.3%) | 11 (0.4%) |
| 35 to 44 Years | 5,342 (88.8%) | 118 (2.2%) |
| 45 to 54 Years | 6,092 (87.5%) | 286 (4.7%) |
| 55 to 59 Years | 3,306 (74.4%) | 228 (6.9%) |
| 60 to 64 Years | 2,204 (62.3%) | 24 (1.1%) |
| 65 to 74 Years | 2,324 (28.9%) | 107 (4.6%) |
| 75 Years and over | 831 (7.9%) | 27 (3.2%) |
| Total | 28,475 (56.6%) | 997 (3.5%) |
Employment Status by Educational Attainment in Palm Beach Gardens
According to labor force statistics for Palm Beach Gardens, 82.4% of individuals (22,225) out of the total population between 25 and 64 years of age (26,972) are in the labor force, with 3.1% or 689 of them being unemployed. The group with the highest labor force participation rate are those with the educational attainment of bachelor's degree or higher, with 85.4% or 13,427 individuals in the labor force. Within the labor force, individuals with high school diploma education have the highest percentage of unemployment, with 4.9% or 151 of them being unemployed.
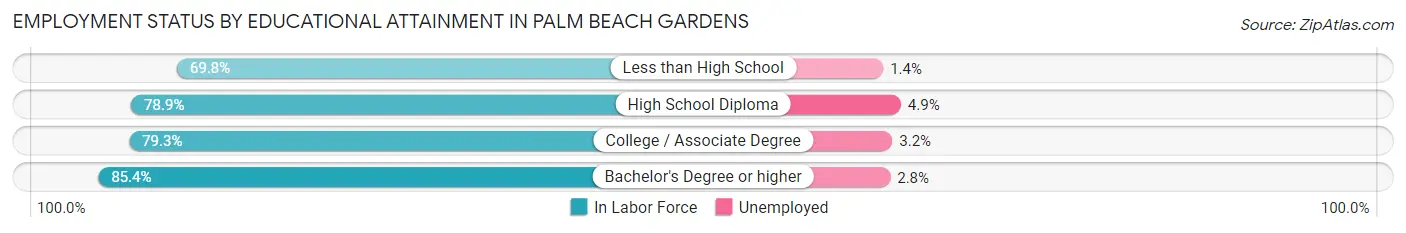
| Educational Attainment | In Labor Force | Unemployed |
| Less than High School | 639 (69.8%) | 13 (1.4%) |
| High School Diploma | 3,074 (78.9%) | 191 (4.9%) |
| College / Associate Degree | 5,105 (79.3%) | 206 (3.2%) |
| Bachelor's Degree or higher | 13,427 (85.4%) | 440 (2.8%) |
| Total | 22,225 (82.4%) | 836 (3.1%) |
Employment Occupations by Sex in Palm Beach Gardens
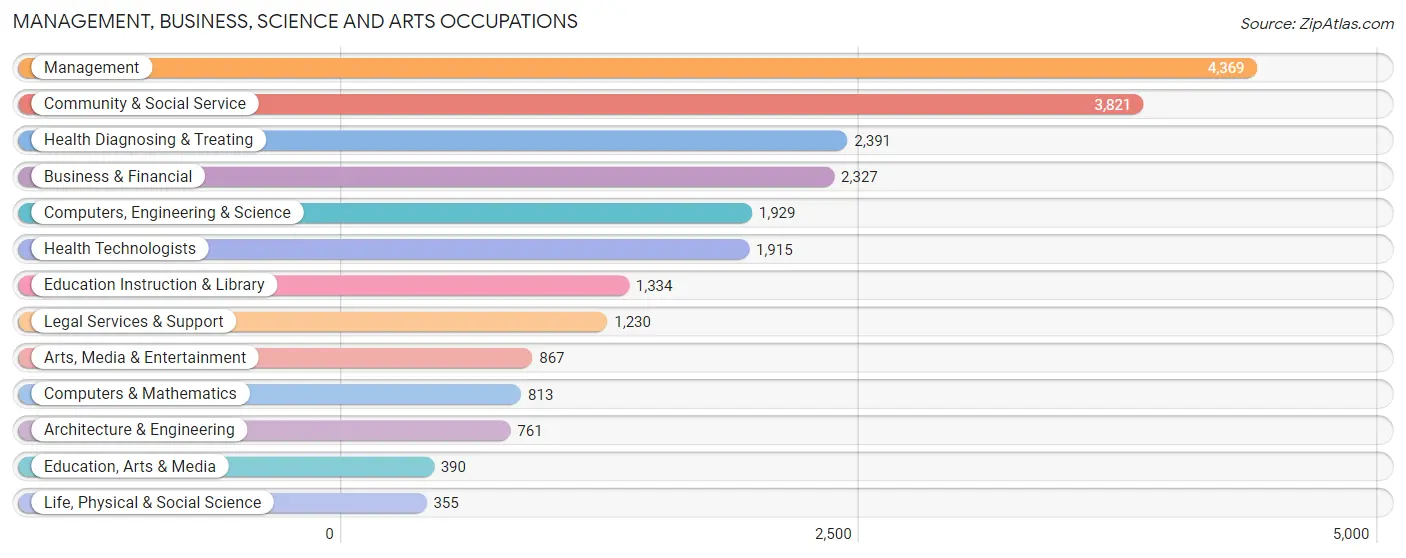
Management, Business, Science and Arts Occupations
The most common Management, Business, Science and Arts occupations in Palm Beach Gardens are Management (4,369 | 15.9%), Community & Social Service (3,821 | 13.9%), Health Diagnosing & Treating (2,391 | 8.7%), Business & Financial (2,327 | 8.5%), and Computers, Engineering & Science (1,929 | 7.0%).
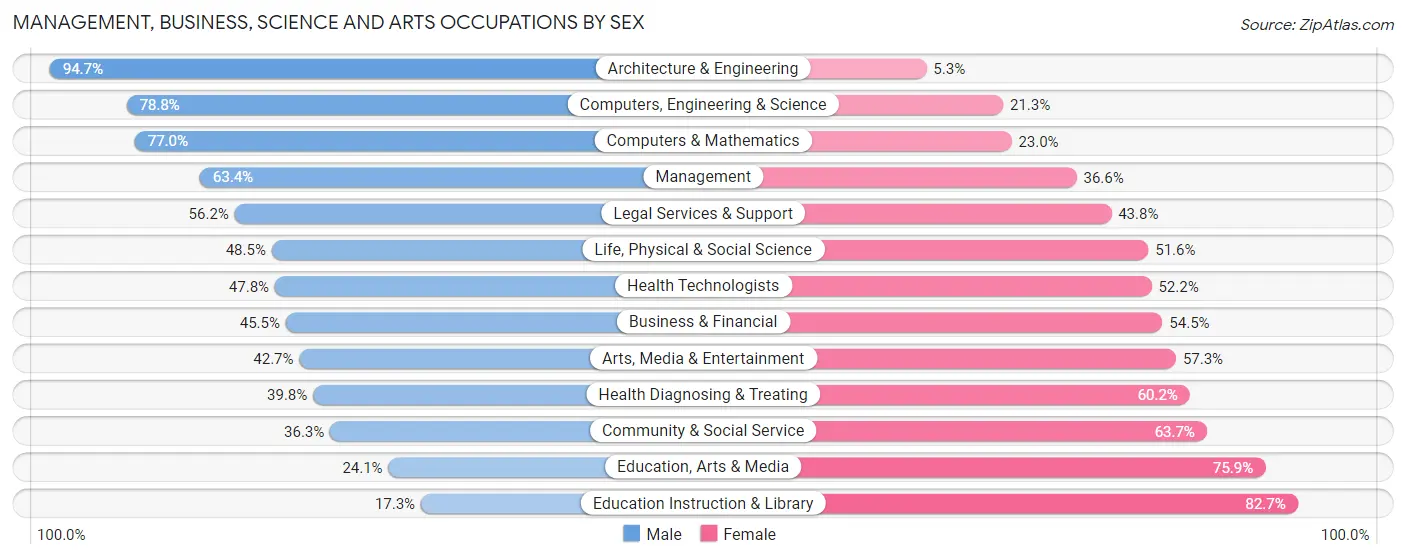
Management, Business, Science and Arts Occupations by Sex
Within the Management, Business, Science and Arts occupations in Palm Beach Gardens, the most male-oriented occupations are Architecture & Engineering (94.7%), Computers, Engineering & Science (78.7%), and Computers & Mathematics (77.0%), while the most female-oriented occupations are Education Instruction & Library (82.7%), Education, Arts & Media (75.9%), and Community & Social Service (63.7%).
| Occupation | Male | Female |
| Management | 2,771 (63.4%) | 1,598 (36.6%) |
| Business & Financial | 1,059 (45.5%) | 1,268 (54.5%) |
| Computers, Engineering & Science | 1,519 (78.7%) | 410 (21.2%) |
| Computers & Mathematics | 626 (77.0%) | 187 (23.0%) |
| Architecture & Engineering | 721 (94.7%) | 40 (5.3%) |
| Life, Physical & Social Science | 172 (48.4%) | 183 (51.5%) |
| Community & Social Service | 1,386 (36.3%) | 2,435 (63.7%) |
| Education, Arts & Media | 94 (24.1%) | 296 (75.9%) |
| Legal Services & Support | 691 (56.2%) | 539 (43.8%) |
| Education Instruction & Library | 231 (17.3%) | 1,103 (82.7%) |
| Arts, Media & Entertainment | 370 (42.7%) | 497 (57.3%) |
| Health Diagnosing & Treating | 952 (39.8%) | 1,439 (60.2%) |
| Health Technologists | 915 (47.8%) | 1,000 (52.2%) |
| Total (Category) | 7,687 (51.8%) | 7,150 (48.2%) |
| Total (Overall) | 14,508 (52.7%) | 12,996 (47.2%) |
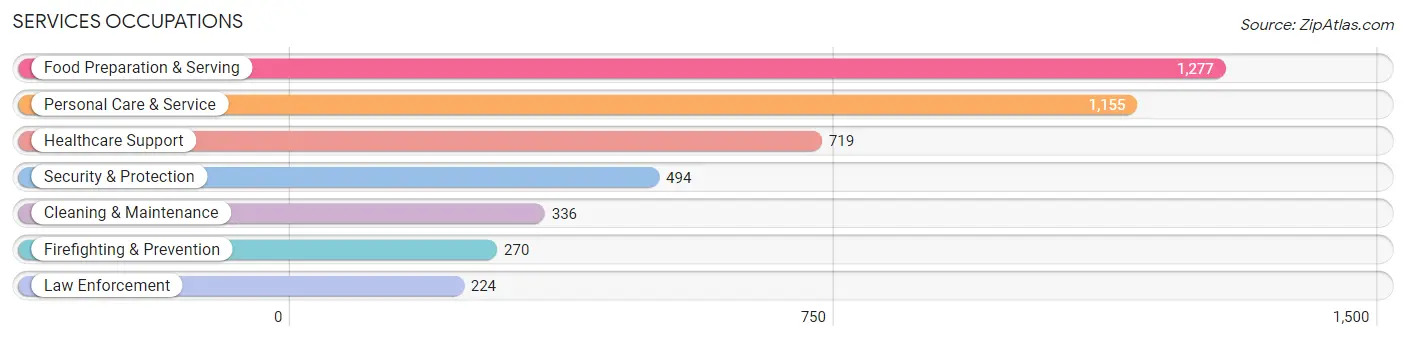
Services Occupations
The most common Services occupations in Palm Beach Gardens are Food Preparation & Serving (1,277 | 4.6%), Personal Care & Service (1,155 | 4.2%), Healthcare Support (719 | 2.6%), Security & Protection (494 | 1.8%), and Cleaning & Maintenance (336 | 1.2%).
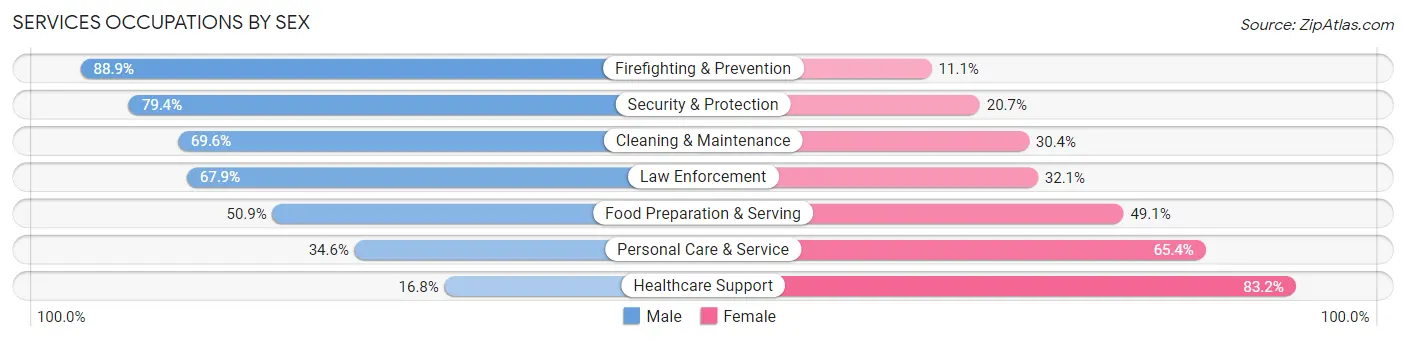
Services Occupations by Sex
Within the Services occupations in Palm Beach Gardens, the most male-oriented occupations are Firefighting & Prevention (88.9%), Security & Protection (79.3%), and Cleaning & Maintenance (69.6%), while the most female-oriented occupations are Healthcare Support (83.2%), Personal Care & Service (65.4%), and Food Preparation & Serving (49.1%).
| Occupation | Male | Female |
| Healthcare Support | 121 (16.8%) | 598 (83.2%) |
| Security & Protection | 392 (79.3%) | 102 (20.6%) |
| Firefighting & Prevention | 240 (88.9%) | 30 (11.1%) |
| Law Enforcement | 152 (67.9%) | 72 (32.1%) |
| Food Preparation & Serving | 650 (50.9%) | 627 (49.1%) |
| Cleaning & Maintenance | 234 (69.6%) | 102 (30.4%) |
| Personal Care & Service | 400 (34.6%) | 755 (65.4%) |
| Total (Category) | 1,797 (45.1%) | 2,184 (54.9%) |
| Total (Overall) | 14,508 (52.7%) | 12,996 (47.2%) |
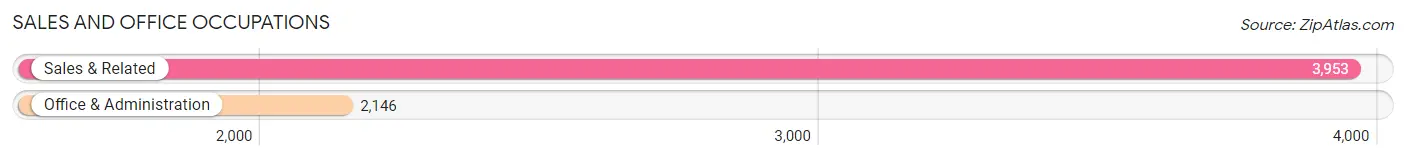
Sales and Office Occupations
The most common Sales and Office occupations in Palm Beach Gardens are Sales & Related (3,953 | 14.4%), and Office & Administration (2,146 | 7.8%).
Sales and Office Occupations by Sex
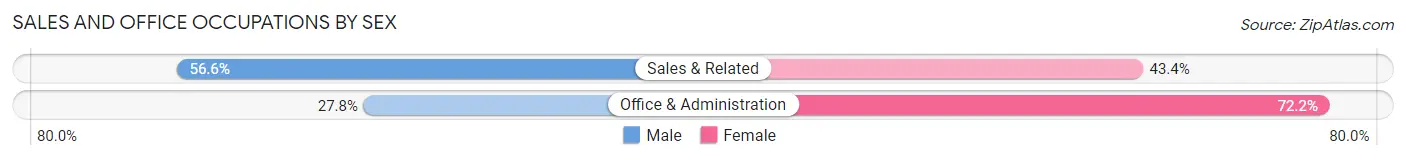
| Occupation | Male | Female |
| Sales & Related | 2,238 (56.6%) | 1,715 (43.4%) |
| Office & Administration | 597 (27.8%) | 1,549 (72.2%) |
| Total (Category) | 2,835 (46.5%) | 3,264 (53.5%) |
| Total (Overall) | 14,508 (52.7%) | 12,996 (47.2%) |
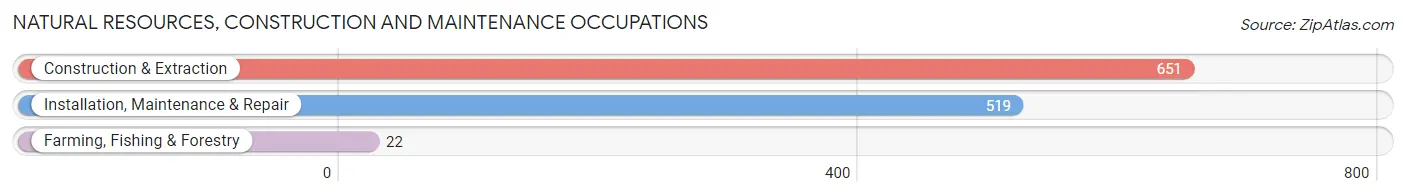
Natural Resources, Construction and Maintenance Occupations
The most common Natural Resources, Construction and Maintenance occupations in Palm Beach Gardens are Construction & Extraction (651 | 2.4%), Installation, Maintenance & Repair (519 | 1.9%), and Farming, Fishing & Forestry (22 | 0.1%).
Natural Resources, Construction and Maintenance Occupations by Sex
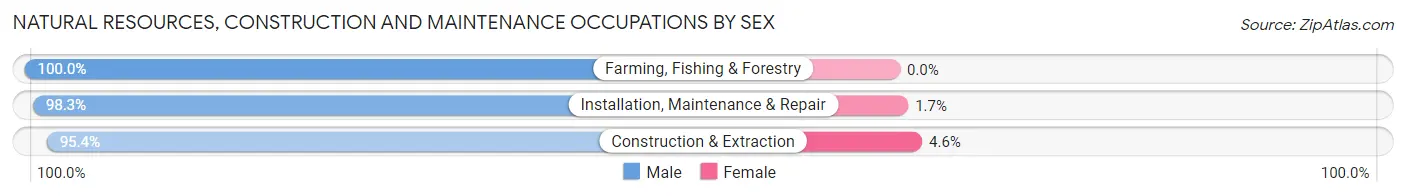
| Occupation | Male | Female |
| Farming, Fishing & Forestry | 22 (100.0%) | 0 (0.0%) |
| Construction & Extraction | 621 (95.4%) | 30 (4.6%) |
| Installation, Maintenance & Repair | 510 (98.3%) | 9 (1.7%) |
| Total (Category) | 1,153 (96.7%) | 39 (3.3%) |
| Total (Overall) | 14,508 (52.7%) | 12,996 (47.2%) |
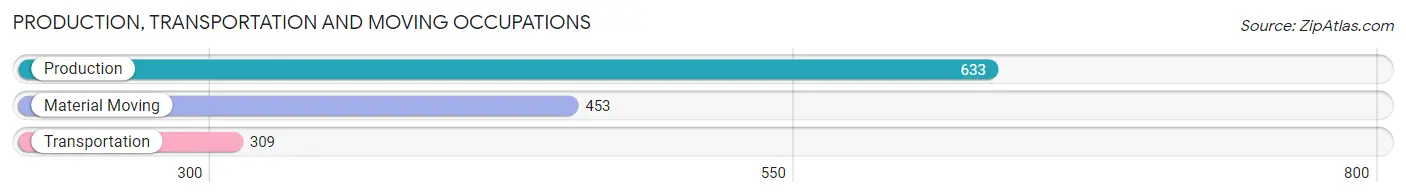
Production, Transportation and Moving Occupations
The most common Production, Transportation and Moving occupations in Palm Beach Gardens are Production (633 | 2.3%), Material Moving (453 | 1.7%), and Transportation (309 | 1.1%).
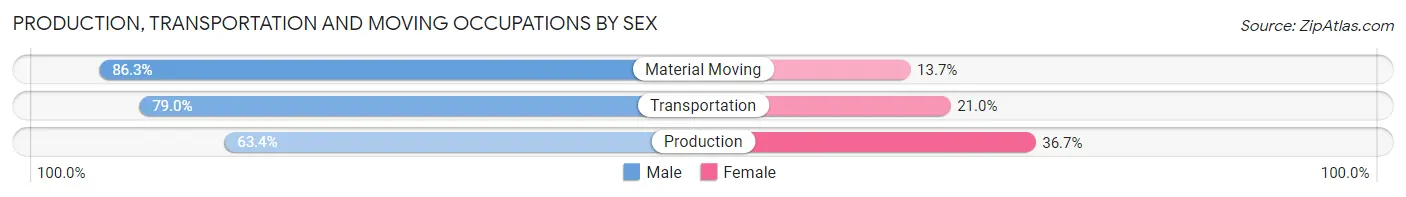
Production, Transportation and Moving Occupations by Sex
| Occupation | Male | Female |
| Production | 401 (63.3%) | 232 (36.6%) |
| Transportation | 244 (79.0%) | 65 (21.0%) |
| Material Moving | 391 (86.3%) | 62 (13.7%) |
| Total (Category) | 1,036 (74.3%) | 359 (25.7%) |
| Total (Overall) | 14,508 (52.7%) | 12,996 (47.2%) |
Employment Industries by Sex in Palm Beach Gardens
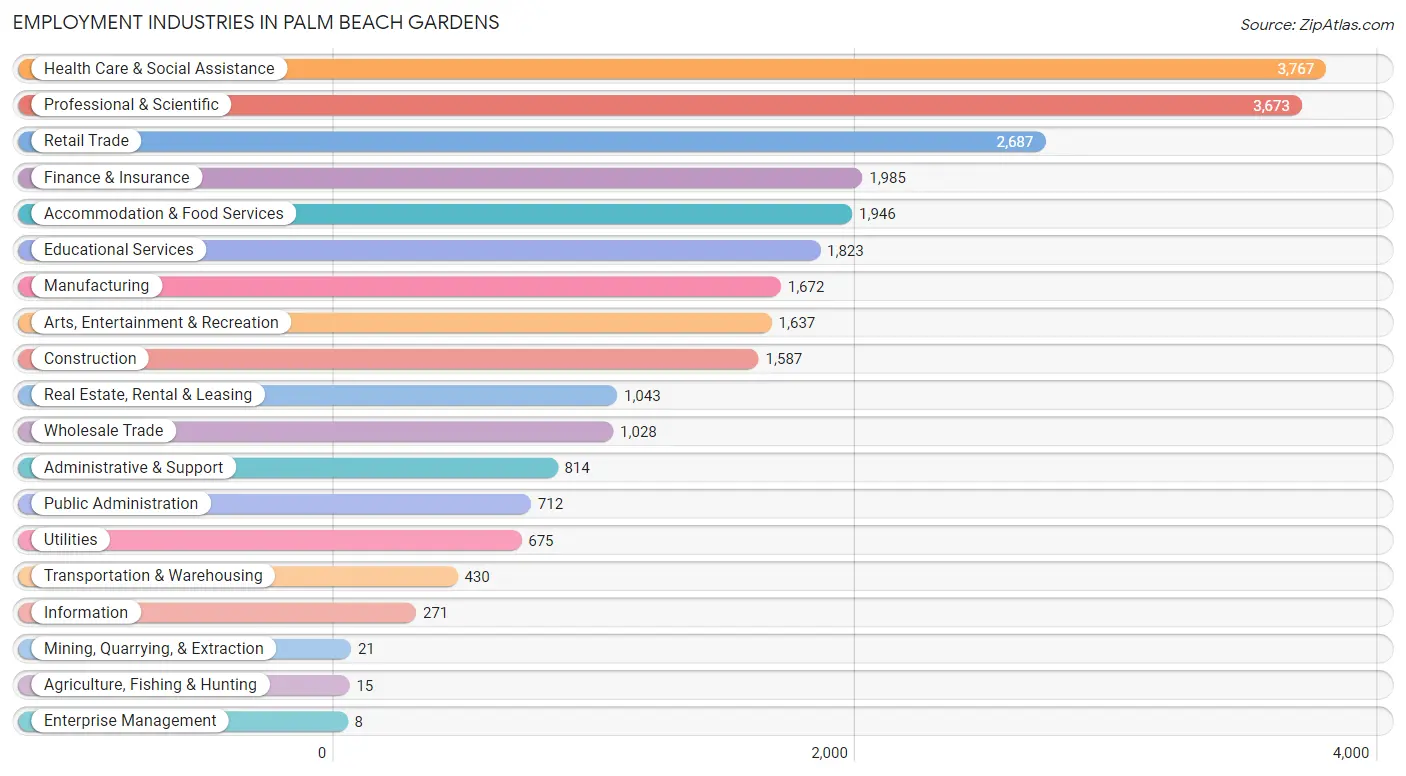
Employment Industries in Palm Beach Gardens
The major employment industries in Palm Beach Gardens include Health Care & Social Assistance (3,767 | 13.7%), Professional & Scientific (3,673 | 13.4%), Retail Trade (2,687 | 9.8%), Finance & Insurance (1,985 | 7.2%), and Accommodation & Food Services (1,946 | 7.1%).
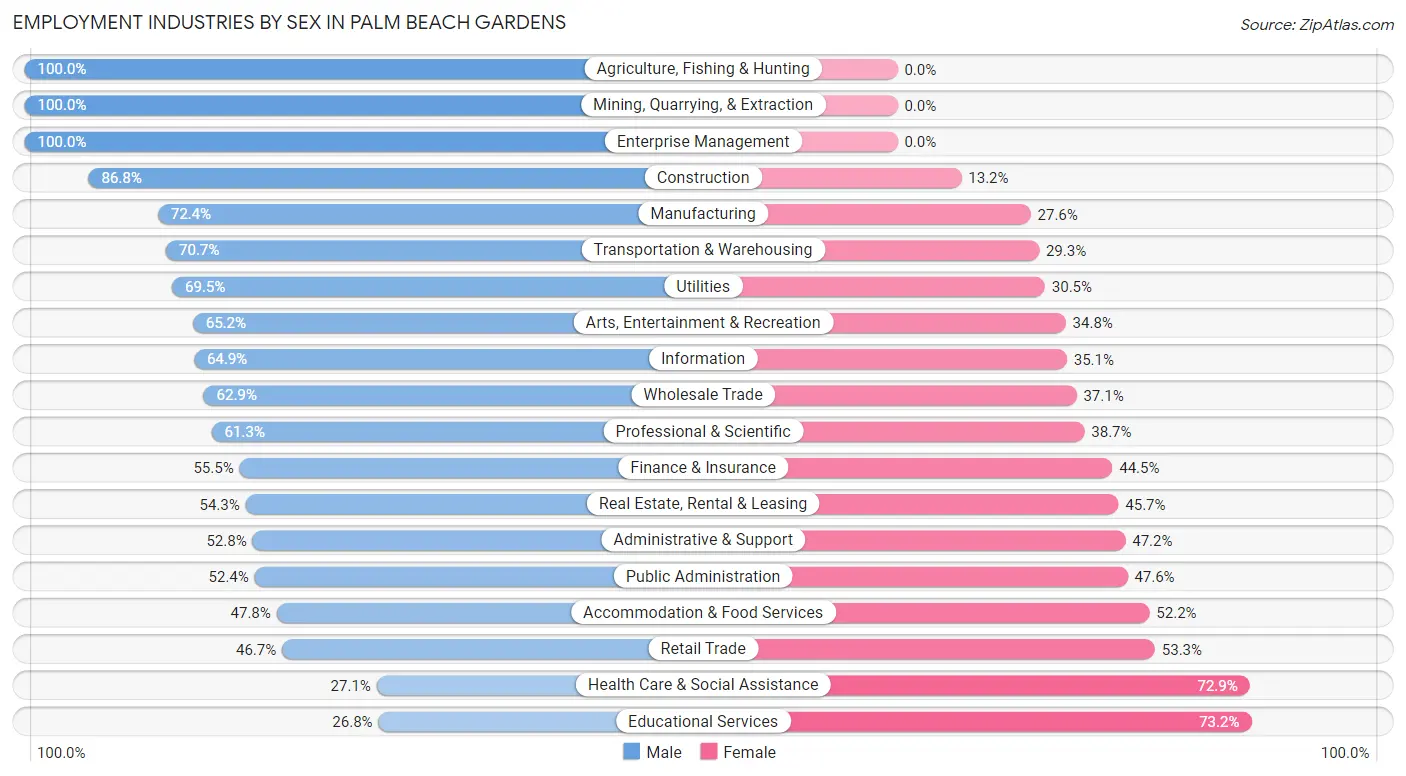
Employment Industries by Sex in Palm Beach Gardens
The Palm Beach Gardens industries that see more men than women are Agriculture, Fishing & Hunting (100.0%), Mining, Quarrying, & Extraction (100.0%), and Enterprise Management (100.0%), whereas the industries that tend to have a higher number of women are Educational Services (73.2%), Health Care & Social Assistance (72.9%), and Retail Trade (53.3%).
| Industry | Male | Female |
| Agriculture, Fishing & Hunting | 15 (100.0%) | 0 (0.0%) |
| Mining, Quarrying, & Extraction | 21 (100.0%) | 0 (0.0%) |
| Construction | 1,377 (86.8%) | 210 (13.2%) |
| Manufacturing | 1,211 (72.4%) | 461 (27.6%) |
| Wholesale Trade | 647 (62.9%) | 381 (37.1%) |
| Retail Trade | 1,255 (46.7%) | 1,432 (53.3%) |
| Transportation & Warehousing | 304 (70.7%) | 126 (29.3%) |
| Utilities | 469 (69.5%) | 206 (30.5%) |
| Information | 176 (64.9%) | 95 (35.1%) |
| Finance & Insurance | 1,102 (55.5%) | 883 (44.5%) |
| Real Estate, Rental & Leasing | 566 (54.3%) | 477 (45.7%) |
| Professional & Scientific | 2,252 (61.3%) | 1,421 (38.7%) |
| Enterprise Management | 8 (100.0%) | 0 (0.0%) |
| Administrative & Support | 430 (52.8%) | 384 (47.2%) |
| Educational Services | 488 (26.8%) | 1,335 (73.2%) |
| Health Care & Social Assistance | 1,022 (27.1%) | 2,745 (72.9%) |
| Arts, Entertainment & Recreation | 1,067 (65.2%) | 570 (34.8%) |
| Accommodation & Food Services | 931 (47.8%) | 1,015 (52.2%) |
| Public Administration | 373 (52.4%) | 339 (47.6%) |
| Total | 14,508 (52.7%) | 12,996 (47.2%) |
Education in Palm Beach Gardens
School Enrollment in Palm Beach Gardens
The most common levels of schooling among the 11,179 students in Palm Beach Gardens are high school (3,236 | 28.9%), elementary school (2,546 | 22.8%), and middle school (1,731 | 15.5%).
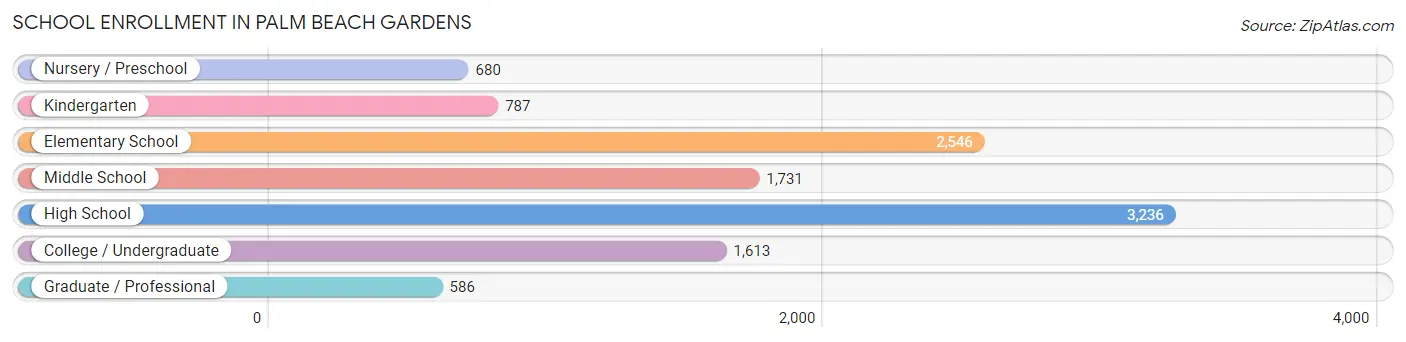
| School Level | # Students | % Students |
| Nursery / Preschool | 680 | 6.1% |
| Kindergarten | 787 | 7.0% |
| Elementary School | 2,546 | 22.8% |
| Middle School | 1,731 | 15.5% |
| High School | 3,236 | 28.9% |
| College / Undergraduate | 1,613 | 14.4% |
| Graduate / Professional | 586 | 5.2% |
| Total | 11,179 | 100.0% |
School Enrollment by Age by Funding Source in Palm Beach Gardens
Out of a total of 11,179 students who are enrolled in schools in Palm Beach Gardens, 3,890 (34.8%) attend a private institution, while the remaining 7,289 (65.2%) are enrolled in public schools. The age group of 3 to 4 year olds has the highest likelihood of being enrolled in private schools, with 561 (73.4% in the age bracket) enrolled. Conversely, the age group of 35 years and over has the lowest likelihood of being enrolled in a private school, with 386 (78.6% in the age bracket) attending a public institution.
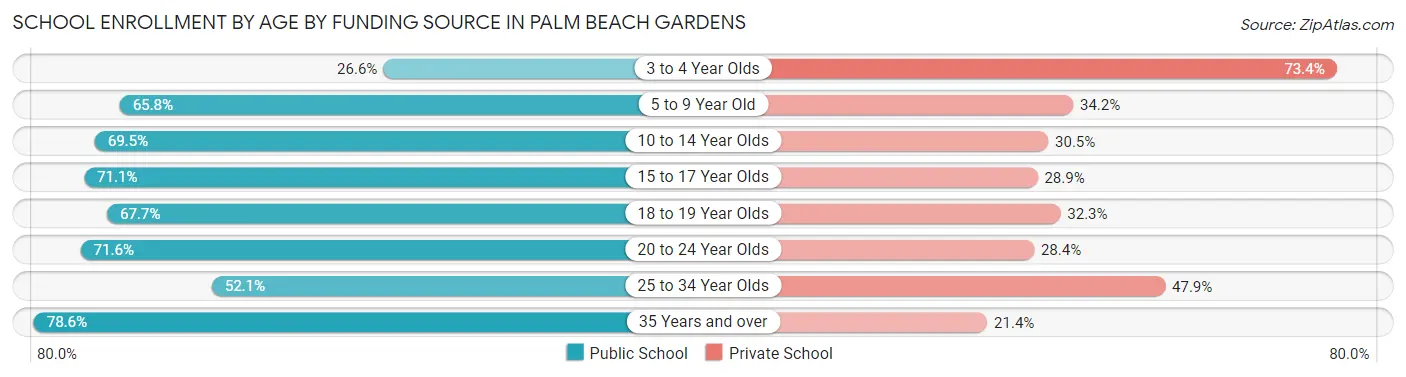
| Age Bracket | Public School | Private School |
| 3 to 4 Year Olds | 203 (26.6%) | 561 (73.4%) |
| 5 to 9 Year Old | 2,141 (65.8%) | 1,112 (34.2%) |
| 10 to 14 Year Olds | 1,404 (69.5%) | 615 (30.5%) |
| 15 to 17 Year Olds | 1,670 (71.1%) | 678 (28.9%) |
| 18 to 19 Year Olds | 543 (67.7%) | 259 (32.3%) |
| 20 to 24 Year Olds | 581 (71.6%) | 230 (28.4%) |
| 25 to 34 Year Olds | 360 (52.1%) | 331 (47.9%) |
| 35 Years and over | 386 (78.6%) | 105 (21.4%) |
| Total | 7,289 (65.2%) | 3,890 (34.8%) |
Educational Attainment by Field of Study in Palm Beach Gardens
Business (6,665 | 24.5%), education (3,396 | 12.5%), social sciences (2,557 | 9.4%), science & technology (2,345 | 8.6%), and engineering (2,241 | 8.2%) are the most common fields of study among 27,189 individuals in Palm Beach Gardens who have obtained a bachelor's degree or higher.
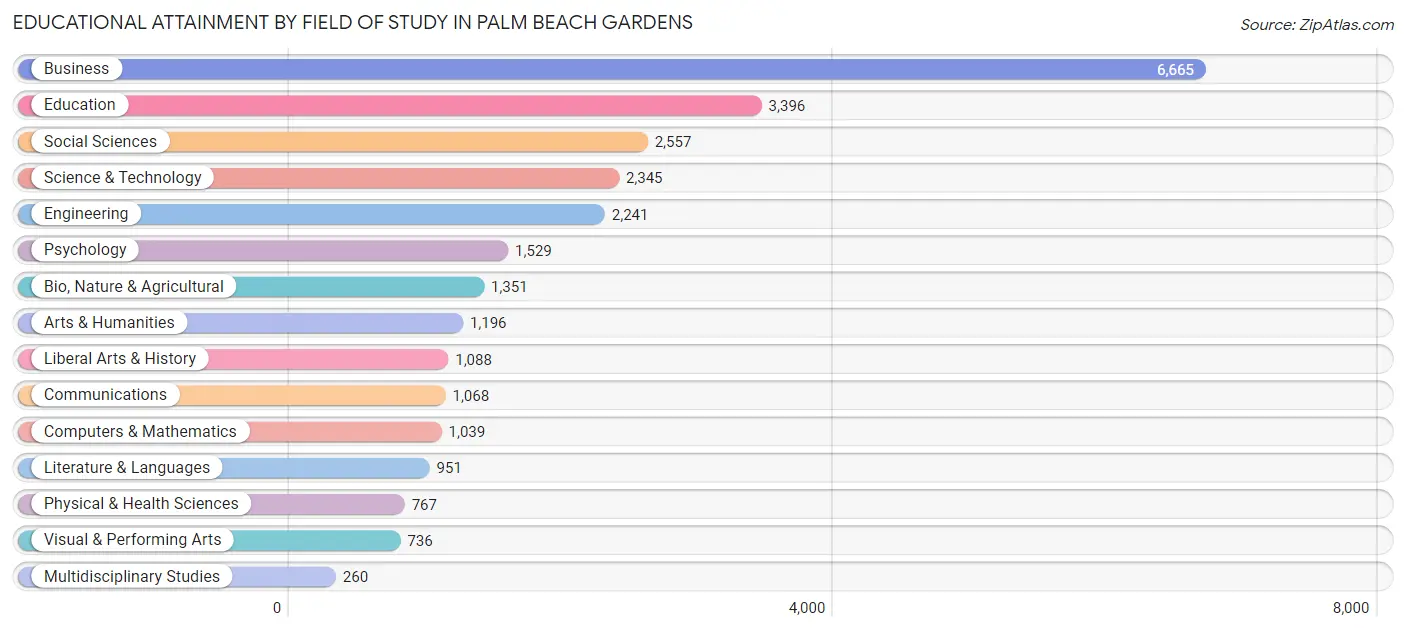
| Field of Study | # Graduates | % Graduates |
| Computers & Mathematics | 1,039 | 3.8% |
| Bio, Nature & Agricultural | 1,351 | 5.0% |
| Physical & Health Sciences | 767 | 2.8% |
| Psychology | 1,529 | 5.6% |
| Social Sciences | 2,557 | 9.4% |
| Engineering | 2,241 | 8.2% |
| Multidisciplinary Studies | 260 | 1.0% |
| Science & Technology | 2,345 | 8.6% |
| Business | 6,665 | 24.5% |
| Education | 3,396 | 12.5% |
| Literature & Languages | 951 | 3.5% |
| Liberal Arts & History | 1,088 | 4.0% |
| Visual & Performing Arts | 736 | 2.7% |
| Communications | 1,068 | 3.9% |
| Arts & Humanities | 1,196 | 4.4% |
| Total | 27,189 | 100.0% |
Transportation & Commute in Palm Beach Gardens
Vehicle Availability by Sex in Palm Beach Gardens
The most prevalent vehicle ownership categories in Palm Beach Gardens are males with 2 vehicles (7,209, accounting for 50.2%) and females with 2 vehicles (5,773, making up 56.8%).
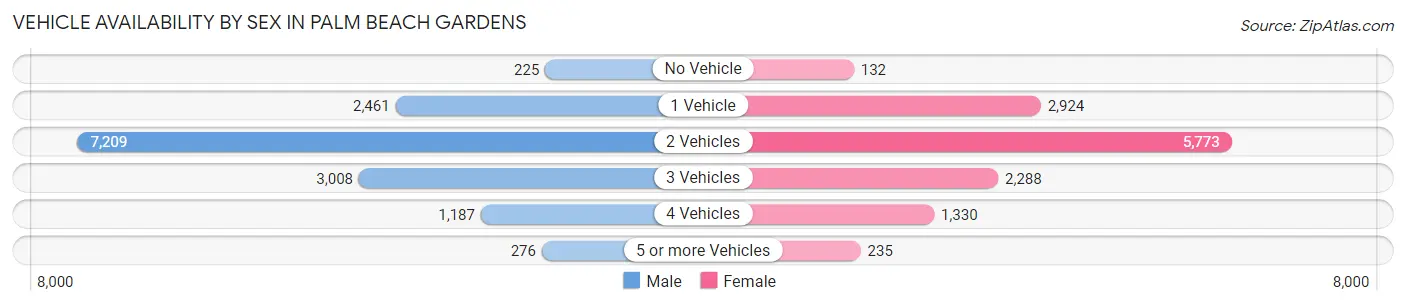
| Vehicles Available | Male | Female |
| No Vehicle | 225 (1.6%) | 132 (1.0%) |
| 1 Vehicle | 2,461 (17.1%) | 2,924 (23.1%) |
| 2 Vehicles | 7,209 (50.2%) | 5,773 (45.5%) |
| 3 Vehicles | 3,008 (20.9%) | 2,288 (18.0%) |
| 4 Vehicles | 1,187 (8.3%) | 1,330 (10.5%) |
| 5 or more Vehicles | 276 (1.9%) | 235 (1.8%) |
| Total | 14,366 (100.0%) | 12,682 (100.0%) |
Commute Time in Palm Beach Gardens
The most frequently occuring commute durations in Palm Beach Gardens are 20 to 24 minutes (4,186 commuters, 18.5%), 15 to 19 minutes (4,152 commuters, 18.3%), and 10 to 14 minutes (3,050 commuters, 13.5%).
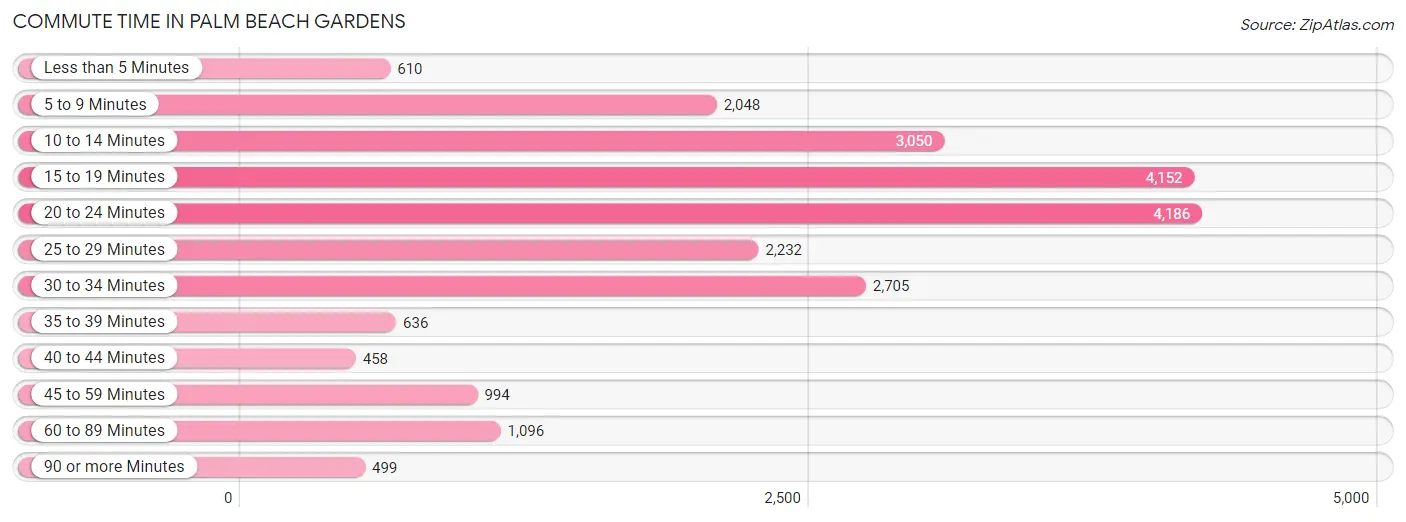
| Commute Time | # Commuters | % Commuters |
| Less than 5 Minutes | 610 | 2.7% |
| 5 to 9 Minutes | 2,048 | 9.0% |
| 10 to 14 Minutes | 3,050 | 13.5% |
| 15 to 19 Minutes | 4,152 | 18.3% |
| 20 to 24 Minutes | 4,186 | 18.5% |
| 25 to 29 Minutes | 2,232 | 9.9% |
| 30 to 34 Minutes | 2,705 | 11.9% |
| 35 to 39 Minutes | 636 | 2.8% |
| 40 to 44 Minutes | 458 | 2.0% |
| 45 to 59 Minutes | 994 | 4.4% |
| 60 to 89 Minutes | 1,096 | 4.8% |
| 90 or more Minutes | 499 | 2.2% |
Commute Time by Sex in Palm Beach Gardens
The most common commute times in Palm Beach Gardens are 15 to 19 minutes (2,058 commuters, 17.4%) for males and 20 to 24 minutes (2,302 commuters, 21.2%) for females.
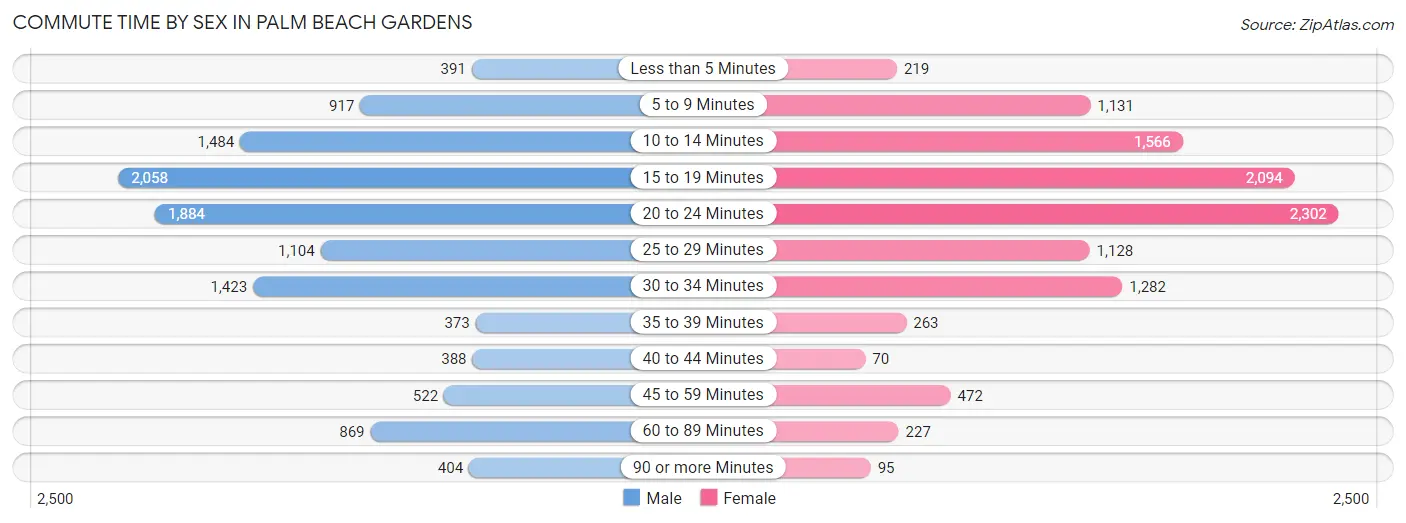
| Commute Time | Male | Female |
| Less than 5 Minutes | 391 (3.3%) | 219 (2.0%) |
| 5 to 9 Minutes | 917 (7.8%) | 1,131 (10.4%) |
| 10 to 14 Minutes | 1,484 (12.6%) | 1,566 (14.4%) |
| 15 to 19 Minutes | 2,058 (17.4%) | 2,094 (19.3%) |
| 20 to 24 Minutes | 1,884 (15.9%) | 2,302 (21.2%) |
| 25 to 29 Minutes | 1,104 (9.3%) | 1,128 (10.4%) |
| 30 to 34 Minutes | 1,423 (12.0%) | 1,282 (11.8%) |
| 35 to 39 Minutes | 373 (3.2%) | 263 (2.4%) |
| 40 to 44 Minutes | 388 (3.3%) | 70 (0.6%) |
| 45 to 59 Minutes | 522 (4.4%) | 472 (4.3%) |
| 60 to 89 Minutes | 869 (7.3%) | 227 (2.1%) |
| 90 or more Minutes | 404 (3.4%) | 95 (0.9%) |
Time of Departure to Work by Sex in Palm Beach Gardens
The most frequent times of departure to work in Palm Beach Gardens are 7:00 AM to 7:29 AM (2,077, 17.6%) for males and 8:00 AM to 8:29 AM (1,925, 17.7%) for females.
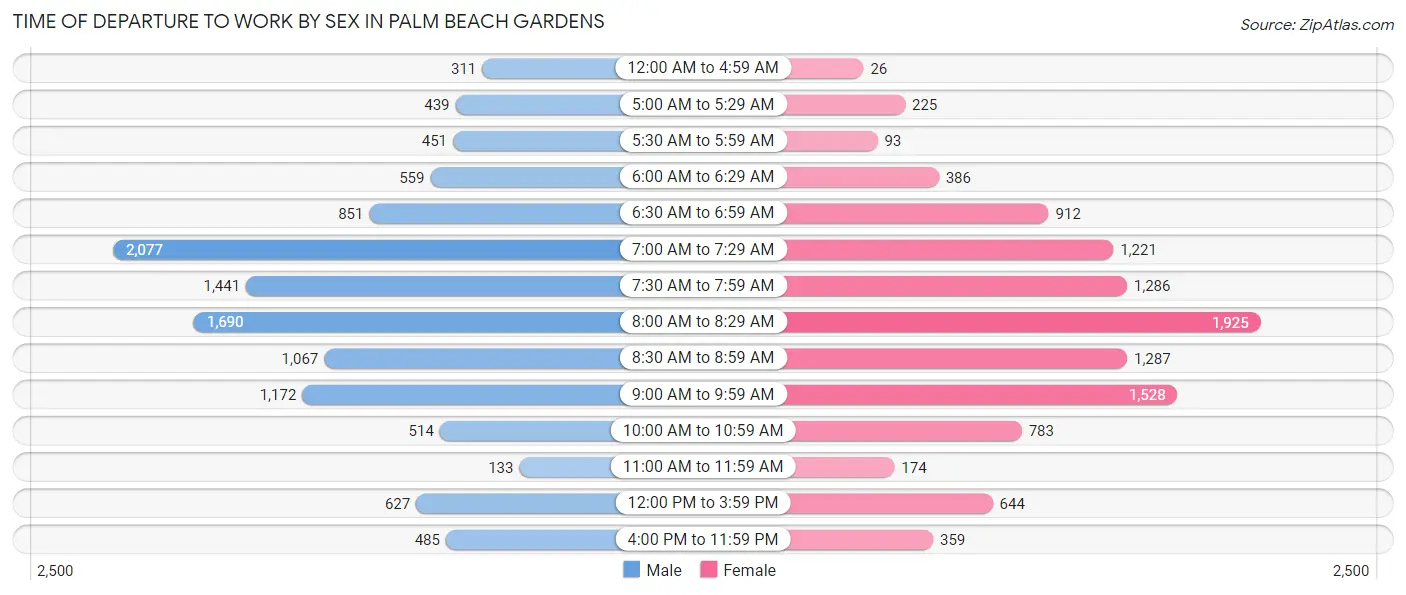
| Time of Departure | Male | Female |
| 12:00 AM to 4:59 AM | 311 (2.6%) | 26 (0.2%) |
| 5:00 AM to 5:29 AM | 439 (3.7%) | 225 (2.1%) |
| 5:30 AM to 5:59 AM | 451 (3.8%) | 93 (0.9%) |
| 6:00 AM to 6:29 AM | 559 (4.7%) | 386 (3.6%) |
| 6:30 AM to 6:59 AM | 851 (7.2%) | 912 (8.4%) |
| 7:00 AM to 7:29 AM | 2,077 (17.6%) | 1,221 (11.3%) |
| 7:30 AM to 7:59 AM | 1,441 (12.2%) | 1,286 (11.8%) |
| 8:00 AM to 8:29 AM | 1,690 (14.3%) | 1,925 (17.7%) |
| 8:30 AM to 8:59 AM | 1,067 (9.0%) | 1,287 (11.9%) |
| 9:00 AM to 9:59 AM | 1,172 (9.9%) | 1,528 (14.1%) |
| 10:00 AM to 10:59 AM | 514 (4.3%) | 783 (7.2%) |
| 11:00 AM to 11:59 AM | 133 (1.1%) | 174 (1.6%) |
| 12:00 PM to 3:59 PM | 627 (5.3%) | 644 (5.9%) |
| 4:00 PM to 11:59 PM | 485 (4.1%) | 359 (3.3%) |
| Total | 11,817 (100.0%) | 10,849 (100.0%) |
Housing Occupancy in Palm Beach Gardens
Occupancy by Ownership in Palm Beach Gardens
Of the total 25,959 dwellings in Palm Beach Gardens, owner-occupied units account for 19,114 (73.6%), while renter-occupied units make up 6,845 (26.4%).
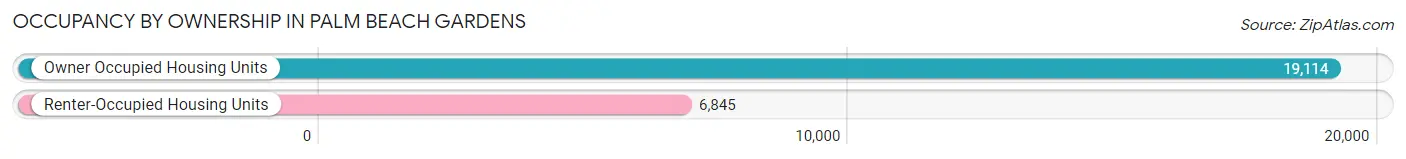
| Occupancy | # Housing Units | % Housing Units |
| Owner Occupied Housing Units | 19,114 | 73.6% |
| Renter-Occupied Housing Units | 6,845 | 26.4% |
| Total Occupied Housing Units | 25,959 | 100.0% |
Occupancy by Household Size in Palm Beach Gardens
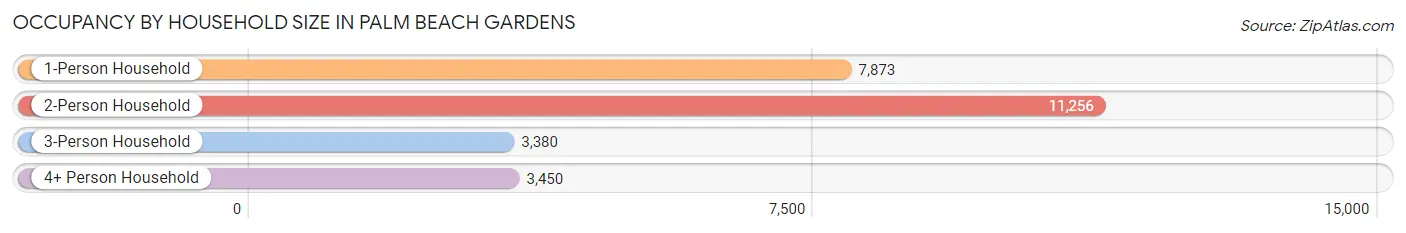
| Household Size | # Housing Units | % Housing Units |
| 1-Person Household | 7,873 | 30.3% |
| 2-Person Household | 11,256 | 43.4% |
| 3-Person Household | 3,380 | 13.0% |
| 4+ Person Household | 3,450 | 13.3% |
| Total Housing Units | 25,959 | 100.0% |
Occupancy by Ownership by Household Size in Palm Beach Gardens
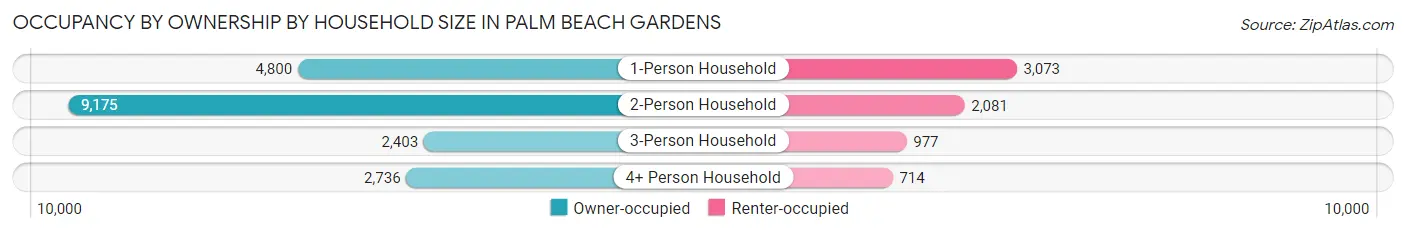
| Household Size | Owner-occupied | Renter-occupied |
| 1-Person Household | 4,800 (61.0%) | 3,073 (39.0%) |
| 2-Person Household | 9,175 (81.5%) | 2,081 (18.5%) |
| 3-Person Household | 2,403 (71.1%) | 977 (28.9%) |
| 4+ Person Household | 2,736 (79.3%) | 714 (20.7%) |
| Total Housing Units | 19,114 (73.6%) | 6,845 (26.4%) |
Occupancy by Educational Attainment in Palm Beach Gardens
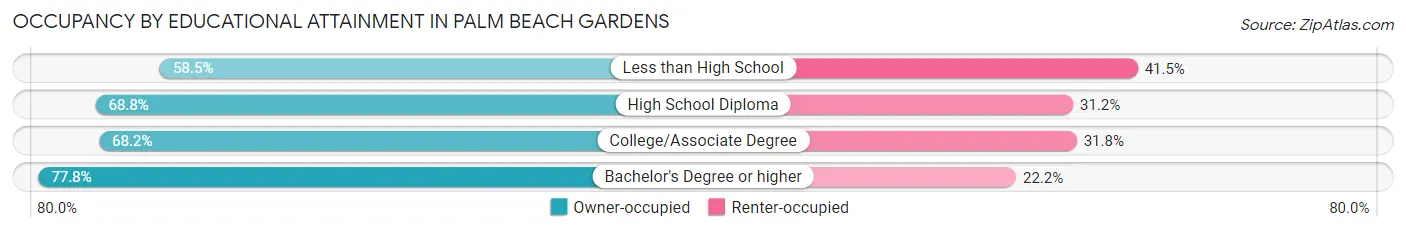
| Household Size | Owner-occupied | Renter-occupied |
| Less than High School | 395 (58.5%) | 280 (41.5%) |
| High School Diploma | 2,282 (68.8%) | 1,037 (31.2%) |
| College/Associate Degree | 4,638 (68.2%) | 2,164 (31.8%) |
| Bachelor's Degree or higher | 11,799 (77.8%) | 3,364 (22.2%) |
Occupancy by Age of Householder in Palm Beach Gardens
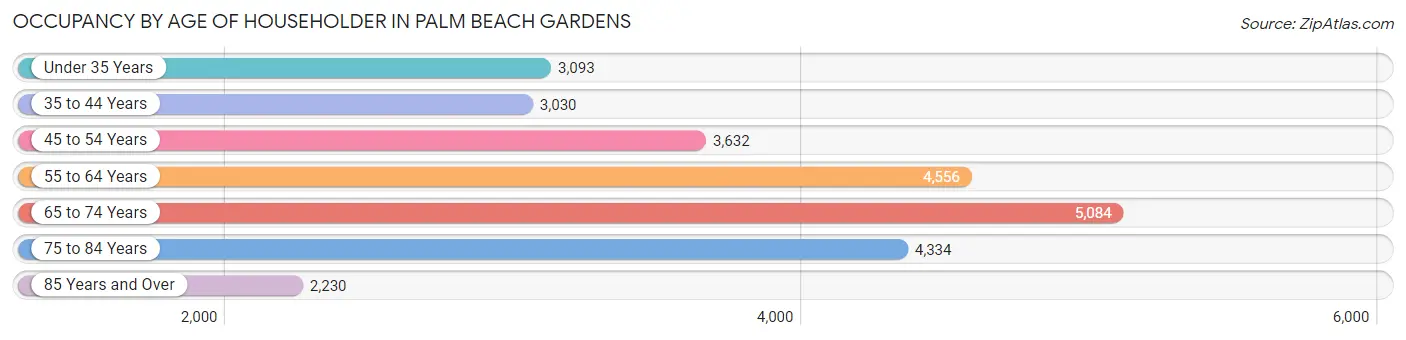
| Age Bracket | # Households | % Households |
| Under 35 Years | 3,093 | 11.9% |
| 35 to 44 Years | 3,030 | 11.7% |
| 45 to 54 Years | 3,632 | 14.0% |
| 55 to 64 Years | 4,556 | 17.5% |
| 65 to 74 Years | 5,084 | 19.6% |
| 75 to 84 Years | 4,334 | 16.7% |
| 85 Years and Over | 2,230 | 8.6% |
| Total | 25,959 | 100.0% |
Housing Finances in Palm Beach Gardens
Median Income by Occupancy in Palm Beach Gardens
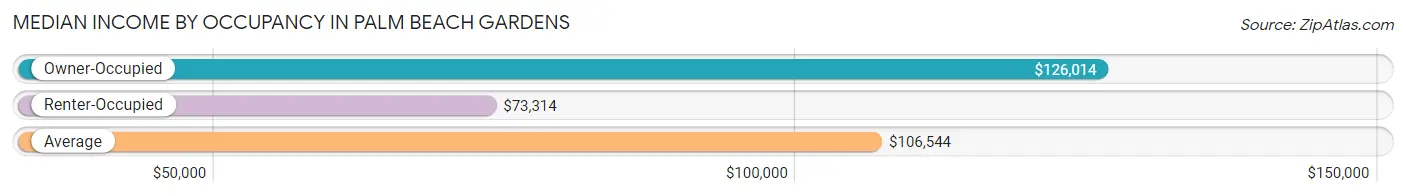
| Occupancy Type | # Households | Median Income |
| Owner-Occupied | 19,114 (73.6%) | $126,014 |
| Renter-Occupied | 6,845 (26.4%) | $73,314 |
| Average | 25,959 (100.0%) | $106,544 |
Occupancy by Householder Income Bracket in Palm Beach Gardens
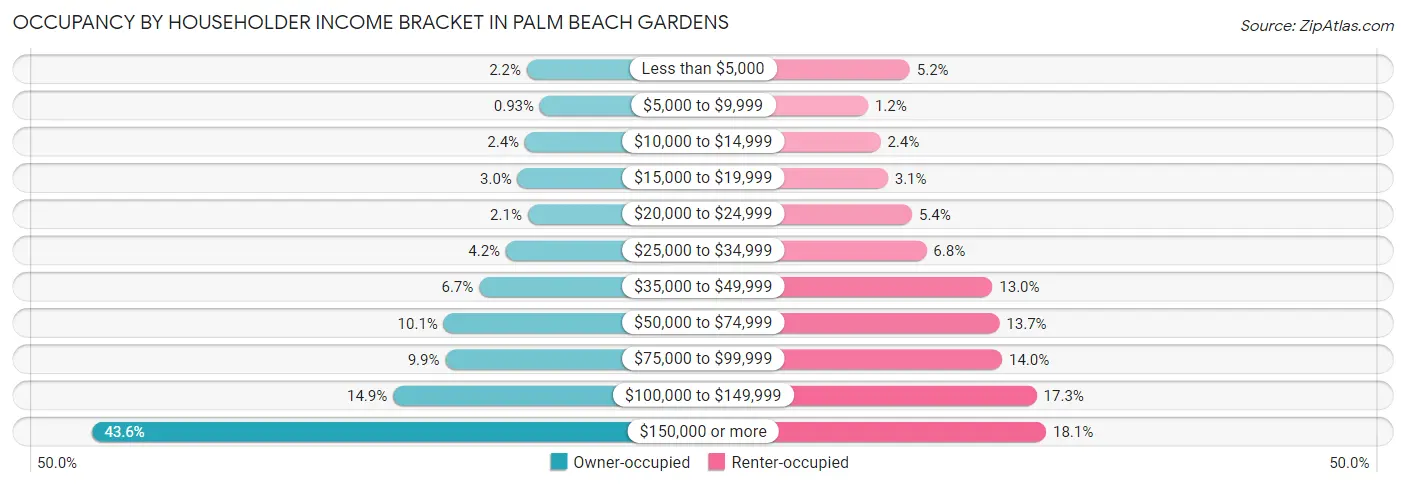
| Income Bracket | Owner-occupied | Renter-occupied |
| Less than $5,000 | 414 (2.2%) | 354 (5.2%) |
| $5,000 to $9,999 | 178 (0.9%) | 81 (1.2%) |
| $10,000 to $14,999 | 450 (2.4%) | 162 (2.4%) |
| $15,000 to $19,999 | 581 (3.0%) | 210 (3.1%) |
| $20,000 to $24,999 | 398 (2.1%) | 368 (5.4%) |
| $25,000 to $34,999 | 795 (4.2%) | 462 (6.8%) |
| $35,000 to $49,999 | 1,283 (6.7%) | 892 (13.0%) |
| $50,000 to $74,999 | 1,929 (10.1%) | 938 (13.7%) |
| $75,000 to $99,999 | 1,898 (9.9%) | 955 (14.0%) |
| $100,000 to $149,999 | 2,849 (14.9%) | 1,181 (17.2%) |
| $150,000 or more | 8,339 (43.6%) | 1,242 (18.1%) |
| Total | 19,114 (100.0%) | 6,845 (100.0%) |
Monthly Housing Cost Tiers in Palm Beach Gardens
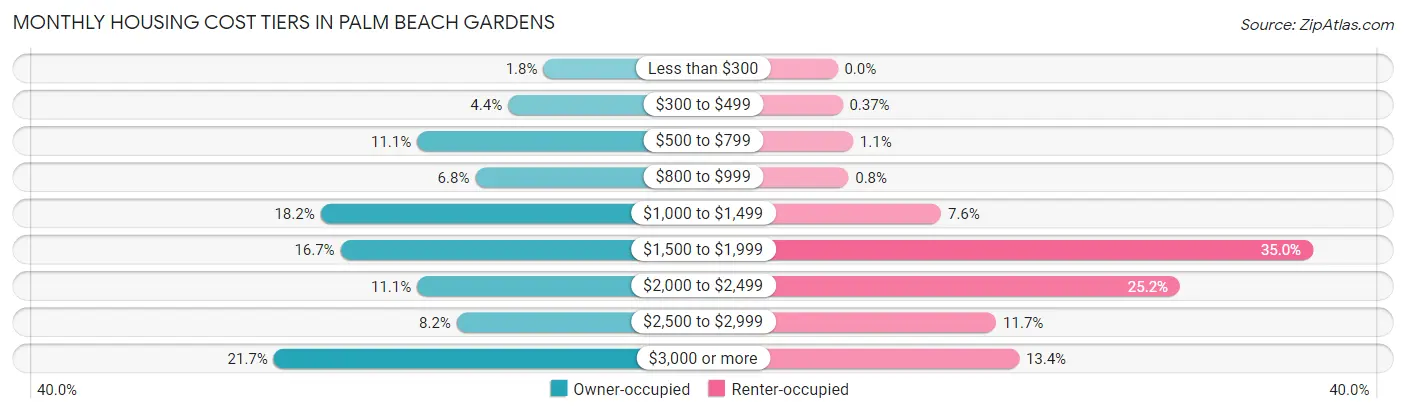
| Monthly Cost | Owner-occupied | Renter-occupied |
| Less than $300 | 345 (1.8%) | 0 (0.0%) |
| $300 to $499 | 841 (4.4%) | 25 (0.4%) |
| $500 to $799 | 2,121 (11.1%) | 78 (1.1%) |
| $800 to $999 | 1,301 (6.8%) | 55 (0.8%) |
| $1,000 to $1,499 | 3,481 (18.2%) | 522 (7.6%) |
| $1,500 to $1,999 | 3,200 (16.7%) | 2,397 (35.0%) |
| $2,000 to $2,499 | 2,122 (11.1%) | 1,726 (25.2%) |
| $2,500 to $2,999 | 1,563 (8.2%) | 800 (11.7%) |
| $3,000 or more | 4,140 (21.7%) | 915 (13.4%) |
| Total | 19,114 (100.0%) | 6,845 (100.0%) |
Physical Housing Characteristics in Palm Beach Gardens
Housing Structures in Palm Beach Gardens
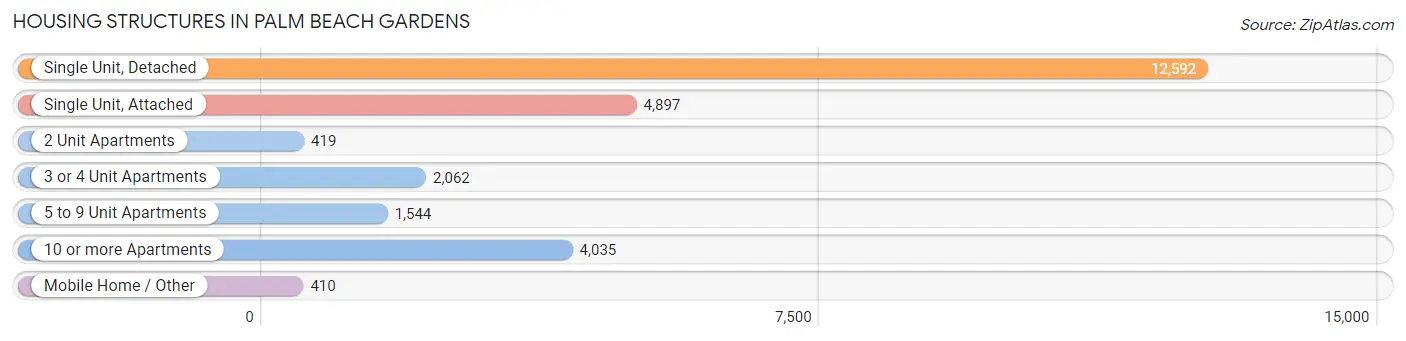
| Structure Type | # Housing Units | % Housing Units |
| Single Unit, Detached | 12,592 | 48.5% |
| Single Unit, Attached | 4,897 | 18.9% |
| 2 Unit Apartments | 419 | 1.6% |
| 3 or 4 Unit Apartments | 2,062 | 7.9% |
| 5 to 9 Unit Apartments | 1,544 | 5.9% |
| 10 or more Apartments | 4,035 | 15.5% |
| Mobile Home / Other | 410 | 1.6% |
| Total | 25,959 | 100.0% |
Housing Structures by Occupancy in Palm Beach Gardens
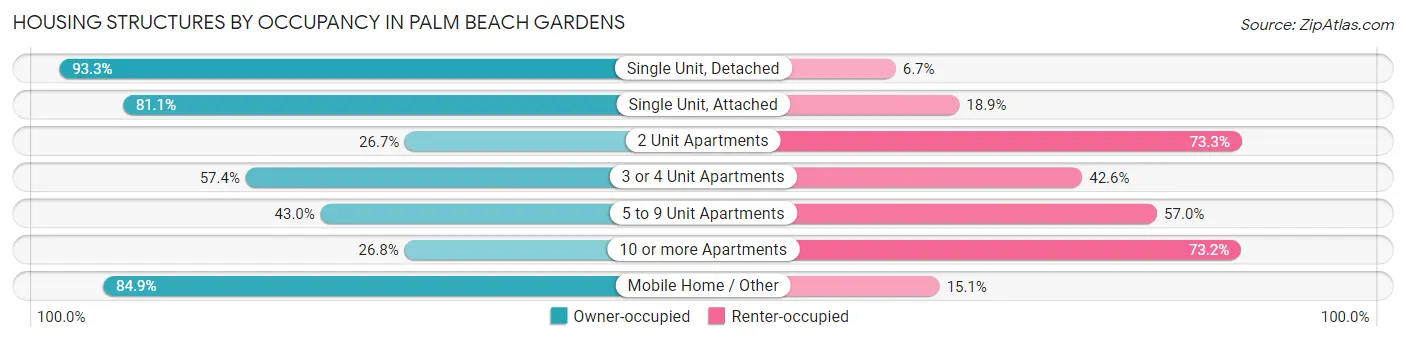
| Structure Type | Owner-occupied | Renter-occupied |
| Single Unit, Detached | 11,752 (93.3%) | 840 (6.7%) |
| Single Unit, Attached | 3,971 (81.1%) | 926 (18.9%) |
| 2 Unit Apartments | 112 (26.7%) | 307 (73.3%) |
| 3 or 4 Unit Apartments | 1,184 (57.4%) | 878 (42.6%) |
| 5 to 9 Unit Apartments | 664 (43.0%) | 880 (57.0%) |
| 10 or more Apartments | 1,083 (26.8%) | 2,952 (73.2%) |
| Mobile Home / Other | 348 (84.9%) | 62 (15.1%) |
| Total | 19,114 (73.6%) | 6,845 (26.4%) |
Housing Structures by Number of Rooms in Palm Beach Gardens
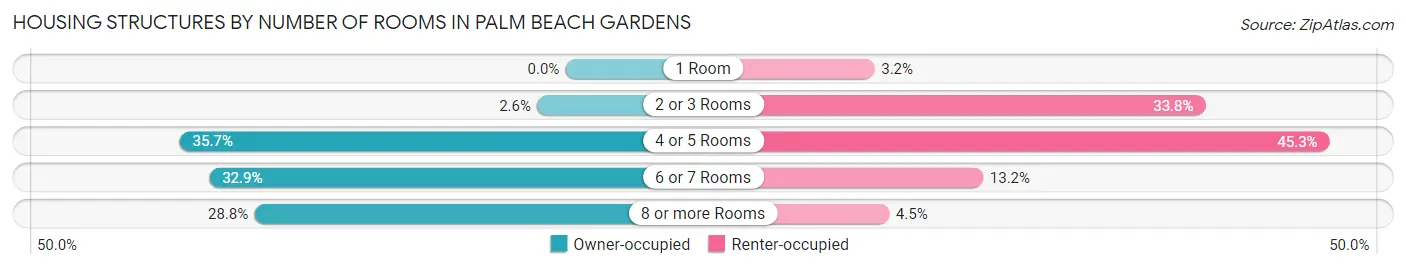
| Number of Rooms | Owner-occupied | Renter-occupied |
| 1 Room | 0 (0.0%) | 218 (3.2%) |
| 2 or 3 Rooms | 503 (2.6%) | 2,313 (33.8%) |
| 4 or 5 Rooms | 6,817 (35.7%) | 3,099 (45.3%) |
| 6 or 7 Rooms | 6,293 (32.9%) | 905 (13.2%) |
| 8 or more Rooms | 5,501 (28.8%) | 310 (4.5%) |
| Total | 19,114 (100.0%) | 6,845 (100.0%) |
Housing Structure by Heating Type in Palm Beach Gardens
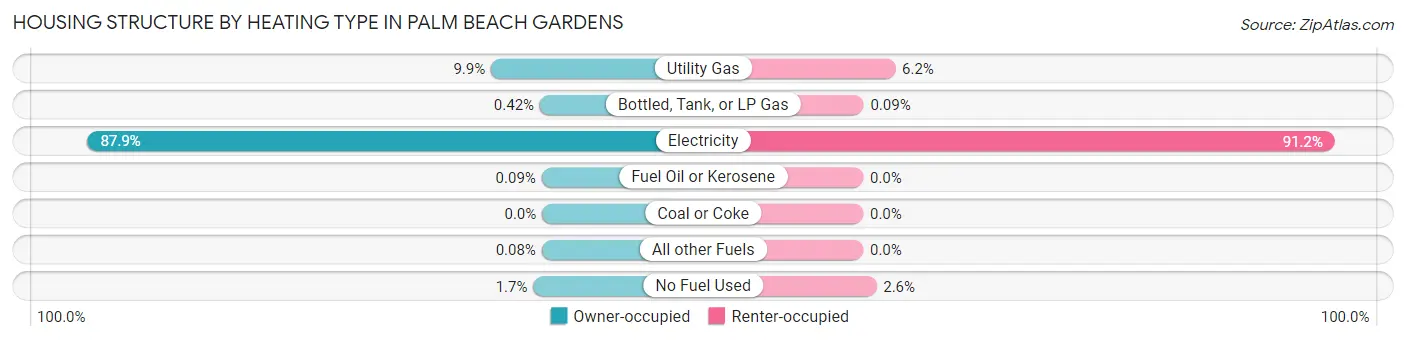
| Heating Type | Owner-occupied | Renter-occupied |
| Utility Gas | 1,884 (9.9%) | 424 (6.2%) |
| Bottled, Tank, or LP Gas | 81 (0.4%) | 6 (0.1%) |
| Electricity | 16,792 (87.8%) | 6,240 (91.2%) |
| Fuel Oil or Kerosene | 18 (0.1%) | 0 (0.0%) |
| Coal or Coke | 0 (0.0%) | 0 (0.0%) |
| All other Fuels | 15 (0.1%) | 0 (0.0%) |
| No Fuel Used | 324 (1.7%) | 175 (2.6%) |
| Total | 19,114 (100.0%) | 6,845 (100.0%) |
Household Vehicle Usage in Palm Beach Gardens
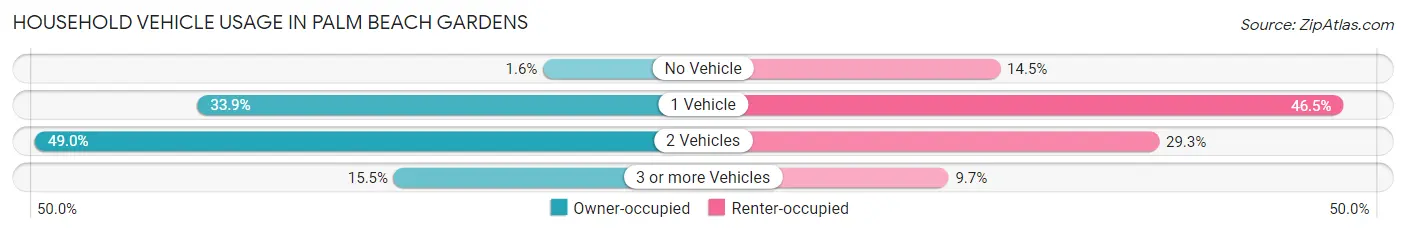
| Vehicles per Household | Owner-occupied | Renter-occupied |
| No Vehicle | 304 (1.6%) | 992 (14.5%) |
| 1 Vehicle | 6,474 (33.9%) | 3,184 (46.5%) |
| 2 Vehicles | 9,368 (49.0%) | 2,007 (29.3%) |
| 3 or more Vehicles | 2,968 (15.5%) | 662 (9.7%) |
| Total | 19,114 (100.0%) | 6,845 (100.0%) |
Real Estate & Mortgages in Palm Beach Gardens
Real Estate and Mortgage Overview in Palm Beach Gardens
| Characteristic | Without Mortgage | With Mortgage |
| Housing Units | 9,184 | 9,930 |
| Median Property Value | $517,600 | $463,500 |
| Median Household Income | $112,500 | $4,687 |
| Monthly Housing Costs | $1,077 | $3,495 |
| Real Estate Taxes | $5,587 | $286 |
Property Value by Mortgage Status in Palm Beach Gardens
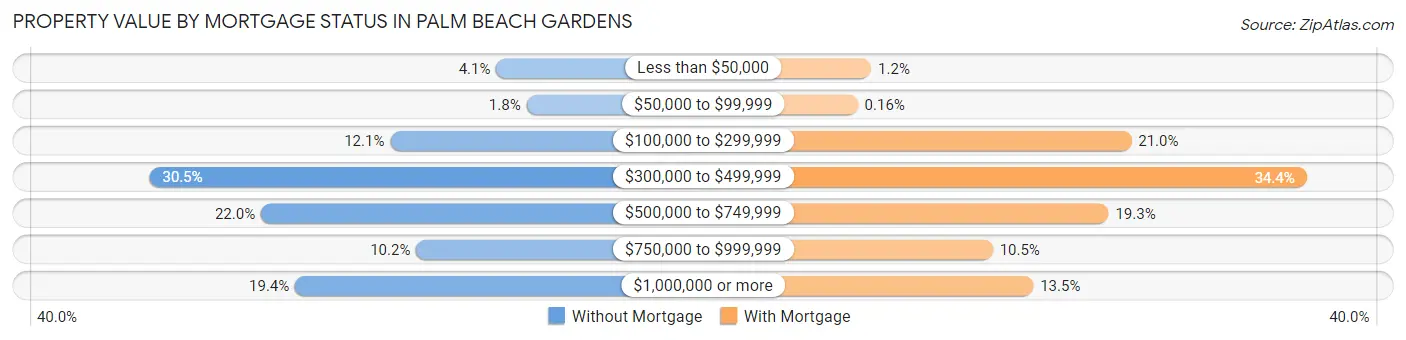
| Property Value | Without Mortgage | With Mortgage |
| Less than $50,000 | 373 (4.1%) | 118 (1.2%) |
| $50,000 to $99,999 | 162 (1.8%) | 16 (0.2%) |
| $100,000 to $299,999 | 1,115 (12.1%) | 2,086 (21.0%) |
| $300,000 to $499,999 | 2,800 (30.5%) | 3,413 (34.4%) |
| $500,000 to $749,999 | 2,020 (22.0%) | 1,914 (19.3%) |
| $750,000 to $999,999 | 933 (10.2%) | 1,038 (10.4%) |
| $1,000,000 or more | 1,781 (19.4%) | 1,345 (13.5%) |
| Total | 9,184 (100.0%) | 9,930 (100.0%) |
Household Income by Mortgage Status in Palm Beach Gardens
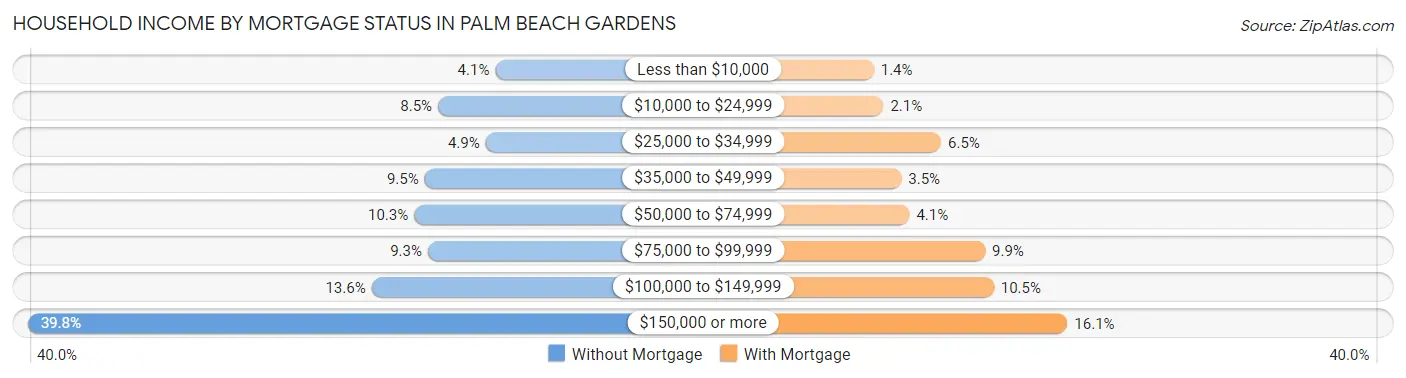
| Household Income | Without Mortgage | With Mortgage |
| Less than $10,000 | 380 (4.1%) | 138 (1.4%) |
| $10,000 to $24,999 | 782 (8.5%) | 212 (2.1%) |
| $25,000 to $34,999 | 448 (4.9%) | 647 (6.5%) |
| $35,000 to $49,999 | 875 (9.5%) | 347 (3.5%) |
| $50,000 to $74,999 | 949 (10.3%) | 408 (4.1%) |
| $75,000 to $99,999 | 852 (9.3%) | 980 (9.9%) |
| $100,000 to $149,999 | 1,246 (13.6%) | 1,046 (10.5%) |
| $150,000 or more | 3,652 (39.8%) | 1,603 (16.1%) |
| Total | 9,184 (100.0%) | 9,930 (100.0%) |
Property Value to Household Income Ratio in Palm Beach Gardens
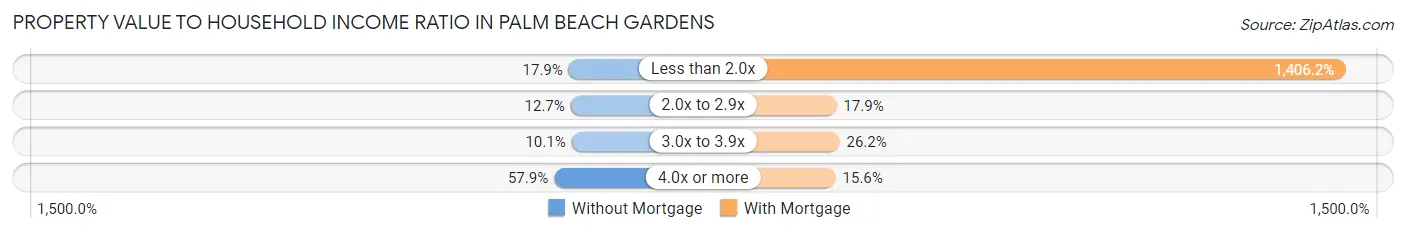
| Value-to-Income Ratio | Without Mortgage | With Mortgage |
| Less than 2.0x | 1,648 (17.9%) | 139,634 (1,406.2%) |
| 2.0x to 2.9x | 1,162 (12.7%) | 1,774 (17.9%) |
| 3.0x to 3.9x | 929 (10.1%) | 2,604 (26.2%) |
| 4.0x or more | 5,321 (57.9%) | 1,547 (15.6%) |
| Total | 9,184 (100.0%) | 9,930 (100.0%) |
Real Estate Taxes by Mortgage Status in Palm Beach Gardens
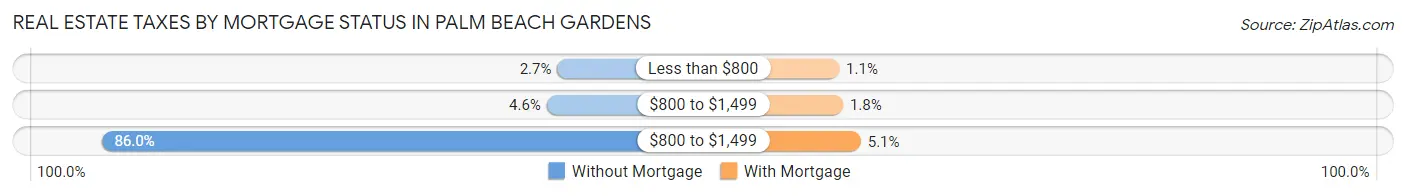
| Property Taxes | Without Mortgage | With Mortgage |
| Less than $800 | 248 (2.7%) | 111 (1.1%) |
| $800 to $1,499 | 426 (4.6%) | 180 (1.8%) |
| $800 to $1,499 | 7,895 (86.0%) | 503 (5.1%) |
| Total | 9,184 (100.0%) | 9,930 (100.0%) |
Health & Disability in Palm Beach Gardens
Health Insurance Coverage by Age in Palm Beach Gardens
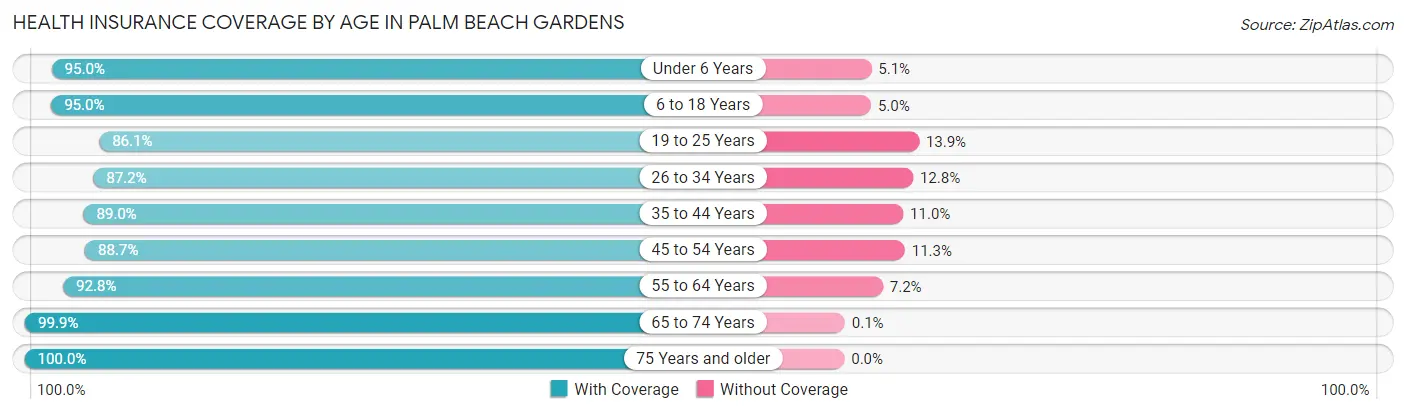
| Age Bracket | With Coverage | Without Coverage |
| Under 6 Years | 2,859 (95.0%) | 152 (5.1%) |
| 6 to 18 Years | 7,588 (95.0%) | 397 (5.0%) |
| 19 to 25 Years | 2,671 (86.1%) | 432 (13.9%) |
| 26 to 34 Years | 4,756 (87.2%) | 699 (12.8%) |
| 35 to 44 Years | 5,352 (89.0%) | 660 (11.0%) |
| 45 to 54 Years | 6,177 (88.7%) | 785 (11.3%) |
| 55 to 64 Years | 7,392 (92.8%) | 573 (7.2%) |
| 65 to 74 Years | 7,993 (99.9%) | 8 (0.1%) |
| 75 Years and older | 10,112 (100.0%) | 0 (0.0%) |
| Total | 54,900 (93.7%) | 3,706 (6.3%) |
Health Insurance Coverage by Citizenship Status in Palm Beach Gardens
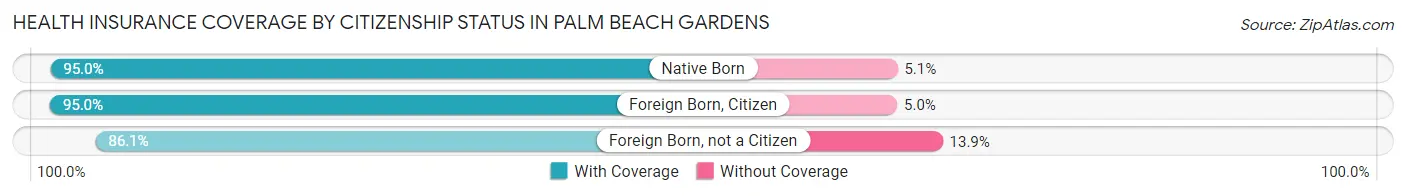
| Citizenship Status | With Coverage | Without Coverage |
| Native Born | 2,859 (95.0%) | 152 (5.1%) |
| Foreign Born, Citizen | 7,588 (95.0%) | 397 (5.0%) |
| Foreign Born, not a Citizen | 2,671 (86.1%) | 432 (13.9%) |
Health Insurance Coverage by Household Income in Palm Beach Gardens
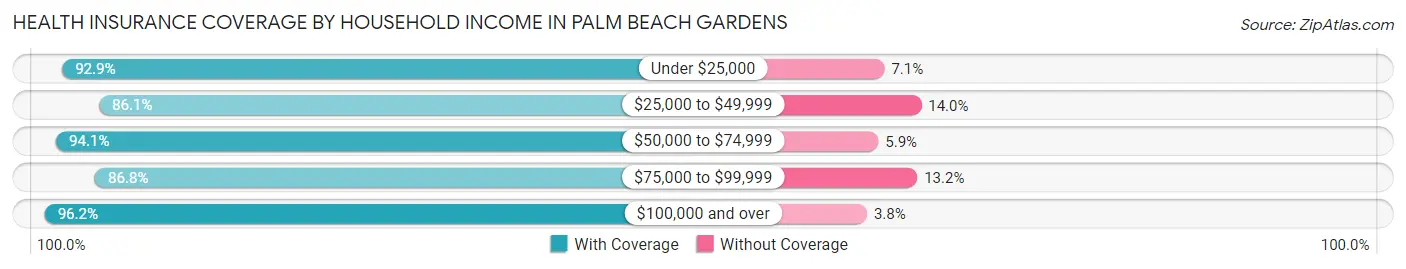
| Household Income | With Coverage | Without Coverage |
| Under $25,000 | 4,381 (92.9%) | 333 (7.1%) |
| $25,000 to $49,999 | 4,972 (86.1%) | 806 (14.0%) |
| $50,000 to $74,999 | 4,693 (94.1%) | 295 (5.9%) |
| $75,000 to $99,999 | 5,706 (86.8%) | 868 (13.2%) |
| $100,000 and over | 35,078 (96.2%) | 1,378 (3.8%) |
Public vs Private Health Insurance Coverage by Age in Palm Beach Gardens
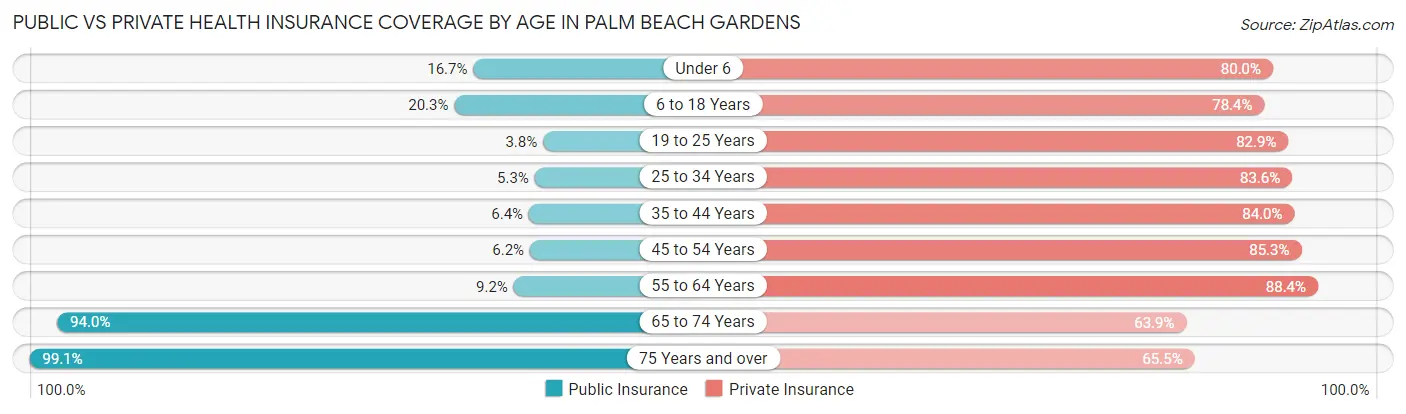
| Age Bracket | Public Insurance | Private Insurance |
| Under 6 | 503 (16.7%) | 2,409 (80.0%) |
| 6 to 18 Years | 1,617 (20.3%) | 6,262 (78.4%) |
| 19 to 25 Years | 117 (3.8%) | 2,571 (82.9%) |
| 25 to 34 Years | 290 (5.3%) | 4,558 (83.6%) |
| 35 to 44 Years | 384 (6.4%) | 5,050 (84.0%) |
| 45 to 54 Years | 432 (6.2%) | 5,937 (85.3%) |
| 55 to 64 Years | 734 (9.2%) | 7,038 (88.4%) |
| 65 to 74 Years | 7,518 (94.0%) | 5,116 (63.9%) |
| 75 Years and over | 10,022 (99.1%) | 6,619 (65.5%) |
| Total | 21,617 (36.9%) | 45,560 (77.7%) |
Disability Status by Sex by Age in Palm Beach Gardens
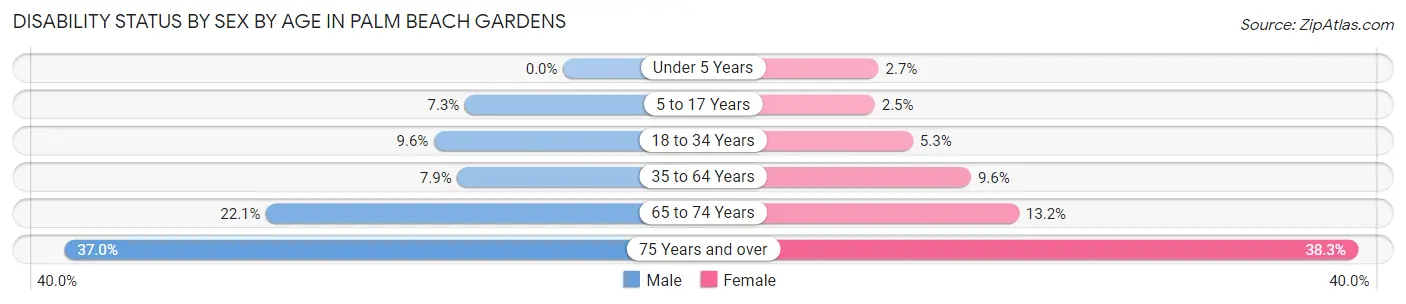
| Age Bracket | Male | Female |
| Under 5 Years | 0 (0.0%) | 36 (2.7%) |
| 5 to 17 Years | 256 (7.3%) | 105 (2.5%) |
| 18 to 34 Years | 441 (9.6%) | 242 (5.3%) |
| 35 to 64 Years | 799 (7.9%) | 1,034 (9.6%) |
| 65 to 74 Years | 765 (22.1%) | 596 (13.2%) |
| 75 Years and over | 1,771 (37.0%) | 2,041 (38.3%) |
Disability Class by Sex by Age in Palm Beach Gardens
Disability Class: Hearing Difficulty
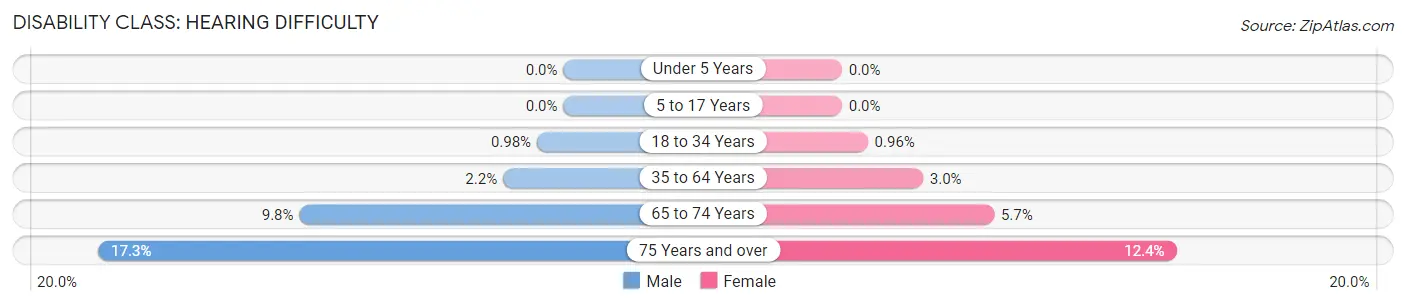
| Age Bracket | Male | Female |
| Under 5 Years | 0 (0.0%) | 0 (0.0%) |
| 5 to 17 Years | 0 (0.0%) | 0 (0.0%) |
| 18 to 34 Years | 45 (1.0%) | 44 (1.0%) |
| 35 to 64 Years | 228 (2.2%) | 324 (3.0%) |
| 65 to 74 Years | 340 (9.8%) | 256 (5.7%) |
| 75 Years and over | 826 (17.3%) | 662 (12.4%) |
Disability Class: Vision Difficulty
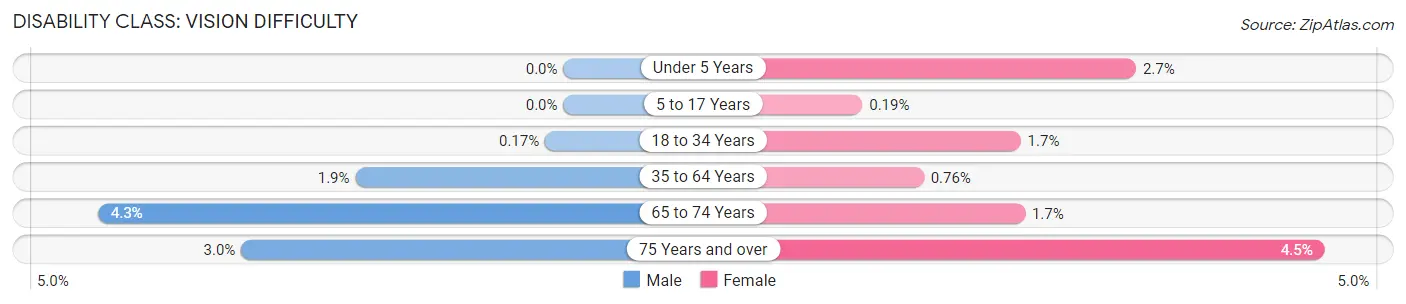
| Age Bracket | Male | Female |
| Under 5 Years | 0 (0.0%) | 36 (2.7%) |
| 5 to 17 Years | 0 (0.0%) | 8 (0.2%) |
| 18 to 34 Years | 8 (0.2%) | 76 (1.7%) |
| 35 to 64 Years | 196 (1.9%) | 82 (0.8%) |
| 65 to 74 Years | 150 (4.3%) | 77 (1.7%) |
| 75 Years and over | 143 (3.0%) | 239 (4.5%) |
Disability Class: Cognitive Difficulty
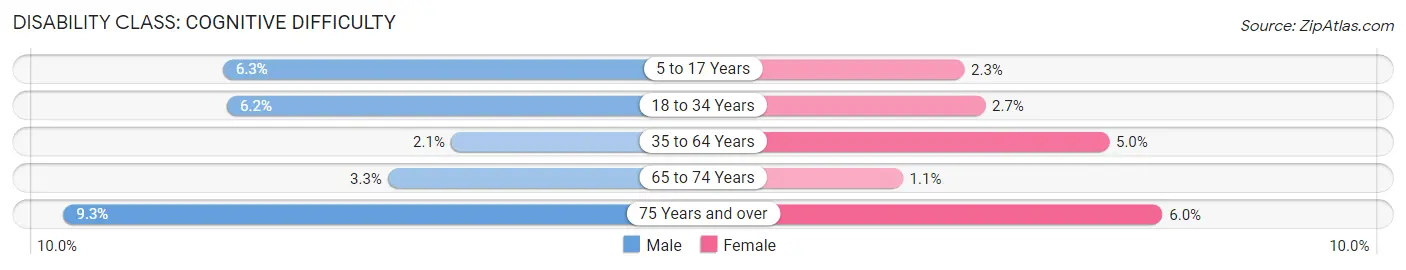
| Age Bracket | Male | Female |
| 5 to 17 Years | 222 (6.3%) | 97 (2.3%) |
| 18 to 34 Years | 287 (6.2%) | 122 (2.7%) |
| 35 to 64 Years | 212 (2.1%) | 535 (5.0%) |
| 65 to 74 Years | 113 (3.3%) | 51 (1.1%) |
| 75 Years and over | 444 (9.3%) | 317 (5.9%) |
Disability Class: Ambulatory Difficulty
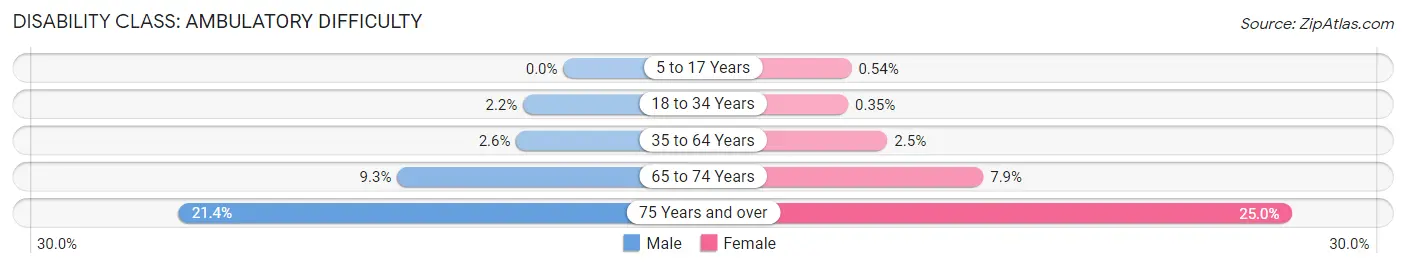
| Age Bracket | Male | Female |
| 5 to 17 Years | 0 (0.0%) | 23 (0.5%) |
| 18 to 34 Years | 103 (2.2%) | 16 (0.4%) |
| 35 to 64 Years | 266 (2.6%) | 274 (2.5%) |
| 65 to 74 Years | 321 (9.2%) | 357 (7.9%) |
| 75 Years and over | 1,024 (21.4%) | 1,334 (25.0%) |
Disability Class: Self-Care Difficulty
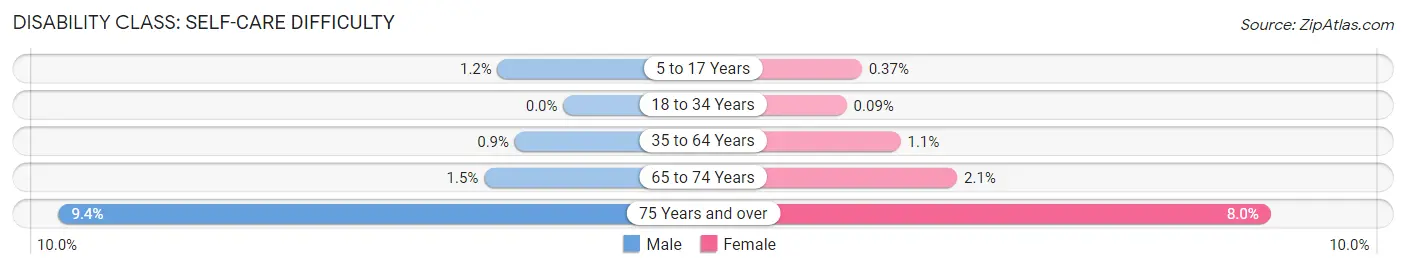
| Age Bracket | Male | Female |
| 5 to 17 Years | 43 (1.2%) | 16 (0.4%) |
| 18 to 34 Years | 0 (0.0%) | 4 (0.1%) |
| 35 to 64 Years | 91 (0.9%) | 117 (1.1%) |
| 65 to 74 Years | 51 (1.5%) | 97 (2.1%) |
| 75 Years and over | 448 (9.4%) | 424 (8.0%) |
Technology Access in Palm Beach Gardens
Computing Device Access in Palm Beach Gardens
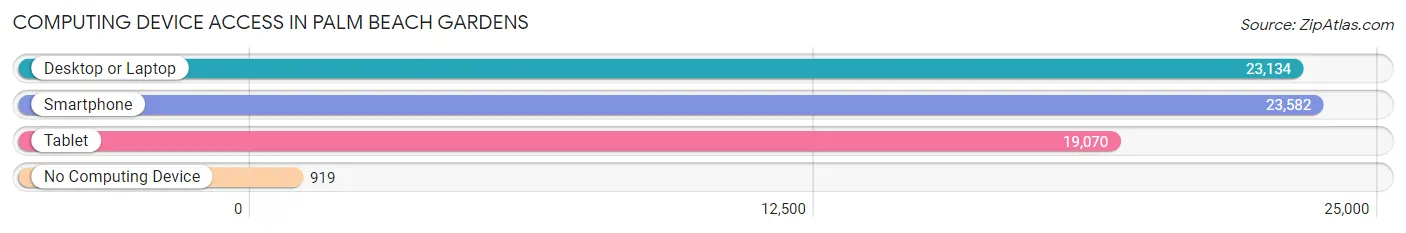
| Device Type | # Households | % Households |
| Desktop or Laptop | 23,134 | 89.1% |
| Smartphone | 23,582 | 90.8% |
| Tablet | 19,070 | 73.5% |
| No Computing Device | 919 | 3.5% |
| Total | 25,959 | 100.0% |
Internet Access in Palm Beach Gardens
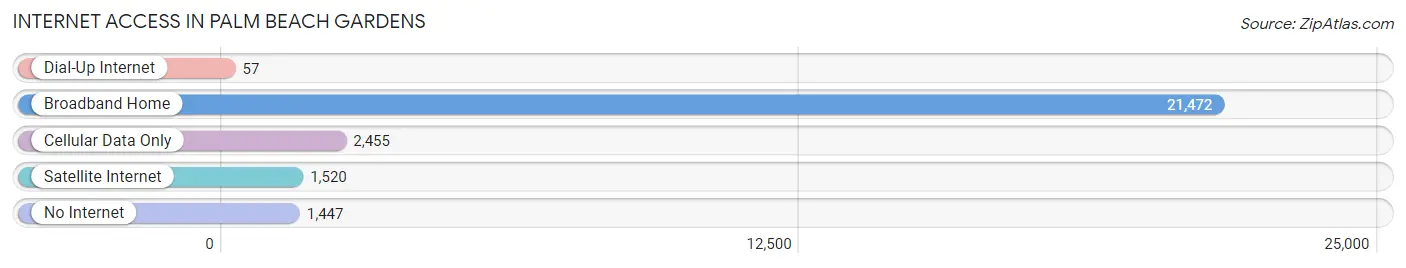
| Internet Type | # Households | % Households |
| Dial-Up Internet | 57 | 0.2% |
| Broadband Home | 21,472 | 82.7% |
| Cellular Data Only | 2,455 | 9.5% |
| Satellite Internet | 1,520 | 5.9% |
| No Internet | 1,447 | 5.6% |
| Total | 25,959 | 100.0% |
Palm Beach Gardens Summary
Palm Beach Gardens is a city located in Palm Beach County, Florida. It is located in the northern part of the county, just north of West Palm Beach. The city was incorporated in 1959 and has a population of 48,452 as of the 2010 census.
Geography
Palm Beach Gardens is located in the northern part of Palm Beach County, Florida. It is bordered by the cities of West Palm Beach to the south, Jupiter to the north, and Lake Park to the east. The city is located on the Atlantic Coastal Ridge, which is a series of low hills that run along the eastern coast of Florida. The city is located on the Intracoastal Waterway, which is a navigable waterway that runs along the eastern coast of the United States. The city is also located near the Loxahatchee National Wildlife Refuge, which is a protected area of wetlands and wildlife habitat.
The city has a total area of 24.2 square miles, of which 22.7 square miles is land and 1.5 square miles is water. The city is located at an elevation of 24 feet above sea level.
History
Palm Beach Gardens was first settled in the late 1800s by settlers from the Bahamas. The area was originally known as the "Gardens" because of the lush vegetation and tropical climate. In 1959, the city was incorporated and the name was changed to Palm Beach Gardens.
The city grew rapidly in the 1960s and 1970s, and by the 1980s it had become a popular destination for retirees and vacationers. The city has continued to grow and develop over the years, and today it is a thriving city with a diverse population and a strong economy.
Economy
Palm Beach Gardens is home to a diverse economy. The city is home to a number of corporate headquarters, including Office Depot, PGA of America, and the Professional Golfers Association of America. The city is also home to a number of retail stores, restaurants, and other businesses.
The city is also home to a number of medical facilities, including the Palm Beach Gardens Medical Center and the Palm Beach Gardens Outpatient Surgery Center. The city is also home to a number of educational institutions, including Palm Beach State College and the University of Florida.
Demographics
As of the 2010 census, the population of Palm Beach Gardens was 48,452. The racial makeup of the city was 79.2% White, 8.3% African American, 0.3% Native American, 4.2% Asian, 0.1% Pacific Islander, 4.7% from other races, and 3.4% from two or more races. Hispanic or Latino of any race were 14.3% of the population.
The median income for a household in the city was $60,945, and the median income for a family was $71,817. The per capita income for the city was $31,945. About 5.2% of families and 7.2% of the population were below the poverty line, including 8.3% of those under age 18 and 5.2% of those age 65 or over.
Palm Beach Gardens is a diverse and vibrant city with a strong economy and a growing population. The city is home to a number of corporate headquarters, retail stores, restaurants, medical facilities, and educational institutions. The city is also home to a number of parks and recreational areas, making it a great place to live and work.
Common Questions
What is Per Capita Income in Palm Beach Gardens?
Per Capita income in Palm Beach Gardens is $79,036.
What is the Median Family Income in Palm Beach Gardens?
Median Family Income in Palm Beach Gardens is $146,667.
What is the Median Household income in Palm Beach Gardens?
Median Household Income in Palm Beach Gardens is $106,544.
What is Income or Wage Gap in Palm Beach Gardens?
Income or Wage Gap in Palm Beach Gardens is 25.0%.
Women in Palm Beach Gardens earn 75.0 cents for every dollar earned by a man.
What is Family Income Deficit in Palm Beach Gardens?
Family Income Deficit in Palm Beach Gardens is $10,049.
Families that are below poverty line in Palm Beach Gardens earn $10,049 less on average than the poverty threshold level.
What is Inequality or Gini Index in Palm Beach Gardens?
Inequality or Gini Index in Palm Beach Gardens is 0.55.
What is the Total Population of Palm Beach Gardens?
Total Population of Palm Beach Gardens is 59,088.
What is the Total Male Population of Palm Beach Gardens?
Total Male Population of Palm Beach Gardens is 27,904.
What is the Total Female Population of Palm Beach Gardens?
Total Female Population of Palm Beach Gardens is 31,184.
What is the Ratio of Males per 100 Females in Palm Beach Gardens?
There are 89.48 Males per 100 Females in Palm Beach Gardens.
What is the Ratio of Females per 100 Males in Palm Beach Gardens?
There are 111.75 Females per 100 Males in Palm Beach Gardens.
What is the Median Population Age in Palm Beach Gardens?
Median Population Age in Palm Beach Gardens is 51.2 Years.
What is the Average Family Size in Palm Beach Gardens
Average Family Size in Palm Beach Gardens is 2.8 People.
What is the Average Household Size in Palm Beach Gardens
Average Household Size in Palm Beach Gardens is 2.2 People.
How Large is the Labor Force in Palm Beach Gardens?
There are 28,475 People in the Labor Forcein in Palm Beach Gardens.
What is the Percentage of People in the Labor Force in Palm Beach Gardens?
56.6% of People are in the Labor Force in Palm Beach Gardens.
What is the Unemployment Rate in Palm Beach Gardens?
Unemployment Rate in Palm Beach Gardens is 3.5%.