New Smyrna Beach, FL Map & Demographics
New Smyrna Beach Map
New Smyrna Beach Overview
$50,902
PER CAPITA INCOME
$86,882
AVG FAMILY INCOME
$73,096
AVG HOUSEHOLD INCOME
17.5%
WAGE / INCOME GAP [ % ]
82.5¢/ $1
WAGE / INCOME GAP [ $ ]
$8,676
FAMILY INCOME DEFICIT
0.48
INEQUALITY / GINI INDEX
30,449
TOTAL POPULATION
15,410
MALE POPULATION
15,039
FEMALE POPULATION
102.47
MALES / 100 FEMALES
97.59
FEMALES / 100 MALES
57.7
MEDIAN AGE
2.5
AVG FAMILY SIZE
2.0
AVG HOUSEHOLD SIZE
12,799
LABOR FORCE [ PEOPLE ]
47.3%
PERCENT IN LABOR FORCE
4.4%
UNEMPLOYMENT RATE
New Smyrna Beach Area Codes
Income in New Smyrna Beach
Income Overview in New Smyrna Beach
Per Capita Income in New Smyrna Beach is $50,902, while median incomes of families and households are $86,882 and $73,096 respectively.
| Characteristic | Number | Measure |
| Per Capita Income | 30,449 | $50,902 |
| Median Family Income | 8,693 | $86,882 |
| Mean Family Income | 8,693 | $121,232 |
| Median Household Income | 14,979 | $73,096 |
| Mean Household Income | 14,979 | $100,760 |
| Income Deficit | 8,693 | $8,676 |
| Wage / Income Gap (%) | 30,449 | 17.52% |
| Wage / Income Gap ($) | 30,449 | 82.48¢ per $1 |
| Gini / Inequality Index | 30,449 | 0.48 |
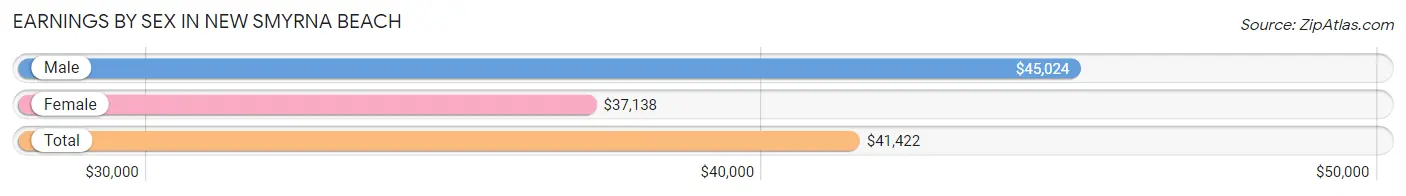
Earnings by Sex in New Smyrna Beach
Average Earnings in New Smyrna Beach are $41,422, $45,024 for men and $37,138 for women, a difference of 17.5%.
| Sex | Number | Average Earnings |
| Male | 7,338 (53.8%) | $45,024 |
| Female | 6,294 (46.2%) | $37,138 |
| Total | 13,632 (100.0%) | $41,422 |
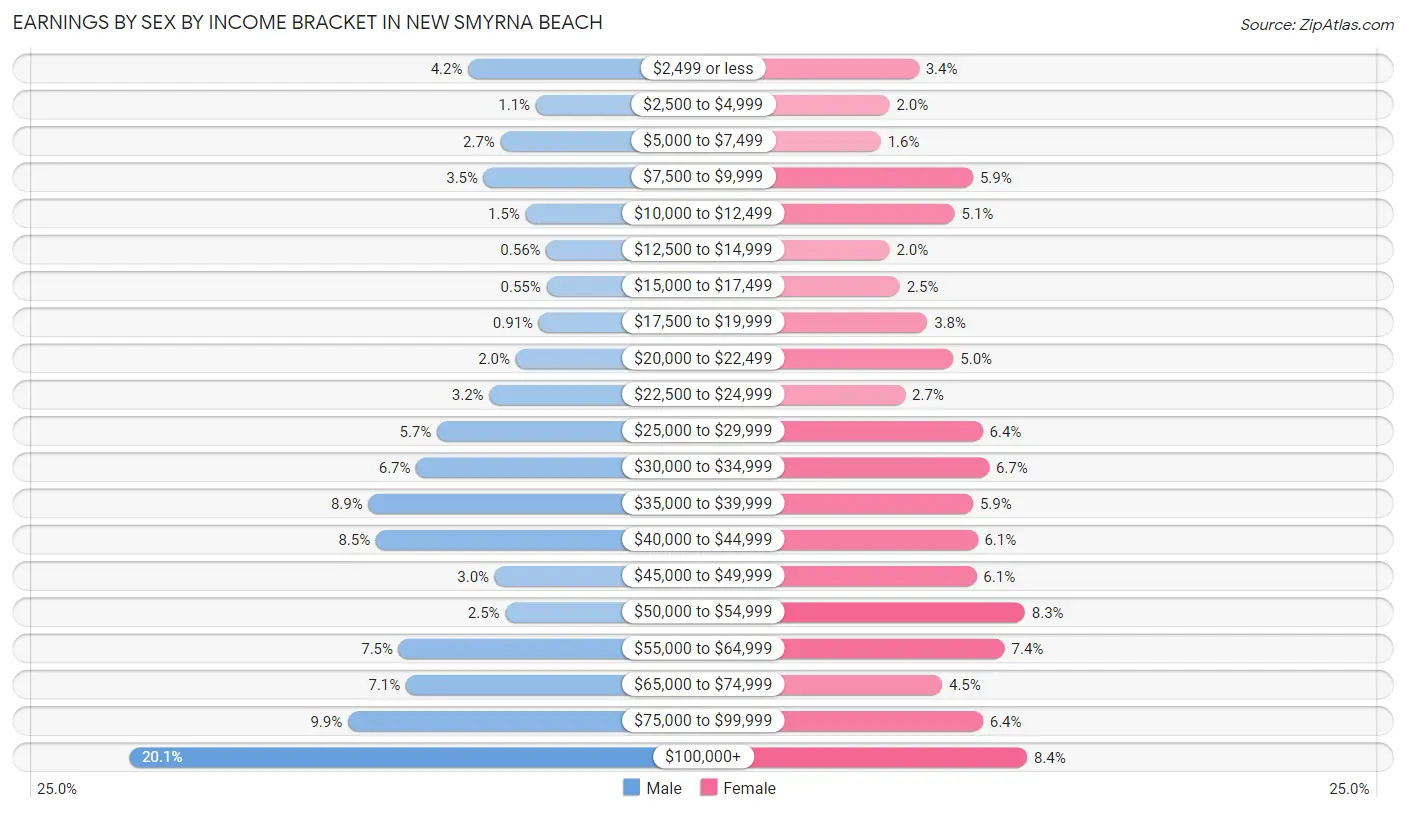
Earnings by Sex by Income Bracket in New Smyrna Beach
The most common earnings brackets in New Smyrna Beach are $100,000+ for men (1,476 | 20.1%) and $100,000+ for women (531 | 8.4%).
| Income | Male | Female |
| $2,499 or less | 310 (4.2%) | 212 (3.4%) |
| $2,500 to $4,999 | 77 (1.1%) | 126 (2.0%) |
| $5,000 to $7,499 | 198 (2.7%) | 100 (1.6%) |
| $7,500 to $9,999 | 256 (3.5%) | 372 (5.9%) |
| $10,000 to $12,499 | 112 (1.5%) | 318 (5.1%) |
| $12,500 to $14,999 | 41 (0.6%) | 126 (2.0%) |
| $15,000 to $17,499 | 40 (0.5%) | 156 (2.5%) |
| $17,500 to $19,999 | 67 (0.9%) | 237 (3.8%) |
| $20,000 to $22,499 | 146 (2.0%) | 314 (5.0%) |
| $22,500 to $24,999 | 237 (3.2%) | 172 (2.7%) |
| $25,000 to $29,999 | 417 (5.7%) | 400 (6.4%) |
| $30,000 to $34,999 | 488 (6.7%) | 419 (6.7%) |
| $35,000 to $39,999 | 652 (8.9%) | 372 (5.9%) |
| $40,000 to $44,999 | 627 (8.5%) | 385 (6.1%) |
| $45,000 to $49,999 | 218 (3.0%) | 382 (6.1%) |
| $50,000 to $54,999 | 182 (2.5%) | 525 (8.3%) |
| $55,000 to $64,999 | 548 (7.5%) | 465 (7.4%) |
| $65,000 to $74,999 | 523 (7.1%) | 281 (4.5%) |
| $75,000 to $99,999 | 723 (9.9%) | 401 (6.4%) |
| $100,000+ | 1,476 (20.1%) | 531 (8.4%) |
| Total | 7,338 (100.0%) | 6,294 (100.0%) |
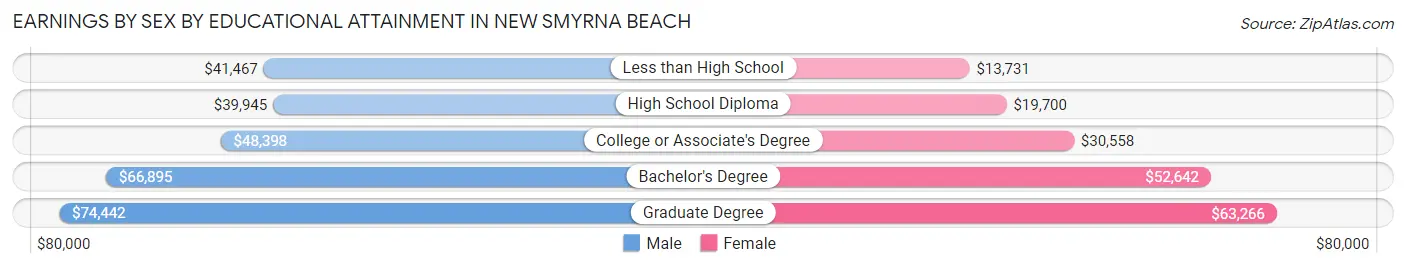
Earnings by Sex by Educational Attainment in New Smyrna Beach
Average earnings in New Smyrna Beach are $49,304 for men and $40,052 for women, a difference of 18.8%. Men with an educational attainment of graduate degree enjoy the highest average annual earnings of $74,442, while those with high school diploma education earn the least with $39,945. Women with an educational attainment of graduate degree earn the most with the average annual earnings of $63,266, while those with less than high school education have the smallest earnings of $13,731.
| Educational Attainment | Male Income | Female Income |
| Less than High School | $41,467 | $13,731 |
| High School Diploma | $39,945 | $19,700 |
| College or Associate's Degree | $48,398 | $30,558 |
| Bachelor's Degree | $66,895 | $52,642 |
| Graduate Degree | $74,442 | $63,266 |
| Total | $49,304 | $40,052 |
Family Income in New Smyrna Beach
Family Income Brackets in New Smyrna Beach
According to the New Smyrna Beach family income data, there are 1,730 families falling into the $100,000 to $149,999 income range, which is the most common income bracket and makes up 19.9% of all families. Conversely, the $10,000 to $14,999 income bracket is the least frequent group with only 61 families (0.7%) belonging to this category.
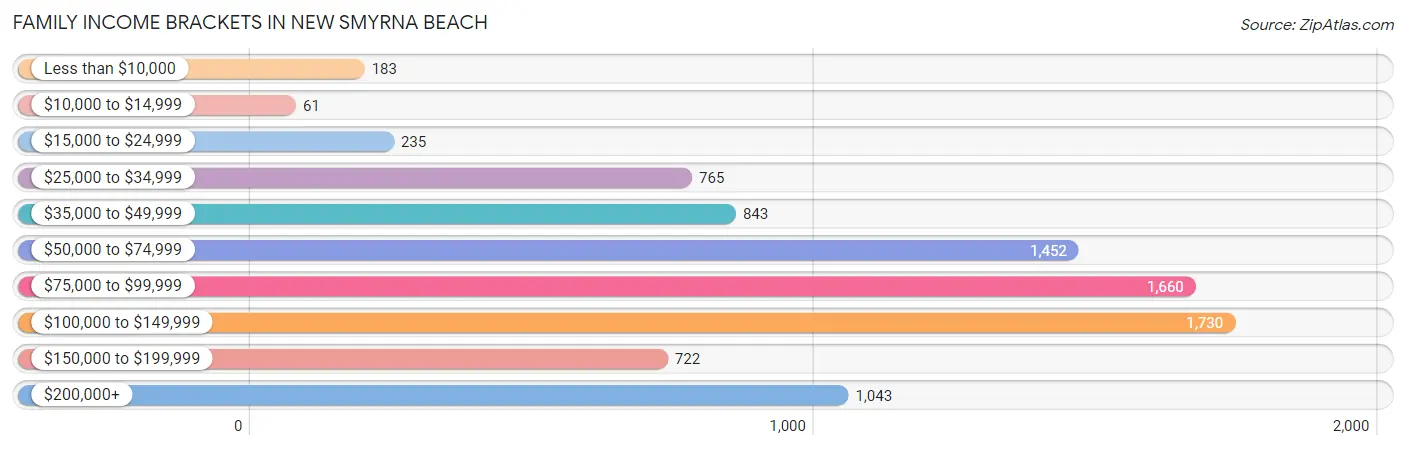
| Income Bracket | # Families | % Families |
| Less than $10,000 | 183 | 2.1% |
| $10,000 to $14,999 | 61 | 0.7% |
| $15,000 to $24,999 | 235 | 2.7% |
| $25,000 to $34,999 | 765 | 8.8% |
| $35,000 to $49,999 | 843 | 9.7% |
| $50,000 to $74,999 | 1,452 | 16.7% |
| $75,000 to $99,999 | 1,660 | 19.1% |
| $100,000 to $149,999 | 1,730 | 19.9% |
| $150,000 to $199,999 | 722 | 8.3% |
| $200,000+ | 1,043 | 12.0% |
Family Income by Famaliy Size in New Smyrna Beach
4-person families (804 | 9.2%) account for the highest median family income in New Smyrna Beach with $124,048 per family, while 2-person families (6,419 | 73.8%) have the highest median income of $42,162 per family member.
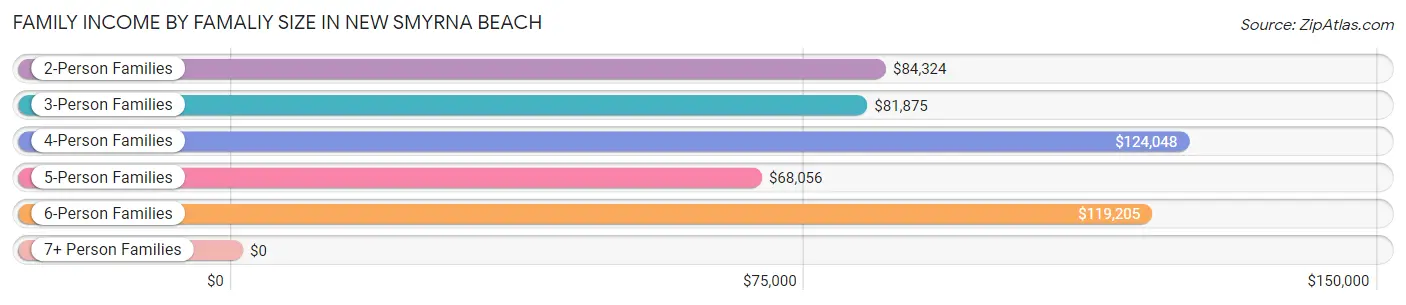
| Income Bracket | # Families | Median Income |
| 2-Person Families | 6,419 (73.8%) | $84,324 |
| 3-Person Families | 1,094 (12.6%) | $81,875 |
| 4-Person Families | 804 (9.2%) | $124,048 |
| 5-Person Families | 200 (2.3%) | $68,056 |
| 6-Person Families | 176 (2.0%) | $119,205 |
| 7+ Person Families | 0 (0.0%) | $0 |
| Total | 8,693 (100.0%) | $86,882 |
Family Income by Number of Earners in New Smyrna Beach
The median family income in New Smyrna Beach is $86,882, with families comprising 3+ earners (385) having the highest median family income of $133,377, while families with 1 earner (2,985) have the lowest median family income of $66,793, accounting for 4.4% and 34.3% of families, respectively.
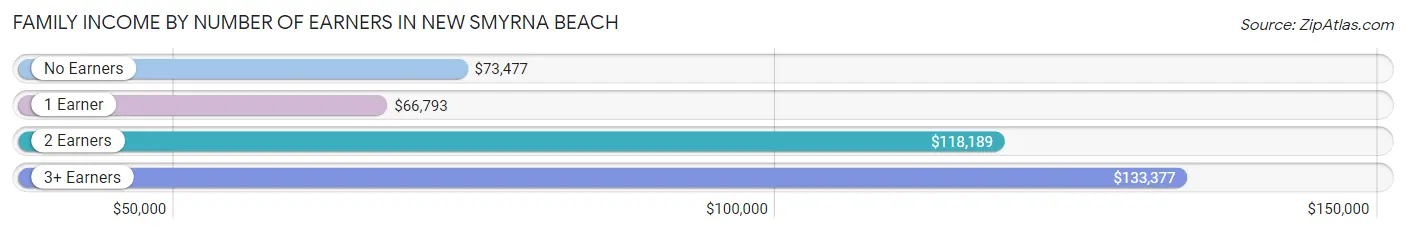
| Number of Earners | # Families | Median Income |
| No Earners | 2,675 (30.8%) | $73,477 |
| 1 Earner | 2,985 (34.3%) | $66,793 |
| 2 Earners | 2,648 (30.5%) | $118,189 |
| 3+ Earners | 385 (4.4%) | $133,377 |
| Total | 8,693 (100.0%) | $86,882 |
Household Income in New Smyrna Beach
Household Income Brackets in New Smyrna Beach
With 2,861 households falling in the category, the $100,000 to $149,999 income range is the most frequent in New Smyrna Beach, accounting for 19.1% of all households. In contrast, only 479 households (3.2%) fall into the $10,000 to $14,999 income bracket, making it the least populous group.
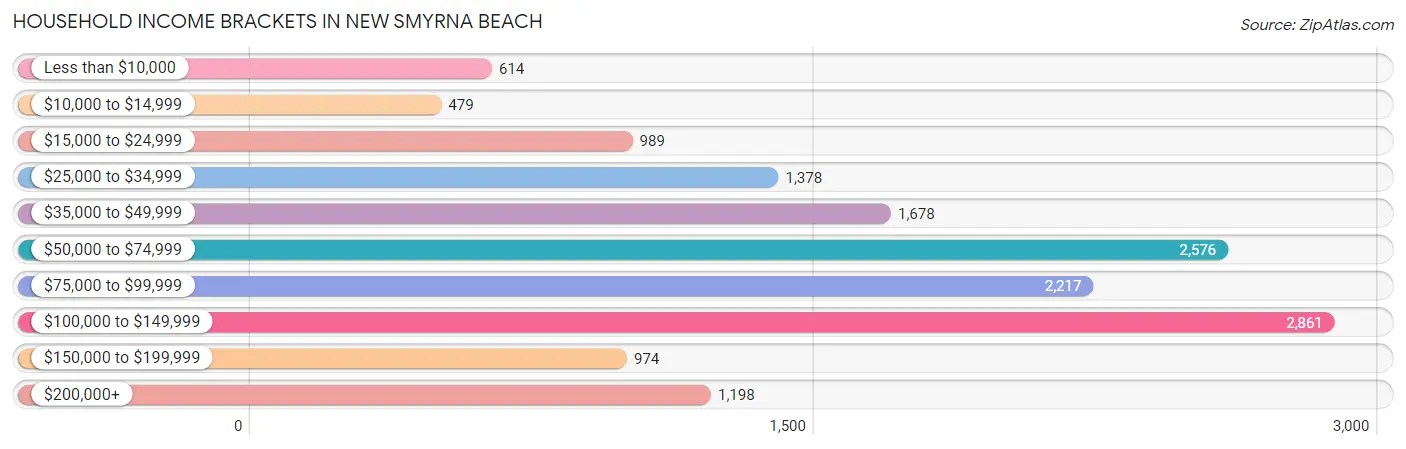
| Income Bracket | # Households | % Households |
| Less than $10,000 | 614 | 4.1% |
| $10,000 to $14,999 | 479 | 3.2% |
| $15,000 to $24,999 | 989 | 6.6% |
| $25,000 to $34,999 | 1,378 | 9.2% |
| $35,000 to $49,999 | 1,678 | 11.2% |
| $50,000 to $74,999 | 2,576 | 17.2% |
| $75,000 to $99,999 | 2,217 | 14.8% |
| $100,000 to $149,999 | 2,861 | 19.1% |
| $150,000 to $199,999 | 974 | 6.5% |
| $200,000+ | 1,198 | 8.0% |
Household Income by Householder Age in New Smyrna Beach
The median household income in New Smyrna Beach is $73,096, with the highest median household income of $84,834 found in the 45 to 64 years age bracket for the primary householder. A total of 5,712 households (38.1%) fall into this category. Meanwhile, the 65+ years age bracket for the primary householder has the lowest median household income of $61,046, with 6,431 households (42.9%) in this group.
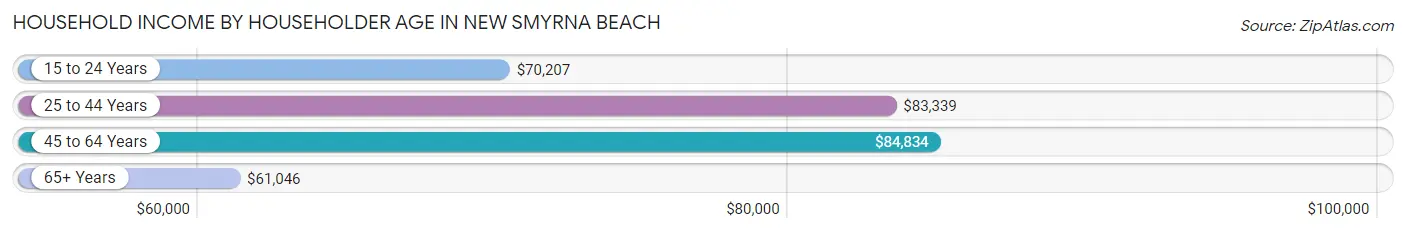
| Income Bracket | # Households | Median Income |
| 15 to 24 Years | 277 (1.8%) | $70,207 |
| 25 to 44 Years | 2,559 (17.1%) | $83,339 |
| 45 to 64 Years | 5,712 (38.1%) | $84,834 |
| 65+ Years | 6,431 (42.9%) | $61,046 |
| Total | 14,979 (100.0%) | $73,096 |
Poverty in New Smyrna Beach
Income Below Poverty by Sex and Age in New Smyrna Beach
With 8.0% poverty level for males and 11.2% for females among the residents of New Smyrna Beach, 16 and 17 year old males and 6 to 11 year old females are the most vulnerable to poverty, with 60 males (25.6%) and 170 females (31.4%) in their respective age groups living below the poverty level.
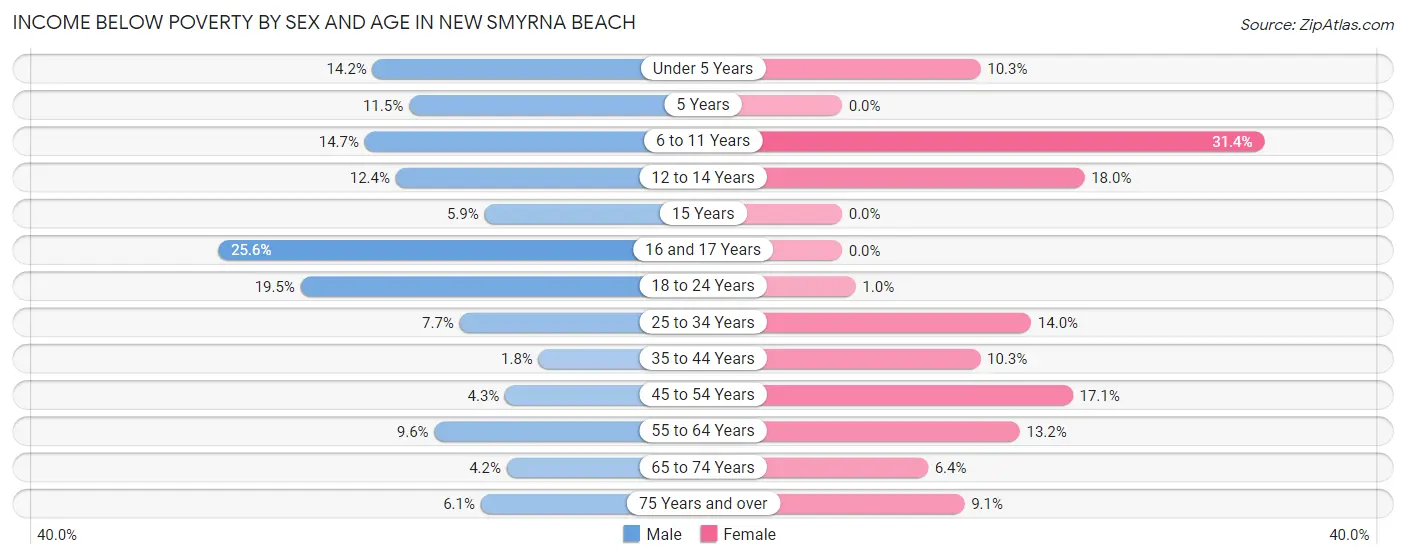
| Age Bracket | Male | Female |
| Under 5 Years | 109 (14.2%) | 47 (10.3%) |
| 5 Years | 18 (11.5%) | 0 (0.0%) |
| 6 to 11 Years | 101 (14.7%) | 170 (31.4%) |
| 12 to 14 Years | 27 (12.4%) | 18 (18.0%) |
| 15 Years | 12 (5.9%) | 0 (0.0%) |
| 16 and 17 Years | 60 (25.6%) | 0 (0.0%) |
| 18 to 24 Years | 125 (19.5%) | 6 (1.0%) |
| 25 to 34 Years | 120 (7.7%) | 202 (14.0%) |
| 35 to 44 Years | 21 (1.8%) | 122 (10.3%) |
| 45 to 54 Years | 68 (4.3%) | 289 (17.1%) |
| 55 to 64 Years | 302 (9.6%) | 376 (13.2%) |
| 65 to 74 Years | 110 (4.2%) | 200 (6.4%) |
| 75 Years and over | 140 (6.1%) | 236 (9.1%) |
| Total | 1,213 (8.0%) | 1,666 (11.2%) |
Income Above Poverty by Sex and Age in New Smyrna Beach
According to the poverty statistics in New Smyrna Beach, males aged 35 to 44 years and females aged 5 years are the age groups that are most secure financially, with 98.2% of males and 100.0% of females in these age groups living above the poverty line.
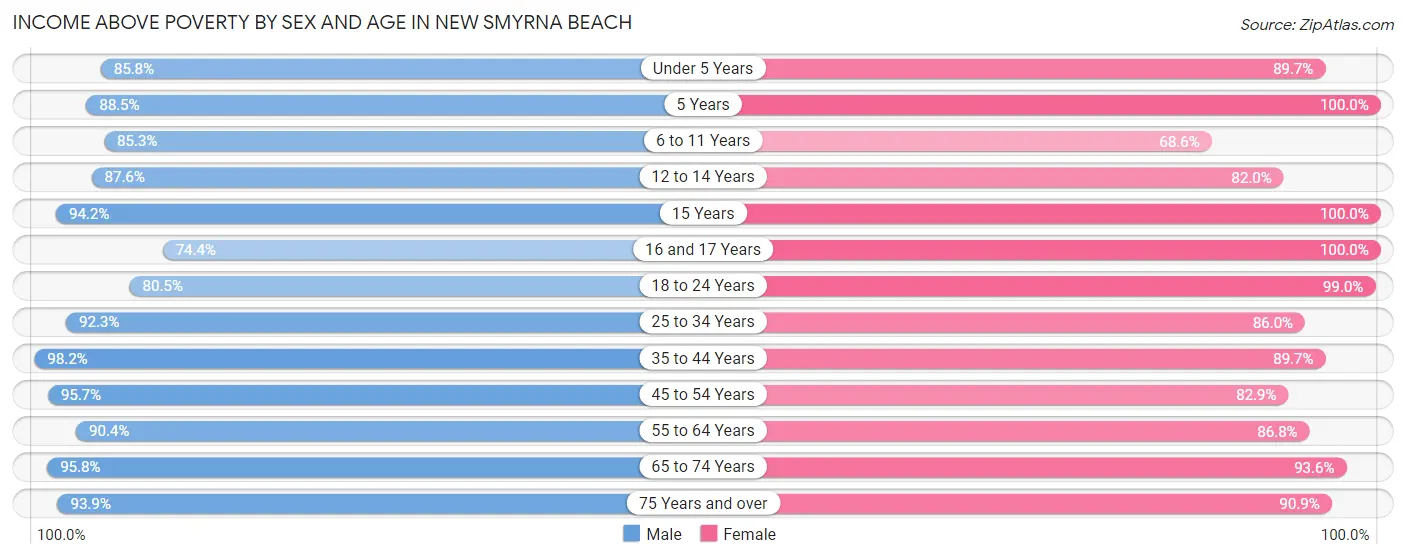
| Age Bracket | Male | Female |
| Under 5 Years | 661 (85.8%) | 410 (89.7%) |
| 5 Years | 139 (88.5%) | 124 (100.0%) |
| 6 to 11 Years | 584 (85.3%) | 372 (68.6%) |
| 12 to 14 Years | 190 (87.6%) | 82 (82.0%) |
| 15 Years | 193 (94.2%) | 71 (100.0%) |
| 16 and 17 Years | 174 (74.4%) | 93 (100.0%) |
| 18 to 24 Years | 516 (80.5%) | 588 (99.0%) |
| 25 to 34 Years | 1,439 (92.3%) | 1,237 (86.0%) |
| 35 to 44 Years | 1,124 (98.2%) | 1,066 (89.7%) |
| 45 to 54 Years | 1,507 (95.7%) | 1,398 (82.9%) |
| 55 to 64 Years | 2,854 (90.4%) | 2,473 (86.8%) |
| 65 to 74 Years | 2,510 (95.8%) | 2,934 (93.6%) |
| 75 Years and over | 2,145 (93.9%) | 2,359 (90.9%) |
| Total | 14,036 (92.0%) | 13,207 (88.8%) |
Income Below Poverty Among Married-Couple Families in New Smyrna Beach
The poverty statistics for married-couple families in New Smyrna Beach show that 2.6% or 179 of the total 6,975 families live below the poverty line. Families with 3 or 4 children have the highest poverty rate of 12.1%, comprising of 29 families. On the other hand, families with no children have the lowest poverty rate of 1.9%, which includes 109 families.
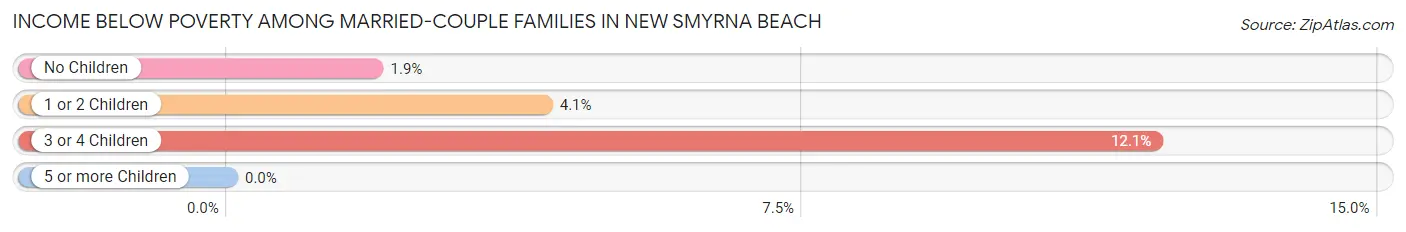
| Children | Above Poverty | Below Poverty |
| No Children | 5,628 (98.1%) | 109 (1.9%) |
| 1 or 2 Children | 957 (95.9%) | 41 (4.1%) |
| 3 or 4 Children | 211 (87.9%) | 29 (12.1%) |
| 5 or more Children | 0 (0.0%) | 0 (0.0%) |
| Total | 6,796 (97.4%) | 179 (2.6%) |
Income Below Poverty Among Single-Parent Households in New Smyrna Beach
According to the poverty data in New Smyrna Beach, 6.9% or 52 single-father households and 19.5% or 188 single-mother households are living below the poverty line. Among single-father households, those with 3 or 4 children have the highest poverty rate, with 28 households (77.8%) experiencing poverty. Likewise, among single-mother households, those with 3 or 4 children have the highest poverty rate, with 33 households (40.2%) falling below the poverty line.
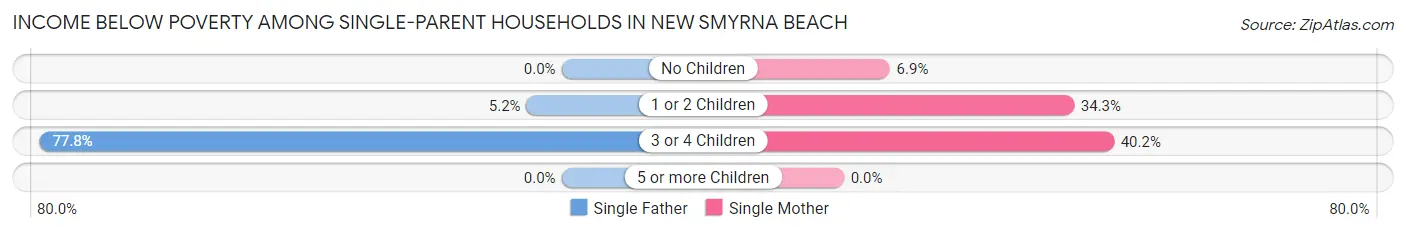
| Children | Single Father | Single Mother |
| No Children | 0 (0.0%) | 37 (6.9%) |
| 1 or 2 Children | 24 (5.2%) | 118 (34.3%) |
| 3 or 4 Children | 28 (77.8%) | 33 (40.2%) |
| 5 or more Children | 0 (0.0%) | 0 (0.0%) |
| Total | 52 (6.9%) | 188 (19.5%) |
Income Below Poverty Among Married-Couple vs Single-Parent Households in New Smyrna Beach
The poverty data for New Smyrna Beach shows that 179 of the married-couple family households (2.6%) and 240 of the single-parent households (14.0%) are living below the poverty level. Within the married-couple family households, those with 3 or 4 children have the highest poverty rate, with 29 households (12.1%) falling below the poverty line. Among the single-parent households, those with 3 or 4 children have the highest poverty rate, with 61 household (51.7%) living below poverty.
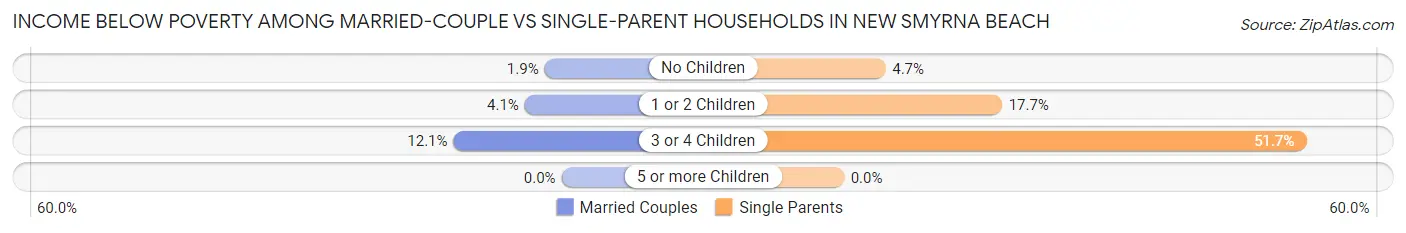
| Children | Married-Couple Families | Single-Parent Households |
| No Children | 109 (1.9%) | 37 (4.6%) |
| 1 or 2 Children | 41 (4.1%) | 142 (17.7%) |
| 3 or 4 Children | 29 (12.1%) | 61 (51.7%) |
| 5 or more Children | 0 (0.0%) | 0 (0.0%) |
| Total | 179 (2.6%) | 240 (14.0%) |
Race in New Smyrna Beach
The most populous races in New Smyrna Beach are White / Caucasian (27,340 | 89.8%), Hispanic or Latino (2,166 | 7.1%), and Two or more Races (1,322 | 4.3%).
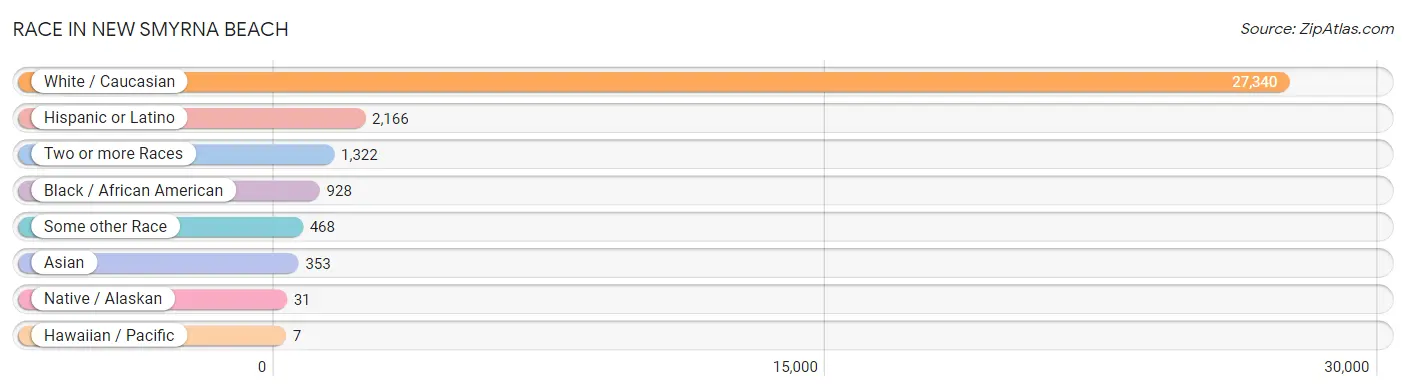
| Race | # Population | % Population |
| Asian | 353 | 1.2% |
| Black / African American | 928 | 3.0% |
| Hawaiian / Pacific | 7 | 0.0% |
| Hispanic or Latino | 2,166 | 7.1% |
| Native / Alaskan | 31 | 0.1% |
| White / Caucasian | 27,340 | 89.8% |
| Two or more Races | 1,322 | 4.3% |
| Some other Race | 468 | 1.5% |
| Total | 30,449 | 100.0% |
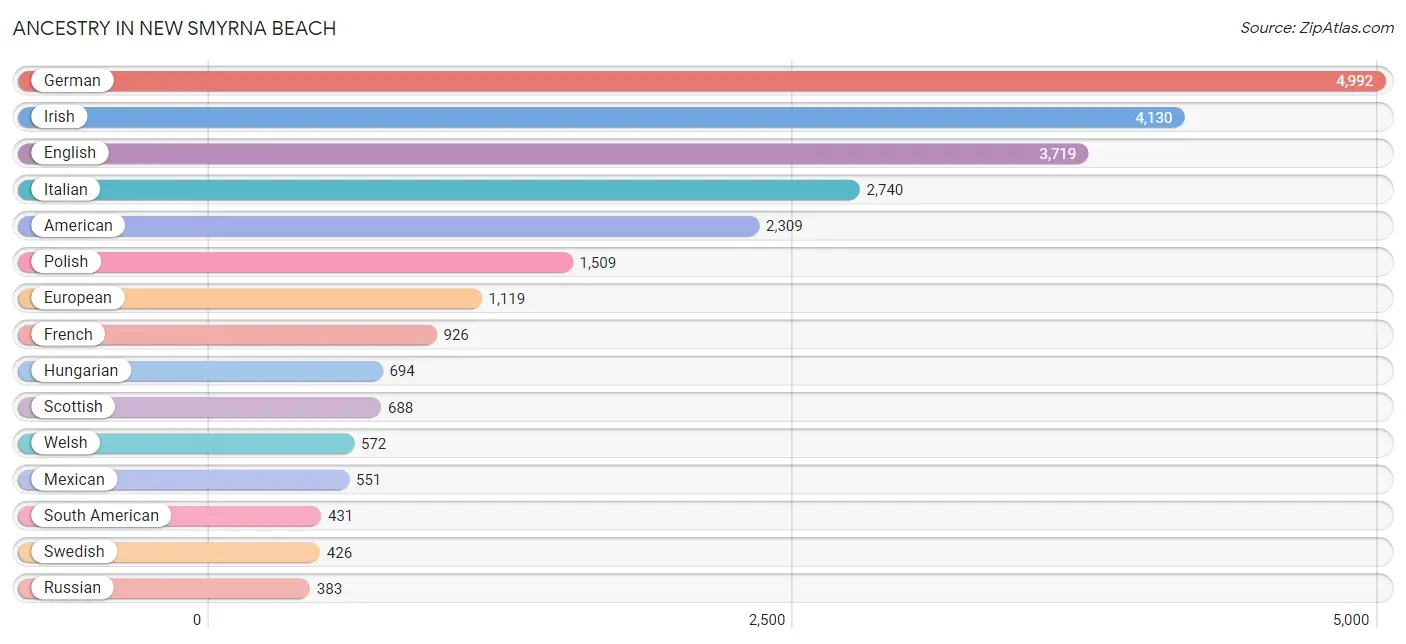
Ancestry in New Smyrna Beach
The most populous ancestries reported in New Smyrna Beach are German (4,992 | 16.4%), Irish (4,130 | 13.6%), English (3,719 | 12.2%), Italian (2,740 | 9.0%), and American (2,309 | 7.6%), together accounting for 58.7% of all New Smyrna Beach residents.
| Ancestry | # Population | % Population |
| African | 1 | 0.0% |
| Albanian | 16 | 0.1% |
| American | 2,309 | 7.6% |
| Arab | 58 | 0.2% |
| Australian | 1 | 0.0% |
| Austrian | 93 | 0.3% |
| Belgian | 5 | 0.0% |
| Bhutanese | 54 | 0.2% |
| Brazilian | 49 | 0.2% |
| British | 263 | 0.9% |
| Burmese | 208 | 0.7% |
| Canadian | 98 | 0.3% |
| Central American | 11 | 0.0% |
| Cherokee | 43 | 0.1% |
| Colombian | 185 | 0.6% |
| Costa Rican | 11 | 0.0% |
| Croatian | 21 | 0.1% |
| Cuban | 181 | 0.6% |
| Czech | 48 | 0.2% |
| Czechoslovakian | 32 | 0.1% |
| Danish | 73 | 0.2% |
| Delaware | 7 | 0.0% |
| Dominican | 5 | 0.0% |
| Dutch | 359 | 1.2% |
| Eastern European | 63 | 0.2% |
| Ecuadorian | 246 | 0.8% |
| English | 3,719 | 12.2% |
| European | 1,119 | 3.7% |
| Filipino | 27 | 0.1% |
| Finnish | 41 | 0.1% |
| French | 926 | 3.0% |
| French Canadian | 109 | 0.4% |
| German | 4,992 | 16.4% |
| Greek | 193 | 0.6% |
| Hungarian | 694 | 2.3% |
| Indian (Asian) | 66 | 0.2% |
| Iraqi | 10 | 0.0% |
| Irish | 4,130 | 13.6% |
| Israeli | 10 | 0.0% |
| Italian | 2,740 | 9.0% |
| Jamaican | 33 | 0.1% |
| Korean | 146 | 0.5% |
| Latvian | 46 | 0.2% |
| Lebanese | 48 | 0.2% |
| Lithuanian | 28 | 0.1% |
| Mexican | 551 | 1.8% |
| Native Hawaiian | 5 | 0.0% |
| Northern European | 16 | 0.1% |
| Norwegian | 298 | 1.0% |
| Pakistani | 44 | 0.1% |
| Pennsylvania German | 12 | 0.0% |
| Polish | 1,509 | 5.0% |
| Portuguese | 234 | 0.8% |
| Puerto Rican | 285 | 0.9% |
| Romanian | 103 | 0.3% |
| Russian | 383 | 1.3% |
| Samoan | 12 | 0.0% |
| Scandinavian | 76 | 0.3% |
| Scotch-Irish | 376 | 1.2% |
| Scottish | 688 | 2.3% |
| Slovak | 26 | 0.1% |
| South African | 10 | 0.0% |
| South American | 431 | 1.4% |
| Spaniard | 46 | 0.2% |
| Spanish | 12 | 0.0% |
| Sri Lankan | 156 | 0.5% |
| Subsaharan African | 11 | 0.0% |
| Swedish | 426 | 1.4% |
| Swiss | 157 | 0.5% |
| Ukrainian | 60 | 0.2% |
| Welsh | 572 | 1.9% |
| West Indian | 18 | 0.1% | View All 72 Rows |
Immigrants in New Smyrna Beach
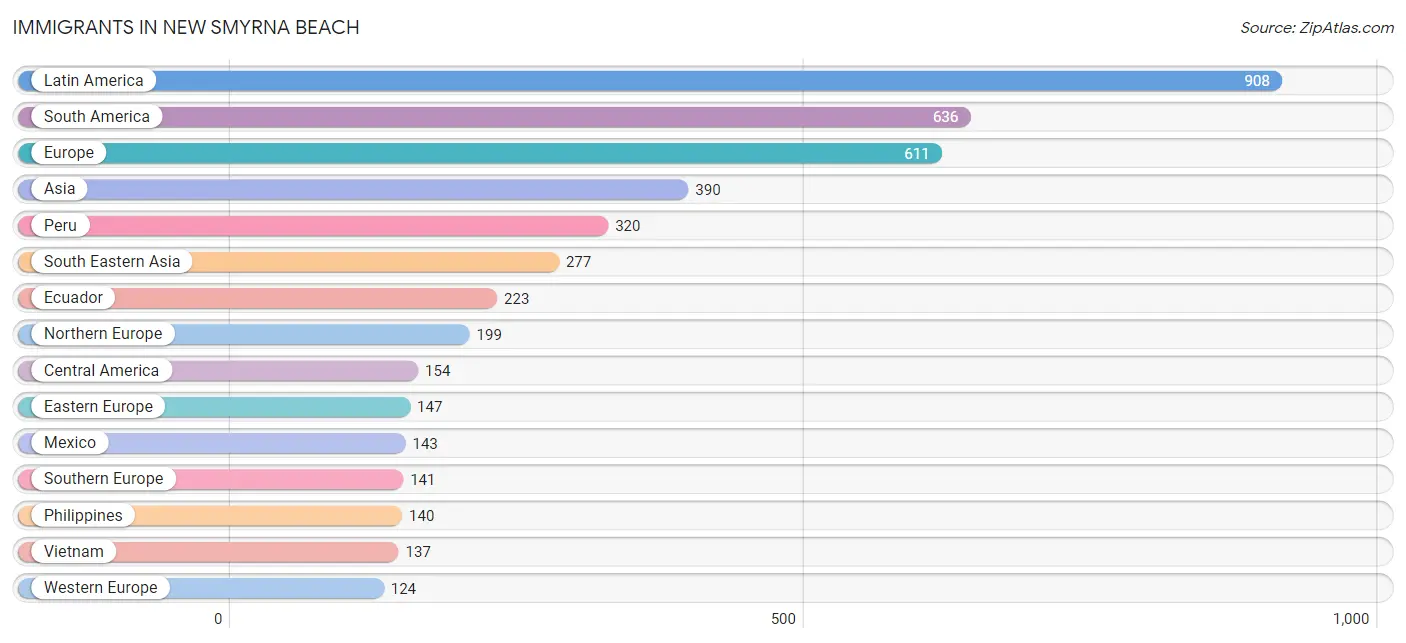
The most numerous immigrant groups reported in New Smyrna Beach came from Latin America (908 | 3.0%), South America (636 | 2.1%), Europe (611 | 2.0%), Asia (390 | 1.3%), and Peru (320 | 1.1%), together accounting for 9.4% of all New Smyrna Beach residents.
| Immigration Origin | # Population | % Population |
| Asia | 390 | 1.3% |
| Australia | 1 | 0.0% |
| Austria | 9 | 0.0% |
| Belgium | 10 | 0.0% |
| Brazil | 35 | 0.1% |
| Canada | 80 | 0.3% |
| Caribbean | 118 | 0.4% |
| Central America | 154 | 0.5% |
| China | 56 | 0.2% |
| Colombia | 58 | 0.2% |
| Costa Rica | 11 | 0.0% |
| Cuba | 66 | 0.2% |
| Denmark | 26 | 0.1% |
| Dominican Republic | 40 | 0.1% |
| Eastern Asia | 75 | 0.3% |
| Eastern Europe | 147 | 0.5% |
| Ecuador | 223 | 0.7% |
| England | 37 | 0.1% |
| Europe | 611 | 2.0% |
| France | 29 | 0.1% |
| Germany | 46 | 0.2% |
| Greece | 53 | 0.2% |
| Hungary | 16 | 0.1% |
| India | 18 | 0.1% |
| Iraq | 10 | 0.0% |
| Ireland | 28 | 0.1% |
| Israel | 10 | 0.0% |
| Italy | 58 | 0.2% |
| Jamaica | 12 | 0.0% |
| Korea | 19 | 0.1% |
| Latin America | 908 | 3.0% |
| Mexico | 143 | 0.5% |
| Netherlands | 9 | 0.0% |
| Northern Europe | 199 | 0.6% |
| Oceania | 1 | 0.0% |
| Peru | 320 | 1.1% |
| Philippines | 140 | 0.5% |
| Romania | 28 | 0.1% |
| Russia | 103 | 0.3% |
| Scotland | 25 | 0.1% |
| South America | 636 | 2.1% |
| South Central Asia | 18 | 0.1% |
| South Eastern Asia | 277 | 0.9% |
| Southern Europe | 141 | 0.5% |
| Spain | 30 | 0.1% |
| Sweden | 11 | 0.0% |
| Switzerland | 21 | 0.1% |
| Taiwan | 8 | 0.0% |
| Vietnam | 137 | 0.4% |
| Western Asia | 20 | 0.1% |
| Western Europe | 124 | 0.4% | View All 51 Rows |
Sex and Age in New Smyrna Beach
Sex and Age in New Smyrna Beach
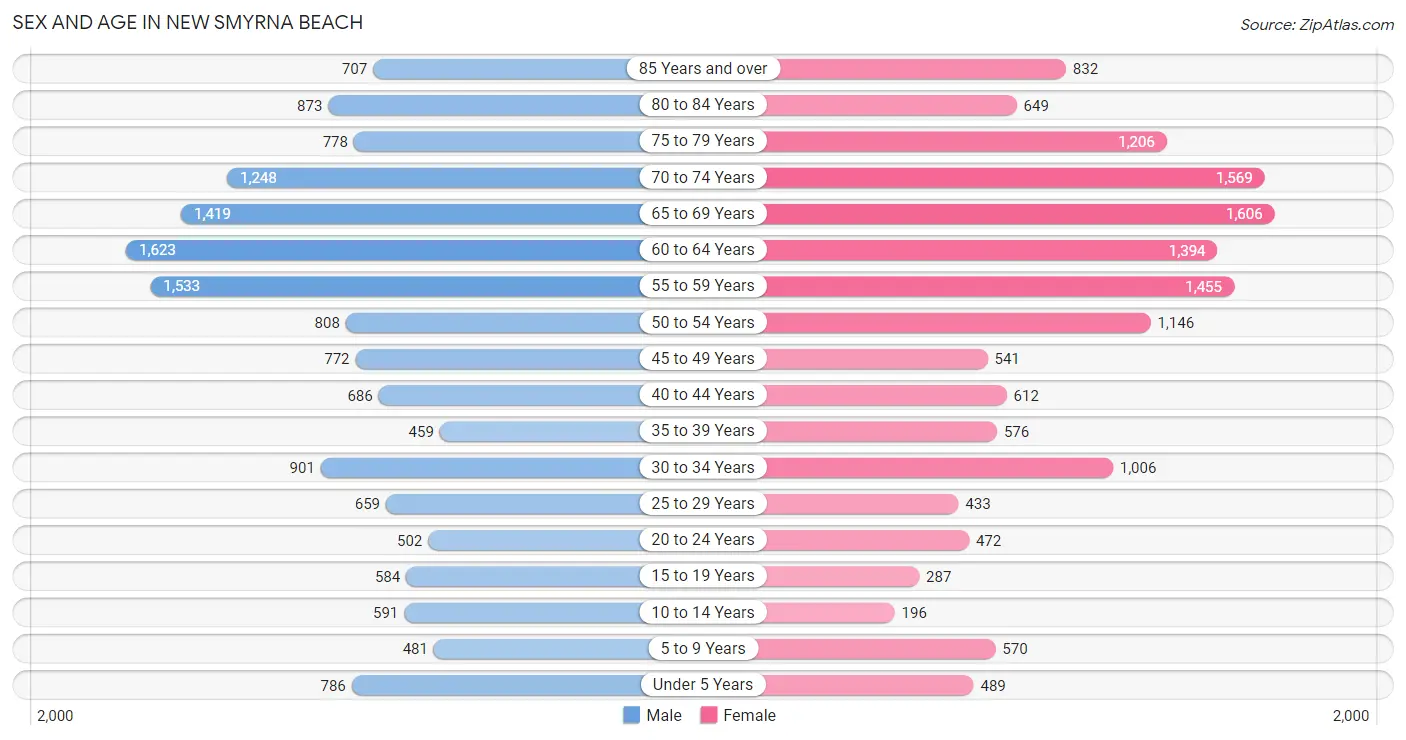
The most populous age groups in New Smyrna Beach are 60 to 64 Years (1,623 | 10.5%) for men and 65 to 69 Years (1,606 | 10.7%) for women.
| Age Bracket | Male | Female |
| Under 5 Years | 786 (5.1%) | 489 (3.3%) |
| 5 to 9 Years | 481 (3.1%) | 570 (3.8%) |
| 10 to 14 Years | 591 (3.8%) | 196 (1.3%) |
| 15 to 19 Years | 584 (3.8%) | 287 (1.9%) |
| 20 to 24 Years | 502 (3.3%) | 472 (3.1%) |
| 25 to 29 Years | 659 (4.3%) | 433 (2.9%) |
| 30 to 34 Years | 901 (5.9%) | 1,006 (6.7%) |
| 35 to 39 Years | 459 (3.0%) | 576 (3.8%) |
| 40 to 44 Years | 686 (4.4%) | 612 (4.1%) |
| 45 to 49 Years | 772 (5.0%) | 541 (3.6%) |
| 50 to 54 Years | 808 (5.2%) | 1,146 (7.6%) |
| 55 to 59 Years | 1,533 (10.0%) | 1,455 (9.7%) |
| 60 to 64 Years | 1,623 (10.5%) | 1,394 (9.3%) |
| 65 to 69 Years | 1,419 (9.2%) | 1,606 (10.7%) |
| 70 to 74 Years | 1,248 (8.1%) | 1,569 (10.4%) |
| 75 to 79 Years | 778 (5.1%) | 1,206 (8.0%) |
| 80 to 84 Years | 873 (5.7%) | 649 (4.3%) |
| 85 Years and over | 707 (4.6%) | 832 (5.5%) |
| Total | 15,410 (100.0%) | 15,039 (100.0%) |
Families and Households in New Smyrna Beach
Median Family Size in New Smyrna Beach
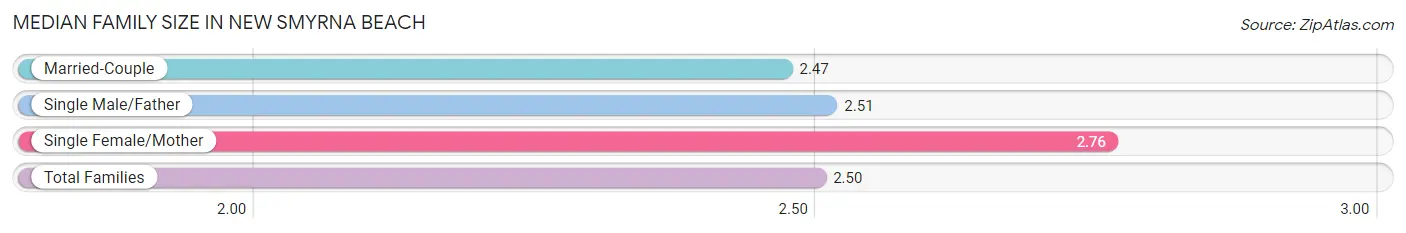
The median family size in New Smyrna Beach is 2.50 persons per family, with single female/mother families (966 | 11.1%) accounting for the largest median family size of 2.76 persons per family. On the other hand, married-couple families (6,975 | 80.2%) represent the smallest median family size with 2.47 persons per family.
| Family Type | # Families | Family Size |
| Married-Couple | 6,975 (80.2%) | 2.47 |
| Single Male/Father | 752 (8.6%) | 2.51 |
| Single Female/Mother | 966 (11.1%) | 2.76 |
| Total Families | 8,693 (100.0%) | 2.50 |
Median Household Size in New Smyrna Beach
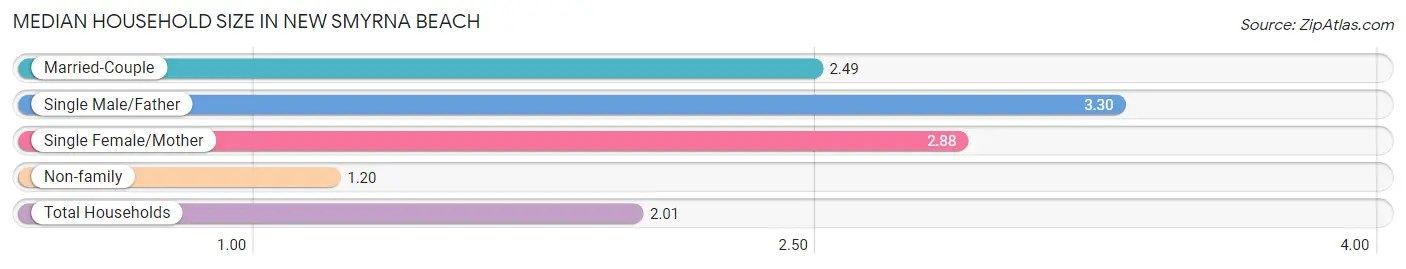
The median household size in New Smyrna Beach is 2.01 persons per household, with single male/father households (752 | 5.0%) accounting for the largest median household size of 3.3 persons per household. non-family households (6,286 | 42.0%) represent the smallest median household size with 1.20 persons per household.
| Household Type | # Households | Household Size |
| Married-Couple | 6,975 (46.6%) | 2.49 |
| Single Male/Father | 752 (5.0%) | 3.30 |
| Single Female/Mother | 966 (6.5%) | 2.88 |
| Non-family | 6,286 (42.0%) | 1.20 |
| Total Households | 14,979 (100.0%) | 2.01 |
Household Size by Marriage Status in New Smyrna Beach
Out of a total of 14,979 households in New Smyrna Beach, 8,693 (58.0%) are family households, while 6,286 (42.0%) are nonfamily households. The most numerous type of family households are 2-person households, comprising 6,029, and the most common type of nonfamily households are 1-person households, comprising 5,299.
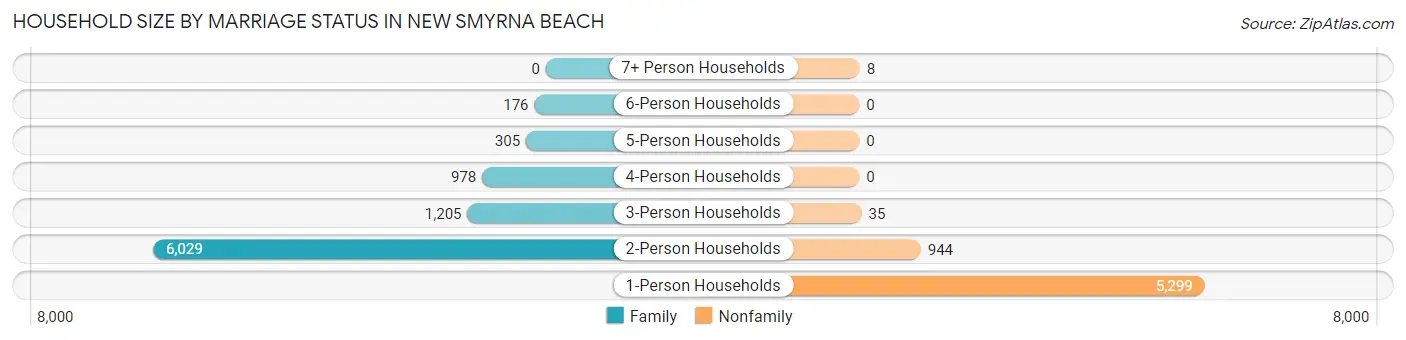
| Household Size | Family Households | Nonfamily Households |
| 1-Person Households | - | 5,299 (35.4%) |
| 2-Person Households | 6,029 (40.3%) | 944 (6.3%) |
| 3-Person Households | 1,205 (8.0%) | 35 (0.2%) |
| 4-Person Households | 978 (6.5%) | 0 (0.0%) |
| 5-Person Households | 305 (2.0%) | 0 (0.0%) |
| 6-Person Households | 176 (1.2%) | 0 (0.0%) |
| 7+ Person Households | 0 (0.0%) | 8 (0.1%) |
| Total | 8,693 (58.0%) | 6,286 (42.0%) |
Female Fertility in New Smyrna Beach
Fertility by Age in New Smyrna Beach
Average fertility rate in New Smyrna Beach is 53.0 births per 1,000 women. Women in the age bracket of 20 to 34 years have the highest fertility rate with 76.0 births per 1,000 women. Women in the age bracket of 20 to 34 years acount for 65.0% of all women with births.
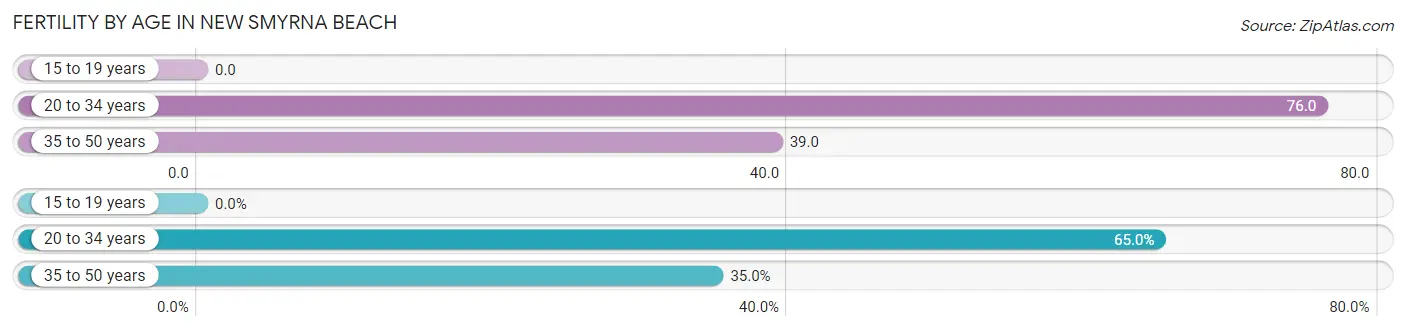
| Age Bracket | Women with Births | Births / 1,000 Women |
| 15 to 19 years | 0 (0.0%) | 0.0 |
| 20 to 34 years | 145 (65.0%) | 76.0 |
| 35 to 50 years | 78 (35.0%) | 39.0 |
| Total | 223 (100.0%) | 53.0 |
Fertility by Age by Marriage Status in New Smyrna Beach
73.1% of women with births (223) in New Smyrna Beach are married. The highest percentage of unmarried women with births falls into 20 to 34 years age bracket with 35.9% of them unmarried at the time of birth, while the lowest percentage of unmarried women with births belong to 35 to 50 years age bracket with 10.3% of them unmarried.
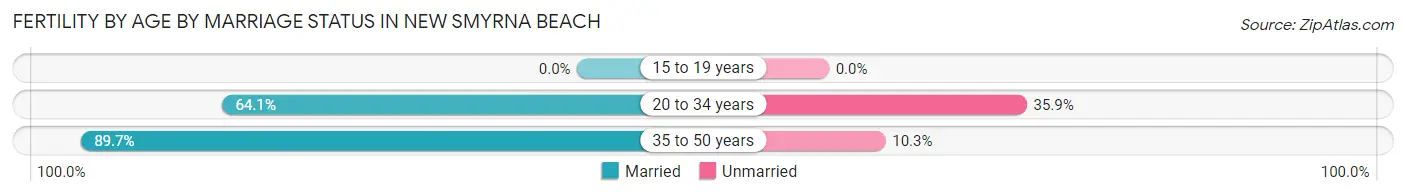
| Age Bracket | Married | Unmarried |
| 15 to 19 years | 0 (0.0%) | 0 (0.0%) |
| 20 to 34 years | 93 (64.1%) | 52 (35.9%) |
| 35 to 50 years | 70 (89.7%) | 8 (10.3%) |
| Total | 163 (73.1%) | 60 (26.9%) |
Fertility by Education in New Smyrna Beach
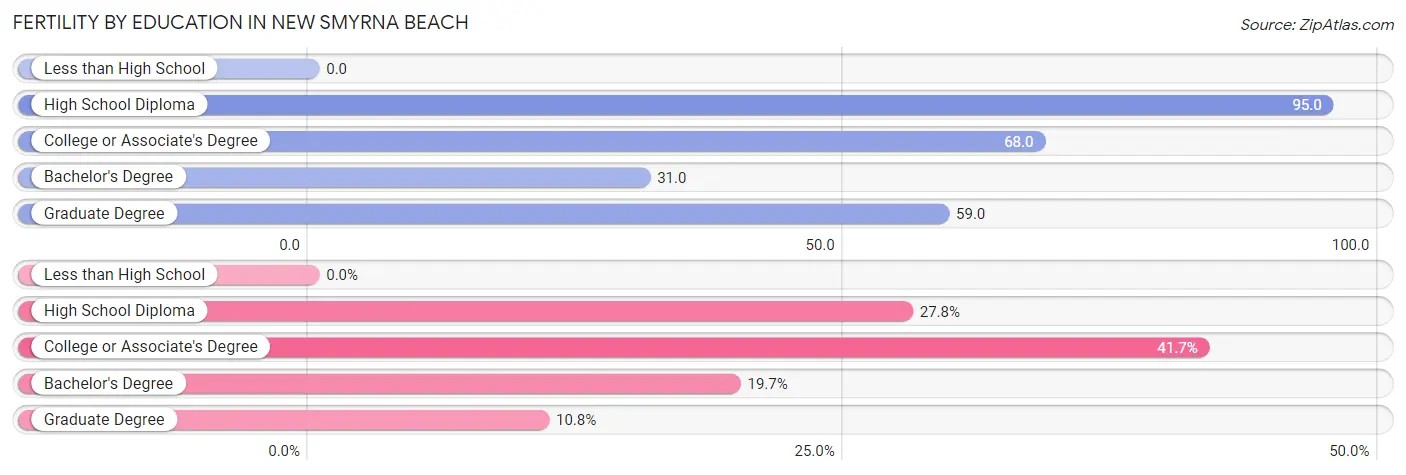
| Educational Attainment | Women with Births | Births / 1,000 Women |
| Less than High School | 0 (0.0%) | 0.0 |
| High School Diploma | 62 (27.8%) | 95.0 |
| College or Associate's Degree | 93 (41.7%) | 68.0 |
| Bachelor's Degree | 44 (19.7%) | 31.0 |
| Graduate Degree | 24 (10.8%) | 59.0 |
| Total | 223 (100.0%) | 53.0 |
Fertility by Education by Marriage Status in New Smyrna Beach
26.9% of women with births in New Smyrna Beach are unmarried. Women with the educational attainment of high school diploma are most likely to be married with 100.0% of them married at childbirth, while women with the educational attainment of college or associate's degree are least likely to be married with 64.5% of them unmarried at childbirth.
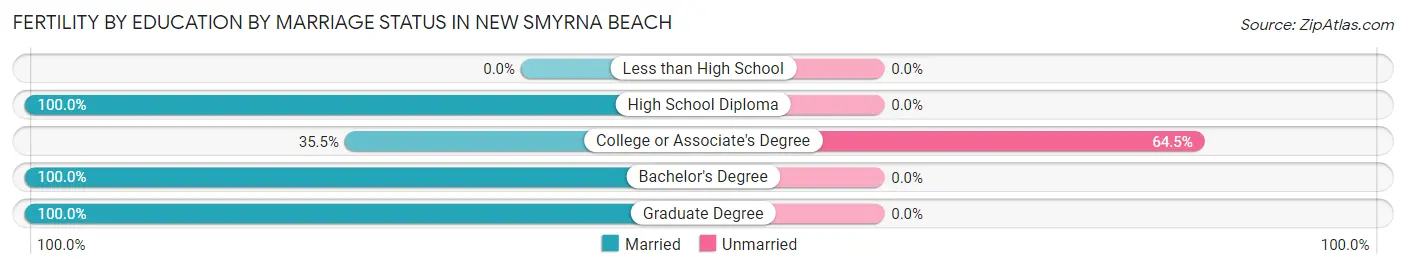
| Educational Attainment | Married | Unmarried |
| Less than High School | 0 (0.0%) | 0 (0.0%) |
| High School Diploma | 62 (100.0%) | 0 (0.0%) |
| College or Associate's Degree | 33 (35.5%) | 60 (64.5%) |
| Bachelor's Degree | 44 (100.0%) | 0 (0.0%) |
| Graduate Degree | 24 (100.0%) | 0 (0.0%) |
| Total | 163 (73.1%) | 60 (26.9%) |
Employment Characteristics in New Smyrna Beach
Employment by Class of Employer in New Smyrna Beach
Among the 12,106 employed individuals in New Smyrna Beach, private company employees (8,224 | 67.9%), self-employed (not incorporated) (1,106 | 9.1%), and self-employed (incorporated) (929 | 7.7%) make up the most common classes of employment.
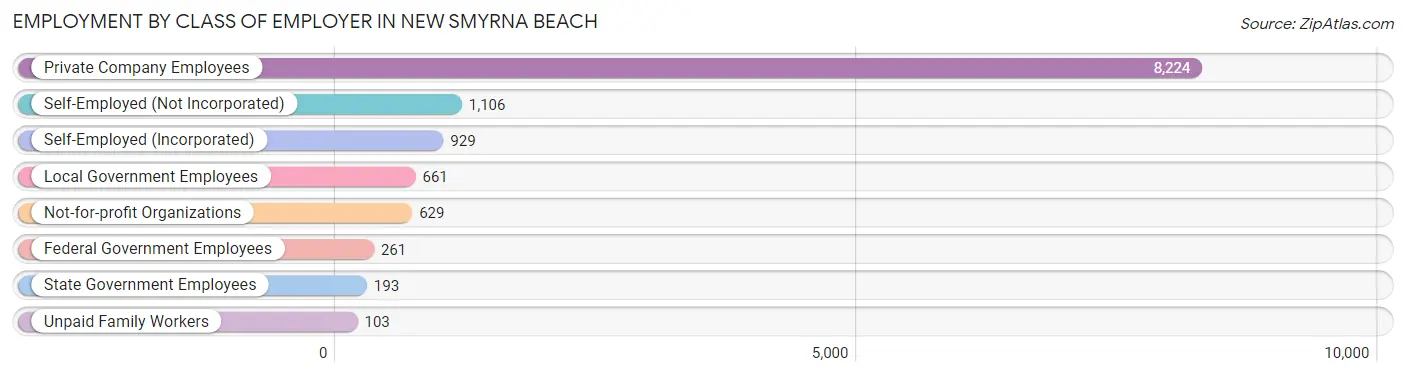
| Employer Class | # Employees | % Employees |
| Private Company Employees | 8,224 | 67.9% |
| Self-Employed (Incorporated) | 929 | 7.7% |
| Self-Employed (Not Incorporated) | 1,106 | 9.1% |
| Not-for-profit Organizations | 629 | 5.2% |
| Local Government Employees | 661 | 5.5% |
| State Government Employees | 193 | 1.6% |
| Federal Government Employees | 261 | 2.2% |
| Unpaid Family Workers | 103 | 0.9% |
| Total | 12,106 | 100.0% |
Employment Status by Age in New Smyrna Beach
According to the labor force statistics for New Smyrna Beach, out of the total population over 16 years of age (27,060), 47.3% or 12,799 individuals are in the labor force, with 4.4% or 563 of them unemployed. The age group with the highest labor force participation rate is 25 to 29 years, with 88.2% or 963 individuals in the labor force. Within the labor force, the 16 to 19 years age range has the highest percentage of unemployed individuals, with 24.5% or 53 of them being unemployed.
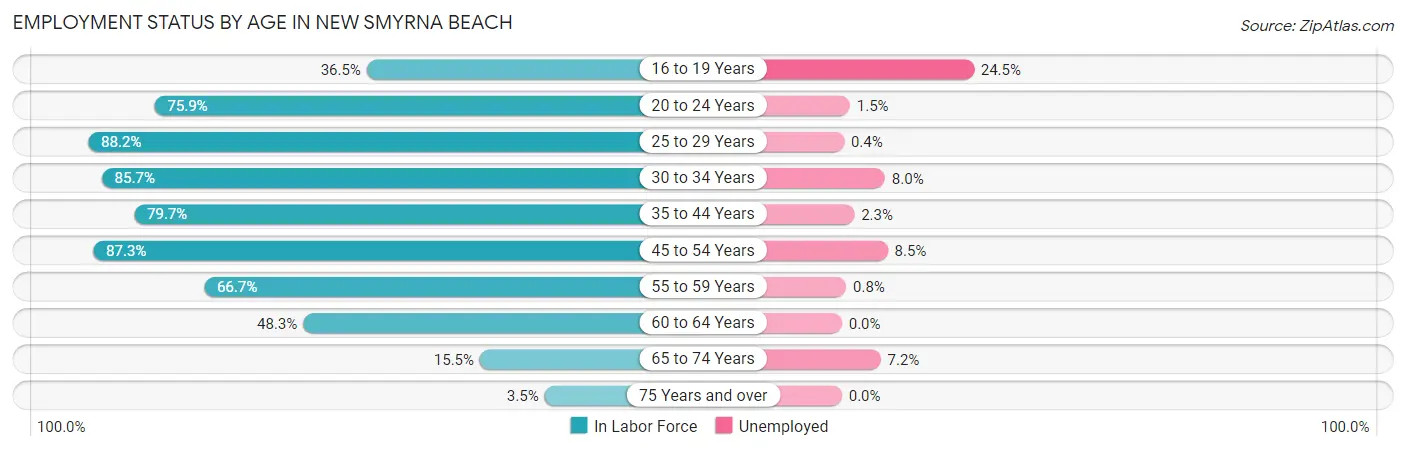
| Age Bracket | In Labor Force | Unemployed |
| 16 to 19 Years | 217 (36.5%) | 53 (24.5%) |
| 20 to 24 Years | 739 (75.9%) | 11 (1.5%) |
| 25 to 29 Years | 963 (88.2%) | 4 (0.4%) |
| 30 to 34 Years | 1,634 (85.7%) | 131 (8.0%) |
| 35 to 44 Years | 1,859 (79.7%) | 43 (2.3%) |
| 45 to 54 Years | 2,852 (87.3%) | 242 (8.5%) |
| 55 to 59 Years | 1,993 (66.7%) | 16 (0.8%) |
| 60 to 64 Years | 1,457 (48.3%) | 0 (0.0%) |
| 65 to 74 Years | 906 (15.5%) | 65 (7.2%) |
| 75 Years and over | 177 (3.5%) | 0 (0.0%) |
| Total | 12,799 (47.3%) | 563 (4.4%) |
Employment Status by Educational Attainment in New Smyrna Beach
According to labor force statistics for New Smyrna Beach, 73.7% of individuals (10,763) out of the total population between 25 and 64 years of age (14,604) are in the labor force, with 4.0% or 431 of them being unemployed. The group with the highest labor force participation rate are those with the educational attainment of high school diploma, with 78.7% or 2,978 individuals in the labor force. Within the labor force, individuals with high school diploma education have the highest percentage of unemployment, with 9.0% or 268 of them being unemployed.
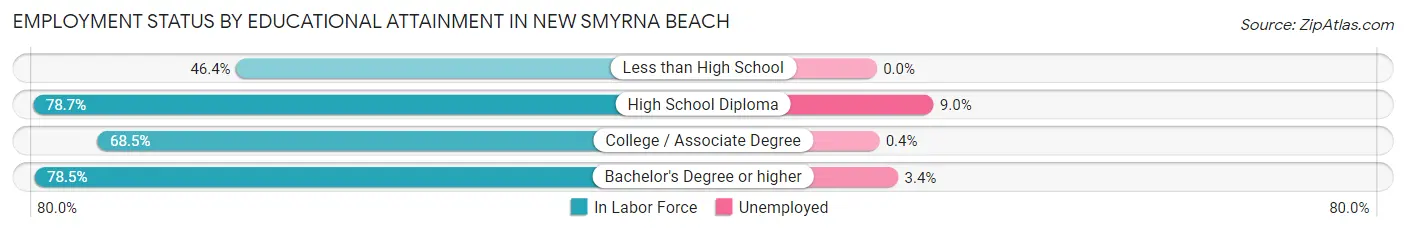
| Educational Attainment | In Labor Force | Unemployed |
| Less than High School | 376 (46.4%) | 0 (0.0%) |
| High School Diploma | 2,978 (78.7%) | 341 (9.0%) |
| College / Associate Degree | 3,119 (68.5%) | 18 (0.4%) |
| Bachelor's Degree or higher | 4,282 (78.5%) | 185 (3.4%) |
| Total | 10,763 (73.7%) | 584 (4.0%) |
Employment Occupations by Sex in New Smyrna Beach
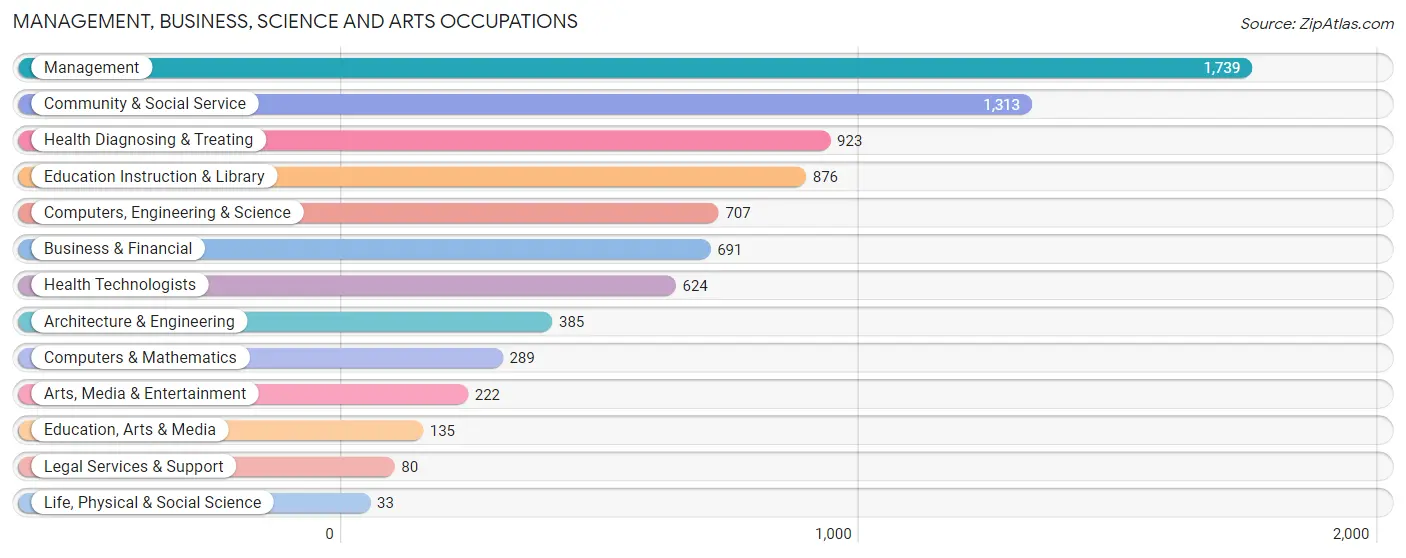
Management, Business, Science and Arts Occupations
The most common Management, Business, Science and Arts occupations in New Smyrna Beach are Management (1,739 | 14.4%), Community & Social Service (1,313 | 10.8%), Health Diagnosing & Treating (923 | 7.6%), Education Instruction & Library (876 | 7.2%), and Computers, Engineering & Science (707 | 5.8%).
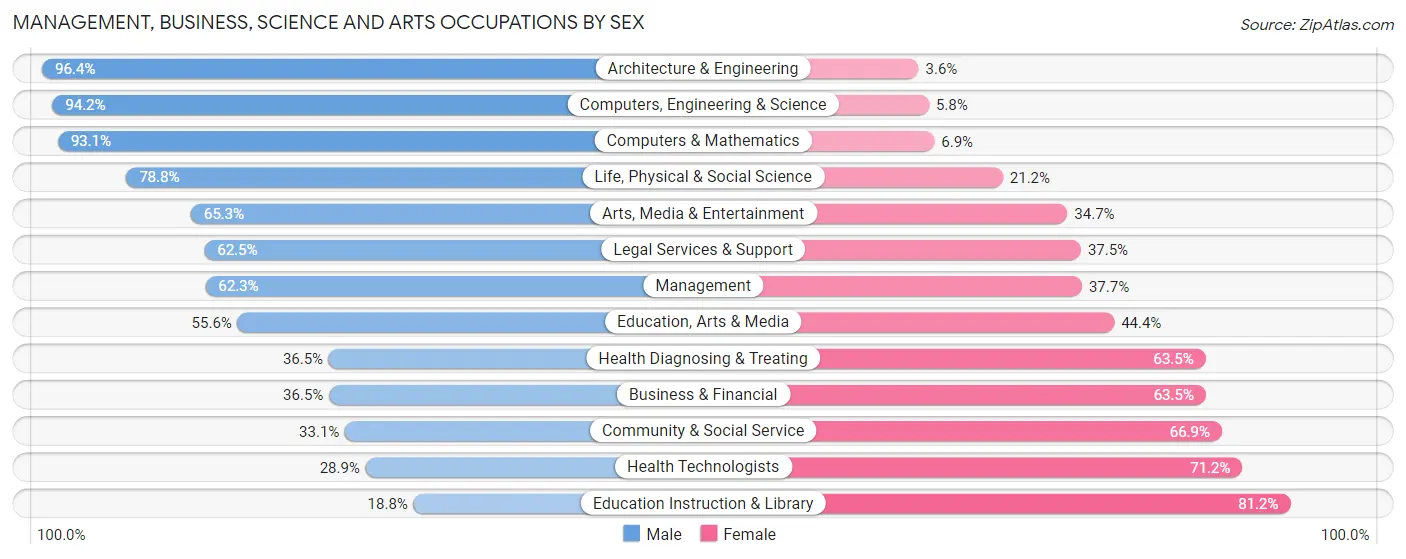
Management, Business, Science and Arts Occupations by Sex
Within the Management, Business, Science and Arts occupations in New Smyrna Beach, the most male-oriented occupations are Architecture & Engineering (96.4%), Computers, Engineering & Science (94.2%), and Computers & Mathematics (93.1%), while the most female-oriented occupations are Education Instruction & Library (81.2%), Health Technologists (71.2%), and Community & Social Service (66.9%).
| Occupation | Male | Female |
| Management | 1,083 (62.3%) | 656 (37.7%) |
| Business & Financial | 252 (36.5%) | 439 (63.5%) |
| Computers, Engineering & Science | 666 (94.2%) | 41 (5.8%) |
| Computers & Mathematics | 269 (93.1%) | 20 (6.9%) |
| Architecture & Engineering | 371 (96.4%) | 14 (3.6%) |
| Life, Physical & Social Science | 26 (78.8%) | 7 (21.2%) |
| Community & Social Service | 435 (33.1%) | 878 (66.9%) |
| Education, Arts & Media | 75 (55.6%) | 60 (44.4%) |
| Legal Services & Support | 50 (62.5%) | 30 (37.5%) |
| Education Instruction & Library | 165 (18.8%) | 711 (81.2%) |
| Arts, Media & Entertainment | 145 (65.3%) | 77 (34.7%) |
| Health Diagnosing & Treating | 337 (36.5%) | 586 (63.5%) |
| Health Technologists | 180 (28.8%) | 444 (71.2%) |
| Total (Category) | 2,773 (51.6%) | 2,600 (48.4%) |
| Total (Overall) | 6,679 (55.2%) | 5,417 (44.8%) |
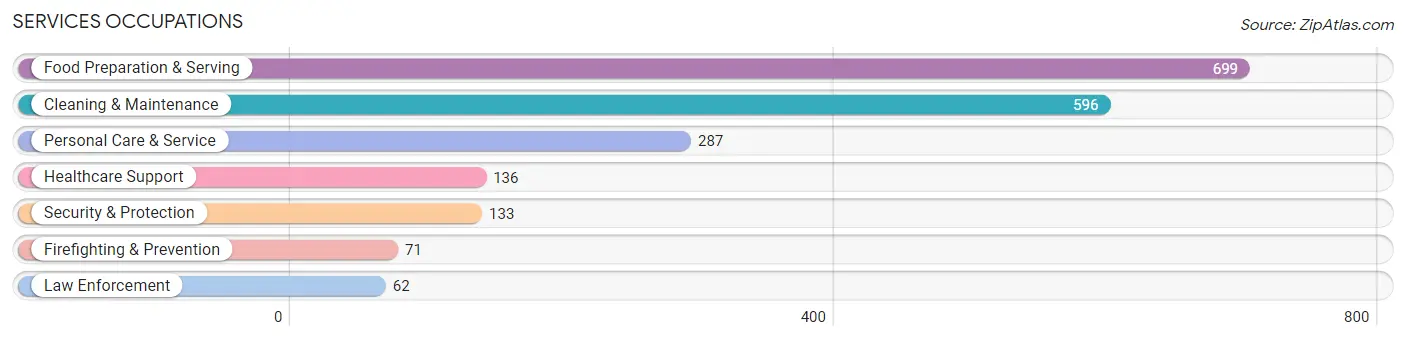
Services Occupations
The most common Services occupations in New Smyrna Beach are Food Preparation & Serving (699 | 5.8%), Cleaning & Maintenance (596 | 4.9%), Personal Care & Service (287 | 2.4%), Healthcare Support (136 | 1.1%), and Security & Protection (133 | 1.1%).
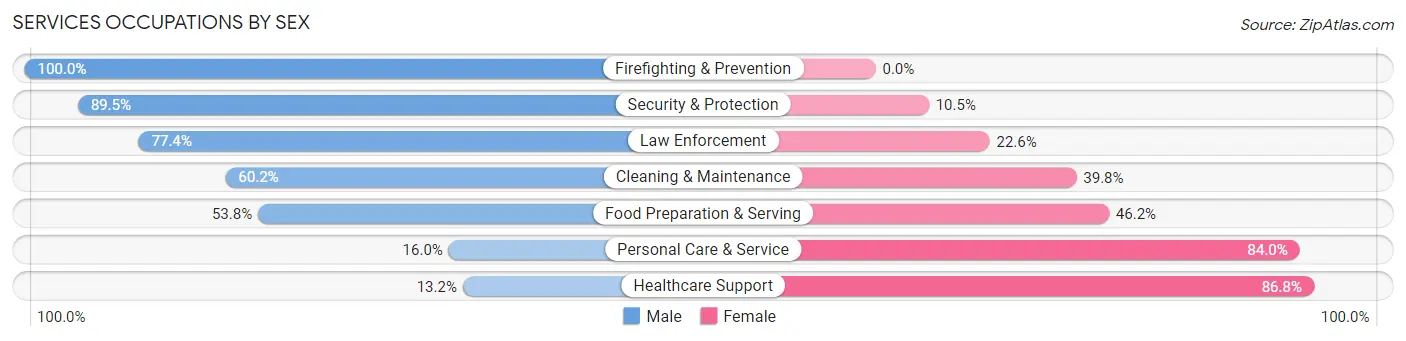
Services Occupations by Sex
Within the Services occupations in New Smyrna Beach, the most male-oriented occupations are Firefighting & Prevention (100.0%), Security & Protection (89.5%), and Law Enforcement (77.4%), while the most female-oriented occupations are Healthcare Support (86.8%), Personal Care & Service (84.0%), and Food Preparation & Serving (46.2%).
| Occupation | Male | Female |
| Healthcare Support | 18 (13.2%) | 118 (86.8%) |
| Security & Protection | 119 (89.5%) | 14 (10.5%) |
| Firefighting & Prevention | 71 (100.0%) | 0 (0.0%) |
| Law Enforcement | 48 (77.4%) | 14 (22.6%) |
| Food Preparation & Serving | 376 (53.8%) | 323 (46.2%) |
| Cleaning & Maintenance | 359 (60.2%) | 237 (39.8%) |
| Personal Care & Service | 46 (16.0%) | 241 (84.0%) |
| Total (Category) | 918 (49.6%) | 933 (50.4%) |
| Total (Overall) | 6,679 (55.2%) | 5,417 (44.8%) |
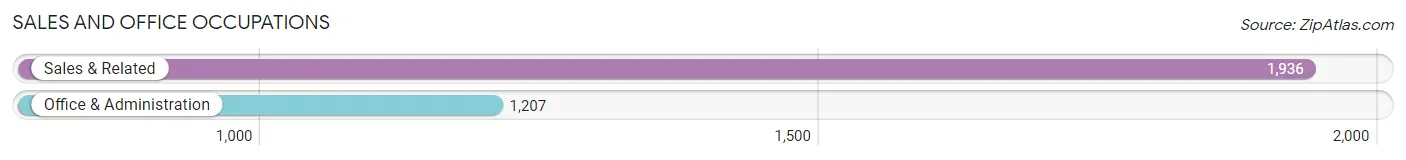
Sales and Office Occupations
The most common Sales and Office occupations in New Smyrna Beach are Sales & Related (1,936 | 16.0%), and Office & Administration (1,207 | 10.0%).
Sales and Office Occupations by Sex
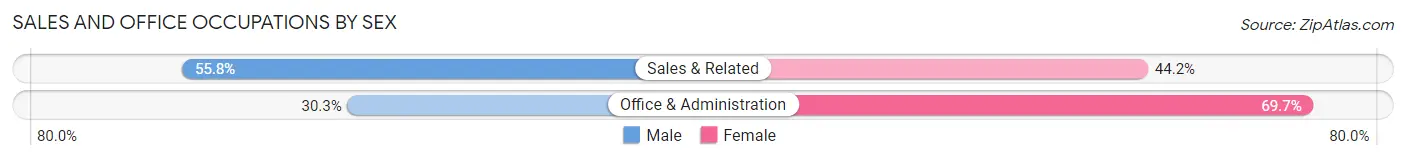
| Occupation | Male | Female |
| Sales & Related | 1,080 (55.8%) | 856 (44.2%) |
| Office & Administration | 366 (30.3%) | 841 (69.7%) |
| Total (Category) | 1,446 (46.0%) | 1,697 (54.0%) |
| Total (Overall) | 6,679 (55.2%) | 5,417 (44.8%) |
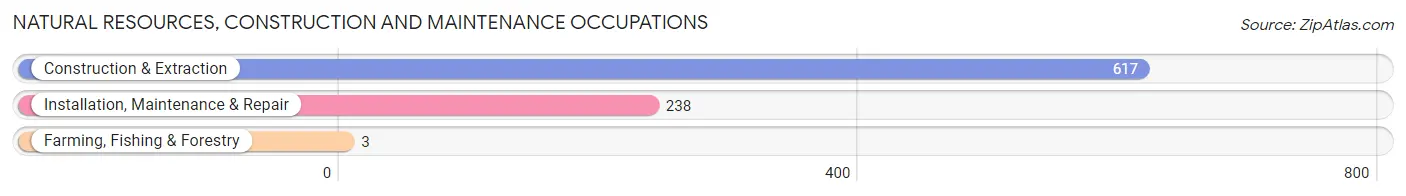
Natural Resources, Construction and Maintenance Occupations
The most common Natural Resources, Construction and Maintenance occupations in New Smyrna Beach are Construction & Extraction (617 | 5.1%), Installation, Maintenance & Repair (238 | 2.0%), and Farming, Fishing & Forestry (3 | 0.0%).
Natural Resources, Construction and Maintenance Occupations by Sex
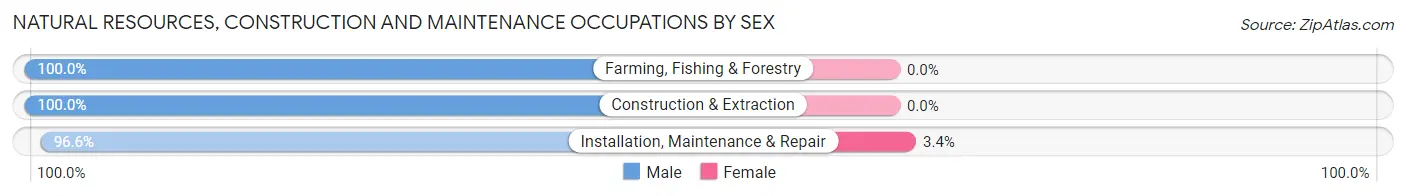
| Occupation | Male | Female |
| Farming, Fishing & Forestry | 3 (100.0%) | 0 (0.0%) |
| Construction & Extraction | 617 (100.0%) | 0 (0.0%) |
| Installation, Maintenance & Repair | 230 (96.6%) | 8 (3.4%) |
| Total (Category) | 850 (99.1%) | 8 (0.9%) |
| Total (Overall) | 6,679 (55.2%) | 5,417 (44.8%) |
Production, Transportation and Moving Occupations
The most common Production, Transportation and Moving occupations in New Smyrna Beach are Transportation (346 | 2.9%), Production (337 | 2.8%), and Material Moving (188 | 1.5%).
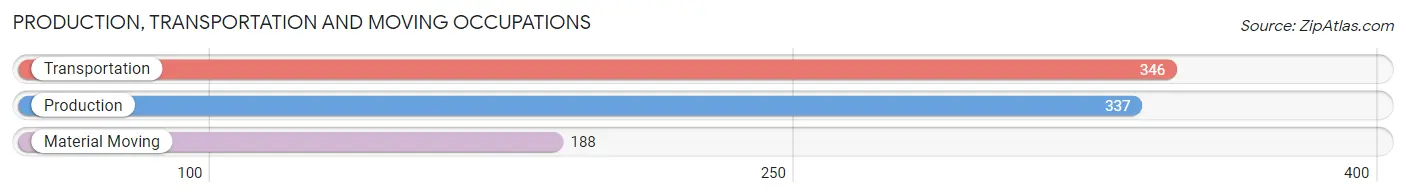
Production, Transportation and Moving Occupations by Sex
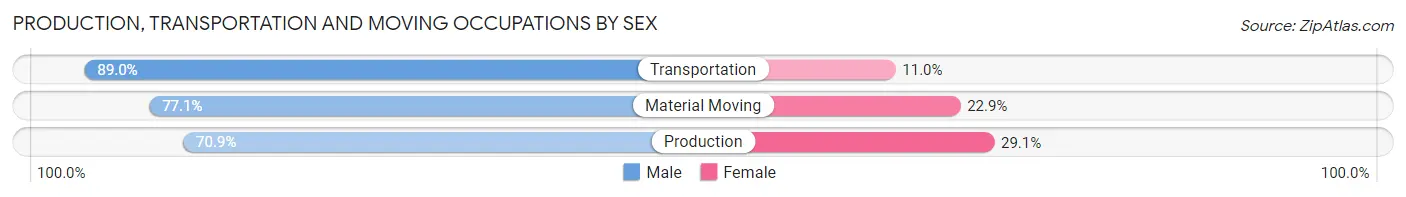
| Occupation | Male | Female |
| Production | 239 (70.9%) | 98 (29.1%) |
| Transportation | 308 (89.0%) | 38 (11.0%) |
| Material Moving | 145 (77.1%) | 43 (22.9%) |
| Total (Category) | 692 (79.4%) | 179 (20.5%) |
| Total (Overall) | 6,679 (55.2%) | 5,417 (44.8%) |
Employment Industries by Sex in New Smyrna Beach
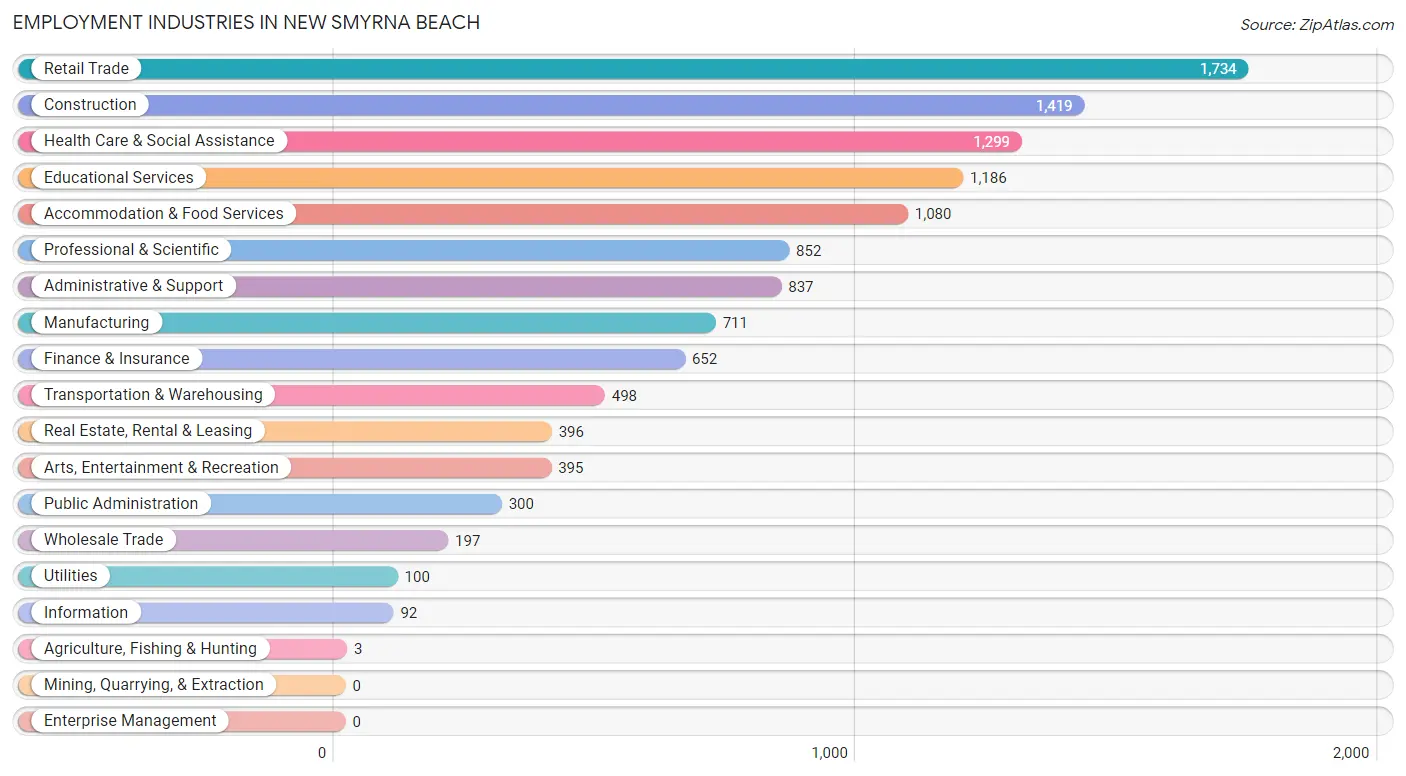
Employment Industries in New Smyrna Beach
The major employment industries in New Smyrna Beach include Retail Trade (1,734 | 14.3%), Construction (1,419 | 11.7%), Health Care & Social Assistance (1,299 | 10.7%), Educational Services (1,186 | 9.8%), and Accommodation & Food Services (1,080 | 8.9%).
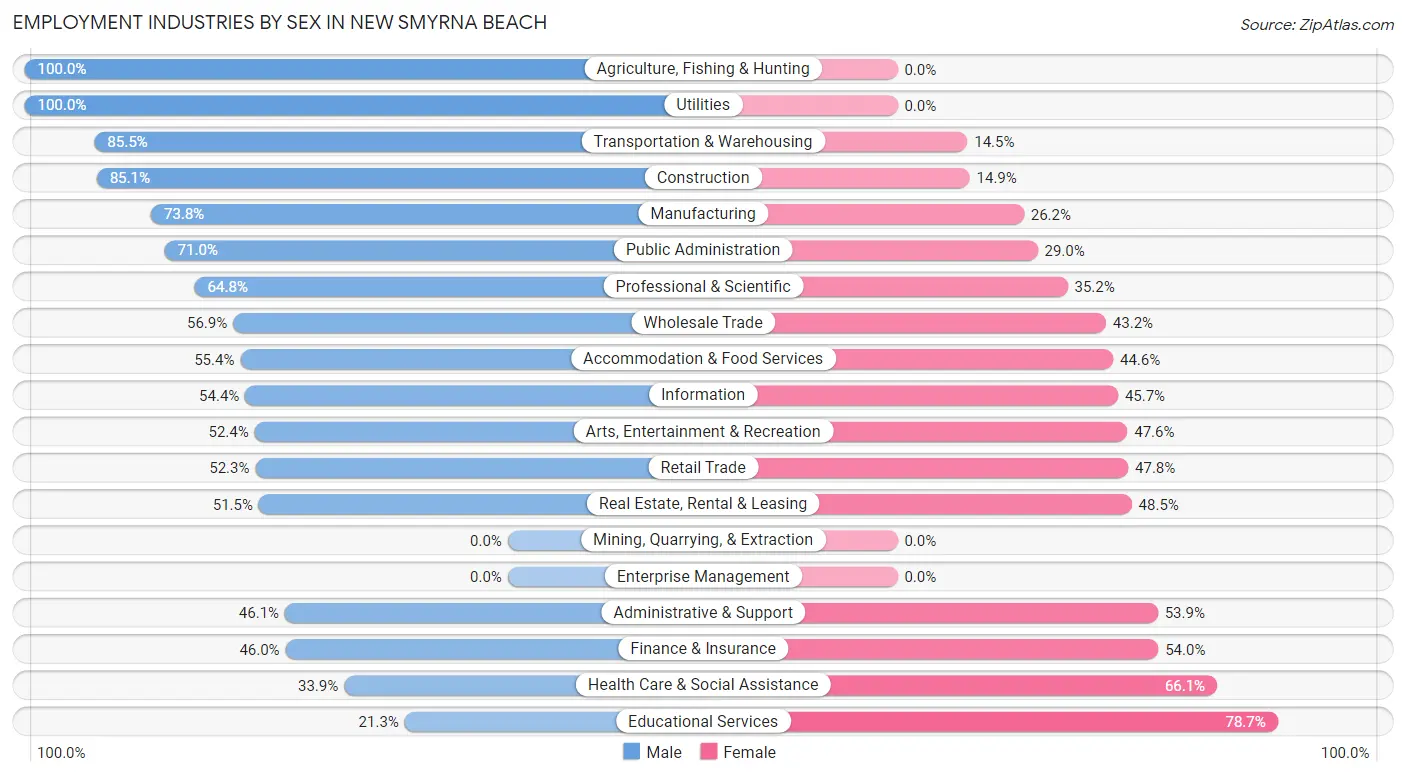
Employment Industries by Sex in New Smyrna Beach
The New Smyrna Beach industries that see more men than women are Agriculture, Fishing & Hunting (100.0%), Utilities (100.0%), and Transportation & Warehousing (85.5%), whereas the industries that tend to have a higher number of women are Educational Services (78.7%), Health Care & Social Assistance (66.1%), and Finance & Insurance (54.0%).
| Industry | Male | Female |
| Agriculture, Fishing & Hunting | 3 (100.0%) | 0 (0.0%) |
| Mining, Quarrying, & Extraction | 0 (0.0%) | 0 (0.0%) |
| Construction | 1,207 (85.1%) | 212 (14.9%) |
| Manufacturing | 525 (73.8%) | 186 (26.2%) |
| Wholesale Trade | 112 (56.9%) | 85 (43.1%) |
| Retail Trade | 906 (52.2%) | 828 (47.7%) |
| Transportation & Warehousing | 426 (85.5%) | 72 (14.5%) |
| Utilities | 100 (100.0%) | 0 (0.0%) |
| Information | 50 (54.3%) | 42 (45.7%) |
| Finance & Insurance | 300 (46.0%) | 352 (54.0%) |
| Real Estate, Rental & Leasing | 204 (51.5%) | 192 (48.5%) |
| Professional & Scientific | 552 (64.8%) | 300 (35.2%) |
| Enterprise Management | 0 (0.0%) | 0 (0.0%) |
| Administrative & Support | 386 (46.1%) | 451 (53.9%) |
| Educational Services | 253 (21.3%) | 933 (78.7%) |
| Health Care & Social Assistance | 440 (33.9%) | 859 (66.1%) |
| Arts, Entertainment & Recreation | 207 (52.4%) | 188 (47.6%) |
| Accommodation & Food Services | 598 (55.4%) | 482 (44.6%) |
| Public Administration | 213 (71.0%) | 87 (29.0%) |
| Total | 6,679 (55.2%) | 5,417 (44.8%) |
Education in New Smyrna Beach
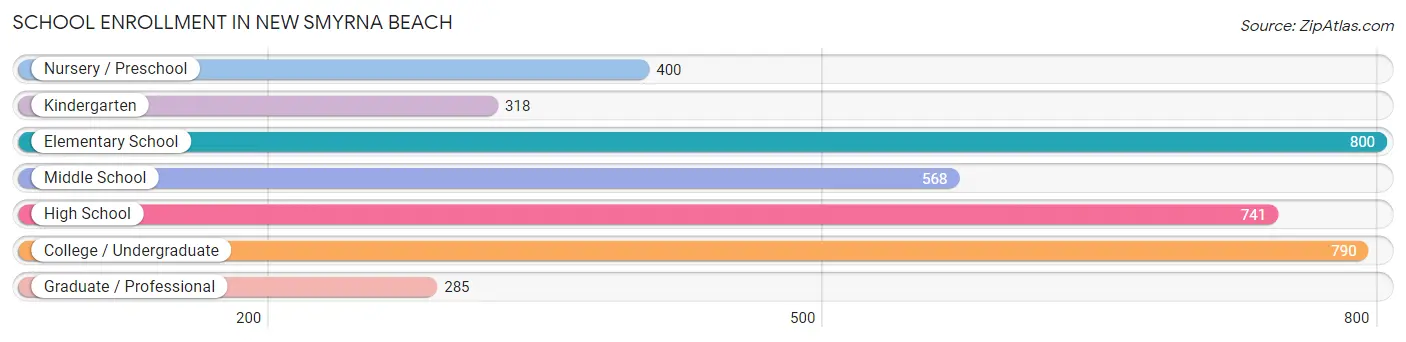
School Enrollment in New Smyrna Beach
The most common levels of schooling among the 3,902 students in New Smyrna Beach are elementary school (800 | 20.5%), college / undergraduate (790 | 20.3%), and high school (741 | 19.0%).
| School Level | # Students | % Students |
| Nursery / Preschool | 400 | 10.2% |
| Kindergarten | 318 | 8.2% |
| Elementary School | 800 | 20.5% |
| Middle School | 568 | 14.6% |
| High School | 741 | 19.0% |
| College / Undergraduate | 790 | 20.3% |
| Graduate / Professional | 285 | 7.3% |
| Total | 3,902 | 100.0% |
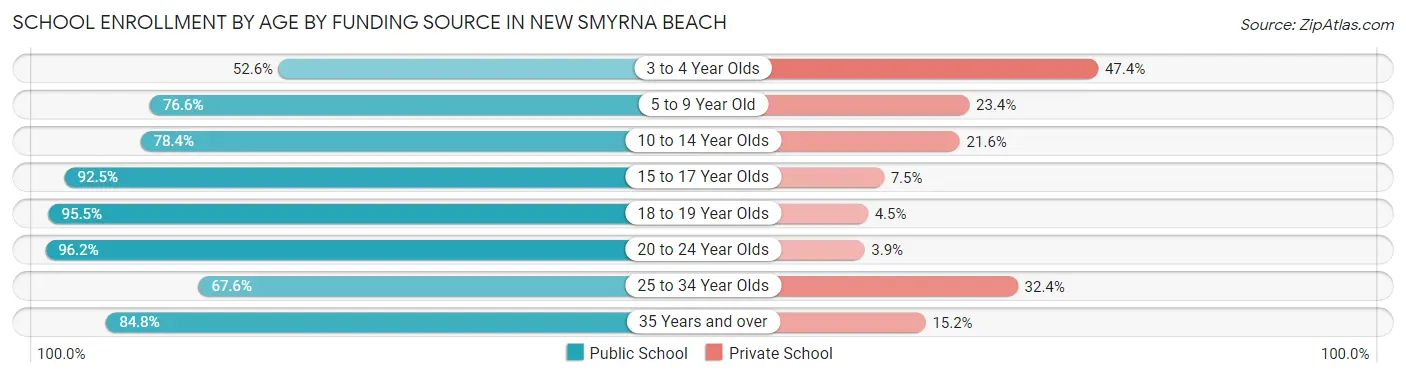
School Enrollment by Age by Funding Source in New Smyrna Beach
Out of a total of 3,902 students who are enrolled in schools in New Smyrna Beach, 757 (19.4%) attend a private institution, while the remaining 3,145 (80.6%) are enrolled in public schools. The age group of 3 to 4 year olds has the highest likelihood of being enrolled in private schools, with 144 (47.4% in the age bracket) enrolled. Conversely, the age group of 20 to 24 year olds has the lowest likelihood of being enrolled in a private school, with 250 (96.2% in the age bracket) attending a public institution.
| Age Bracket | Public School | Private School |
| 3 to 4 Year Olds | 160 (52.6%) | 144 (47.4%) |
| 5 to 9 Year Old | 784 (76.6%) | 239 (23.4%) |
| 10 to 14 Year Olds | 617 (78.4%) | 170 (21.6%) |
| 15 to 17 Year Olds | 558 (92.5%) | 45 (7.5%) |
| 18 to 19 Year Olds | 192 (95.5%) | 9 (4.5%) |
| 20 to 24 Year Olds | 250 (96.2%) | 10 (3.8%) |
| 25 to 34 Year Olds | 121 (67.6%) | 58 (32.4%) |
| 35 Years and over | 462 (84.8%) | 83 (15.2%) |
| Total | 3,145 (80.6%) | 757 (19.4%) |
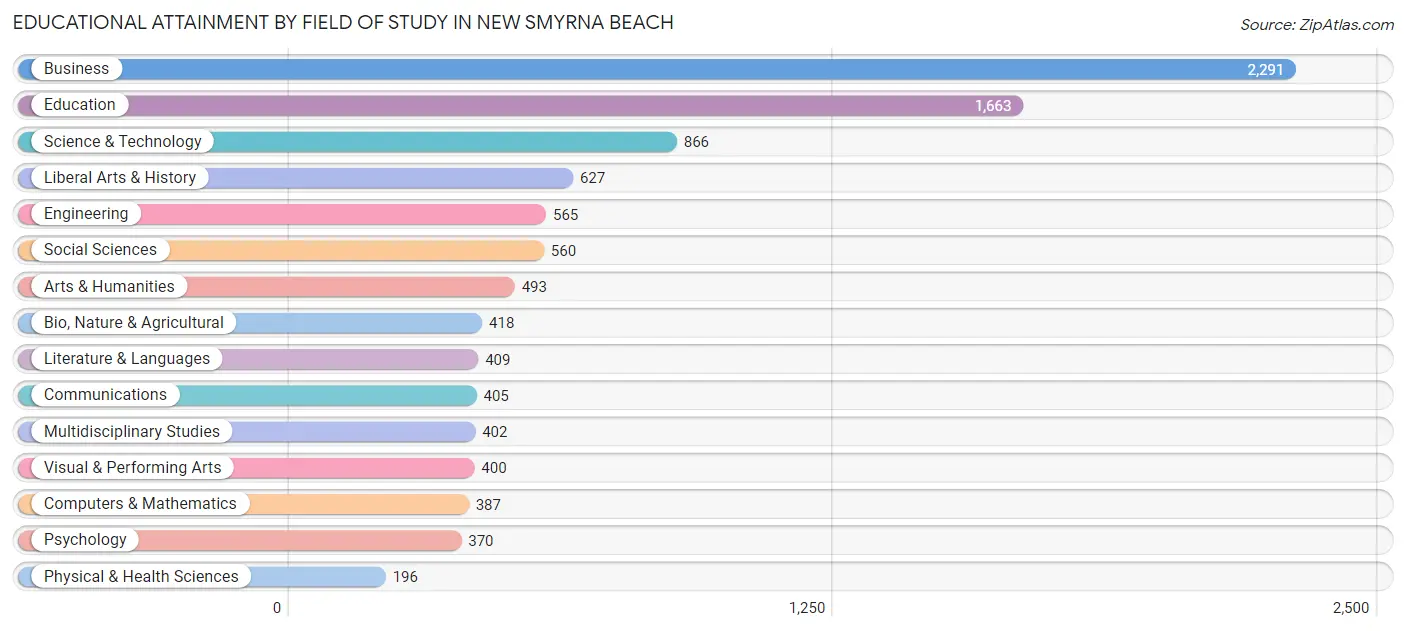
Educational Attainment by Field of Study in New Smyrna Beach
Business (2,291 | 22.8%), education (1,663 | 16.5%), science & technology (866 | 8.6%), liberal arts & history (627 | 6.2%), and engineering (565 | 5.6%) are the most common fields of study among 10,052 individuals in New Smyrna Beach who have obtained a bachelor's degree or higher.
| Field of Study | # Graduates | % Graduates |
| Computers & Mathematics | 387 | 3.8% |
| Bio, Nature & Agricultural | 418 | 4.2% |
| Physical & Health Sciences | 196 | 1.9% |
| Psychology | 370 | 3.7% |
| Social Sciences | 560 | 5.6% |
| Engineering | 565 | 5.6% |
| Multidisciplinary Studies | 402 | 4.0% |
| Science & Technology | 866 | 8.6% |
| Business | 2,291 | 22.8% |
| Education | 1,663 | 16.5% |
| Literature & Languages | 409 | 4.1% |
| Liberal Arts & History | 627 | 6.2% |
| Visual & Performing Arts | 400 | 4.0% |
| Communications | 405 | 4.0% |
| Arts & Humanities | 493 | 4.9% |
| Total | 10,052 | 100.0% |
Transportation & Commute in New Smyrna Beach
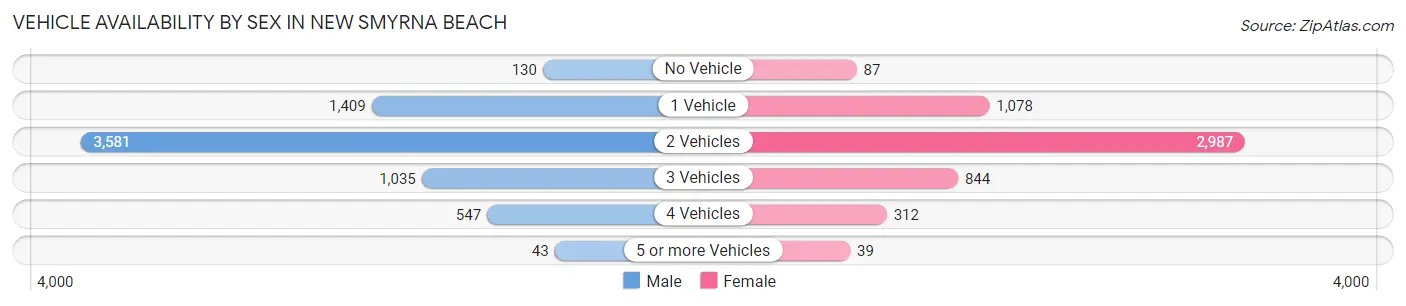
Vehicle Availability by Sex in New Smyrna Beach
The most prevalent vehicle ownership categories in New Smyrna Beach are males with 2 vehicles (3,581, accounting for 53.1%) and females with 2 vehicles (2,987, making up 67.0%).
| Vehicles Available | Male | Female |
| No Vehicle | 130 (1.9%) | 87 (1.6%) |
| 1 Vehicle | 1,409 (20.9%) | 1,078 (20.2%) |
| 2 Vehicles | 3,581 (53.1%) | 2,987 (55.9%) |
| 3 Vehicles | 1,035 (15.3%) | 844 (15.8%) |
| 4 Vehicles | 547 (8.1%) | 312 (5.8%) |
| 5 or more Vehicles | 43 (0.6%) | 39 (0.7%) |
| Total | 6,745 (100.0%) | 5,347 (100.0%) |
Commute Time in New Smyrna Beach
The most frequently occuring commute durations in New Smyrna Beach are 30 to 34 minutes (1,604 commuters, 16.4%), 20 to 24 minutes (1,552 commuters, 15.9%), and 5 to 9 minutes (1,059 commuters, 10.8%).
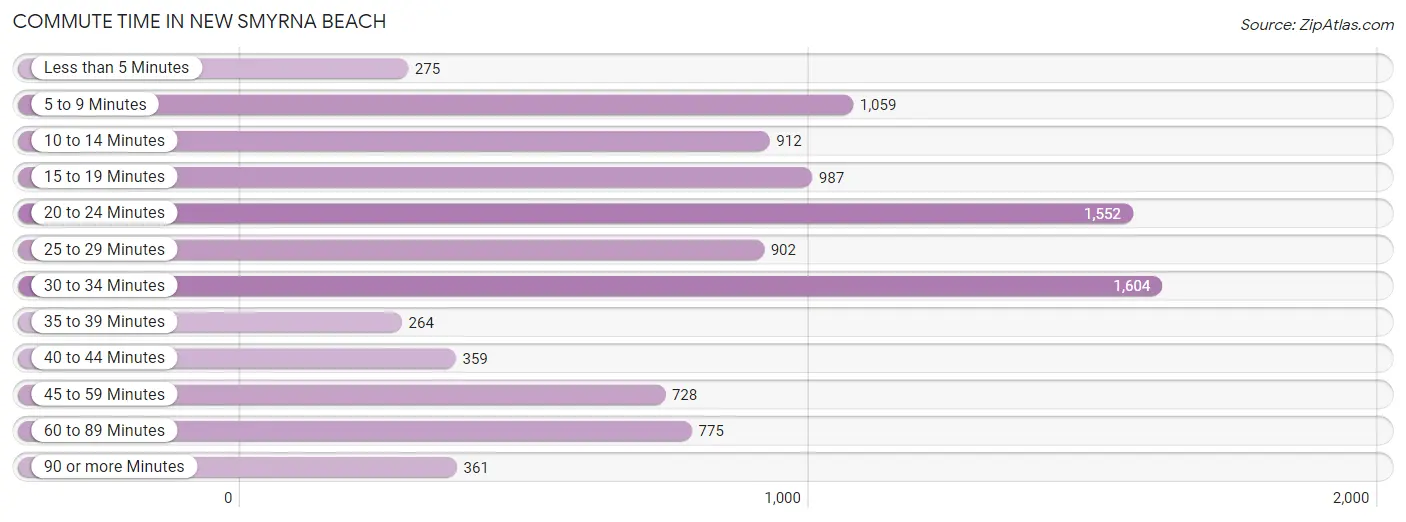
| Commute Time | # Commuters | % Commuters |
| Less than 5 Minutes | 275 | 2.8% |
| 5 to 9 Minutes | 1,059 | 10.8% |
| 10 to 14 Minutes | 912 | 9.3% |
| 15 to 19 Minutes | 987 | 10.1% |
| 20 to 24 Minutes | 1,552 | 15.9% |
| 25 to 29 Minutes | 902 | 9.2% |
| 30 to 34 Minutes | 1,604 | 16.4% |
| 35 to 39 Minutes | 264 | 2.7% |
| 40 to 44 Minutes | 359 | 3.7% |
| 45 to 59 Minutes | 728 | 7.4% |
| 60 to 89 Minutes | 775 | 7.9% |
| 90 or more Minutes | 361 | 3.7% |
Commute Time by Sex in New Smyrna Beach
The most common commute times in New Smyrna Beach are 20 to 24 minutes (1,121 commuters, 21.0%) for males and 30 to 34 minutes (676 commuters, 15.2%) for females.
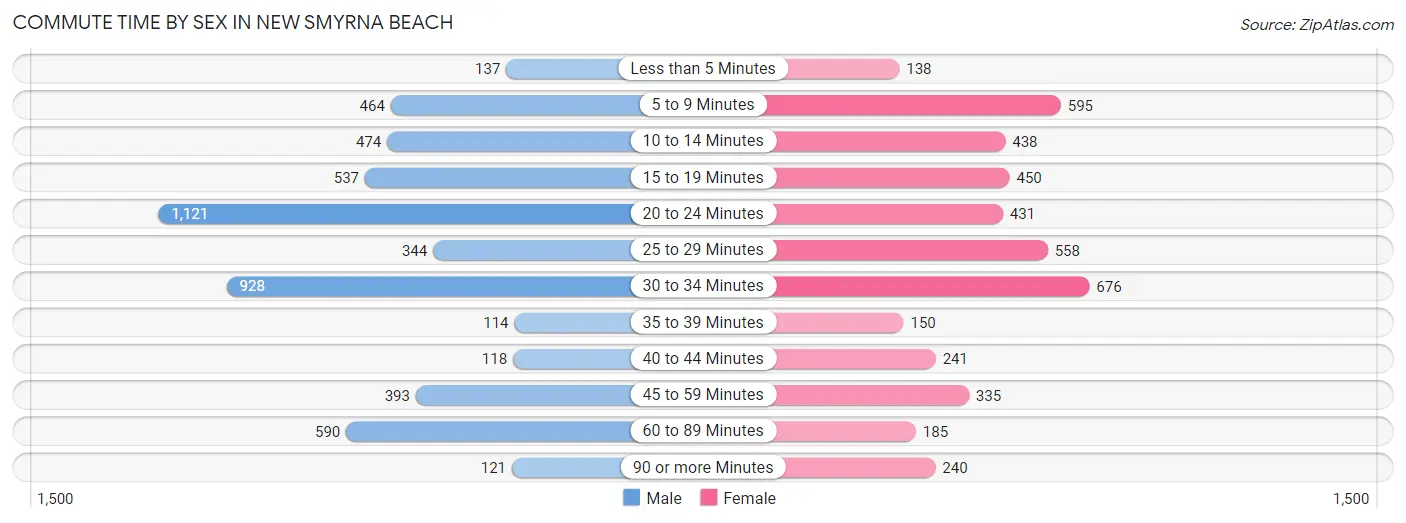
| Commute Time | Male | Female |
| Less than 5 Minutes | 137 (2.6%) | 138 (3.1%) |
| 5 to 9 Minutes | 464 (8.7%) | 595 (13.4%) |
| 10 to 14 Minutes | 474 (8.9%) | 438 (9.9%) |
| 15 to 19 Minutes | 537 (10.1%) | 450 (10.1%) |
| 20 to 24 Minutes | 1,121 (21.0%) | 431 (9.7%) |
| 25 to 29 Minutes | 344 (6.4%) | 558 (12.6%) |
| 30 to 34 Minutes | 928 (17.4%) | 676 (15.2%) |
| 35 to 39 Minutes | 114 (2.1%) | 150 (3.4%) |
| 40 to 44 Minutes | 118 (2.2%) | 241 (5.4%) |
| 45 to 59 Minutes | 393 (7.4%) | 335 (7.5%) |
| 60 to 89 Minutes | 590 (11.1%) | 185 (4.2%) |
| 90 or more Minutes | 121 (2.3%) | 240 (5.4%) |
Time of Departure to Work by Sex in New Smyrna Beach
The most frequent times of departure to work in New Smyrna Beach are 7:30 AM to 7:59 AM (869, 16.3%) for males and 7:00 AM to 7:29 AM (703, 15.8%) for females.
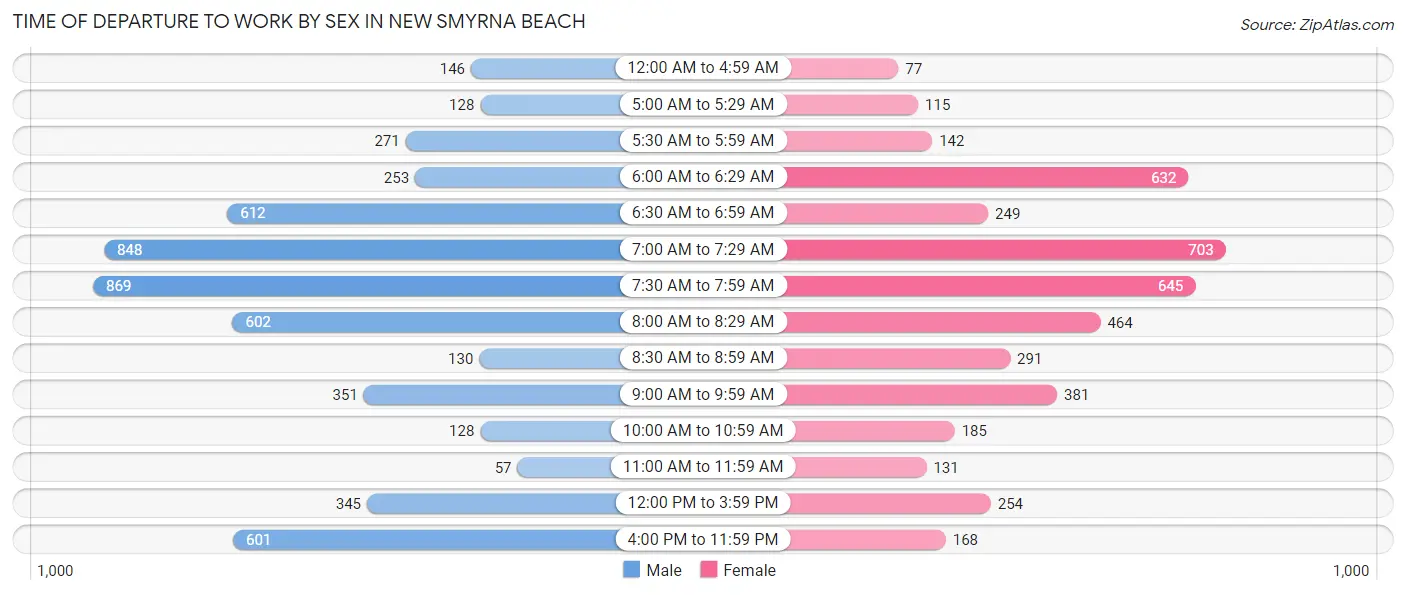
| Time of Departure | Male | Female |
| 12:00 AM to 4:59 AM | 146 (2.7%) | 77 (1.7%) |
| 5:00 AM to 5:29 AM | 128 (2.4%) | 115 (2.6%) |
| 5:30 AM to 5:59 AM | 271 (5.1%) | 142 (3.2%) |
| 6:00 AM to 6:29 AM | 253 (4.7%) | 632 (14.2%) |
| 6:30 AM to 6:59 AM | 612 (11.5%) | 249 (5.6%) |
| 7:00 AM to 7:29 AM | 848 (15.9%) | 703 (15.8%) |
| 7:30 AM to 7:59 AM | 869 (16.3%) | 645 (14.5%) |
| 8:00 AM to 8:29 AM | 602 (11.3%) | 464 (10.5%) |
| 8:30 AM to 8:59 AM | 130 (2.4%) | 291 (6.6%) |
| 9:00 AM to 9:59 AM | 351 (6.6%) | 381 (8.6%) |
| 10:00 AM to 10:59 AM | 128 (2.4%) | 185 (4.2%) |
| 11:00 AM to 11:59 AM | 57 (1.1%) | 131 (2.9%) |
| 12:00 PM to 3:59 PM | 345 (6.5%) | 254 (5.7%) |
| 4:00 PM to 11:59 PM | 601 (11.3%) | 168 (3.8%) |
| Total | 5,341 (100.0%) | 4,437 (100.0%) |
Housing Occupancy in New Smyrna Beach
Occupancy by Ownership in New Smyrna Beach
Of the total 14,979 dwellings in New Smyrna Beach, owner-occupied units account for 11,343 (75.7%), while renter-occupied units make up 3,636 (24.3%).
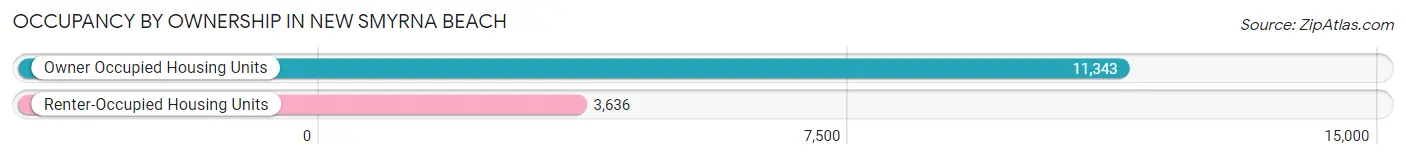
| Occupancy | # Housing Units | % Housing Units |
| Owner Occupied Housing Units | 11,343 | 75.7% |
| Renter-Occupied Housing Units | 3,636 | 24.3% |
| Total Occupied Housing Units | 14,979 | 100.0% |
Occupancy by Household Size in New Smyrna Beach
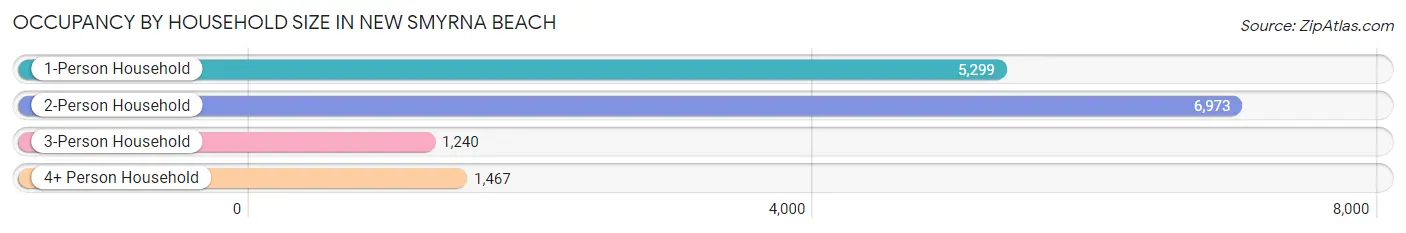
| Household Size | # Housing Units | % Housing Units |
| 1-Person Household | 5,299 | 35.4% |
| 2-Person Household | 6,973 | 46.6% |
| 3-Person Household | 1,240 | 8.3% |
| 4+ Person Household | 1,467 | 9.8% |
| Total Housing Units | 14,979 | 100.0% |
Occupancy by Ownership by Household Size in New Smyrna Beach
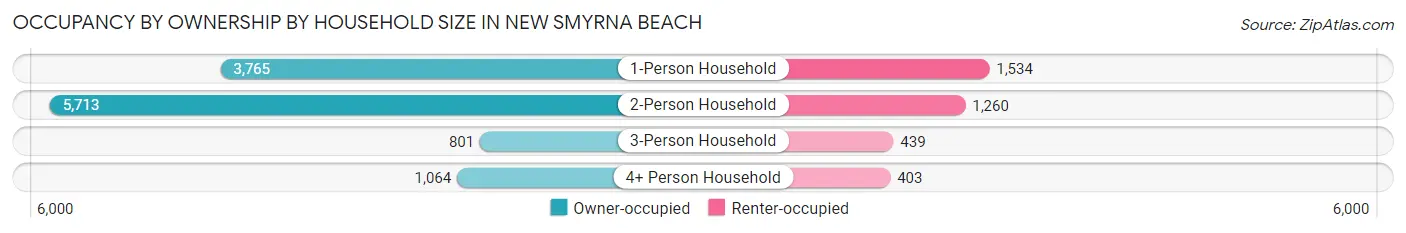
| Household Size | Owner-occupied | Renter-occupied |
| 1-Person Household | 3,765 (71.1%) | 1,534 (28.9%) |
| 2-Person Household | 5,713 (81.9%) | 1,260 (18.1%) |
| 3-Person Household | 801 (64.6%) | 439 (35.4%) |
| 4+ Person Household | 1,064 (72.5%) | 403 (27.5%) |
| Total Housing Units | 11,343 (75.7%) | 3,636 (24.3%) |
Occupancy by Educational Attainment in New Smyrna Beach
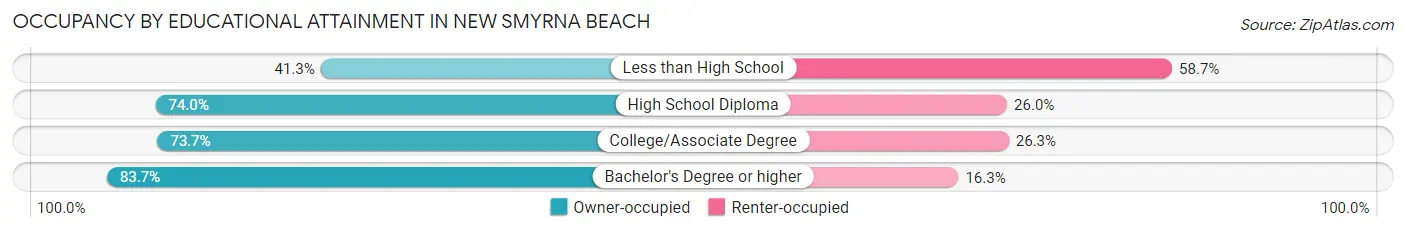
| Household Size | Owner-occupied | Renter-occupied |
| Less than High School | 383 (41.3%) | 544 (58.7%) |
| High School Diploma | 2,295 (74.0%) | 805 (26.0%) |
| College/Associate Degree | 3,685 (73.7%) | 1,316 (26.3%) |
| Bachelor's Degree or higher | 4,980 (83.7%) | 971 (16.3%) |
Occupancy by Age of Householder in New Smyrna Beach
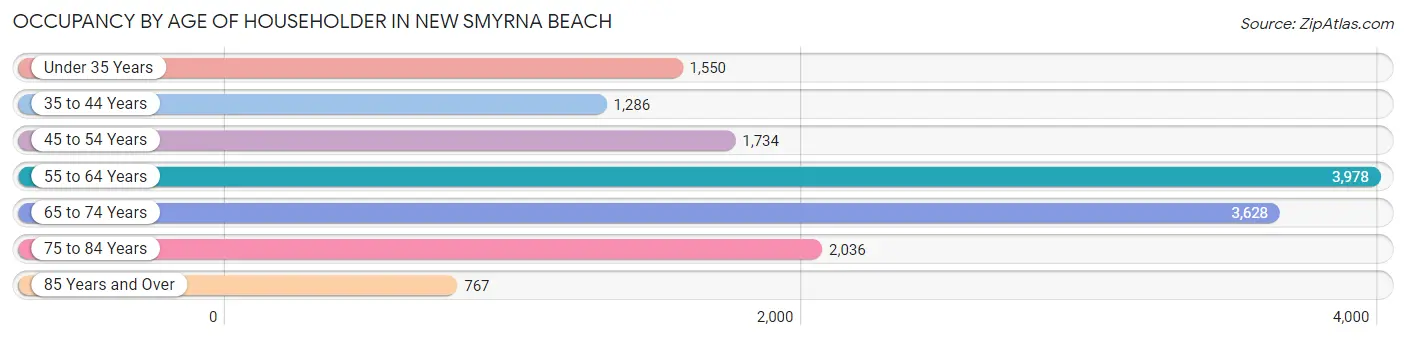
| Age Bracket | # Households | % Households |
| Under 35 Years | 1,550 | 10.3% |
| 35 to 44 Years | 1,286 | 8.6% |
| 45 to 54 Years | 1,734 | 11.6% |
| 55 to 64 Years | 3,978 | 26.6% |
| 65 to 74 Years | 3,628 | 24.2% |
| 75 to 84 Years | 2,036 | 13.6% |
| 85 Years and Over | 767 | 5.1% |
| Total | 14,979 | 100.0% |
Housing Finances in New Smyrna Beach
Median Income by Occupancy in New Smyrna Beach
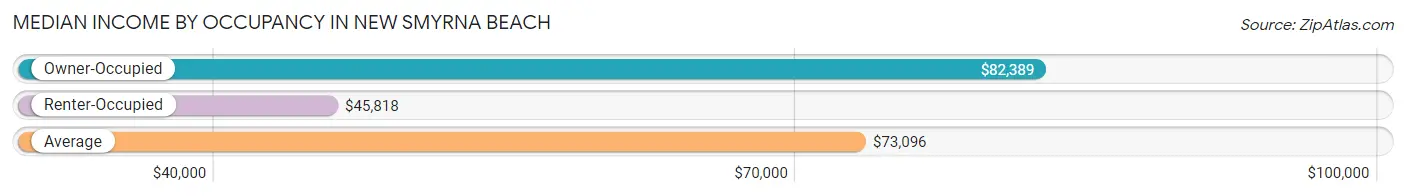
| Occupancy Type | # Households | Median Income |
| Owner-Occupied | 11,343 (75.7%) | $82,389 |
| Renter-Occupied | 3,636 (24.3%) | $45,818 |
| Average | 14,979 (100.0%) | $73,096 |
Occupancy by Householder Income Bracket in New Smyrna Beach
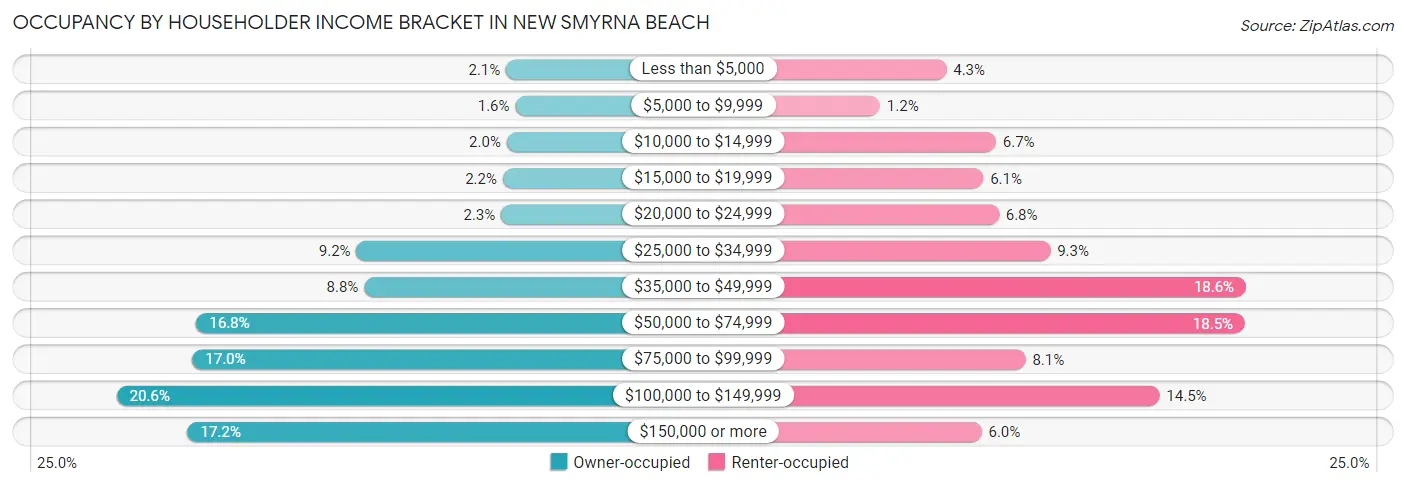
| Income Bracket | Owner-occupied | Renter-occupied |
| Less than $5,000 | 235 (2.1%) | 157 (4.3%) |
| $5,000 to $9,999 | 185 (1.6%) | 42 (1.2%) |
| $10,000 to $14,999 | 231 (2.0%) | 243 (6.7%) |
| $15,000 to $19,999 | 253 (2.2%) | 221 (6.1%) |
| $20,000 to $24,999 | 262 (2.3%) | 248 (6.8%) |
| $25,000 to $34,999 | 1,044 (9.2%) | 337 (9.3%) |
| $35,000 to $49,999 | 1,002 (8.8%) | 676 (18.6%) |
| $50,000 to $74,999 | 1,908 (16.8%) | 674 (18.5%) |
| $75,000 to $99,999 | 1,929 (17.0%) | 294 (8.1%) |
| $100,000 to $149,999 | 2,339 (20.6%) | 526 (14.5%) |
| $150,000 or more | 1,955 (17.2%) | 218 (6.0%) |
| Total | 11,343 (100.0%) | 3,636 (100.0%) |
Monthly Housing Cost Tiers in New Smyrna Beach
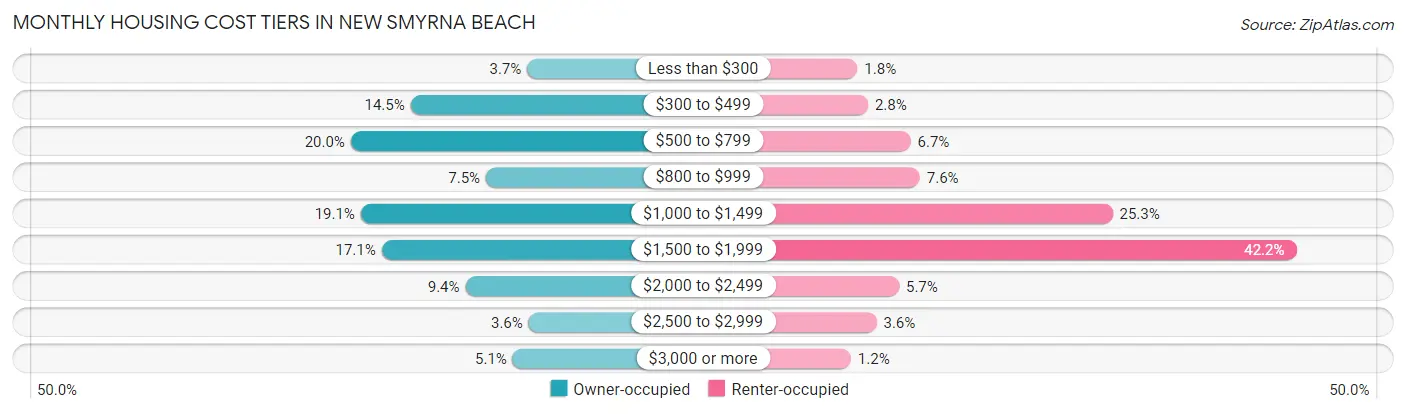
| Monthly Cost | Owner-occupied | Renter-occupied |
| Less than $300 | 424 (3.7%) | 67 (1.8%) |
| $300 to $499 | 1,641 (14.5%) | 102 (2.8%) |
| $500 to $799 | 2,266 (20.0%) | 245 (6.7%) |
| $800 to $999 | 854 (7.5%) | 276 (7.6%) |
| $1,000 to $1,499 | 2,162 (19.1%) | 921 (25.3%) |
| $1,500 to $1,999 | 1,944 (17.1%) | 1,536 (42.2%) |
| $2,000 to $2,499 | 1,069 (9.4%) | 206 (5.7%) |
| $2,500 to $2,999 | 408 (3.6%) | 131 (3.6%) |
| $3,000 or more | 575 (5.1%) | 45 (1.2%) |
| Total | 11,343 (100.0%) | 3,636 (100.0%) |
Physical Housing Characteristics in New Smyrna Beach
Housing Structures in New Smyrna Beach
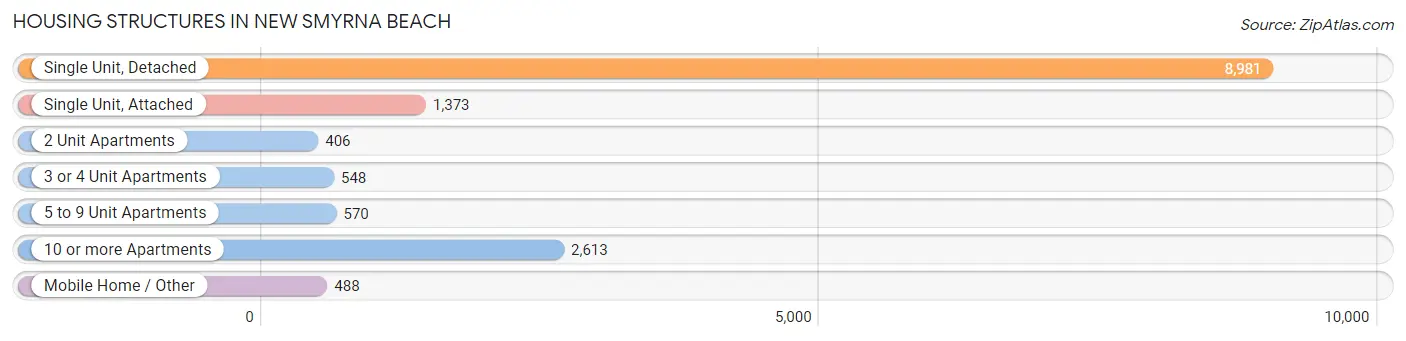
| Structure Type | # Housing Units | % Housing Units |
| Single Unit, Detached | 8,981 | 60.0% |
| Single Unit, Attached | 1,373 | 9.2% |
| 2 Unit Apartments | 406 | 2.7% |
| 3 or 4 Unit Apartments | 548 | 3.7% |
| 5 to 9 Unit Apartments | 570 | 3.8% |
| 10 or more Apartments | 2,613 | 17.4% |
| Mobile Home / Other | 488 | 3.3% |
| Total | 14,979 | 100.0% |
Housing Structures by Occupancy in New Smyrna Beach
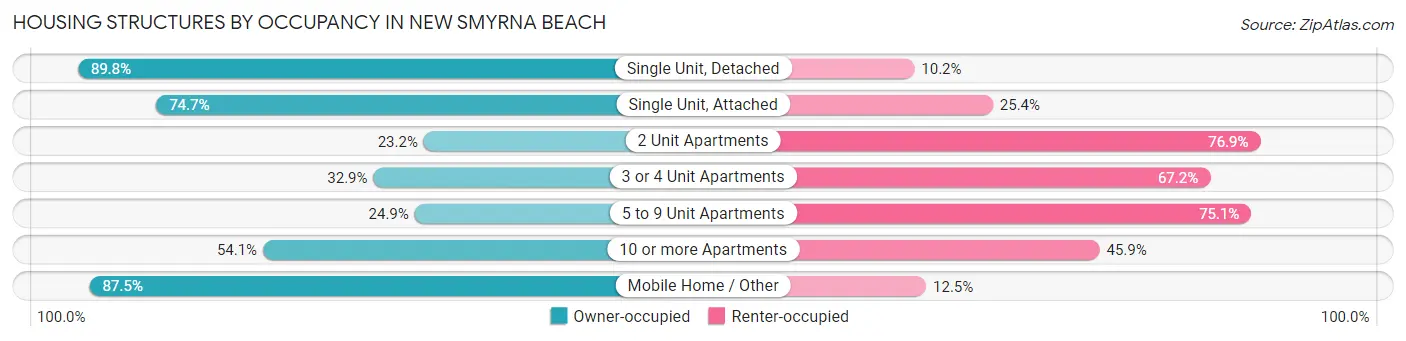
| Structure Type | Owner-occupied | Renter-occupied |
| Single Unit, Detached | 8,061 (89.8%) | 920 (10.2%) |
| Single Unit, Attached | 1,025 (74.7%) | 348 (25.4%) |
| 2 Unit Apartments | 94 (23.2%) | 312 (76.8%) |
| 3 or 4 Unit Apartments | 180 (32.9%) | 368 (67.1%) |
| 5 to 9 Unit Apartments | 142 (24.9%) | 428 (75.1%) |
| 10 or more Apartments | 1,414 (54.1%) | 1,199 (45.9%) |
| Mobile Home / Other | 427 (87.5%) | 61 (12.5%) |
| Total | 11,343 (75.7%) | 3,636 (24.3%) |
Housing Structures by Number of Rooms in New Smyrna Beach
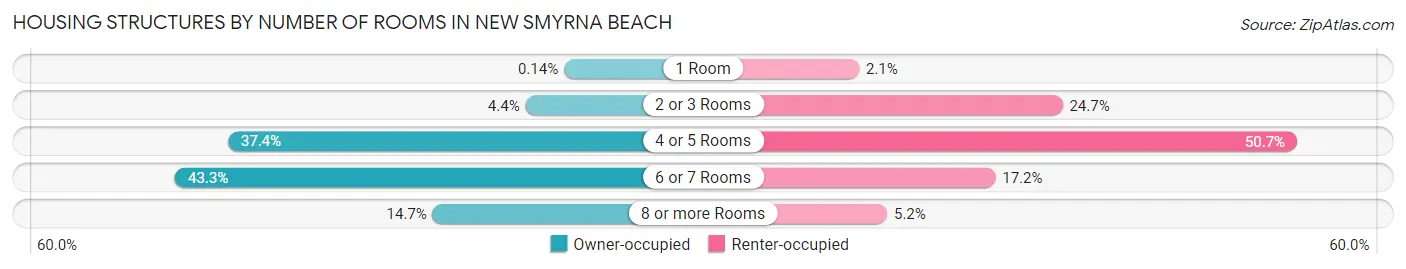
| Number of Rooms | Owner-occupied | Renter-occupied |
| 1 Room | 16 (0.1%) | 77 (2.1%) |
| 2 or 3 Rooms | 500 (4.4%) | 898 (24.7%) |
| 4 or 5 Rooms | 4,247 (37.4%) | 1,844 (50.7%) |
| 6 or 7 Rooms | 4,911 (43.3%) | 627 (17.2%) |
| 8 or more Rooms | 1,669 (14.7%) | 190 (5.2%) |
| Total | 11,343 (100.0%) | 3,636 (100.0%) |
Housing Structure by Heating Type in New Smyrna Beach
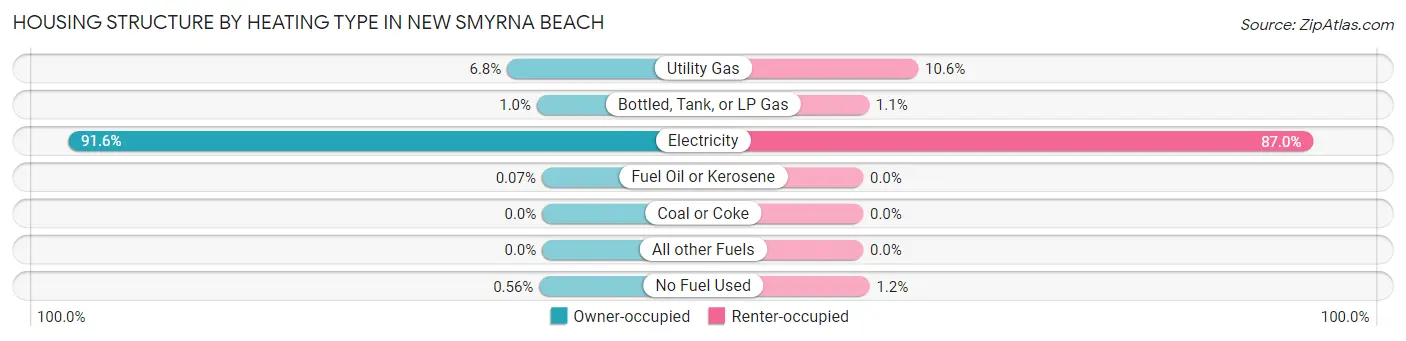
| Heating Type | Owner-occupied | Renter-occupied |
| Utility Gas | 767 (6.8%) | 387 (10.6%) |
| Bottled, Tank, or LP Gas | 115 (1.0%) | 41 (1.1%) |
| Electricity | 10,389 (91.6%) | 3,163 (87.0%) |
| Fuel Oil or Kerosene | 8 (0.1%) | 0 (0.0%) |
| Coal or Coke | 0 (0.0%) | 0 (0.0%) |
| All other Fuels | 0 (0.0%) | 0 (0.0%) |
| No Fuel Used | 64 (0.6%) | 45 (1.2%) |
| Total | 11,343 (100.0%) | 3,636 (100.0%) |
Household Vehicle Usage in New Smyrna Beach
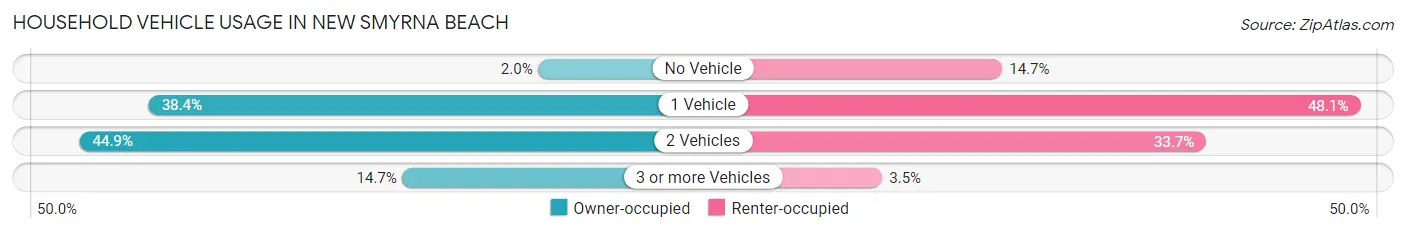
| Vehicles per Household | Owner-occupied | Renter-occupied |
| No Vehicle | 230 (2.0%) | 534 (14.7%) |
| 1 Vehicle | 4,357 (38.4%) | 1,749 (48.1%) |
| 2 Vehicles | 5,088 (44.9%) | 1,226 (33.7%) |
| 3 or more Vehicles | 1,668 (14.7%) | 127 (3.5%) |
| Total | 11,343 (100.0%) | 3,636 (100.0%) |
Real Estate & Mortgages in New Smyrna Beach
Real Estate and Mortgage Overview in New Smyrna Beach
| Characteristic | Without Mortgage | With Mortgage |
| Housing Units | 5,658 | 5,685 |
| Median Property Value | $298,400 | $350,200 |
| Median Household Income | $64,636 | $1,292 |
| Monthly Housing Costs | $617 | $566 |
| Real Estate Taxes | $2,500 | $124 |
Property Value by Mortgage Status in New Smyrna Beach
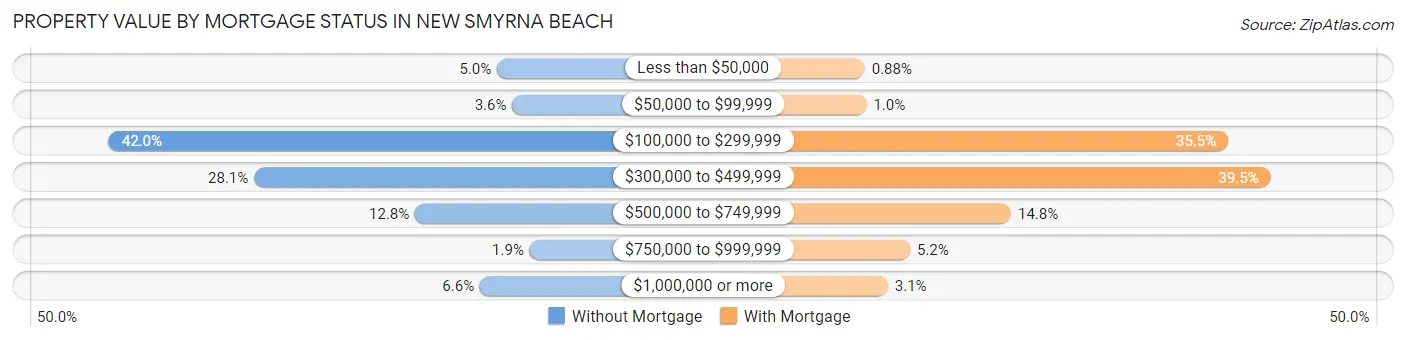
| Property Value | Without Mortgage | With Mortgage |
| Less than $50,000 | 283 (5.0%) | 50 (0.9%) |
| $50,000 to $99,999 | 201 (3.5%) | 59 (1.0%) |
| $100,000 to $299,999 | 2,375 (42.0%) | 2,017 (35.5%) |
| $300,000 to $499,999 | 1,592 (28.1%) | 2,247 (39.5%) |
| $500,000 to $749,999 | 725 (12.8%) | 842 (14.8%) |
| $750,000 to $999,999 | 107 (1.9%) | 295 (5.2%) |
| $1,000,000 or more | 375 (6.6%) | 175 (3.1%) |
| Total | 5,658 (100.0%) | 5,685 (100.0%) |
Household Income by Mortgage Status in New Smyrna Beach
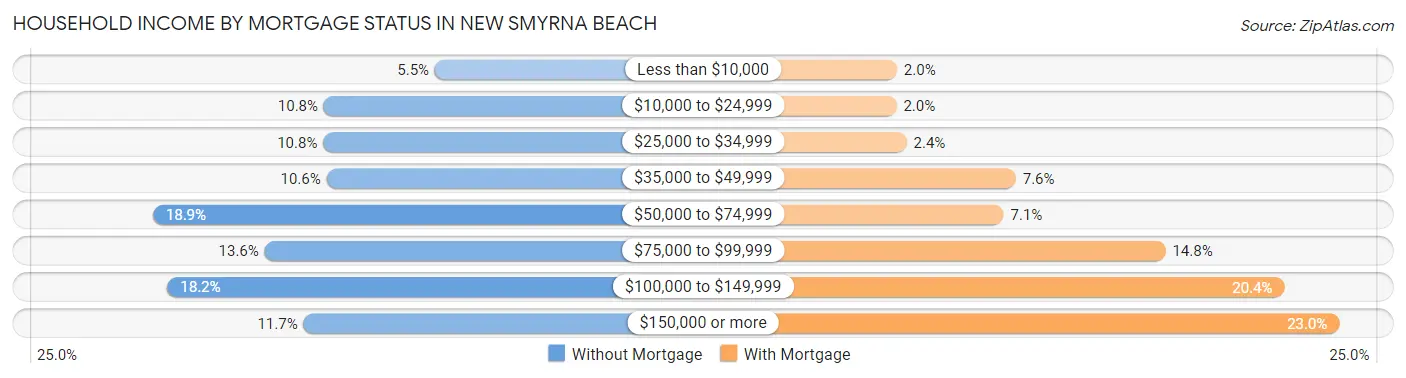
| Household Income | Without Mortgage | With Mortgage |
| Less than $10,000 | 309 (5.5%) | 112 (2.0%) |
| $10,000 to $24,999 | 608 (10.7%) | 111 (1.9%) |
| $25,000 to $34,999 | 610 (10.8%) | 138 (2.4%) |
| $35,000 to $49,999 | 601 (10.6%) | 434 (7.6%) |
| $50,000 to $74,999 | 1,069 (18.9%) | 401 (7.0%) |
| $75,000 to $99,999 | 768 (13.6%) | 839 (14.8%) |
| $100,000 to $149,999 | 1,030 (18.2%) | 1,161 (20.4%) |
| $150,000 or more | 663 (11.7%) | 1,309 (23.0%) |
| Total | 5,658 (100.0%) | 5,685 (100.0%) |
Property Value to Household Income Ratio in New Smyrna Beach
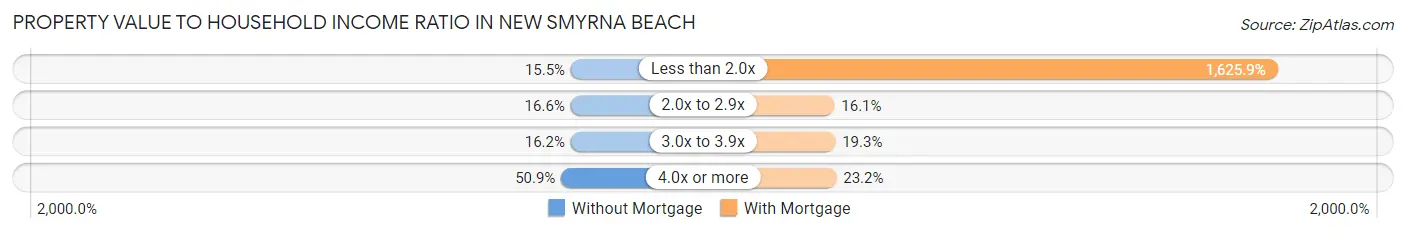
| Value-to-Income Ratio | Without Mortgage | With Mortgage |
| Less than 2.0x | 878 (15.5%) | 92,431 (1,625.9%) |
| 2.0x to 2.9x | 940 (16.6%) | 917 (16.1%) |
| 3.0x to 3.9x | 914 (16.2%) | 1,095 (19.3%) |
| 4.0x or more | 2,881 (50.9%) | 1,318 (23.2%) |
| Total | 5,658 (100.0%) | 5,685 (100.0%) |
Real Estate Taxes by Mortgage Status in New Smyrna Beach
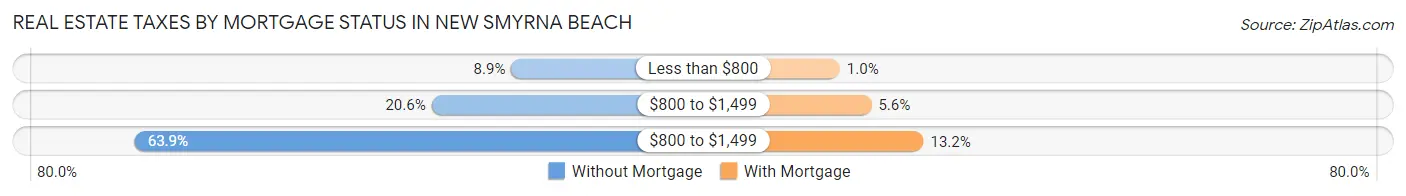
| Property Taxes | Without Mortgage | With Mortgage |
| Less than $800 | 503 (8.9%) | 57 (1.0%) |
| $800 to $1,499 | 1,163 (20.5%) | 319 (5.6%) |
| $800 to $1,499 | 3,615 (63.9%) | 752 (13.2%) |
| Total | 5,658 (100.0%) | 5,685 (100.0%) |
Health & Disability in New Smyrna Beach
Health Insurance Coverage by Age in New Smyrna Beach
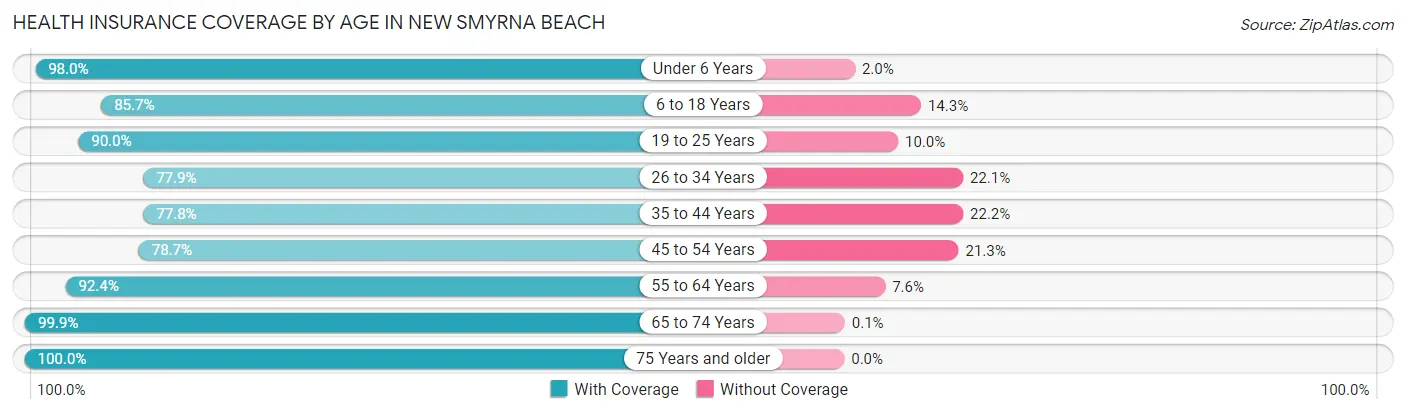
| Age Bracket | With Coverage | Without Coverage |
| Under 6 Years | 1,525 (98.0%) | 31 (2.0%) |
| 6 to 18 Years | 2,001 (85.7%) | 334 (14.3%) |
| 19 to 25 Years | 1,069 (90.0%) | 119 (10.0%) |
| 26 to 34 Years | 2,235 (77.9%) | 635 (22.1%) |
| 35 to 44 Years | 1,816 (77.8%) | 517 (22.2%) |
| 45 to 54 Years | 2,452 (78.7%) | 664 (21.3%) |
| 55 to 64 Years | 5,547 (92.4%) | 458 (7.6%) |
| 65 to 74 Years | 5,748 (99.9%) | 6 (0.1%) |
| 75 Years and older | 4,880 (100.0%) | 0 (0.0%) |
| Total | 27,273 (90.8%) | 2,764 (9.2%) |
Health Insurance Coverage by Citizenship Status in New Smyrna Beach
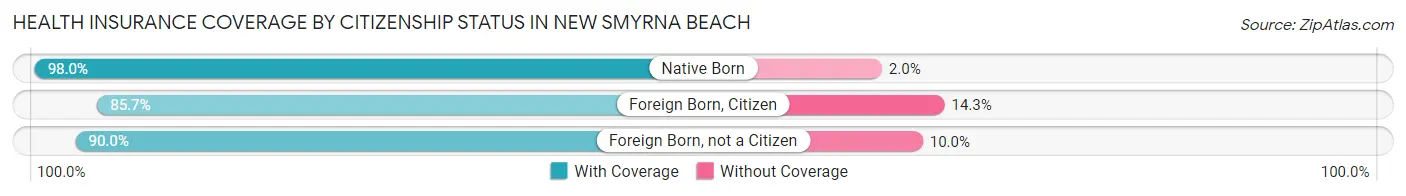
| Citizenship Status | With Coverage | Without Coverage |
| Native Born | 1,525 (98.0%) | 31 (2.0%) |
| Foreign Born, Citizen | 2,001 (85.7%) | 334 (14.3%) |
| Foreign Born, not a Citizen | 1,069 (90.0%) | 119 (10.0%) |
Health Insurance Coverage by Household Income in New Smyrna Beach
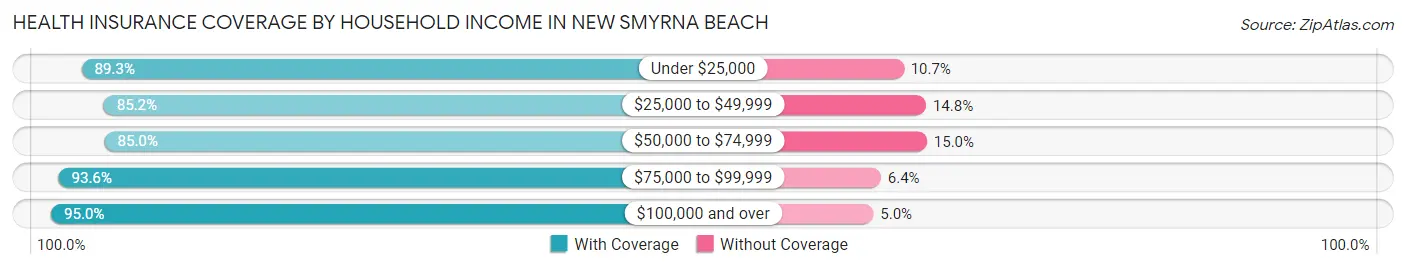
| Household Income | With Coverage | Without Coverage |
| Under $25,000 | 2,481 (89.3%) | 296 (10.7%) |
| $25,000 to $49,999 | 4,624 (85.2%) | 806 (14.8%) |
| $50,000 to $74,999 | 4,238 (85.0%) | 748 (15.0%) |
| $75,000 to $99,999 | 4,579 (93.6%) | 312 (6.4%) |
| $100,000 and over | 11,327 (95.0%) | 593 (5.0%) |
Public vs Private Health Insurance Coverage by Age in New Smyrna Beach
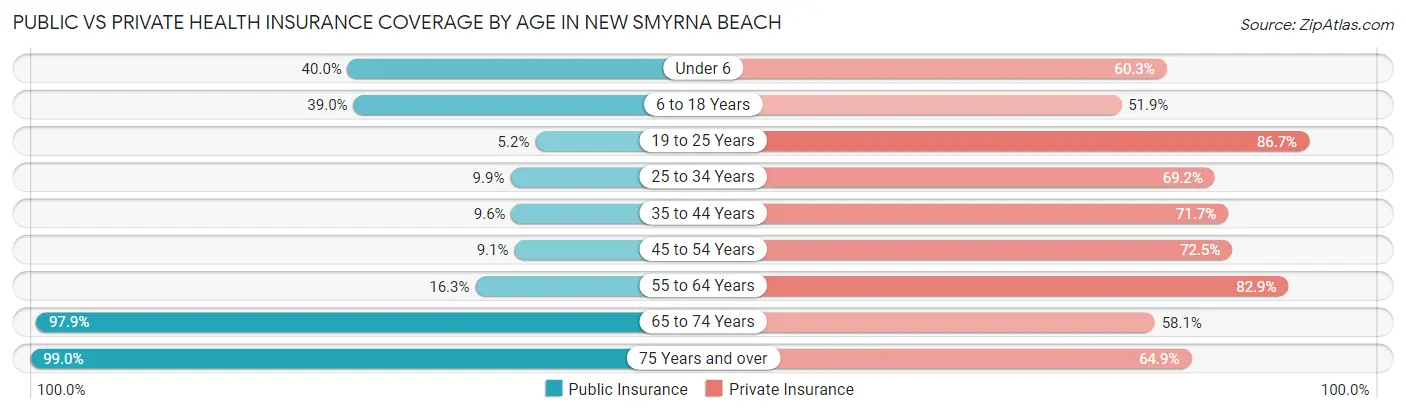
| Age Bracket | Public Insurance | Private Insurance |
| Under 6 | 623 (40.0%) | 938 (60.3%) |
| 6 to 18 Years | 910 (39.0%) | 1,211 (51.9%) |
| 19 to 25 Years | 62 (5.2%) | 1,030 (86.7%) |
| 25 to 34 Years | 283 (9.9%) | 1,987 (69.2%) |
| 35 to 44 Years | 225 (9.6%) | 1,673 (71.7%) |
| 45 to 54 Years | 284 (9.1%) | 2,258 (72.5%) |
| 55 to 64 Years | 981 (16.3%) | 4,977 (82.9%) |
| 65 to 74 Years | 5,632 (97.9%) | 3,342 (58.1%) |
| 75 Years and over | 4,829 (99.0%) | 3,165 (64.9%) |
| Total | 13,829 (46.0%) | 20,581 (68.5%) |
Disability Status by Sex by Age in New Smyrna Beach
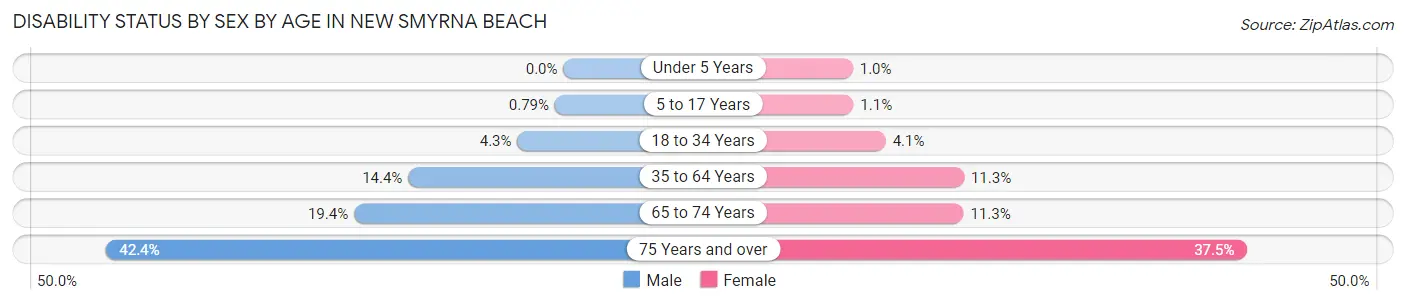
| Age Bracket | Male | Female |
| Under 5 Years | 0 (0.0%) | 5 (1.0%) |
| 5 to 17 Years | 12 (0.8%) | 10 (1.1%) |
| 18 to 34 Years | 94 (4.3%) | 83 (4.1%) |
| 35 to 64 Years | 825 (14.4%) | 649 (11.3%) |
| 65 to 74 Years | 509 (19.4%) | 354 (11.3%) |
| 75 Years and over | 969 (42.4%) | 974 (37.5%) |
Disability Class by Sex by Age in New Smyrna Beach
Disability Class: Hearing Difficulty
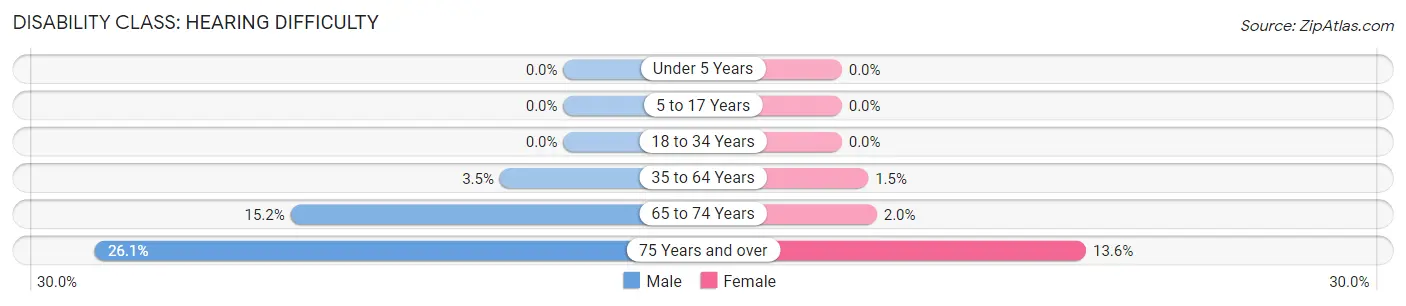
| Age Bracket | Male | Female |
| Under 5 Years | 0 (0.0%) | 0 (0.0%) |
| 5 to 17 Years | 0 (0.0%) | 0 (0.0%) |
| 18 to 34 Years | 0 (0.0%) | 0 (0.0%) |
| 35 to 64 Years | 203 (3.5%) | 84 (1.5%) |
| 65 to 74 Years | 398 (15.2%) | 61 (1.9%) |
| 75 Years and over | 596 (26.1%) | 353 (13.6%) |
Disability Class: Vision Difficulty
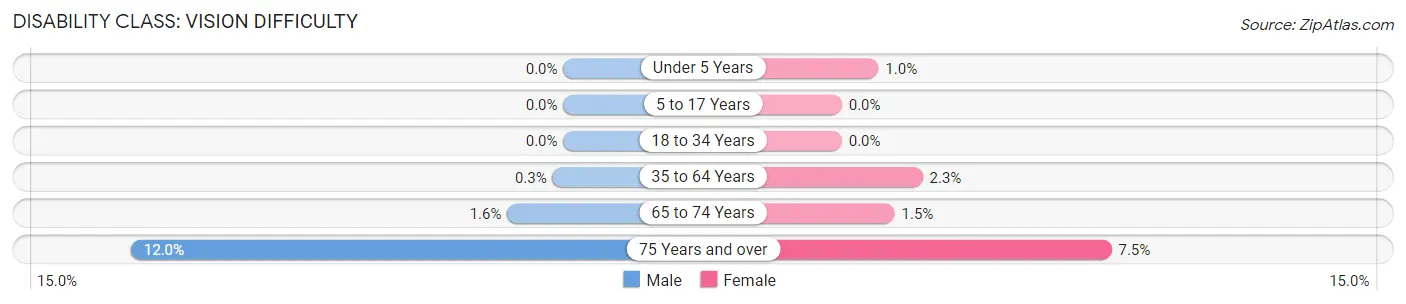
| Age Bracket | Male | Female |
| Under 5 Years | 0 (0.0%) | 5 (1.0%) |
| 5 to 17 Years | 0 (0.0%) | 0 (0.0%) |
| 18 to 34 Years | 0 (0.0%) | 0 (0.0%) |
| 35 to 64 Years | 17 (0.3%) | 129 (2.2%) |
| 65 to 74 Years | 41 (1.6%) | 46 (1.5%) |
| 75 Years and over | 275 (12.0%) | 195 (7.5%) |
Disability Class: Cognitive Difficulty
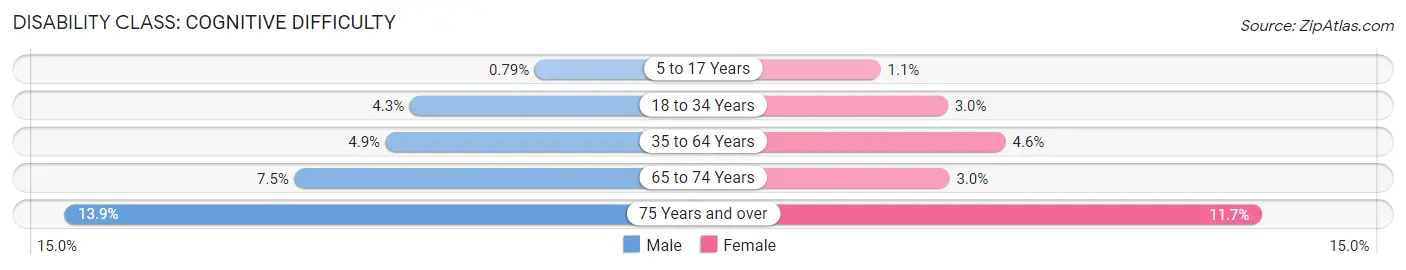
| Age Bracket | Male | Female |
| 5 to 17 Years | 12 (0.8%) | 10 (1.1%) |
| 18 to 34 Years | 94 (4.3%) | 60 (2.9%) |
| 35 to 64 Years | 283 (4.9%) | 261 (4.6%) |
| 65 to 74 Years | 196 (7.5%) | 94 (3.0%) |
| 75 Years and over | 317 (13.9%) | 303 (11.7%) |
Disability Class: Ambulatory Difficulty
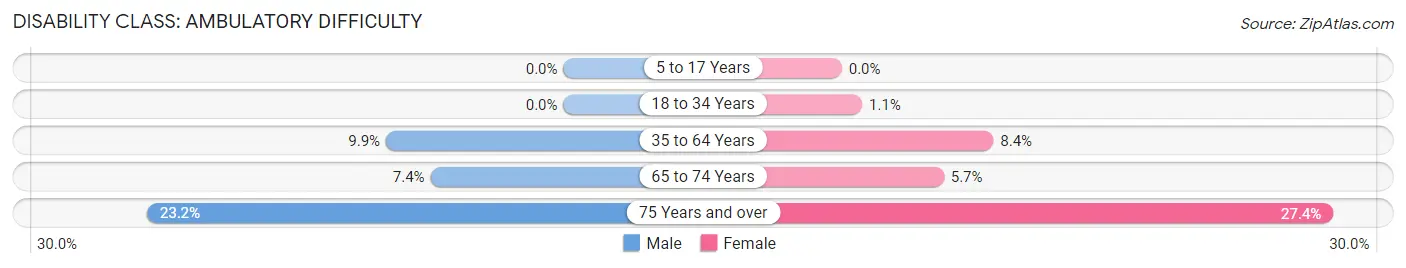
| Age Bracket | Male | Female |
| 5 to 17 Years | 0 (0.0%) | 0 (0.0%) |
| 18 to 34 Years | 0 (0.0%) | 23 (1.1%) |
| 35 to 64 Years | 566 (9.9%) | 483 (8.4%) |
| 65 to 74 Years | 194 (7.4%) | 178 (5.7%) |
| 75 Years and over | 530 (23.2%) | 710 (27.4%) |
Disability Class: Self-Care Difficulty
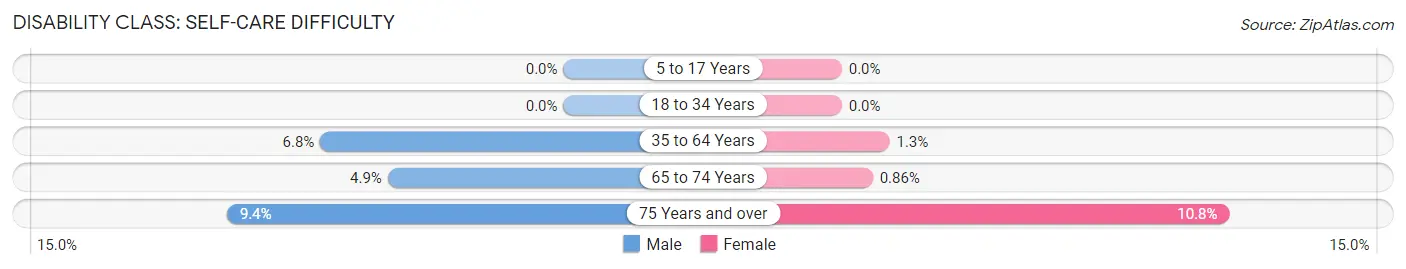
| Age Bracket | Male | Female |
| 5 to 17 Years | 0 (0.0%) | 0 (0.0%) |
| 18 to 34 Years | 0 (0.0%) | 0 (0.0%) |
| 35 to 64 Years | 388 (6.8%) | 76 (1.3%) |
| 65 to 74 Years | 128 (4.9%) | 27 (0.9%) |
| 75 Years and over | 214 (9.4%) | 280 (10.8%) |
Technology Access in New Smyrna Beach
Computing Device Access in New Smyrna Beach
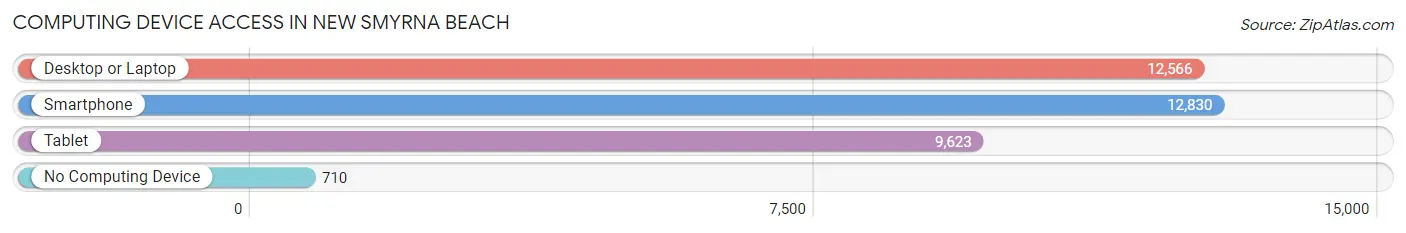
| Device Type | # Households | % Households |
| Desktop or Laptop | 12,566 | 83.9% |
| Smartphone | 12,830 | 85.7% |
| Tablet | 9,623 | 64.2% |
| No Computing Device | 710 | 4.7% |
| Total | 14,979 | 100.0% |
Internet Access in New Smyrna Beach
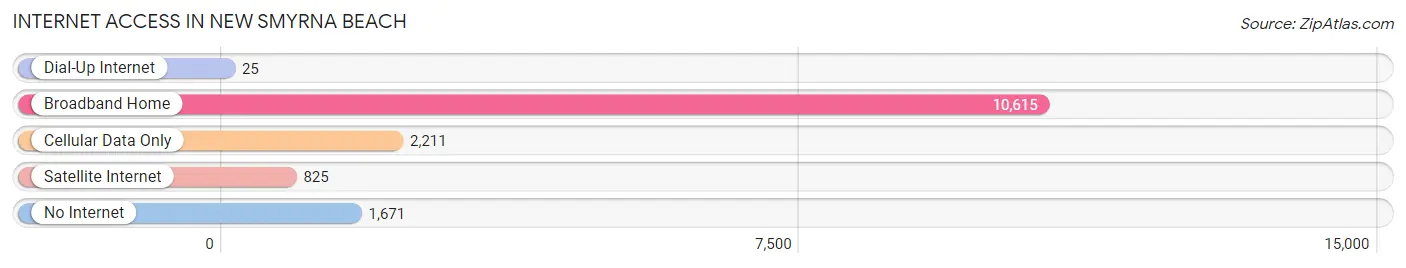
| Internet Type | # Households | % Households |
| Dial-Up Internet | 25 | 0.2% |
| Broadband Home | 10,615 | 70.9% |
| Cellular Data Only | 2,211 | 14.8% |
| Satellite Internet | 825 | 5.5% |
| No Internet | 1,671 | 11.2% |
| Total | 14,979 | 100.0% |
New Smyrna Beach Summary
New Smyrna Beach is a city located in Volusia County, Florida, United States, on the central east coast of the state. It is part of the Deltona–Daytona Beach–Ormond Beach metropolitan area, which is home to over 500,000 people. The city is situated on the Indian River Lagoon, which is part of the Intracoastal Waterway. The city is known for its beaches, fishing, surfing, and other outdoor activities.
History
New Smyrna Beach was founded in 1768 by Dr. Andrew Turnbull, a Scottish physician and British consul. He established a colony of 1,400 people, mostly Minorcans, Greeks, and Italians, on the site of a former Timucuan Indian village. The colony was named after Smyrna, the ancient Greek city in Asia Minor. The colony was intended to be a utopian society, but it quickly failed due to a variety of factors, including disease, poor soil, and a lack of supplies. The survivors of the colony eventually moved to St. Augustine, Florida.
In 1887, the city was incorporated as New Smyrna Beach. The city grew rapidly in the early 20th century, and by the 1950s it had become a popular tourist destination. The city has continued to grow and develop since then, and today it is a thriving community with a population of over 25,000 people.
Geography
New Smyrna Beach is located in east-central Florida, on the Indian River Lagoon. The city is situated on the barrier island of Coronado Beach, which is separated from the mainland by the Indian River Lagoon. The city is bordered by the cities of Edgewater to the north, Oak Hill to the south, and Daytona Beach to the west. The city covers an area of approximately 10 square miles.
The climate in New Smyrna Beach is subtropical, with hot, humid summers and mild winters. The average temperature in the summer is around 90°F, and the average temperature in the winter is around 60°F. The city receives an average of 54 inches of rain per year.
Economy
New Smyrna Beach has a diverse economy, with a mix of tourism, manufacturing, and services. The city is home to several large employers, including the New Smyrna Beach Airport, the Canaveral Port Authority, and the Florida East Coast Railway. The city is also home to several smaller businesses, including restaurants, retail stores, and hotels.
Tourism is a major part of the city’s economy. The city is home to several popular beaches, including Flagler Avenue Beach, Canaveral National Seashore, and Smyrna Dunes Park. The city also hosts several annual events, including the New Smyrna Beach Jazz Festival and the New Smyrna Beach Seafood Festival.
Demographics
As of the 2010 census, the population of New Smyrna Beach was 24,164. The racial makeup of the city was 79.2% White, 11.3% African American, 0.5% Native American, 2.2% Asian, 0.1% Pacific Islander, 4.2% from other races, and 2.5% from two or more races. Hispanic or Latino of any race were 11.3% of the population.
The median household income in New Smyrna Beach was $45,845, and the median family income was $54,845. The per capita income for the city was $25,945. About 11.3% of the population was below the poverty line.
Conclusion
New Smyrna Beach is a vibrant city located in east-central Florida. The city has a rich history, dating back to its founding in 1768. The city has a diverse economy, with a mix of tourism, manufacturing, and services. The city is also home to a diverse population, with a mix of races and ethnicities. New Smyrna Beach is a great place to live, work, and play, and it is sure to continue to grow and develop in the years to come.
Common Questions
What is Per Capita Income in New Smyrna Beach?
Per Capita income in New Smyrna Beach is $50,902.
What is the Median Family Income in New Smyrna Beach?
Median Family Income in New Smyrna Beach is $86,882.
What is the Median Household income in New Smyrna Beach?
Median Household Income in New Smyrna Beach is $73,096.
What is Income or Wage Gap in New Smyrna Beach?
Income or Wage Gap in New Smyrna Beach is 17.5%.
Women in New Smyrna Beach earn 82.5 cents for every dollar earned by a man.
What is Family Income Deficit in New Smyrna Beach?
Family Income Deficit in New Smyrna Beach is $8,676.
Families that are below poverty line in New Smyrna Beach earn $8,676 less on average than the poverty threshold level.
What is Inequality or Gini Index in New Smyrna Beach?
Inequality or Gini Index in New Smyrna Beach is 0.48.
What is the Total Population of New Smyrna Beach?
Total Population of New Smyrna Beach is 30,449.
What is the Total Male Population of New Smyrna Beach?
Total Male Population of New Smyrna Beach is 15,410.
What is the Total Female Population of New Smyrna Beach?
Total Female Population of New Smyrna Beach is 15,039.
What is the Ratio of Males per 100 Females in New Smyrna Beach?
There are 102.47 Males per 100 Females in New Smyrna Beach.
What is the Ratio of Females per 100 Males in New Smyrna Beach?
There are 97.59 Females per 100 Males in New Smyrna Beach.
What is the Median Population Age in New Smyrna Beach?
Median Population Age in New Smyrna Beach is 57.7 Years.
What is the Average Family Size in New Smyrna Beach
Average Family Size in New Smyrna Beach is 2.5 People.
What is the Average Household Size in New Smyrna Beach
Average Household Size in New Smyrna Beach is 2.0 People.
How Large is the Labor Force in New Smyrna Beach?
There are 12,799 People in the Labor Forcein in New Smyrna Beach.
What is the Percentage of People in the Labor Force in New Smyrna Beach?
47.3% of People are in the Labor Force in New Smyrna Beach.
What is the Unemployment Rate in New Smyrna Beach?
Unemployment Rate in New Smyrna Beach is 4.4%.