New Port Richey, FL Map & Demographics
New Port Richey Map
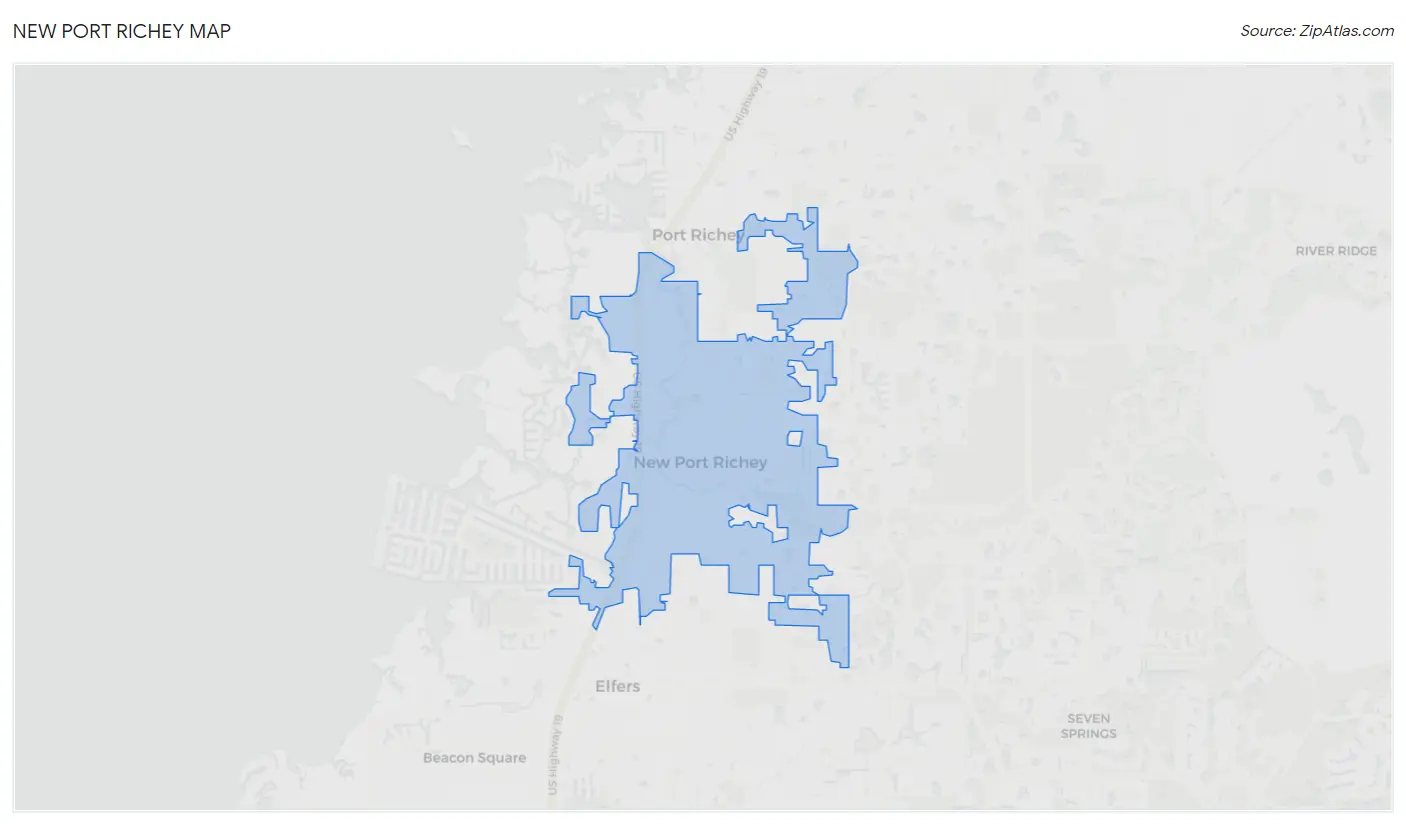
New Port Richey Overview
$28,811
PER CAPITA INCOME
$51,800
AVG FAMILY INCOME
$42,254
AVG HOUSEHOLD INCOME
23.1%
WAGE / INCOME GAP [ % ]
76.9¢/ $1
WAGE / INCOME GAP [ $ ]
$10,978
FAMILY INCOME DEFICIT
0.45
INEQUALITY / GINI INDEX
16,742
TOTAL POPULATION
7,654
MALE POPULATION
9,088
FEMALE POPULATION
84.22
MALES / 100 FEMALES
118.74
FEMALES / 100 MALES
54.0
MEDIAN AGE
2.7
AVG FAMILY SIZE
2.1
AVG HOUSEHOLD SIZE
6,737
LABOR FORCE [ PEOPLE ]
45.3%
PERCENT IN LABOR FORCE
4.0%
UNEMPLOYMENT RATE
New Port Richey Area Codes
Income in New Port Richey
Income Overview in New Port Richey
Per Capita Income in New Port Richey is $28,811, while median incomes of families and households are $51,800 and $42,254 respectively.
| Characteristic | Number | Measure |
| Per Capita Income | 16,742 | $28,811 |
| Median Family Income | 4,051 | $51,800 |
| Mean Family Income | 4,051 | $64,293 |
| Median Household Income | 7,658 | $42,254 |
| Mean Household Income | 7,658 | $58,136 |
| Income Deficit | 4,051 | $10,978 |
| Wage / Income Gap (%) | 16,742 | 23.09% |
| Wage / Income Gap ($) | 16,742 | 76.91¢ per $1 |
| Gini / Inequality Index | 16,742 | 0.45 |
Earnings by Sex in New Port Richey
Average Earnings in New Port Richey are $33,845, $38,797 for men and $29,837 for women, a difference of 23.1%.
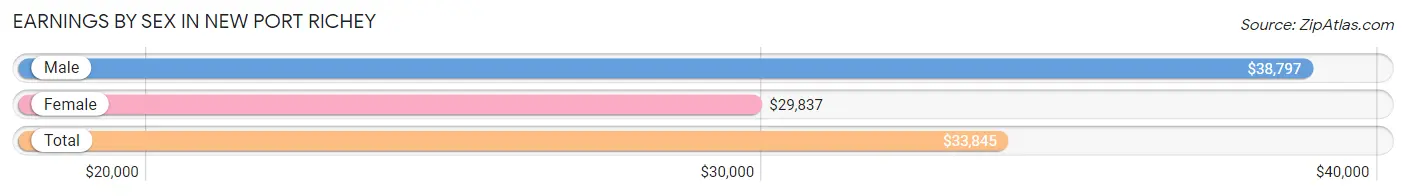
| Sex | Number | Average Earnings |
| Male | 3,590 (50.9%) | $38,797 |
| Female | 3,456 (49.0%) | $29,837 |
| Total | 7,046 (100.0%) | $33,845 |
Earnings by Sex by Income Bracket in New Port Richey
The most common earnings brackets in New Port Richey are $30,000 to $34,999 for men (330 | 9.2%) and $30,000 to $34,999 for women (458 | 13.3%).
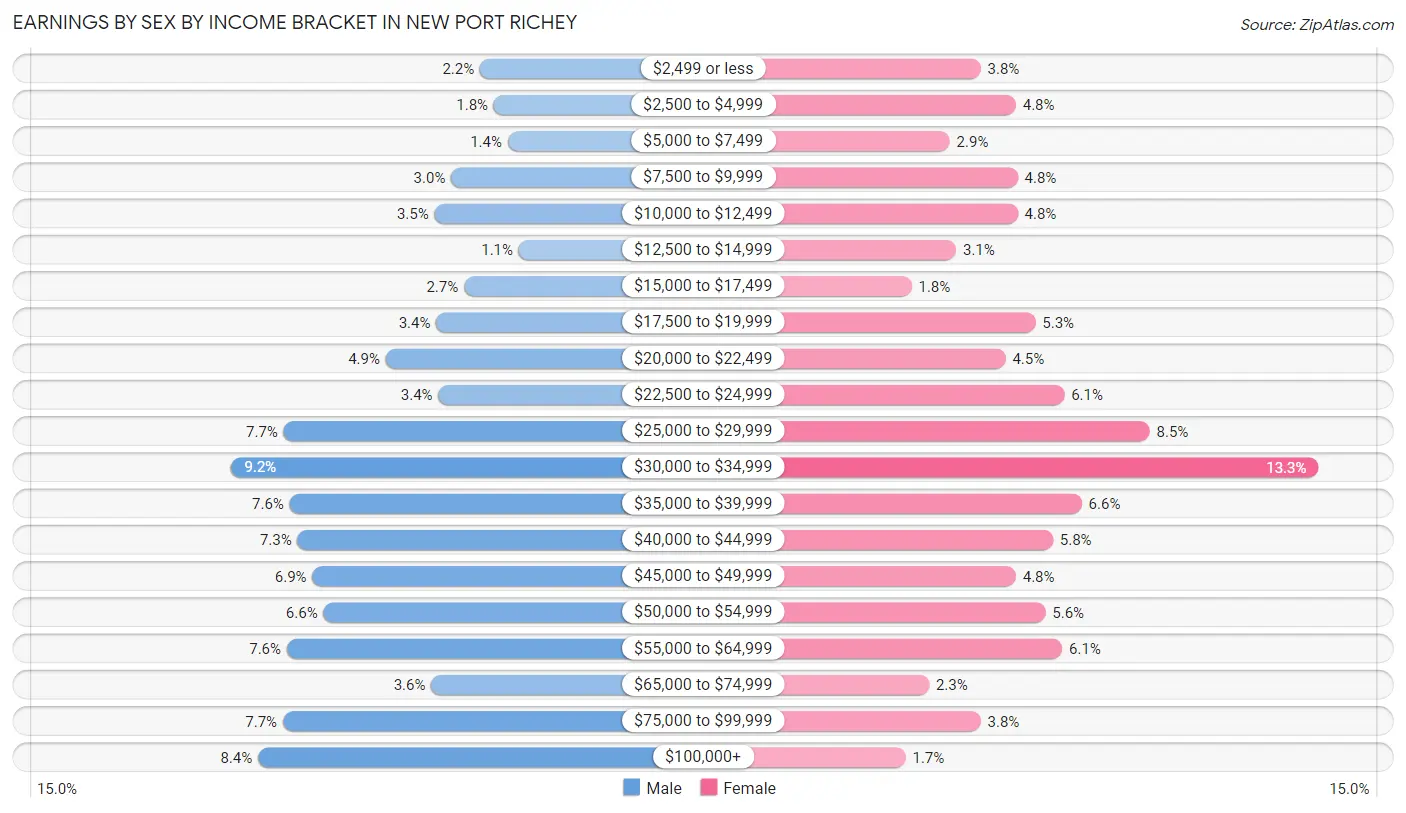
| Income | Male | Female |
| $2,499 or less | 79 (2.2%) | 130 (3.8%) |
| $2,500 to $4,999 | 65 (1.8%) | 164 (4.8%) |
| $5,000 to $7,499 | 51 (1.4%) | 100 (2.9%) |
| $7,500 to $9,999 | 108 (3.0%) | 166 (4.8%) |
| $10,000 to $12,499 | 125 (3.5%) | 166 (4.8%) |
| $12,500 to $14,999 | 40 (1.1%) | 106 (3.1%) |
| $15,000 to $17,499 | 95 (2.6%) | 63 (1.8%) |
| $17,500 to $19,999 | 123 (3.4%) | 183 (5.3%) |
| $20,000 to $22,499 | 174 (4.9%) | 154 (4.5%) |
| $22,500 to $24,999 | 121 (3.4%) | 211 (6.1%) |
| $25,000 to $29,999 | 277 (7.7%) | 294 (8.5%) |
| $30,000 to $34,999 | 330 (9.2%) | 458 (13.3%) |
| $35,000 to $39,999 | 271 (7.5%) | 228 (6.6%) |
| $40,000 to $44,999 | 263 (7.3%) | 200 (5.8%) |
| $45,000 to $49,999 | 248 (6.9%) | 164 (4.8%) |
| $50,000 to $54,999 | 237 (6.6%) | 193 (5.6%) |
| $55,000 to $64,999 | 274 (7.6%) | 209 (6.0%) |
| $65,000 to $74,999 | 128 (3.6%) | 80 (2.3%) |
| $75,000 to $99,999 | 278 (7.7%) | 130 (3.8%) |
| $100,000+ | 303 (8.4%) | 57 (1.7%) |
| Total | 3,590 (100.0%) | 3,456 (100.0%) |
Earnings by Sex by Educational Attainment in New Port Richey
Average earnings in New Port Richey are $40,332 for men and $31,531 for women, a difference of 21.8%. Men with an educational attainment of graduate degree enjoy the highest average annual earnings of $59,063, while those with less than high school education earn the least with $22,955. Women with an educational attainment of bachelor's degree earn the most with the average annual earnings of $40,058, while those with less than high school education have the smallest earnings of $21,250.
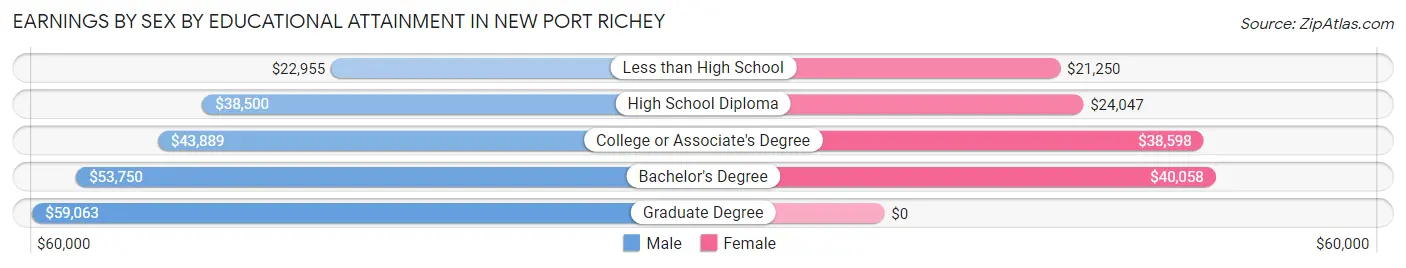
| Educational Attainment | Male Income | Female Income |
| Less than High School | $22,955 | $21,250 |
| High School Diploma | $38,500 | $24,047 |
| College or Associate's Degree | $43,889 | $38,598 |
| Bachelor's Degree | $53,750 | $40,058 |
| Graduate Degree | $59,063 | $0 |
| Total | $40,332 | $31,531 |
Family Income in New Port Richey
Family Income Brackets in New Port Richey
According to the New Port Richey family income data, there are 992 families falling into the $50,000 to $74,999 income range, which is the most common income bracket and makes up 24.5% of all families. Conversely, the $10,000 to $14,999 income bracket is the least frequent group with only 36 families (0.9%) belonging to this category.
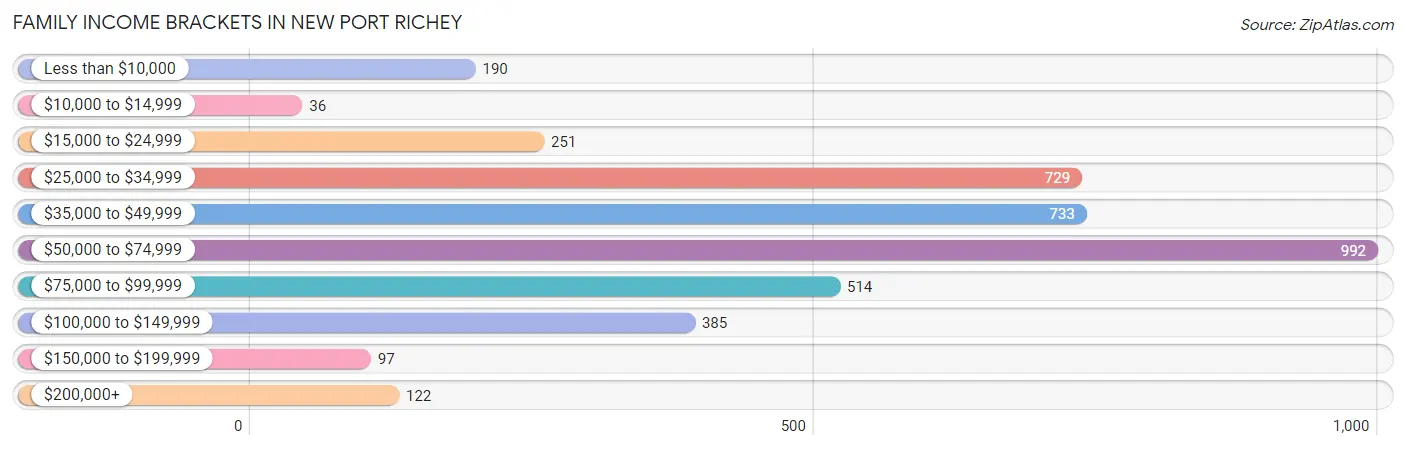
| Income Bracket | # Families | % Families |
| Less than $10,000 | 190 | 4.7% |
| $10,000 to $14,999 | 36 | 0.9% |
| $15,000 to $24,999 | 251 | 6.2% |
| $25,000 to $34,999 | 729 | 18.0% |
| $35,000 to $49,999 | 733 | 18.1% |
| $50,000 to $74,999 | 992 | 24.5% |
| $75,000 to $99,999 | 514 | 12.7% |
| $100,000 to $149,999 | 385 | 9.5% |
| $150,000 to $199,999 | 97 | 2.4% |
| $200,000+ | 122 | 3.0% |
Family Income by Famaliy Size in New Port Richey
5-person families (61 | 1.5%) account for the highest median family income in New Port Richey with $102,083 per family, while 2-person families (2,652 | 65.5%) have the highest median income of $22,462 per family member.
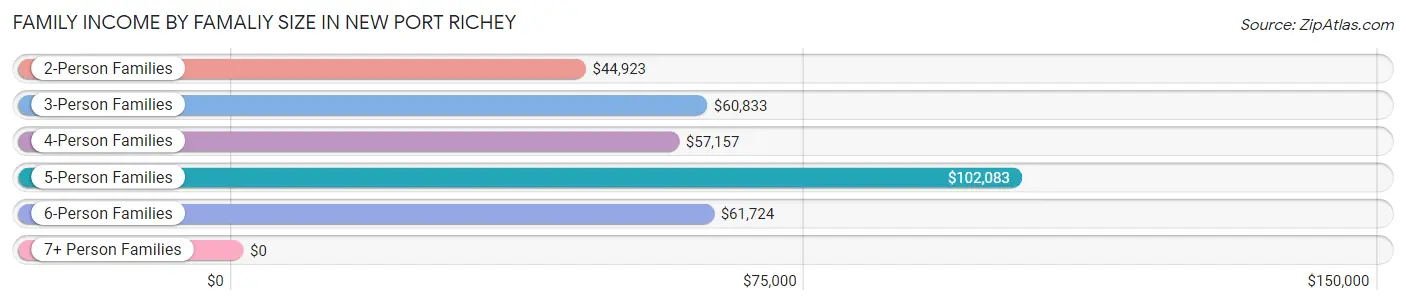
| Income Bracket | # Families | Median Income |
| 2-Person Families | 2,652 (65.5%) | $44,923 |
| 3-Person Families | 870 (21.5%) | $60,833 |
| 4-Person Families | 351 (8.7%) | $57,157 |
| 5-Person Families | 61 (1.5%) | $102,083 |
| 6-Person Families | 90 (2.2%) | $61,724 |
| 7+ Person Families | 27 (0.7%) | $0 |
| Total | 4,051 (100.0%) | $51,800 |
Family Income by Number of Earners in New Port Richey
The median family income in New Port Richey is $51,800, with families comprising 3+ earners (240) having the highest median family income of $99,167, while families with no earners (1,342) have the lowest median family income of $31,530, accounting for 5.9% and 33.1% of families, respectively.
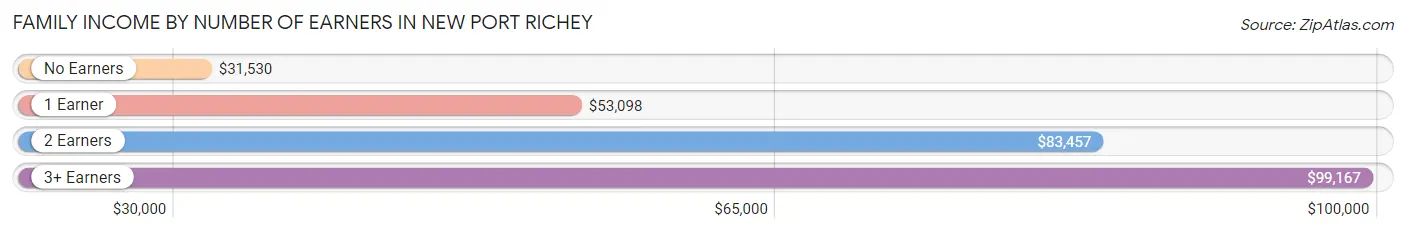
| Number of Earners | # Families | Median Income |
| No Earners | 1,342 (33.1%) | $31,530 |
| 1 Earner | 1,523 (37.6%) | $53,098 |
| 2 Earners | 946 (23.4%) | $83,457 |
| 3+ Earners | 240 (5.9%) | $99,167 |
| Total | 4,051 (100.0%) | $51,800 |
Household Income in New Port Richey
Household Income Brackets in New Port Richey
With 1,409 households falling in the category, the $50,000 to $74,999 income range is the most frequent in New Port Richey, accounting for 18.4% of all households. In contrast, only 184 households (2.4%) fall into the $150,000 to $199,999 income bracket, making it the least populous group.
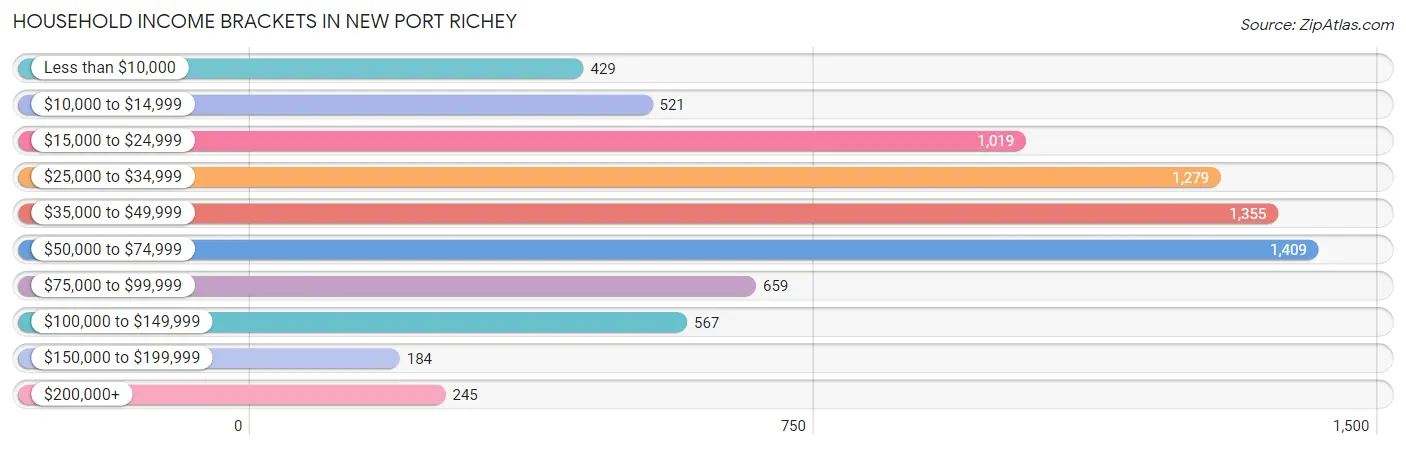
| Income Bracket | # Households | % Households |
| Less than $10,000 | 429 | 5.6% |
| $10,000 to $14,999 | 521 | 6.8% |
| $15,000 to $24,999 | 1,019 | 13.3% |
| $25,000 to $34,999 | 1,279 | 16.7% |
| $35,000 to $49,999 | 1,355 | 17.7% |
| $50,000 to $74,999 | 1,409 | 18.4% |
| $75,000 to $99,999 | 659 | 8.6% |
| $100,000 to $149,999 | 567 | 7.4% |
| $150,000 to $199,999 | 184 | 2.4% |
| $200,000+ | 245 | 3.2% |
Household Income by Householder Age in New Port Richey
The median household income in New Port Richey is $42,254, with the highest median household income of $51,650 found in the 15 to 24 years age bracket for the primary householder. A total of 135 households (1.8%) fall into this category. Meanwhile, the 65+ years age bracket for the primary householder has the lowest median household income of $33,420, with 2,690 households (35.1%) in this group.
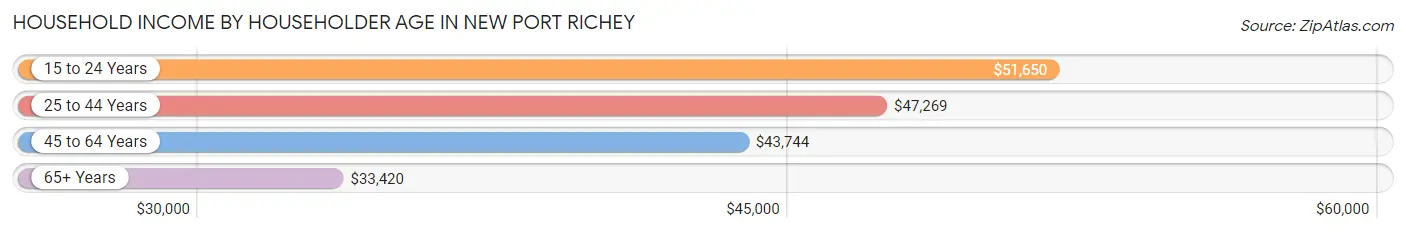
| Income Bracket | # Households | Median Income |
| 15 to 24 Years | 135 (1.8%) | $51,650 |
| 25 to 44 Years | 1,569 (20.5%) | $47,269 |
| 45 to 64 Years | 3,264 (42.6%) | $43,744 |
| 65+ Years | 2,690 (35.1%) | $33,420 |
| Total | 7,658 (100.0%) | $42,254 |
Poverty in New Port Richey
Income Below Poverty by Sex and Age in New Port Richey
With 10.9% poverty level for males and 15.5% for females among the residents of New Port Richey, 15 year old males and 12 to 14 year old females are the most vulnerable to poverty, with 25 males (48.1%) and 94 females (42.5%) in their respective age groups living below the poverty level.
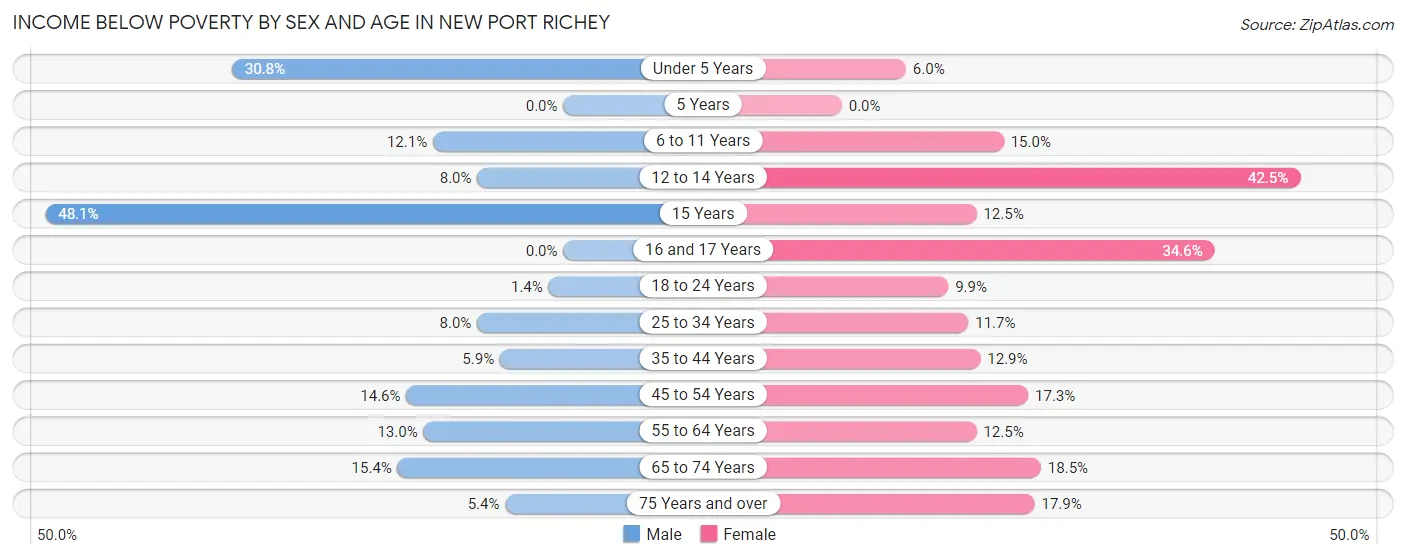
| Age Bracket | Male | Female |
| Under 5 Years | 64 (30.8%) | 22 (5.9%) |
| 5 Years | 0 (0.0%) | 0 (0.0%) |
| 6 to 11 Years | 30 (12.1%) | 52 (15.0%) |
| 12 to 14 Years | 15 (8.0%) | 94 (42.5%) |
| 15 Years | 25 (48.1%) | 6 (12.5%) |
| 16 and 17 Years | 0 (0.0%) | 55 (34.6%) |
| 18 to 24 Years | 8 (1.4%) | 48 (9.9%) |
| 25 to 34 Years | 68 (8.0%) | 83 (11.7%) |
| 35 to 44 Years | 47 (5.9%) | 126 (12.9%) |
| 45 to 54 Years | 132 (14.6%) | 207 (17.3%) |
| 55 to 64 Years | 202 (13.0%) | 213 (12.5%) |
| 65 to 74 Years | 186 (15.4%) | 221 (18.5%) |
| 75 Years and over | 35 (5.4%) | 212 (17.9%) |
| Total | 812 (10.9%) | 1,339 (15.5%) |
Income Above Poverty by Sex and Age in New Port Richey
According to the poverty statistics in New Port Richey, males aged 5 years and females aged 5 years are the age groups that are most secure financially, with 100.0% of males and 100.0% of females in these age groups living above the poverty line.
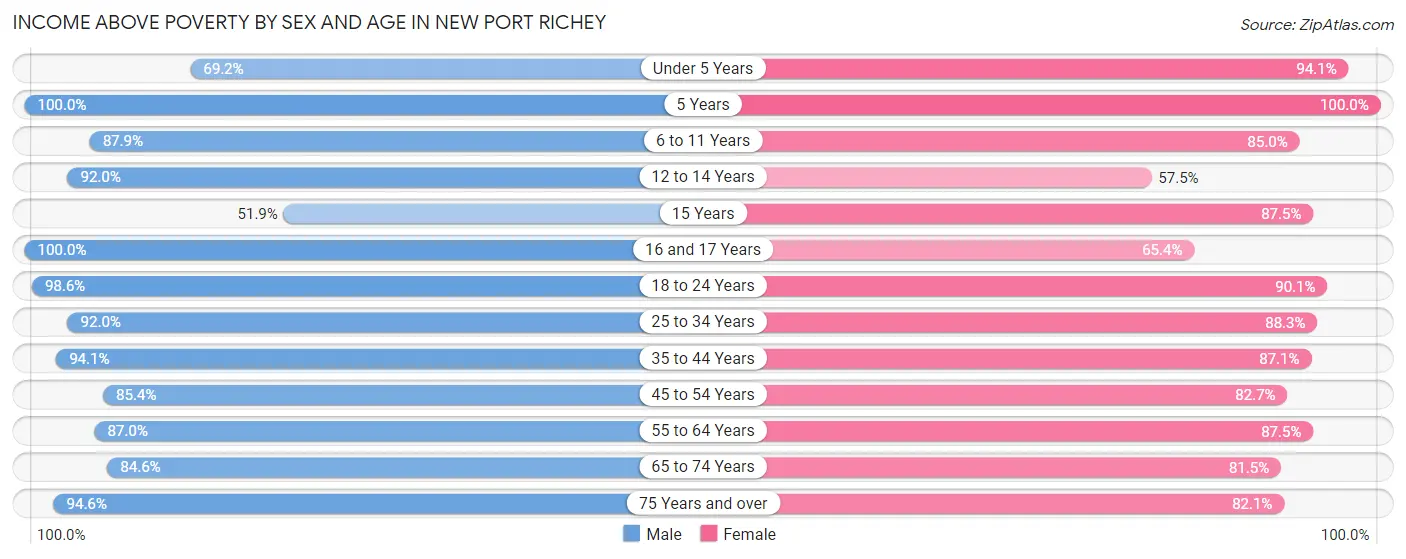
| Age Bracket | Male | Female |
| Under 5 Years | 144 (69.2%) | 348 (94.1%) |
| 5 Years | 126 (100.0%) | 47 (100.0%) |
| 6 to 11 Years | 218 (87.9%) | 294 (85.0%) |
| 12 to 14 Years | 173 (92.0%) | 127 (57.5%) |
| 15 Years | 27 (51.9%) | 42 (87.5%) |
| 16 and 17 Years | 98 (100.0%) | 104 (65.4%) |
| 18 to 24 Years | 575 (98.6%) | 438 (90.1%) |
| 25 to 34 Years | 782 (92.0%) | 624 (88.3%) |
| 35 to 44 Years | 753 (94.1%) | 854 (87.1%) |
| 45 to 54 Years | 774 (85.4%) | 990 (82.7%) |
| 55 to 64 Years | 1,354 (87.0%) | 1,491 (87.5%) |
| 65 to 74 Years | 1,023 (84.6%) | 975 (81.5%) |
| 75 Years and over | 614 (94.6%) | 973 (82.1%) |
| Total | 6,661 (89.1%) | 7,307 (84.5%) |
Income Below Poverty Among Married-Couple Families in New Port Richey
The poverty statistics for married-couple families in New Port Richey show that 5.3% or 134 of the total 2,506 families live below the poverty line. Families with 5 or more children have the highest poverty rate of 100.0%, comprising of 13 families. On the other hand, families with 3 or 4 children have the lowest poverty rate of 0.0%, which includes 0 families.
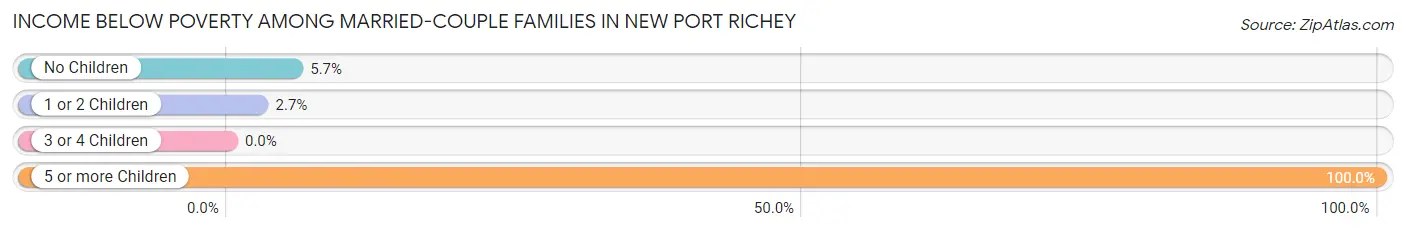
| Children | Above Poverty | Below Poverty |
| No Children | 1,792 (94.3%) | 108 (5.7%) |
| 1 or 2 Children | 475 (97.3%) | 13 (2.7%) |
| 3 or 4 Children | 105 (100.0%) | 0 (0.0%) |
| 5 or more Children | 0 (0.0%) | 13 (100.0%) |
| Total | 2,372 (94.7%) | 134 (5.3%) |
Income Below Poverty Among Single-Parent Households in New Port Richey
According to the poverty data in New Port Richey, 16.0% or 54 single-father households and 15.0% or 181 single-mother households are living below the poverty line. Among single-father households, those with 1 or 2 children have the highest poverty rate, with 40 households (22.7%) experiencing poverty. Likewise, among single-mother households, those with 3 or 4 children have the highest poverty rate, with 12 households (37.5%) falling below the poverty line.
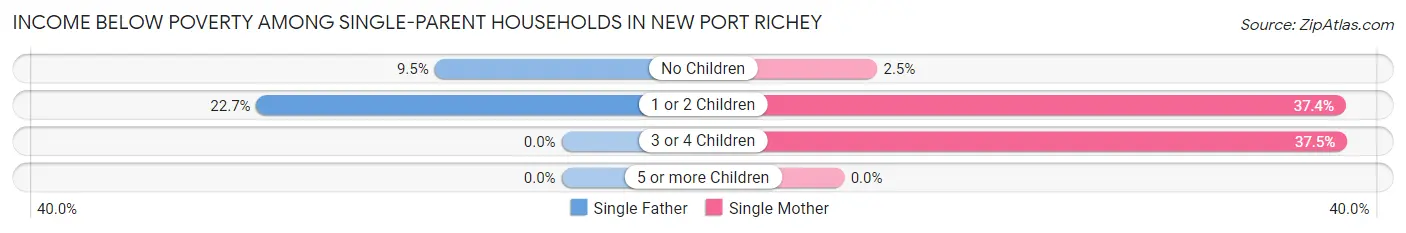
| Children | Single Father | Single Mother |
| No Children | 14 (9.5%) | 19 (2.5%) |
| 1 or 2 Children | 40 (22.7%) | 150 (37.4%) |
| 3 or 4 Children | 0 (0.0%) | 12 (37.5%) |
| 5 or more Children | 0 (0.0%) | 0 (0.0%) |
| Total | 54 (16.0%) | 181 (15.0%) |
Income Below Poverty Among Married-Couple vs Single-Parent Households in New Port Richey
The poverty data for New Port Richey shows that 134 of the married-couple family households (5.3%) and 235 of the single-parent households (15.2%) are living below the poverty level. Within the married-couple family households, those with 5 or more children have the highest poverty rate, with 13 households (100.0%) falling below the poverty line. Among the single-parent households, those with 1 or 2 children have the highest poverty rate, with 190 household (32.9%) living below poverty.
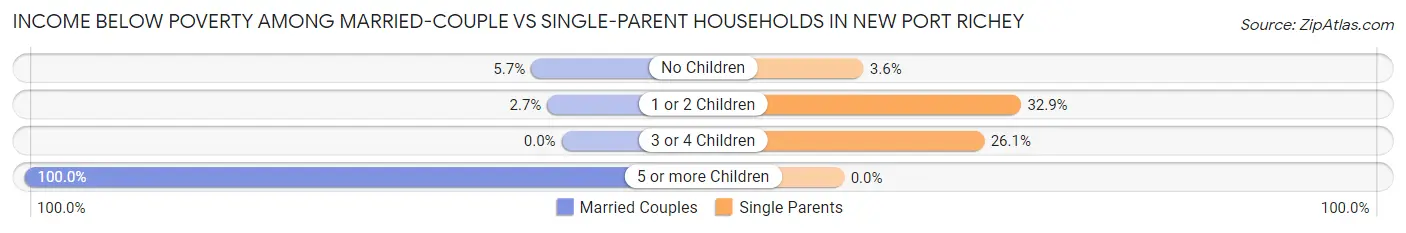
| Children | Married-Couple Families | Single-Parent Households |
| No Children | 108 (5.7%) | 33 (3.6%) |
| 1 or 2 Children | 13 (2.7%) | 190 (32.9%) |
| 3 or 4 Children | 0 (0.0%) | 12 (26.1%) |
| 5 or more Children | 13 (100.0%) | 0 (0.0%) |
| Total | 134 (5.3%) | 235 (15.2%) |
Race in New Port Richey
The most populous races in New Port Richey are White / Caucasian (13,463 | 80.4%), Hispanic or Latino (2,486 | 14.8%), and Two or more Races (1,496 | 8.9%).
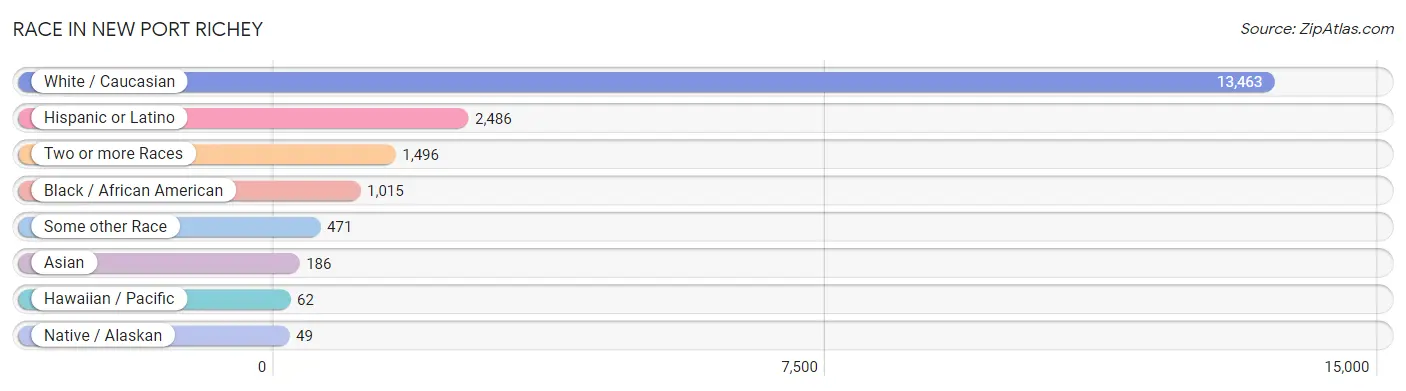
| Race | # Population | % Population |
| Asian | 186 | 1.1% |
| Black / African American | 1,015 | 6.1% |
| Hawaiian / Pacific | 62 | 0.4% |
| Hispanic or Latino | 2,486 | 14.8% |
| Native / Alaskan | 49 | 0.3% |
| White / Caucasian | 13,463 | 80.4% |
| Two or more Races | 1,496 | 8.9% |
| Some other Race | 471 | 2.8% |
| Total | 16,742 | 100.0% |
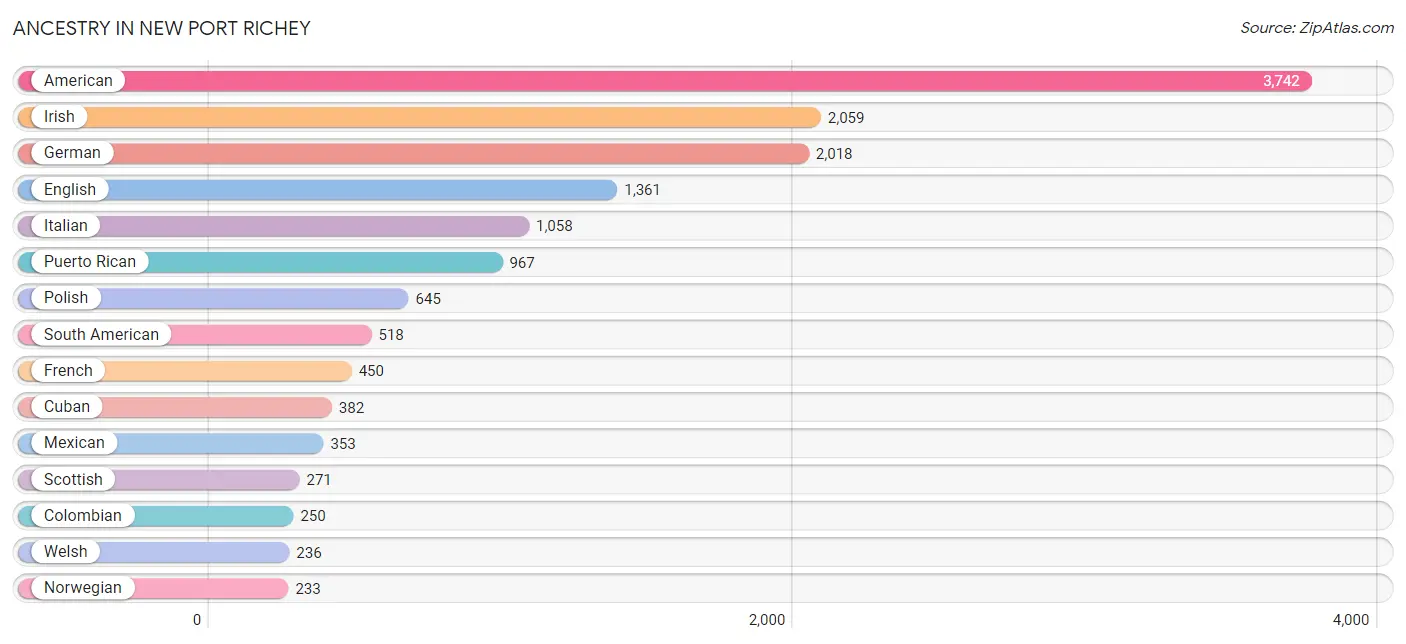
Ancestry in New Port Richey
The most populous ancestries reported in New Port Richey are American (3,742 | 22.4%), Irish (2,059 | 12.3%), German (2,018 | 12.0%), English (1,361 | 8.1%), and Italian (1,058 | 6.3%), together accounting for 61.2% of all New Port Richey residents.
| Ancestry | # Population | % Population |
| African | 18 | 0.1% |
| American | 3,742 | 22.4% |
| Arab | 122 | 0.7% |
| Argentinean | 74 | 0.4% |
| Armenian | 19 | 0.1% |
| Austrian | 120 | 0.7% |
| Belgian | 17 | 0.1% |
| Blackfeet | 32 | 0.2% |
| British | 159 | 0.9% |
| Burmese | 1 | 0.0% |
| Canadian | 28 | 0.2% |
| Cape Verdean | 3 | 0.0% |
| Central American | 80 | 0.5% |
| Central American Indian | 31 | 0.2% |
| Cherokee | 31 | 0.2% |
| Choctaw | 11 | 0.1% |
| Colombian | 250 | 1.5% |
| Comanche | 11 | 0.1% |
| Croatian | 36 | 0.2% |
| Cuban | 382 | 2.3% |
| Czech | 98 | 0.6% |
| Czechoslovakian | 70 | 0.4% |
| Danish | 54 | 0.3% |
| Dominican | 93 | 0.6% |
| Dutch | 142 | 0.9% |
| Eastern European | 31 | 0.2% |
| English | 1,361 | 8.1% |
| European | 88 | 0.5% |
| Filipino | 7 | 0.0% |
| Finnish | 26 | 0.2% |
| French | 450 | 2.7% |
| French Canadian | 172 | 1.0% |
| German | 2,018 | 12.0% |
| Greek | 72 | 0.4% |
| Haitian | 31 | 0.2% |
| Hungarian | 161 | 1.0% |
| Icelander | 14 | 0.1% |
| Indian (Asian) | 12 | 0.1% |
| Iraqi | 15 | 0.1% |
| Irish | 2,059 | 12.3% |
| Iroquois | 7 | 0.0% |
| Israeli | 4 | 0.0% |
| Italian | 1,058 | 6.3% |
| Jamaican | 35 | 0.2% |
| Korean | 47 | 0.3% |
| Latvian | 7 | 0.0% |
| Lithuanian | 21 | 0.1% |
| Menominee | 31 | 0.2% |
| Mexican | 353 | 2.1% |
| Moroccan | 78 | 0.5% |
| Native Hawaiian | 62 | 0.4% |
| Nicaraguan | 32 | 0.2% |
| Northern European | 16 | 0.1% |
| Norwegian | 233 | 1.4% |
| Pakistani | 36 | 0.2% |
| Panamanian | 15 | 0.1% |
| Pennsylvania German | 12 | 0.1% |
| Peruvian | 177 | 1.1% |
| Polish | 645 | 3.8% |
| Portuguese | 129 | 0.8% |
| Puerto Rican | 967 | 5.8% |
| Romanian | 4 | 0.0% |
| Russian | 100 | 0.6% |
| Scandinavian | 28 | 0.2% |
| Scotch-Irish | 62 | 0.4% |
| Scottish | 271 | 1.6% |
| Serbian | 11 | 0.1% |
| Shoshone | 23 | 0.1% |
| Slavic | 5 | 0.0% |
| Slovak | 20 | 0.1% |
| South American | 518 | 3.1% |
| Spaniard | 26 | 0.2% |
| Spanish | 59 | 0.4% |
| Sri Lankan | 59 | 0.4% |
| Subsaharan African | 25 | 0.2% |
| Swedish | 70 | 0.4% |
| Swiss | 37 | 0.2% |
| Syrian | 29 | 0.2% |
| Thai | 54 | 0.3% |
| Ukrainian | 66 | 0.4% |
| Venezuelan | 17 | 0.1% |
| Welsh | 236 | 1.4% |
| West Indian | 73 | 0.4% | View All 83 Rows |
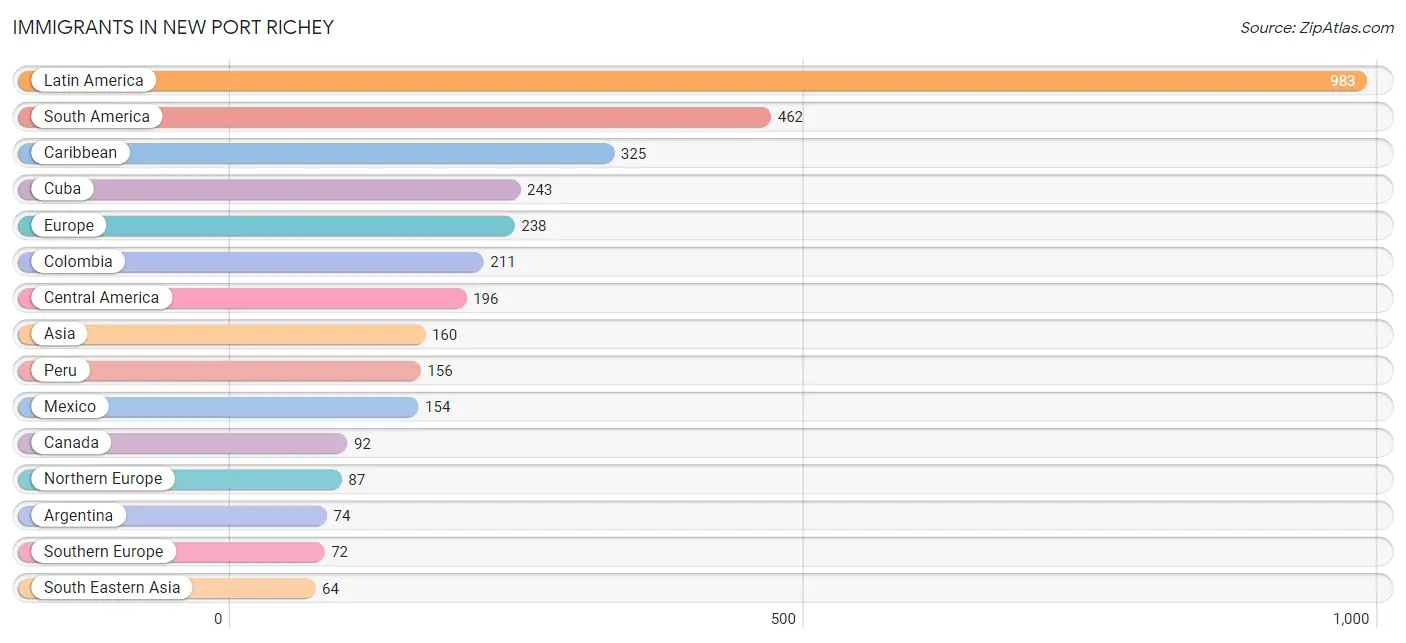
Immigrants in New Port Richey
The most numerous immigrant groups reported in New Port Richey came from Latin America (983 | 5.9%), South America (462 | 2.8%), Caribbean (325 | 1.9%), Cuba (243 | 1.5%), and Europe (238 | 1.4%), together accounting for 13.4% of all New Port Richey residents.
| Immigration Origin | # Population | % Population |
| Argentina | 74 | 0.4% |
| Asia | 160 | 1.0% |
| Brazil | 21 | 0.1% |
| Canada | 92 | 0.5% |
| Caribbean | 325 | 1.9% |
| Central America | 196 | 1.2% |
| China | 30 | 0.2% |
| Colombia | 211 | 1.3% |
| Cuba | 243 | 1.5% |
| Czechoslovakia | 23 | 0.1% |
| Dominican Republic | 4 | 0.0% |
| Eastern Asia | 31 | 0.2% |
| Eastern Europe | 48 | 0.3% |
| England | 41 | 0.2% |
| Europe | 238 | 1.4% |
| Germany | 21 | 0.1% |
| Haiti | 31 | 0.2% |
| India | 13 | 0.1% |
| Iraq | 9 | 0.1% |
| Ireland | 32 | 0.2% |
| Italy | 13 | 0.1% |
| Jamaica | 47 | 0.3% |
| Korea | 1 | 0.0% |
| Latin America | 983 | 5.9% |
| Mexico | 154 | 0.9% |
| Netherlands | 10 | 0.1% |
| Nicaragua | 32 | 0.2% |
| Northern Europe | 87 | 0.5% |
| Pakistan | 15 | 0.1% |
| Panama | 10 | 0.1% |
| Peru | 156 | 0.9% |
| Philippines | 28 | 0.2% |
| Poland | 16 | 0.1% |
| South America | 462 | 2.8% |
| South Central Asia | 28 | 0.2% |
| South Eastern Asia | 64 | 0.4% |
| Southern Europe | 72 | 0.4% |
| Spain | 59 | 0.4% |
| Taiwan | 4 | 0.0% |
| Thailand | 5 | 0.0% |
| Ukraine | 9 | 0.1% |
| Vietnam | 31 | 0.2% |
| Western Asia | 37 | 0.2% |
| Western Europe | 31 | 0.2% | View All 44 Rows |
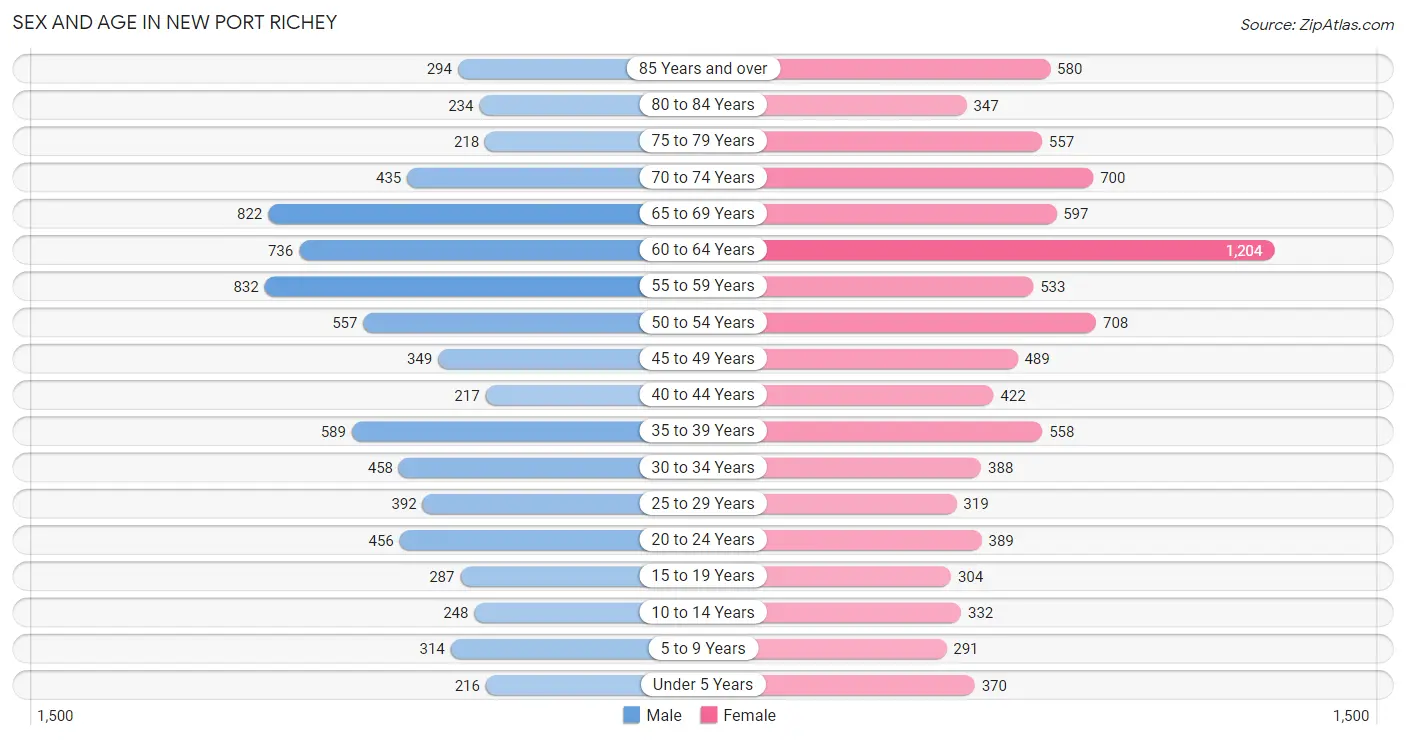
Sex and Age in New Port Richey
Sex and Age in New Port Richey
The most populous age groups in New Port Richey are 55 to 59 Years (832 | 10.9%) for men and 60 to 64 Years (1,204 | 13.3%) for women.
| Age Bracket | Male | Female |
| Under 5 Years | 216 (2.8%) | 370 (4.1%) |
| 5 to 9 Years | 314 (4.1%) | 291 (3.2%) |
| 10 to 14 Years | 248 (3.2%) | 332 (3.6%) |
| 15 to 19 Years | 287 (3.7%) | 304 (3.4%) |
| 20 to 24 Years | 456 (6.0%) | 389 (4.3%) |
| 25 to 29 Years | 392 (5.1%) | 319 (3.5%) |
| 30 to 34 Years | 458 (6.0%) | 388 (4.3%) |
| 35 to 39 Years | 589 (7.7%) | 558 (6.1%) |
| 40 to 44 Years | 217 (2.8%) | 422 (4.6%) |
| 45 to 49 Years | 349 (4.6%) | 489 (5.4%) |
| 50 to 54 Years | 557 (7.3%) | 708 (7.8%) |
| 55 to 59 Years | 832 (10.9%) | 533 (5.9%) |
| 60 to 64 Years | 736 (9.6%) | 1,204 (13.3%) |
| 65 to 69 Years | 822 (10.7%) | 597 (6.6%) |
| 70 to 74 Years | 435 (5.7%) | 700 (7.7%) |
| 75 to 79 Years | 218 (2.9%) | 557 (6.1%) |
| 80 to 84 Years | 234 (3.1%) | 347 (3.8%) |
| 85 Years and over | 294 (3.8%) | 580 (6.4%) |
| Total | 7,654 (100.0%) | 9,088 (100.0%) |
Families and Households in New Port Richey
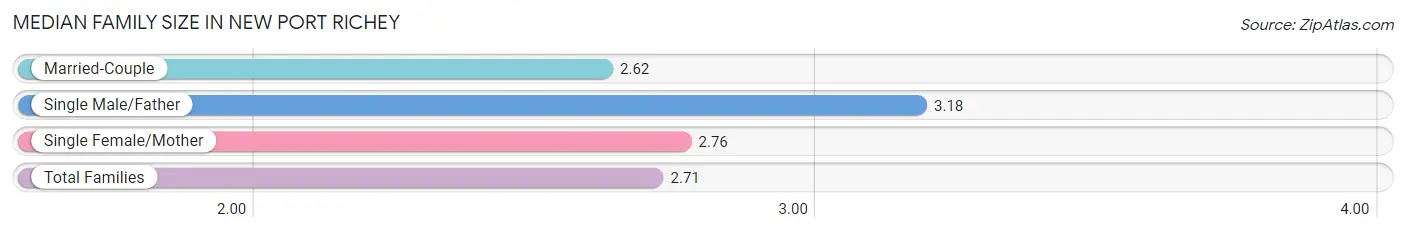
Median Family Size in New Port Richey
The median family size in New Port Richey is 2.71 persons per family, with single male/father families (338 | 8.3%) accounting for the largest median family size of 3.18 persons per family. On the other hand, married-couple families (2,506 | 61.9%) represent the smallest median family size with 2.62 persons per family.
| Family Type | # Families | Family Size |
| Married-Couple | 2,506 (61.9%) | 2.62 |
| Single Male/Father | 338 (8.3%) | 3.18 |
| Single Female/Mother | 1,207 (29.8%) | 2.76 |
| Total Families | 4,051 (100.0%) | 2.71 |
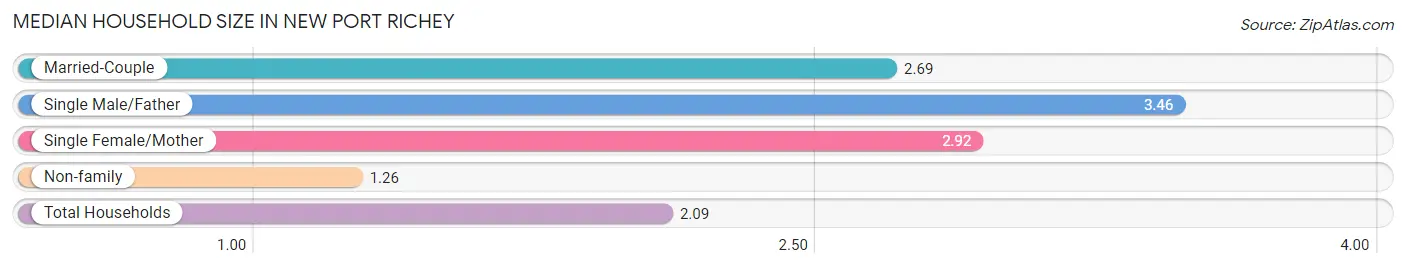
Median Household Size in New Port Richey
The median household size in New Port Richey is 2.09 persons per household, with single male/father households (338 | 4.4%) accounting for the largest median household size of 3.46 persons per household. non-family households (3,607 | 47.1%) represent the smallest median household size with 1.26 persons per household.
| Household Type | # Households | Household Size |
| Married-Couple | 2,506 (32.7%) | 2.69 |
| Single Male/Father | 338 (4.4%) | 3.46 |
| Single Female/Mother | 1,207 (15.8%) | 2.92 |
| Non-family | 3,607 (47.1%) | 1.26 |
| Total Households | 7,658 (100.0%) | 2.09 |
Household Size by Marriage Status in New Port Richey
Out of a total of 7,658 households in New Port Richey, 4,051 (52.9%) are family households, while 3,607 (47.1%) are nonfamily households. The most numerous type of family households are 2-person households, comprising 2,502, and the most common type of nonfamily households are 1-person households, comprising 2,985.
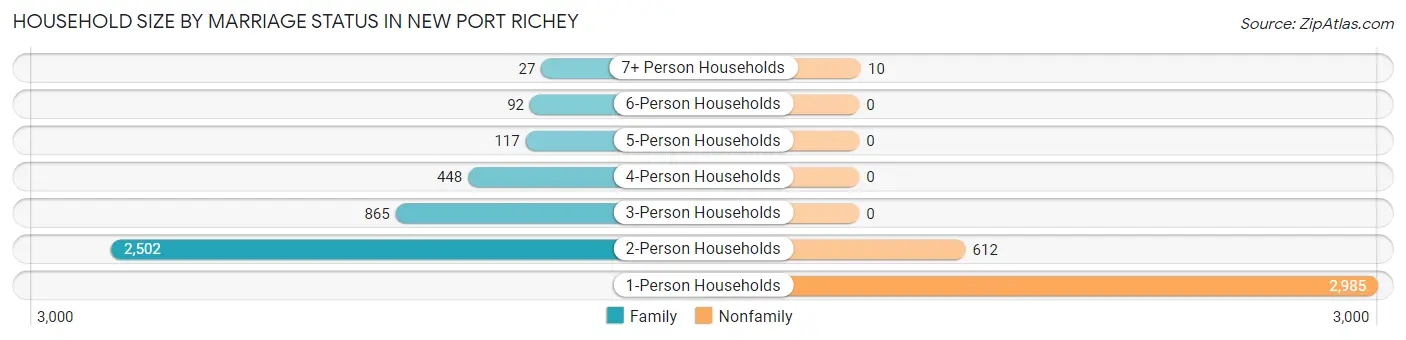
| Household Size | Family Households | Nonfamily Households |
| 1-Person Households | - | 2,985 (39.0%) |
| 2-Person Households | 2,502 (32.7%) | 612 (8.0%) |
| 3-Person Households | 865 (11.3%) | 0 (0.0%) |
| 4-Person Households | 448 (5.9%) | 0 (0.0%) |
| 5-Person Households | 117 (1.5%) | 0 (0.0%) |
| 6-Person Households | 92 (1.2%) | 0 (0.0%) |
| 7+ Person Households | 27 (0.4%) | 10 (0.1%) |
| Total | 4,051 (52.9%) | 3,607 (47.1%) |
Female Fertility in New Port Richey
Fertility by Age in New Port Richey
Average fertility rate in New Port Richey is 28.0 births per 1,000 women. Women in the age bracket of 20 to 34 years have the highest fertility rate with 64.0 births per 1,000 women. Women in the age bracket of 20 to 34 years acount for 85.4% of all women with births.
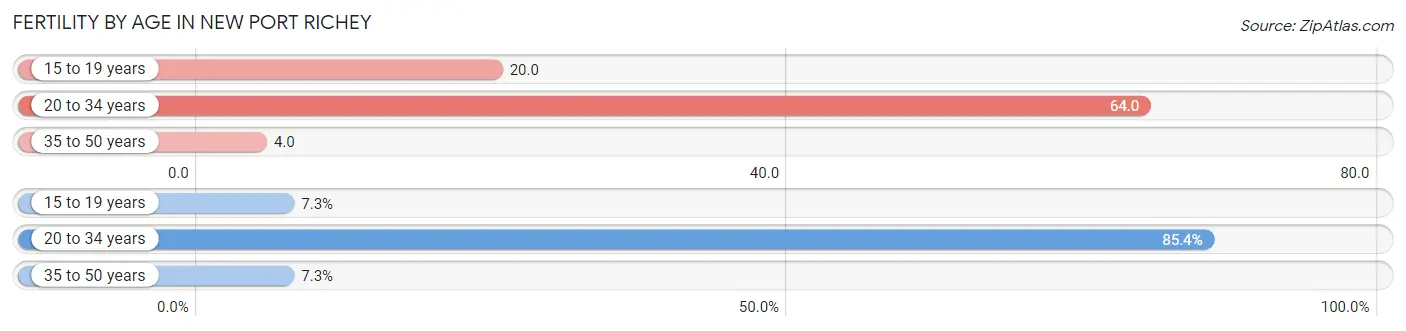
| Age Bracket | Women with Births | Births / 1,000 Women |
| 15 to 19 years | 6 (7.3%) | 20.0 |
| 20 to 34 years | 70 (85.4%) | 64.0 |
| 35 to 50 years | 6 (7.3%) | 4.0 |
| Total | 82 (100.0%) | 28.0 |
Fertility by Age by Marriage Status in New Port Richey
87.8% of women with births (82) in New Port Richey are married. The highest percentage of unmarried women with births falls into 15 to 19 years age bracket with 100.0% of them unmarried at the time of birth, while the lowest percentage of unmarried women with births belong to 35 to 50 years age bracket with 0.0% of them unmarried.
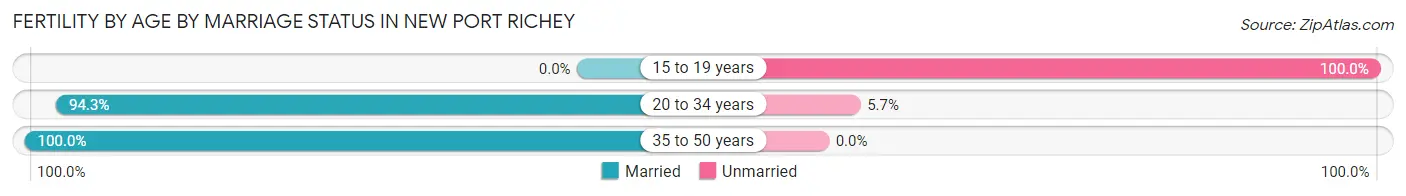
| Age Bracket | Married | Unmarried |
| 15 to 19 years | 0 (0.0%) | 6 (100.0%) |
| 20 to 34 years | 66 (94.3%) | 4 (5.7%) |
| 35 to 50 years | 6 (100.0%) | 0 (0.0%) |
| Total | 72 (87.8%) | 10 (12.2%) |
Fertility by Education in New Port Richey
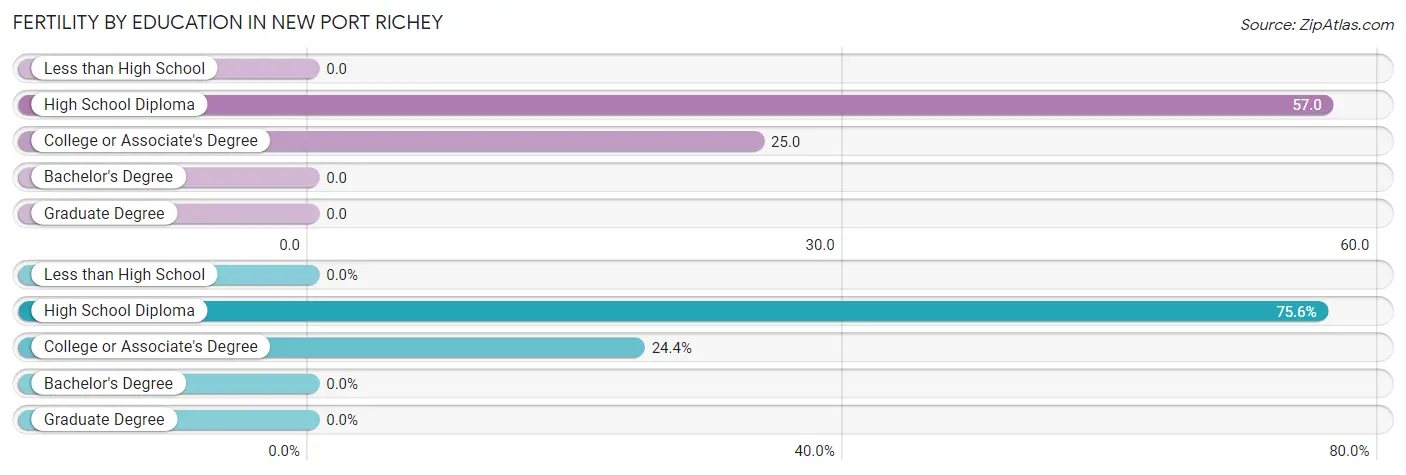
| Educational Attainment | Women with Births | Births / 1,000 Women |
| Less than High School | 0 (0.0%) | 0.0 |
| High School Diploma | 62 (75.6%) | 57.0 |
| College or Associate's Degree | 20 (24.4%) | 25.0 |
| Bachelor's Degree | 0 (0.0%) | 0.0 |
| Graduate Degree | 0 (0.0%) | 0.0 |
| Total | 82 (100.0%) | 28.0 |
Fertility by Education by Marriage Status in New Port Richey
12.2% of women with births in New Port Richey are unmarried. Women with the educational attainment of high school diploma are most likely to be married with 93.5% of them married at childbirth, while women with the educational attainment of college or associate's degree are least likely to be married with 30.0% of them unmarried at childbirth.
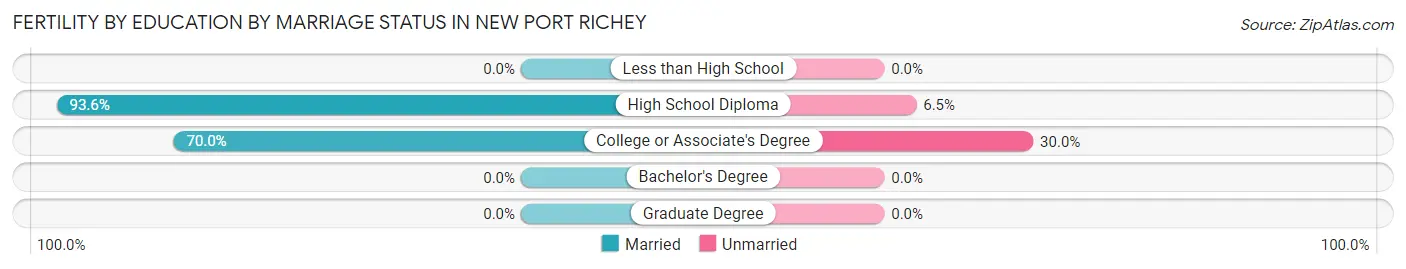
| Educational Attainment | Married | Unmarried |
| Less than High School | 0 (0.0%) | 0 (0.0%) |
| High School Diploma | 58 (93.5%) | 4 (6.5%) |
| College or Associate's Degree | 14 (70.0%) | 6 (30.0%) |
| Bachelor's Degree | 0 (0.0%) | 0 (0.0%) |
| Graduate Degree | 0 (0.0%) | 0 (0.0%) |
| Total | 72 (87.8%) | 10 (12.2%) |
Employment Characteristics in New Port Richey
Employment by Class of Employer in New Port Richey
Among the 6,360 employed individuals in New Port Richey, private company employees (4,567 | 71.8%), local government employees (504 | 7.9%), and self-employed (not incorporated) (471 | 7.4%) make up the most common classes of employment.
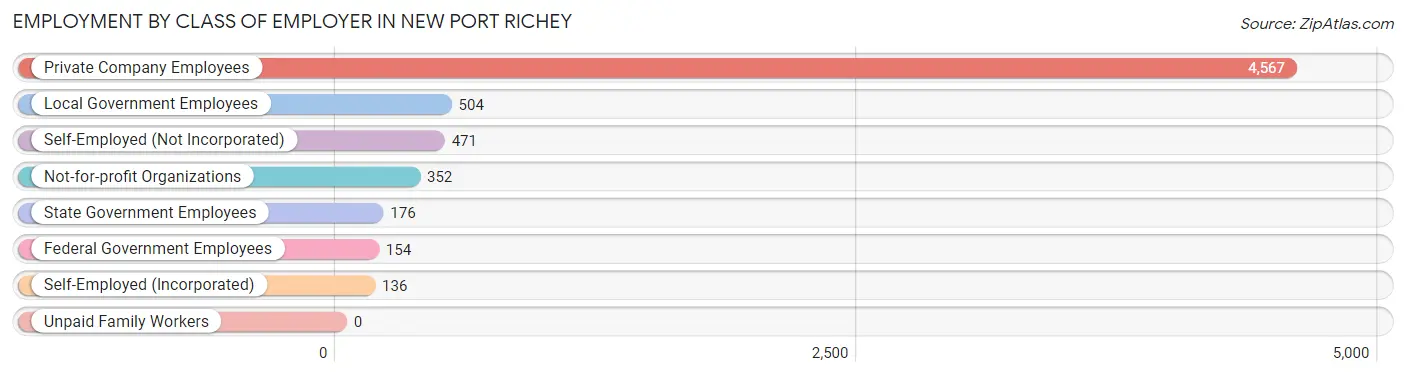
| Employer Class | # Employees | % Employees |
| Private Company Employees | 4,567 | 71.8% |
| Self-Employed (Incorporated) | 136 | 2.1% |
| Self-Employed (Not Incorporated) | 471 | 7.4% |
| Not-for-profit Organizations | 352 | 5.5% |
| Local Government Employees | 504 | 7.9% |
| State Government Employees | 176 | 2.8% |
| Federal Government Employees | 154 | 2.4% |
| Unpaid Family Workers | 0 | 0.0% |
| Total | 6,360 | 100.0% |
Employment Status by Age in New Port Richey
According to the labor force statistics for New Port Richey, out of the total population over 16 years of age (14,871), 45.3% or 6,737 individuals are in the labor force, with 4.0% or 269 of them unemployed. The age group with the highest labor force participation rate is 30 to 34 years, with 87.2% or 738 individuals in the labor force. Within the labor force, the 16 to 19 years age range has the highest percentage of unemployed individuals, with 25.3% or 42 of them being unemployed.
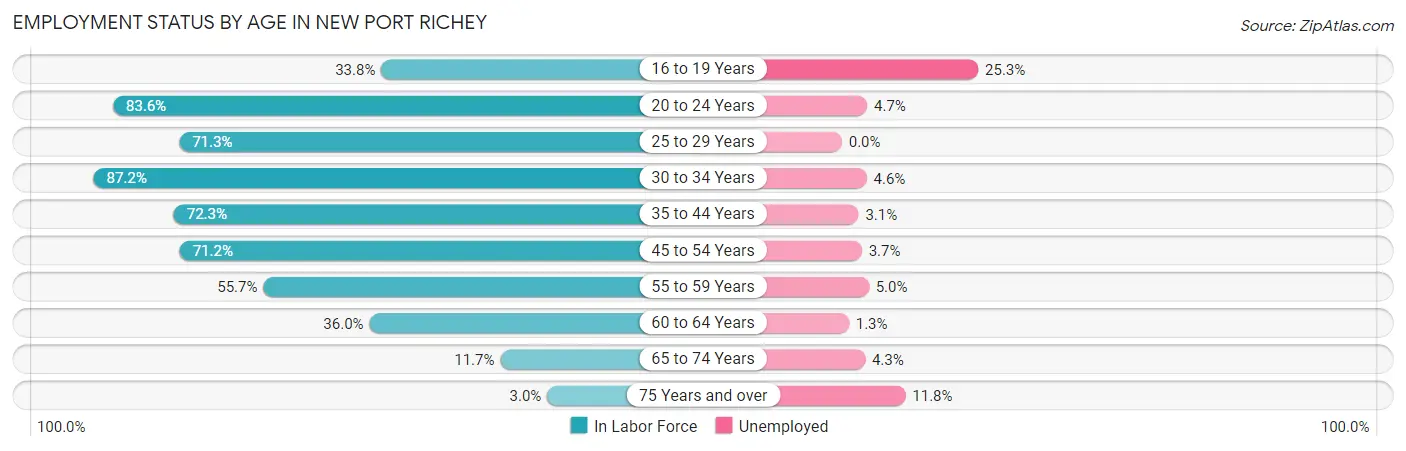
| Age Bracket | In Labor Force | Unemployed |
| 16 to 19 Years | 166 (33.8%) | 42 (25.3%) |
| 20 to 24 Years | 706 (83.6%) | 33 (4.7%) |
| 25 to 29 Years | 507 (71.3%) | 0 (0.0%) |
| 30 to 34 Years | 738 (87.2%) | 34 (4.6%) |
| 35 to 44 Years | 1,291 (72.3%) | 40 (3.1%) |
| 45 to 54 Years | 1,497 (71.2%) | 55 (3.7%) |
| 55 to 59 Years | 760 (55.7%) | 38 (5.0%) |
| 60 to 64 Years | 698 (36.0%) | 9 (1.3%) |
| 65 to 74 Years | 299 (11.7%) | 13 (4.3%) |
| 75 Years and over | 67 (3.0%) | 8 (11.8%) |
| Total | 6,737 (45.3%) | 269 (4.0%) |
Employment Status by Educational Attainment in New Port Richey
According to labor force statistics for New Port Richey, 62.8% of individuals (5,496) out of the total population between 25 and 64 years of age (8,751) are in the labor force, with 3.2% or 176 of them being unemployed. The group with the highest labor force participation rate are those with the educational attainment of bachelor's degree or higher, with 74.7% or 994 individuals in the labor force. Within the labor force, individuals with college / associate degree education have the highest percentage of unemployment, with 4.5% or 94 of them being unemployed.
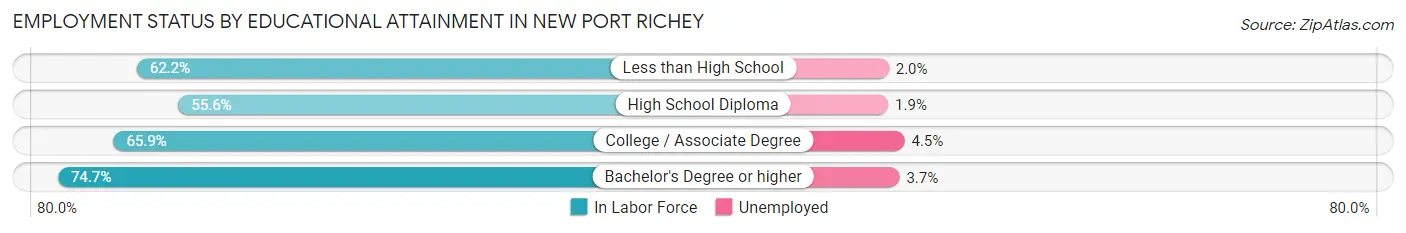
| Educational Attainment | In Labor Force | Unemployed |
| Less than High School | 455 (62.2%) | 15 (2.0%) |
| High School Diploma | 1,963 (55.6%) | 67 (1.9%) |
| College / Associate Degree | 2,080 (65.9%) | 142 (4.5%) |
| Bachelor's Degree or higher | 994 (74.7%) | 49 (3.7%) |
| Total | 5,496 (62.8%) | 280 (3.2%) |
Employment Occupations by Sex in New Port Richey
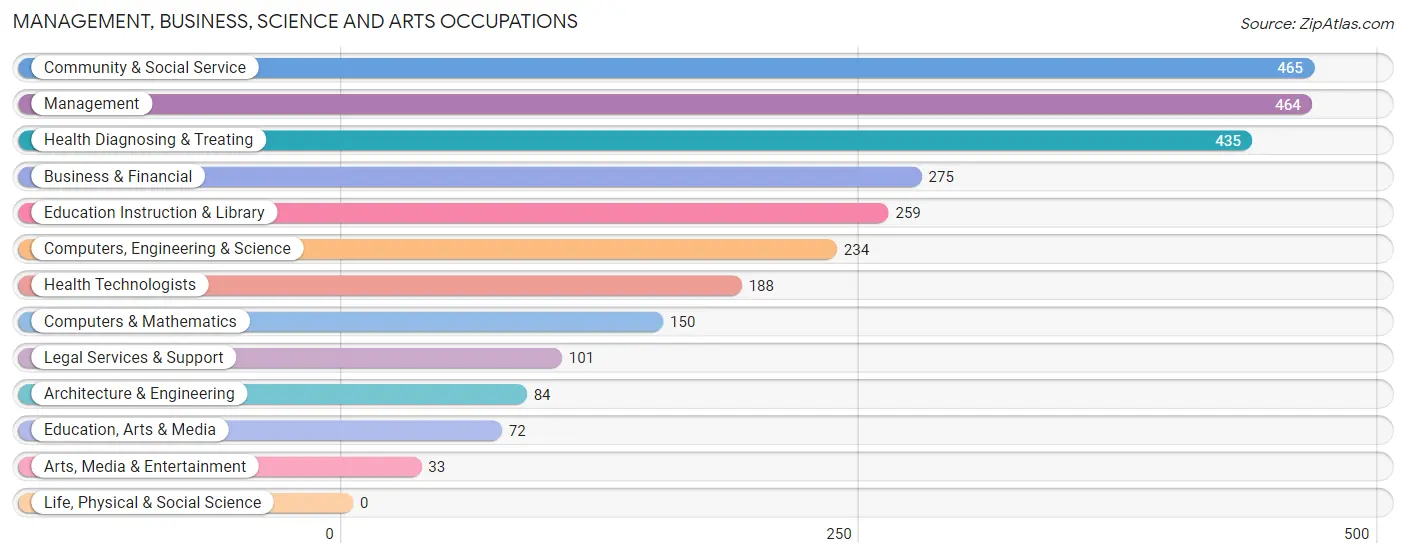
Management, Business, Science and Arts Occupations
The most common Management, Business, Science and Arts occupations in New Port Richey are Community & Social Service (465 | 7.2%), Management (464 | 7.2%), Health Diagnosing & Treating (435 | 6.7%), Business & Financial (275 | 4.3%), and Education Instruction & Library (259 | 4.0%).
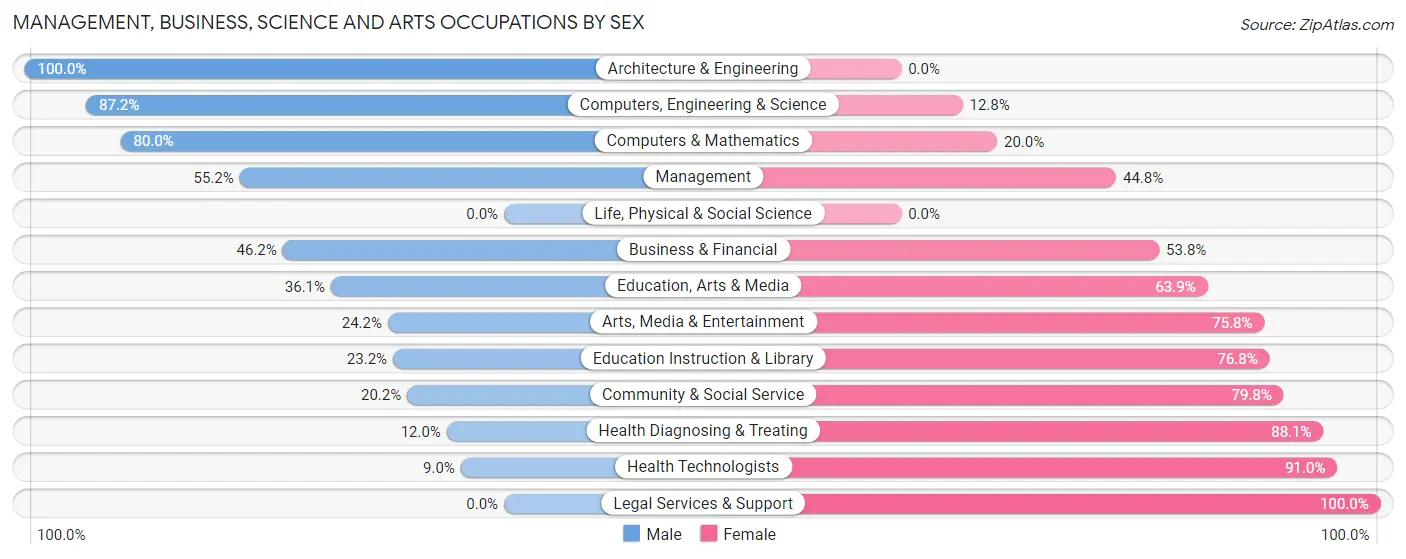
Management, Business, Science and Arts Occupations by Sex
Within the Management, Business, Science and Arts occupations in New Port Richey, the most male-oriented occupations are Architecture & Engineering (100.0%), Computers, Engineering & Science (87.2%), and Computers & Mathematics (80.0%), while the most female-oriented occupations are Legal Services & Support (100.0%), Health Technologists (91.0%), and Health Diagnosing & Treating (88.0%).
| Occupation | Male | Female |
| Management | 256 (55.2%) | 208 (44.8%) |
| Business & Financial | 127 (46.2%) | 148 (53.8%) |
| Computers, Engineering & Science | 204 (87.2%) | 30 (12.8%) |
| Computers & Mathematics | 120 (80.0%) | 30 (20.0%) |
| Architecture & Engineering | 84 (100.0%) | 0 (0.0%) |
| Life, Physical & Social Science | 0 (0.0%) | 0 (0.0%) |
| Community & Social Service | 94 (20.2%) | 371 (79.8%) |
| Education, Arts & Media | 26 (36.1%) | 46 (63.9%) |
| Legal Services & Support | 0 (0.0%) | 101 (100.0%) |
| Education Instruction & Library | 60 (23.2%) | 199 (76.8%) |
| Arts, Media & Entertainment | 8 (24.2%) | 25 (75.8%) |
| Health Diagnosing & Treating | 52 (11.9%) | 383 (88.0%) |
| Health Technologists | 17 (9.0%) | 171 (91.0%) |
| Total (Category) | 733 (39.1%) | 1,140 (60.9%) |
| Total (Overall) | 3,407 (52.7%) | 3,052 (47.2%) |
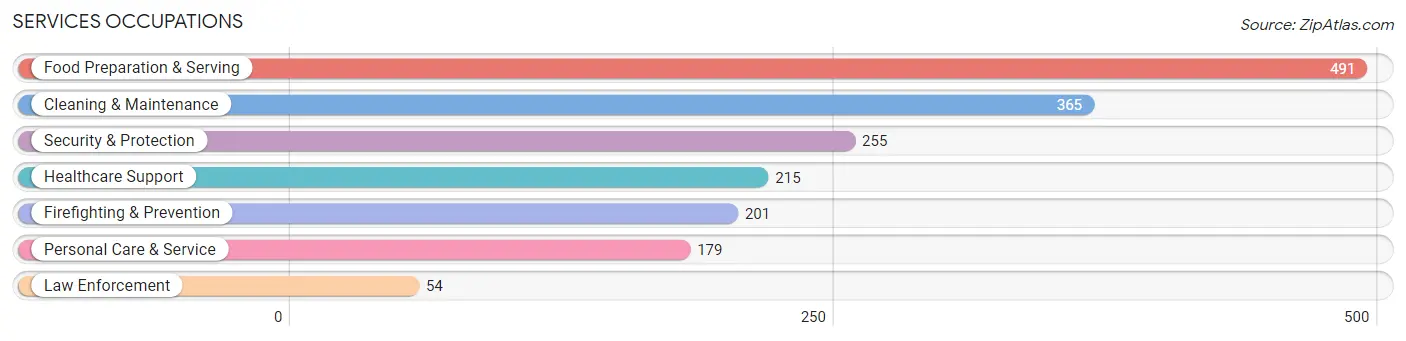
Services Occupations
The most common Services occupations in New Port Richey are Food Preparation & Serving (491 | 7.6%), Cleaning & Maintenance (365 | 5.7%), Security & Protection (255 | 4.0%), Healthcare Support (215 | 3.3%), and Firefighting & Prevention (201 | 3.1%).
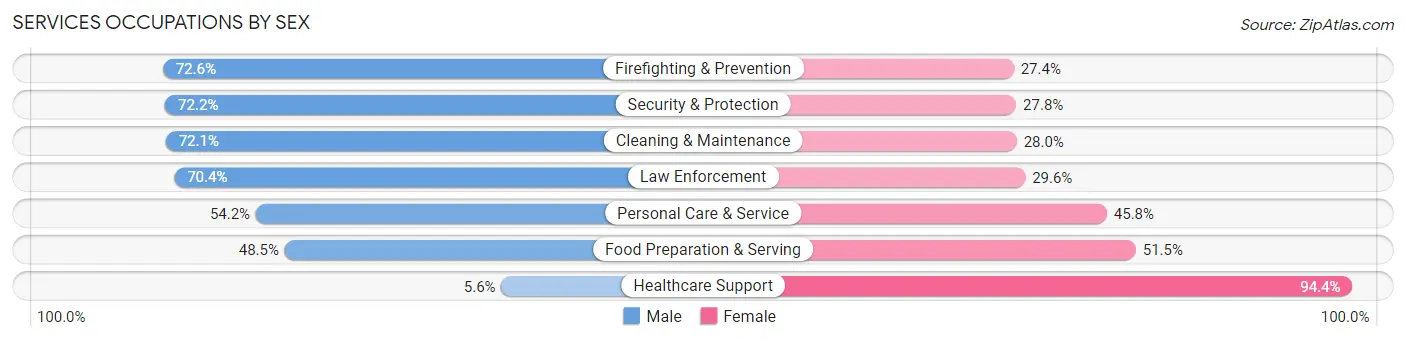
Services Occupations by Sex
Within the Services occupations in New Port Richey, the most male-oriented occupations are Firefighting & Prevention (72.6%), Security & Protection (72.2%), and Cleaning & Maintenance (72.1%), while the most female-oriented occupations are Healthcare Support (94.4%), Food Preparation & Serving (51.5%), and Personal Care & Service (45.8%).
| Occupation | Male | Female |
| Healthcare Support | 12 (5.6%) | 203 (94.4%) |
| Security & Protection | 184 (72.2%) | 71 (27.8%) |
| Firefighting & Prevention | 146 (72.6%) | 55 (27.4%) |
| Law Enforcement | 38 (70.4%) | 16 (29.6%) |
| Food Preparation & Serving | 238 (48.5%) | 253 (51.5%) |
| Cleaning & Maintenance | 263 (72.1%) | 102 (28.0%) |
| Personal Care & Service | 97 (54.2%) | 82 (45.8%) |
| Total (Category) | 794 (52.8%) | 711 (47.2%) |
| Total (Overall) | 3,407 (52.7%) | 3,052 (47.2%) |
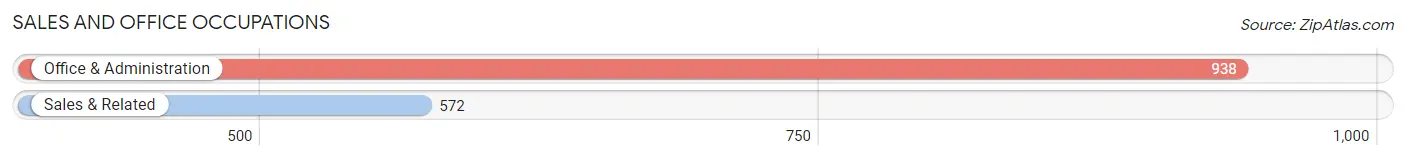
Sales and Office Occupations
The most common Sales and Office occupations in New Port Richey are Office & Administration (938 | 14.5%), and Sales & Related (572 | 8.9%).
Sales and Office Occupations by Sex
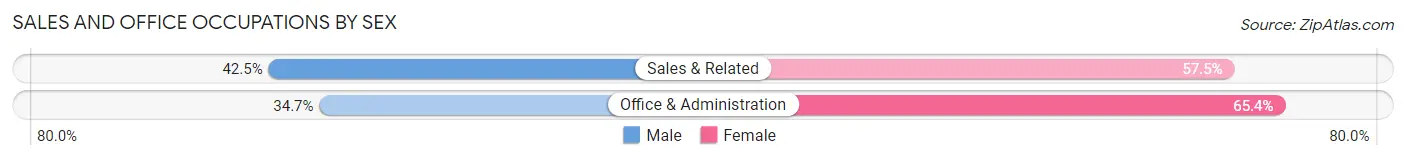
| Occupation | Male | Female |
| Sales & Related | 243 (42.5%) | 329 (57.5%) |
| Office & Administration | 325 (34.6%) | 613 (65.3%) |
| Total (Category) | 568 (37.6%) | 942 (62.4%) |
| Total (Overall) | 3,407 (52.7%) | 3,052 (47.2%) |
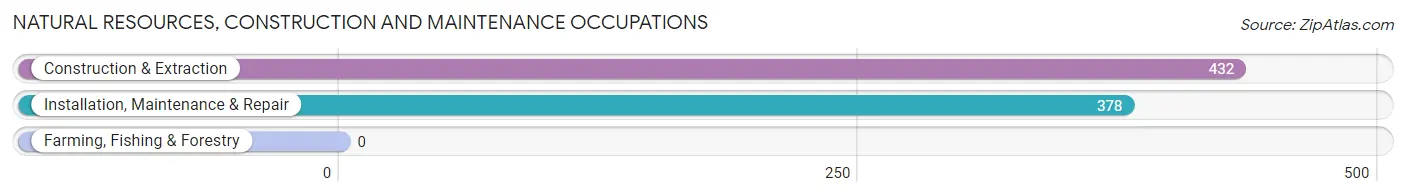
Natural Resources, Construction and Maintenance Occupations
The most common Natural Resources, Construction and Maintenance occupations in New Port Richey are Construction & Extraction (432 | 6.7%), and Installation, Maintenance & Repair (378 | 5.9%).
Natural Resources, Construction and Maintenance Occupations by Sex
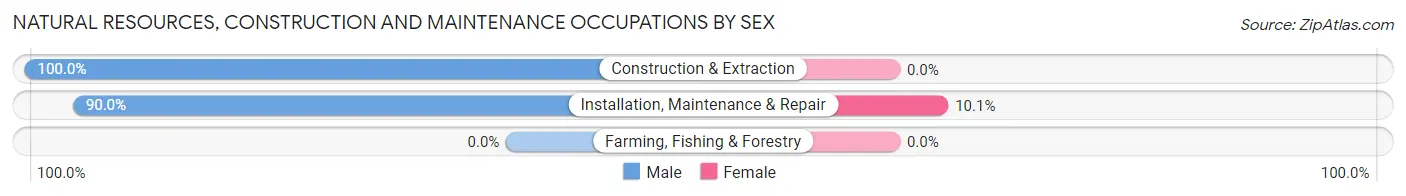
| Occupation | Male | Female |
| Farming, Fishing & Forestry | 0 (0.0%) | 0 (0.0%) |
| Construction & Extraction | 432 (100.0%) | 0 (0.0%) |
| Installation, Maintenance & Repair | 340 (89.9%) | 38 (10.1%) |
| Total (Category) | 772 (95.3%) | 38 (4.7%) |
| Total (Overall) | 3,407 (52.7%) | 3,052 (47.2%) |
Production, Transportation and Moving Occupations
The most common Production, Transportation and Moving occupations in New Port Richey are Transportation (322 | 5.0%), Material Moving (255 | 4.0%), and Production (184 | 2.9%).
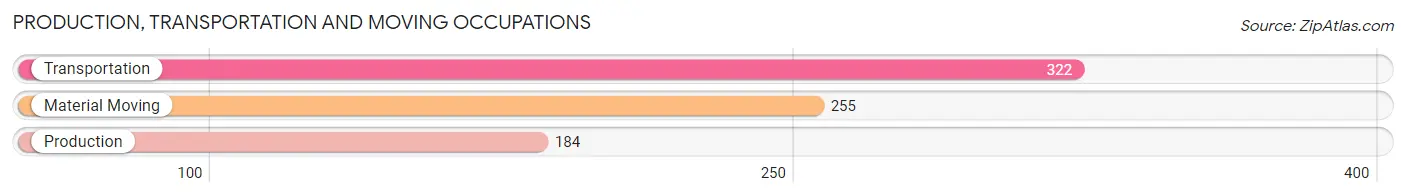
Production, Transportation and Moving Occupations by Sex
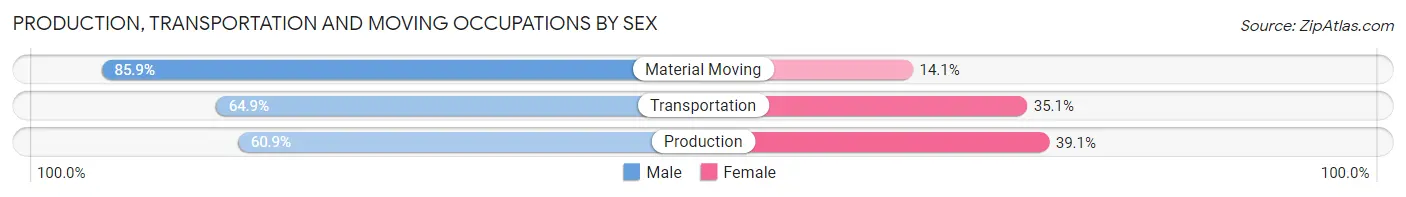
| Occupation | Male | Female |
| Production | 112 (60.9%) | 72 (39.1%) |
| Transportation | 209 (64.9%) | 113 (35.1%) |
| Material Moving | 219 (85.9%) | 36 (14.1%) |
| Total (Category) | 540 (71.0%) | 221 (29.0%) |
| Total (Overall) | 3,407 (52.7%) | 3,052 (47.2%) |
Employment Industries by Sex in New Port Richey
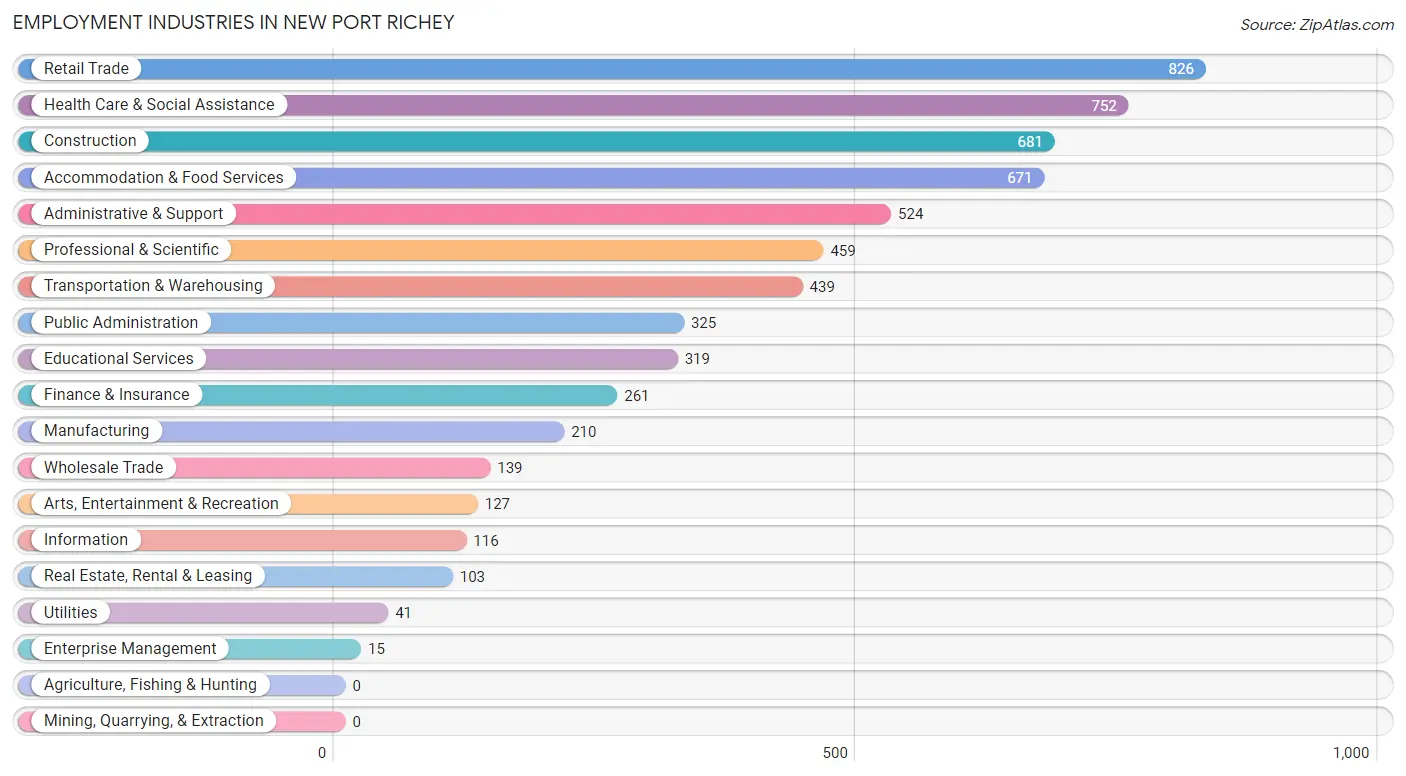
Employment Industries in New Port Richey
The major employment industries in New Port Richey include Retail Trade (826 | 12.8%), Health Care & Social Assistance (752 | 11.6%), Construction (681 | 10.5%), Accommodation & Food Services (671 | 10.4%), and Administrative & Support (524 | 8.1%).
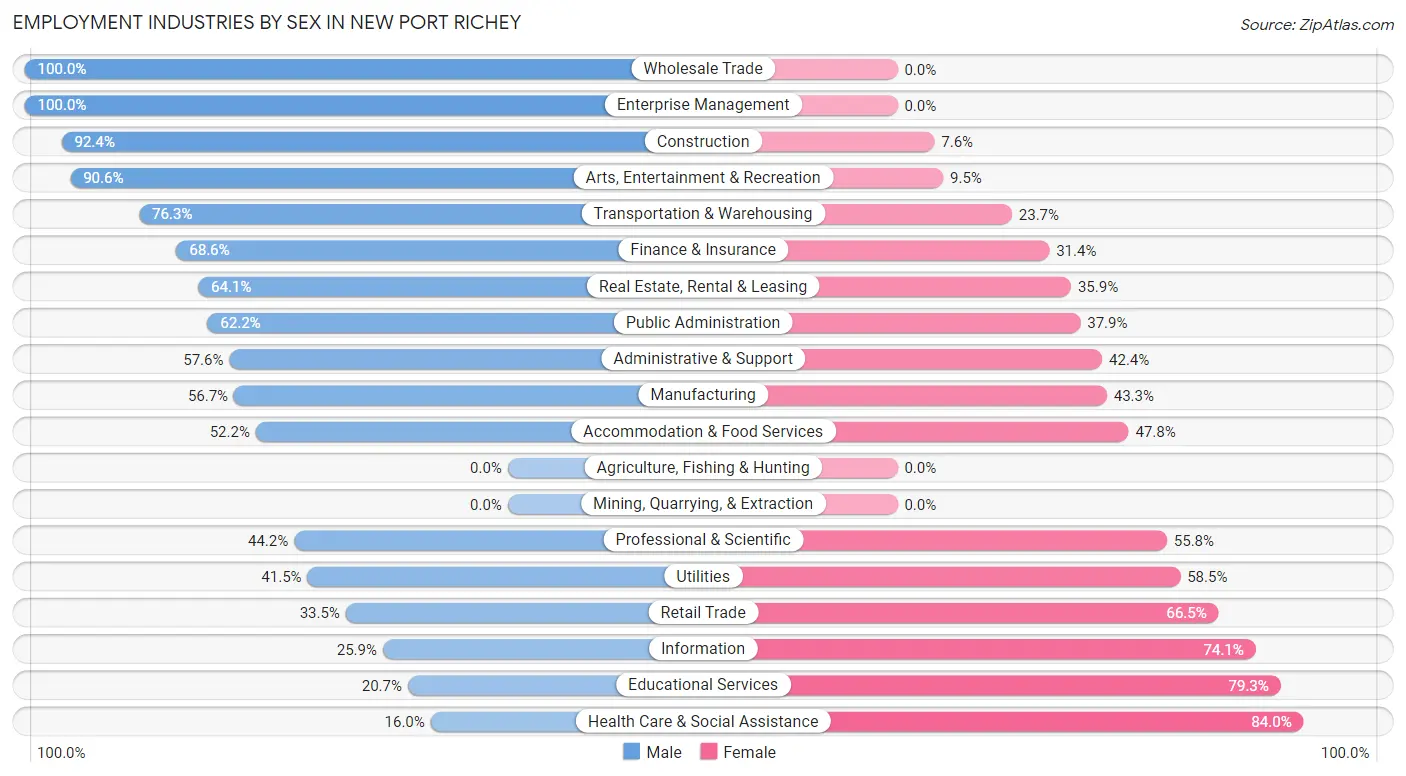
Employment Industries by Sex in New Port Richey
The New Port Richey industries that see more men than women are Wholesale Trade (100.0%), Enterprise Management (100.0%), and Construction (92.4%), whereas the industries that tend to have a higher number of women are Health Care & Social Assistance (84.0%), Educational Services (79.3%), and Information (74.1%).
| Industry | Male | Female |
| Agriculture, Fishing & Hunting | 0 (0.0%) | 0 (0.0%) |
| Mining, Quarrying, & Extraction | 0 (0.0%) | 0 (0.0%) |
| Construction | 629 (92.4%) | 52 (7.6%) |
| Manufacturing | 119 (56.7%) | 91 (43.3%) |
| Wholesale Trade | 139 (100.0%) | 0 (0.0%) |
| Retail Trade | 277 (33.5%) | 549 (66.5%) |
| Transportation & Warehousing | 335 (76.3%) | 104 (23.7%) |
| Utilities | 17 (41.5%) | 24 (58.5%) |
| Information | 30 (25.9%) | 86 (74.1%) |
| Finance & Insurance | 179 (68.6%) | 82 (31.4%) |
| Real Estate, Rental & Leasing | 66 (64.1%) | 37 (35.9%) |
| Professional & Scientific | 203 (44.2%) | 256 (55.8%) |
| Enterprise Management | 15 (100.0%) | 0 (0.0%) |
| Administrative & Support | 302 (57.6%) | 222 (42.4%) |
| Educational Services | 66 (20.7%) | 253 (79.3%) |
| Health Care & Social Assistance | 120 (16.0%) | 632 (84.0%) |
| Arts, Entertainment & Recreation | 115 (90.5%) | 12 (9.5%) |
| Accommodation & Food Services | 350 (52.2%) | 321 (47.8%) |
| Public Administration | 202 (62.2%) | 123 (37.9%) |
| Total | 3,407 (52.7%) | 3,052 (47.2%) |
Education in New Port Richey
School Enrollment in New Port Richey
The most common levels of schooling among the 2,062 students in New Port Richey are middle school (579 | 28.1%), college / undergraduate (471 | 22.8%), and high school (417 | 20.2%).
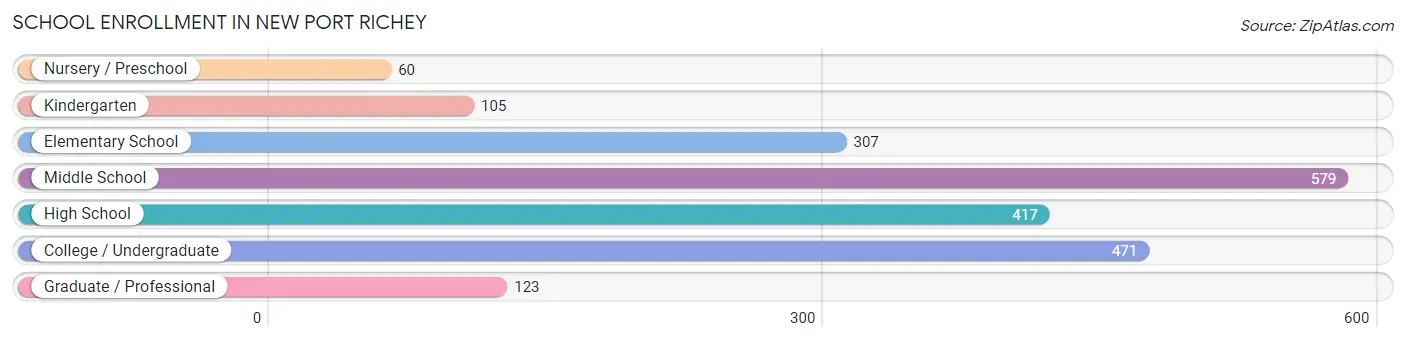
| School Level | # Students | % Students |
| Nursery / Preschool | 60 | 2.9% |
| Kindergarten | 105 | 5.1% |
| Elementary School | 307 | 14.9% |
| Middle School | 579 | 28.1% |
| High School | 417 | 20.2% |
| College / Undergraduate | 471 | 22.8% |
| Graduate / Professional | 123 | 6.0% |
| Total | 2,062 | 100.0% |
School Enrollment by Age by Funding Source in New Port Richey
Out of a total of 2,062 students who are enrolled in schools in New Port Richey, 299 (14.5%) attend a private institution, while the remaining 1,763 (85.5%) are enrolled in public schools. The age group of 35 years and over has the highest likelihood of being enrolled in private schools, with 84 (34.4% in the age bracket) enrolled. Conversely, the age group of 5 to 9 year old has the lowest likelihood of being enrolled in a private school, with 400 (95.5% in the age bracket) attending a public institution.
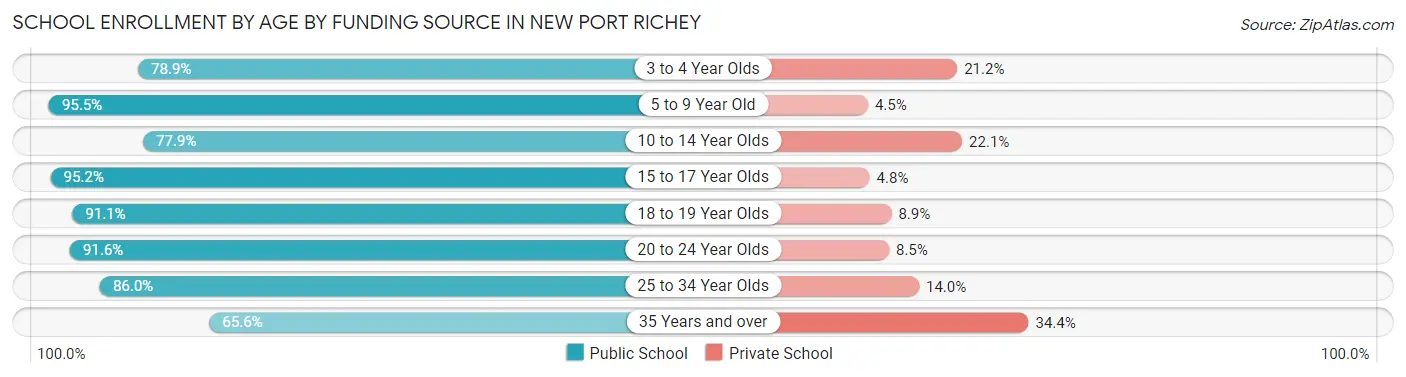
| Age Bracket | Public School | Private School |
| 3 to 4 Year Olds | 41 (78.8%) | 11 (21.1%) |
| 5 to 9 Year Old | 400 (95.5%) | 19 (4.5%) |
| 10 to 14 Year Olds | 452 (77.9%) | 128 (22.1%) |
| 15 to 17 Year Olds | 334 (95.2%) | 17 (4.8%) |
| 18 to 19 Year Olds | 133 (91.1%) | 13 (8.9%) |
| 20 to 24 Year Olds | 195 (91.5%) | 18 (8.5%) |
| 25 to 34 Year Olds | 49 (86.0%) | 8 (14.0%) |
| 35 Years and over | 160 (65.6%) | 84 (34.4%) |
| Total | 1,763 (85.5%) | 299 (14.5%) |
Educational Attainment by Field of Study in New Port Richey
Education (538 | 23.8%), business (489 | 21.6%), science & technology (336 | 14.8%), arts & humanities (173 | 7.6%), and engineering (122 | 5.4%) are the most common fields of study among 2,263 individuals in New Port Richey who have obtained a bachelor's degree or higher.
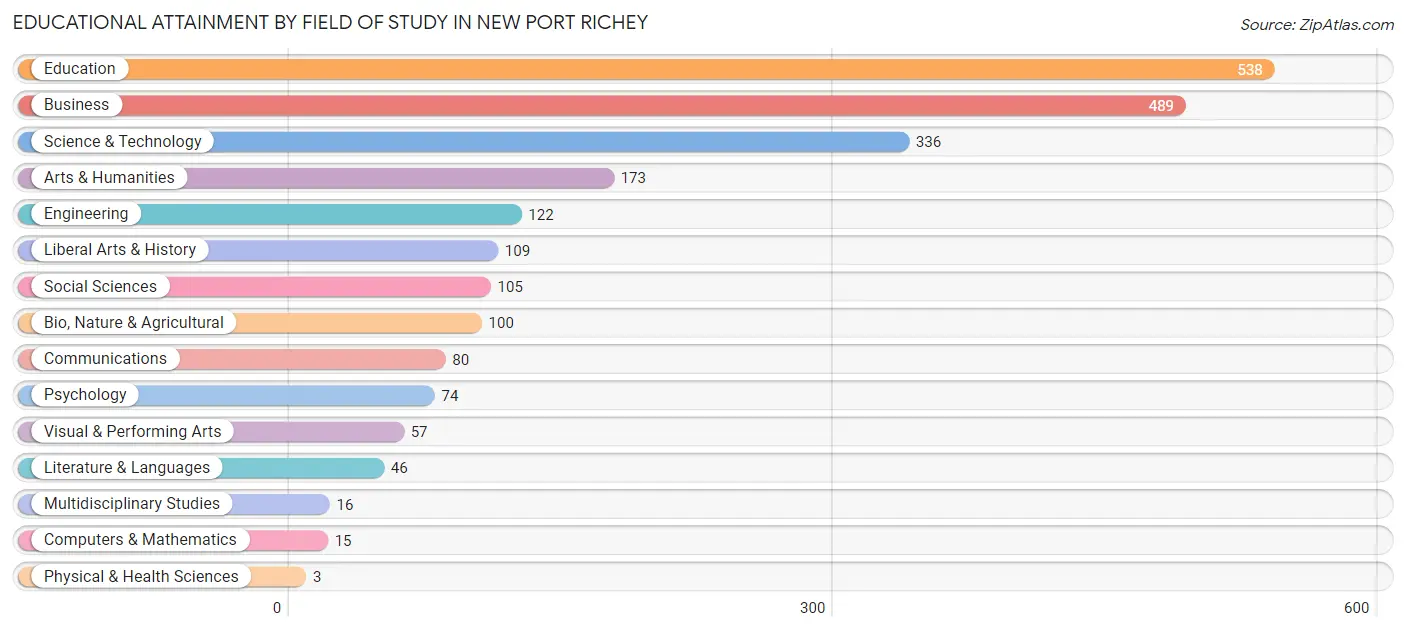
| Field of Study | # Graduates | % Graduates |
| Computers & Mathematics | 15 | 0.7% |
| Bio, Nature & Agricultural | 100 | 4.4% |
| Physical & Health Sciences | 3 | 0.1% |
| Psychology | 74 | 3.3% |
| Social Sciences | 105 | 4.6% |
| Engineering | 122 | 5.4% |
| Multidisciplinary Studies | 16 | 0.7% |
| Science & Technology | 336 | 14.8% |
| Business | 489 | 21.6% |
| Education | 538 | 23.8% |
| Literature & Languages | 46 | 2.0% |
| Liberal Arts & History | 109 | 4.8% |
| Visual & Performing Arts | 57 | 2.5% |
| Communications | 80 | 3.5% |
| Arts & Humanities | 173 | 7.6% |
| Total | 2,263 | 100.0% |
Transportation & Commute in New Port Richey
Vehicle Availability by Sex in New Port Richey
The most prevalent vehicle ownership categories in New Port Richey are males with 2 vehicles (1,303, accounting for 39.0%) and females with 2 vehicles (1,056, making up 43.1%).
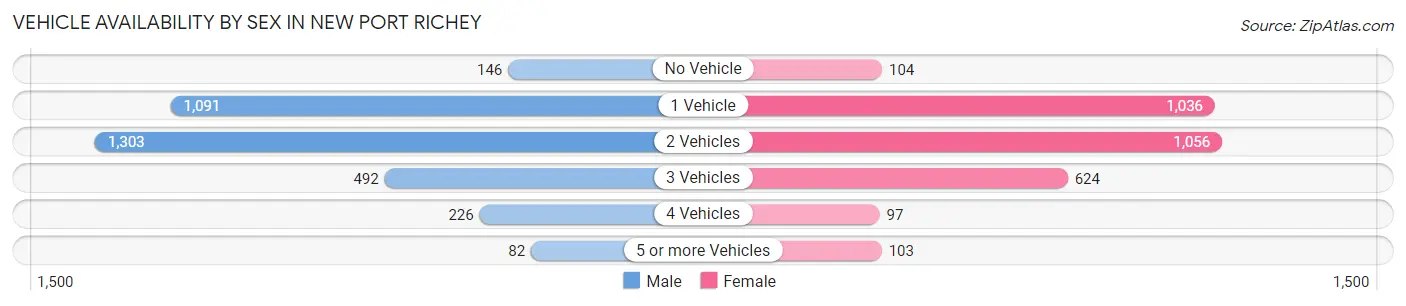
| Vehicles Available | Male | Female |
| No Vehicle | 146 (4.4%) | 104 (3.4%) |
| 1 Vehicle | 1,091 (32.7%) | 1,036 (34.3%) |
| 2 Vehicles | 1,303 (39.0%) | 1,056 (35.0%) |
| 3 Vehicles | 492 (14.7%) | 624 (20.7%) |
| 4 Vehicles | 226 (6.8%) | 97 (3.2%) |
| 5 or more Vehicles | 82 (2.5%) | 103 (3.4%) |
| Total | 3,340 (100.0%) | 3,020 (100.0%) |
Commute Time in New Port Richey
The most frequently occuring commute durations in New Port Richey are 10 to 14 minutes (825 commuters, 14.6%), 60 to 89 minutes (800 commuters, 14.2%), and 5 to 9 minutes (748 commuters, 13.3%).
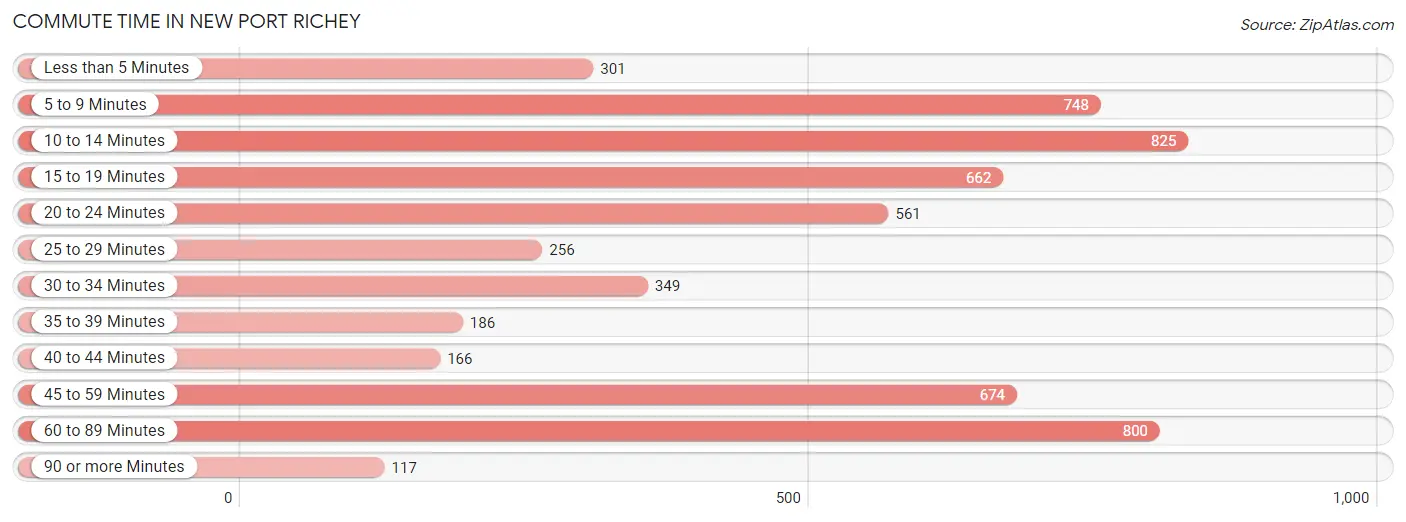
| Commute Time | # Commuters | % Commuters |
| Less than 5 Minutes | 301 | 5.3% |
| 5 to 9 Minutes | 748 | 13.3% |
| 10 to 14 Minutes | 825 | 14.6% |
| 15 to 19 Minutes | 662 | 11.7% |
| 20 to 24 Minutes | 561 | 9.9% |
| 25 to 29 Minutes | 256 | 4.5% |
| 30 to 34 Minutes | 349 | 6.2% |
| 35 to 39 Minutes | 186 | 3.3% |
| 40 to 44 Minutes | 166 | 2.9% |
| 45 to 59 Minutes | 674 | 11.9% |
| 60 to 89 Minutes | 800 | 14.2% |
| 90 or more Minutes | 117 | 2.1% |
Commute Time by Sex in New Port Richey
The most common commute times in New Port Richey are 60 to 89 minutes (540 commuters, 18.4%) for males and 5 to 9 minutes (519 commuters, 19.2%) for females.
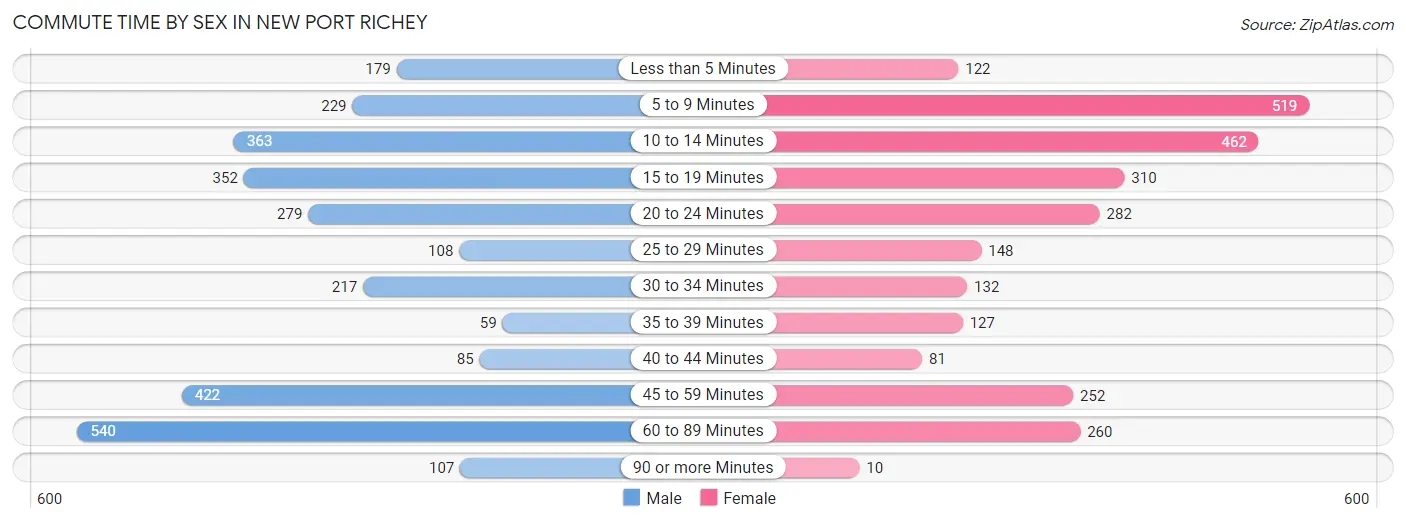
| Commute Time | Male | Female |
| Less than 5 Minutes | 179 (6.1%) | 122 (4.5%) |
| 5 to 9 Minutes | 229 (7.8%) | 519 (19.2%) |
| 10 to 14 Minutes | 363 (12.3%) | 462 (17.1%) |
| 15 to 19 Minutes | 352 (12.0%) | 310 (11.5%) |
| 20 to 24 Minutes | 279 (9.5%) | 282 (10.4%) |
| 25 to 29 Minutes | 108 (3.7%) | 148 (5.5%) |
| 30 to 34 Minutes | 217 (7.4%) | 132 (4.9%) |
| 35 to 39 Minutes | 59 (2.0%) | 127 (4.7%) |
| 40 to 44 Minutes | 85 (2.9%) | 81 (3.0%) |
| 45 to 59 Minutes | 422 (14.3%) | 252 (9.3%) |
| 60 to 89 Minutes | 540 (18.4%) | 260 (9.6%) |
| 90 or more Minutes | 107 (3.6%) | 10 (0.4%) |
Time of Departure to Work by Sex in New Port Richey
The most frequent times of departure to work in New Port Richey are 7:00 AM to 7:29 AM (482, 16.4%) for males and 8:00 AM to 8:29 AM (475, 17.6%) for females.
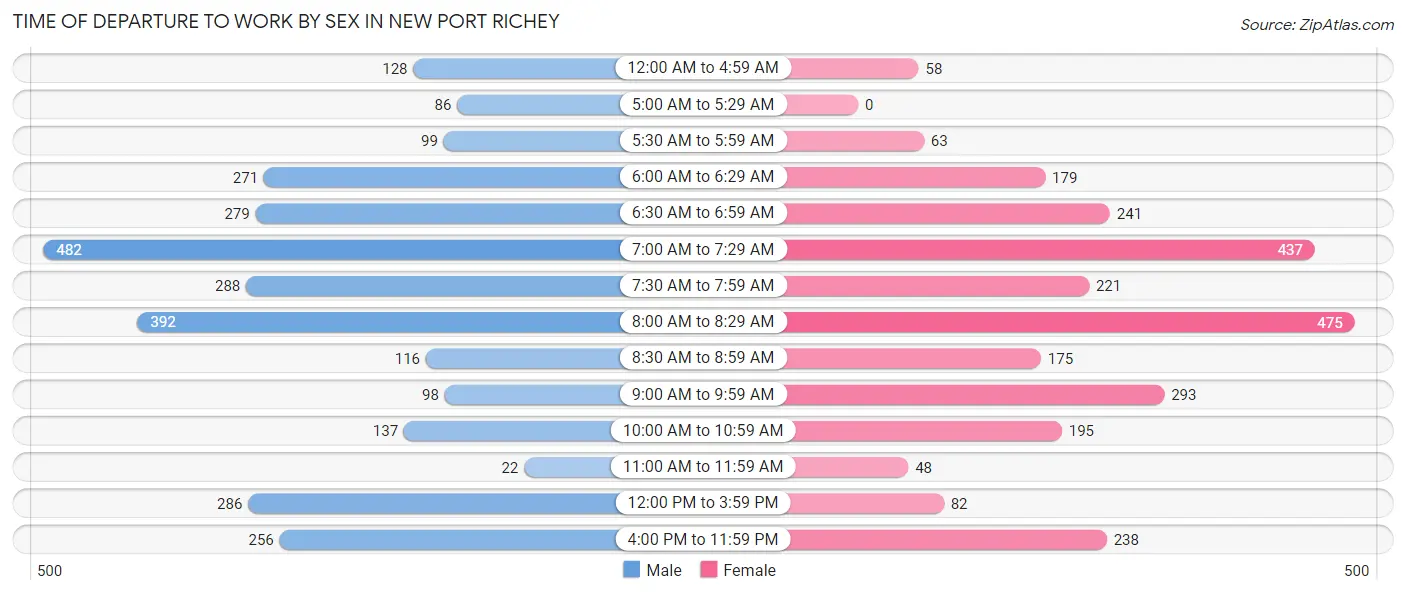
| Time of Departure | Male | Female |
| 12:00 AM to 4:59 AM | 128 (4.3%) | 58 (2.1%) |
| 5:00 AM to 5:29 AM | 86 (2.9%) | 0 (0.0%) |
| 5:30 AM to 5:59 AM | 99 (3.4%) | 63 (2.3%) |
| 6:00 AM to 6:29 AM | 271 (9.2%) | 179 (6.6%) |
| 6:30 AM to 6:59 AM | 279 (9.5%) | 241 (8.9%) |
| 7:00 AM to 7:29 AM | 482 (16.4%) | 437 (16.2%) |
| 7:30 AM to 7:59 AM | 288 (9.8%) | 221 (8.2%) |
| 8:00 AM to 8:29 AM | 392 (13.3%) | 475 (17.6%) |
| 8:30 AM to 8:59 AM | 116 (4.0%) | 175 (6.5%) |
| 9:00 AM to 9:59 AM | 98 (3.3%) | 293 (10.8%) |
| 10:00 AM to 10:59 AM | 137 (4.7%) | 195 (7.2%) |
| 11:00 AM to 11:59 AM | 22 (0.7%) | 48 (1.8%) |
| 12:00 PM to 3:59 PM | 286 (9.7%) | 82 (3.0%) |
| 4:00 PM to 11:59 PM | 256 (8.7%) | 238 (8.8%) |
| Total | 2,940 (100.0%) | 2,705 (100.0%) |
Housing Occupancy in New Port Richey
Occupancy by Ownership in New Port Richey
Of the total 7,658 dwellings in New Port Richey, owner-occupied units account for 4,380 (57.2%), while renter-occupied units make up 3,278 (42.8%).
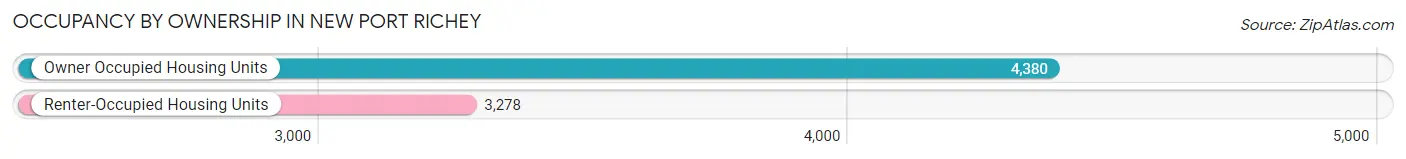
| Occupancy | # Housing Units | % Housing Units |
| Owner Occupied Housing Units | 4,380 | 57.2% |
| Renter-Occupied Housing Units | 3,278 | 42.8% |
| Total Occupied Housing Units | 7,658 | 100.0% |
Occupancy by Household Size in New Port Richey
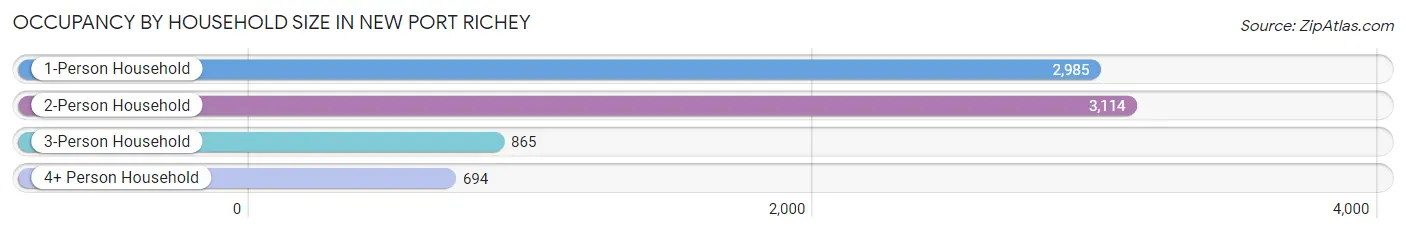
| Household Size | # Housing Units | % Housing Units |
| 1-Person Household | 2,985 | 39.0% |
| 2-Person Household | 3,114 | 40.7% |
| 3-Person Household | 865 | 11.3% |
| 4+ Person Household | 694 | 9.1% |
| Total Housing Units | 7,658 | 100.0% |
Occupancy by Ownership by Household Size in New Port Richey
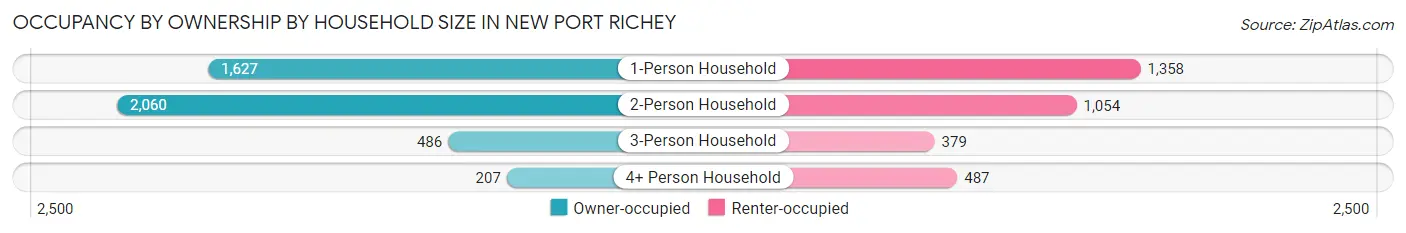
| Household Size | Owner-occupied | Renter-occupied |
| 1-Person Household | 1,627 (54.5%) | 1,358 (45.5%) |
| 2-Person Household | 2,060 (66.1%) | 1,054 (33.9%) |
| 3-Person Household | 486 (56.2%) | 379 (43.8%) |
| 4+ Person Household | 207 (29.8%) | 487 (70.2%) |
| Total Housing Units | 4,380 (57.2%) | 3,278 (42.8%) |
Occupancy by Educational Attainment in New Port Richey
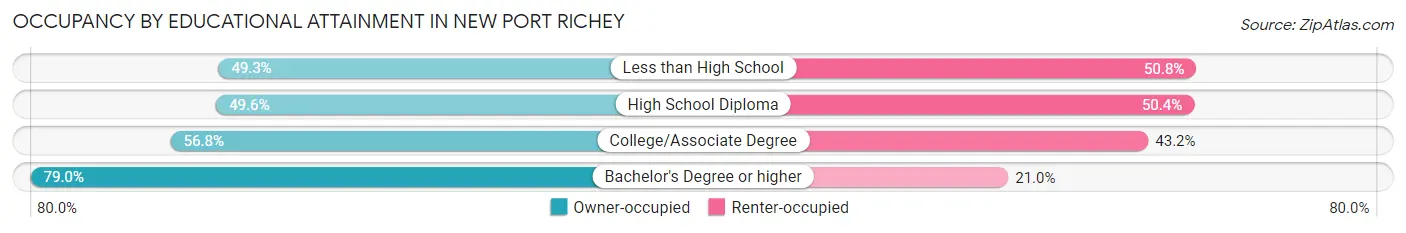
| Household Size | Owner-occupied | Renter-occupied |
| Less than High School | 263 (49.2%) | 271 (50.7%) |
| High School Diploma | 1,536 (49.6%) | 1,561 (50.4%) |
| College/Associate Degree | 1,540 (56.8%) | 1,170 (43.2%) |
| Bachelor's Degree or higher | 1,041 (79.0%) | 276 (21.0%) |
Occupancy by Age of Householder in New Port Richey
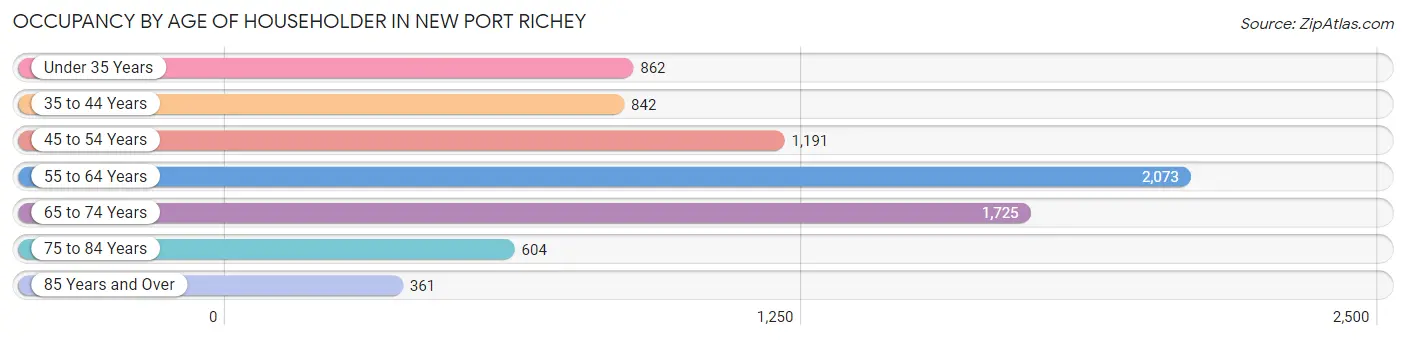
| Age Bracket | # Households | % Households |
| Under 35 Years | 862 | 11.3% |
| 35 to 44 Years | 842 | 11.0% |
| 45 to 54 Years | 1,191 | 15.5% |
| 55 to 64 Years | 2,073 | 27.1% |
| 65 to 74 Years | 1,725 | 22.5% |
| 75 to 84 Years | 604 | 7.9% |
| 85 Years and Over | 361 | 4.7% |
| Total | 7,658 | 100.0% |
Housing Finances in New Port Richey
Median Income by Occupancy in New Port Richey
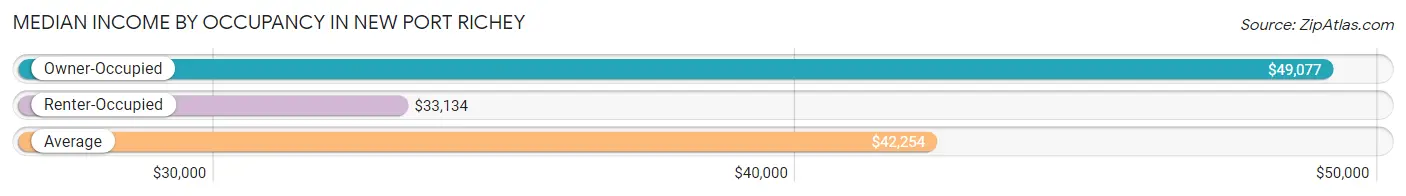
| Occupancy Type | # Households | Median Income |
| Owner-Occupied | 4,380 (57.2%) | $49,077 |
| Renter-Occupied | 3,278 (42.8%) | $33,134 |
| Average | 7,658 (100.0%) | $42,254 |
Occupancy by Householder Income Bracket in New Port Richey
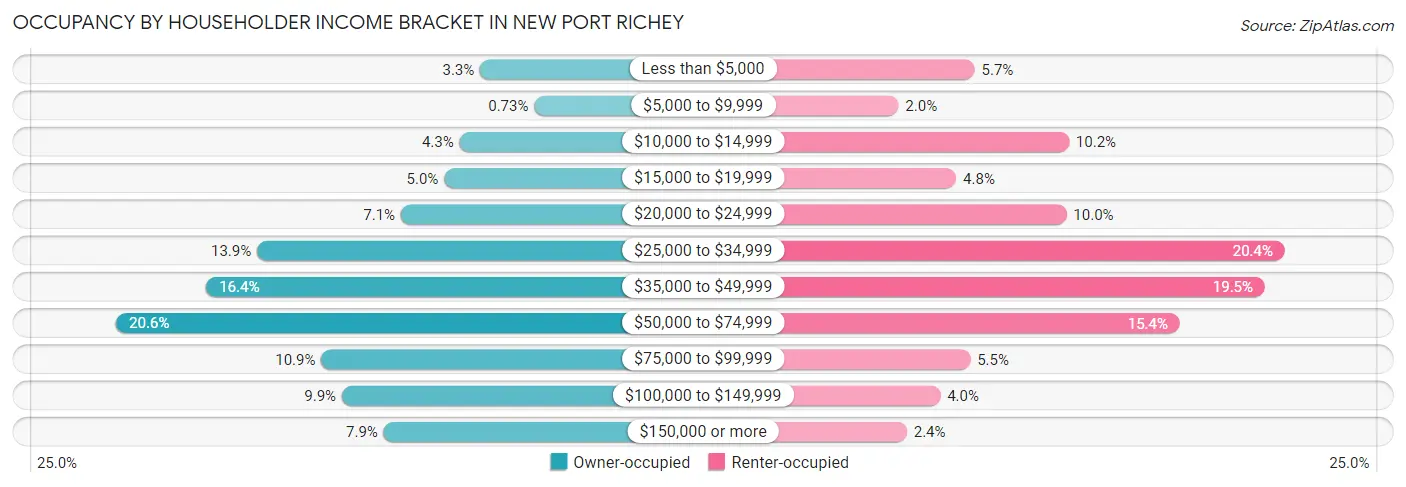
| Income Bracket | Owner-occupied | Renter-occupied |
| Less than $5,000 | 145 (3.3%) | 186 (5.7%) |
| $5,000 to $9,999 | 32 (0.7%) | 67 (2.0%) |
| $10,000 to $14,999 | 188 (4.3%) | 333 (10.2%) |
| $15,000 to $19,999 | 220 (5.0%) | 157 (4.8%) |
| $20,000 to $24,999 | 310 (7.1%) | 329 (10.0%) |
| $25,000 to $34,999 | 610 (13.9%) | 670 (20.4%) |
| $35,000 to $49,999 | 716 (16.4%) | 639 (19.5%) |
| $50,000 to $74,999 | 904 (20.6%) | 506 (15.4%) |
| $75,000 to $99,999 | 476 (10.9%) | 179 (5.5%) |
| $100,000 to $149,999 | 433 (9.9%) | 132 (4.0%) |
| $150,000 or more | 346 (7.9%) | 80 (2.4%) |
| Total | 4,380 (100.0%) | 3,278 (100.0%) |
Monthly Housing Cost Tiers in New Port Richey
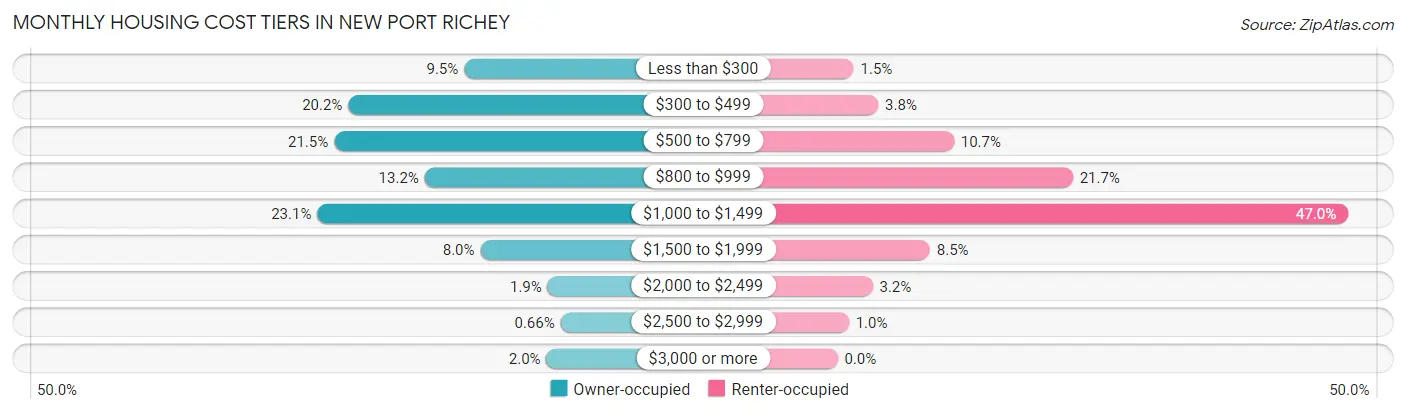
| Monthly Cost | Owner-occupied | Renter-occupied |
| Less than $300 | 418 (9.5%) | 49 (1.5%) |
| $300 to $499 | 885 (20.2%) | 123 (3.7%) |
| $500 to $799 | 942 (21.5%) | 351 (10.7%) |
| $800 to $999 | 577 (13.2%) | 710 (21.7%) |
| $1,000 to $1,499 | 1,010 (23.1%) | 1,541 (47.0%) |
| $1,500 to $1,999 | 352 (8.0%) | 279 (8.5%) |
| $2,000 to $2,499 | 81 (1.8%) | 106 (3.2%) |
| $2,500 to $2,999 | 29 (0.7%) | 34 (1.0%) |
| $3,000 or more | 86 (2.0%) | 0 (0.0%) |
| Total | 4,380 (100.0%) | 3,278 (100.0%) |
Physical Housing Characteristics in New Port Richey
Housing Structures in New Port Richey
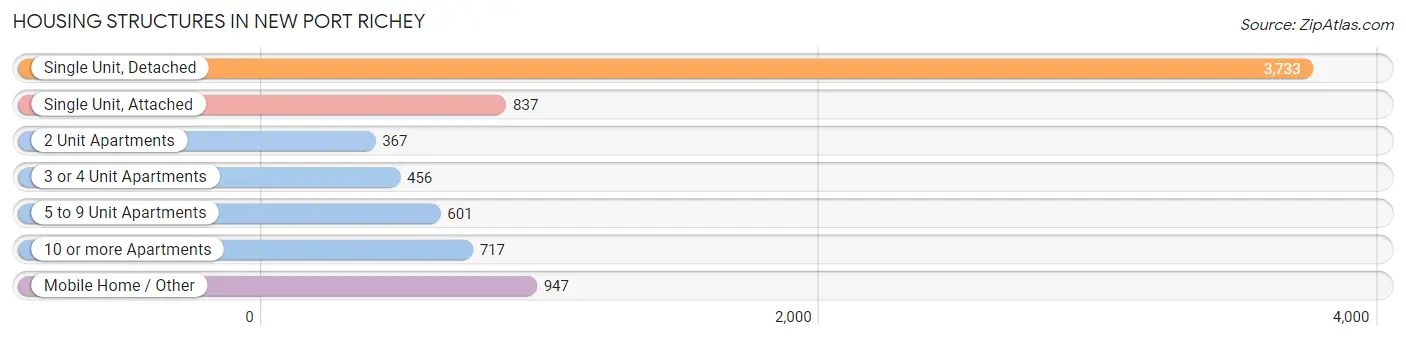
| Structure Type | # Housing Units | % Housing Units |
| Single Unit, Detached | 3,733 | 48.7% |
| Single Unit, Attached | 837 | 10.9% |
| 2 Unit Apartments | 367 | 4.8% |
| 3 or 4 Unit Apartments | 456 | 5.9% |
| 5 to 9 Unit Apartments | 601 | 7.9% |
| 10 or more Apartments | 717 | 9.4% |
| Mobile Home / Other | 947 | 12.4% |
| Total | 7,658 | 100.0% |
Housing Structures by Occupancy in New Port Richey
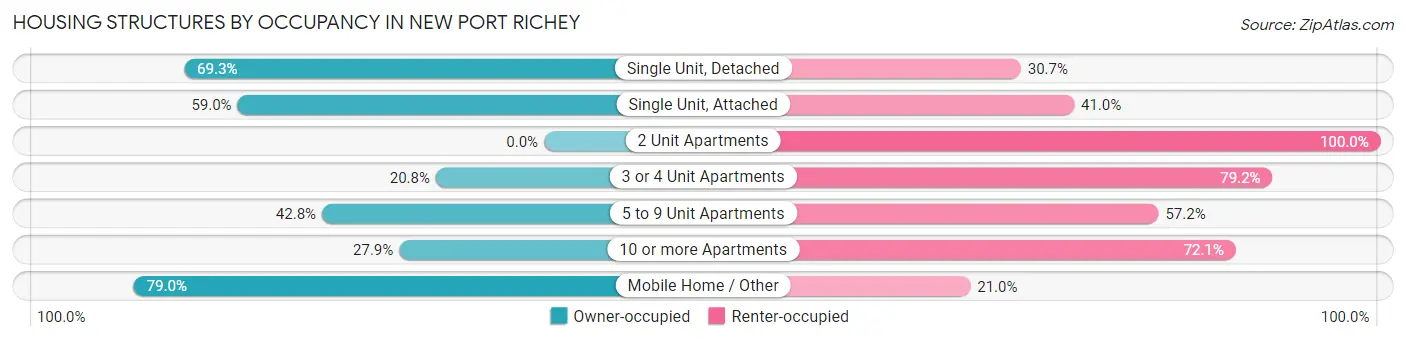
| Structure Type | Owner-occupied | Renter-occupied |
| Single Unit, Detached | 2,586 (69.3%) | 1,147 (30.7%) |
| Single Unit, Attached | 494 (59.0%) | 343 (41.0%) |
| 2 Unit Apartments | 0 (0.0%) | 367 (100.0%) |
| 3 or 4 Unit Apartments | 95 (20.8%) | 361 (79.2%) |
| 5 to 9 Unit Apartments | 257 (42.8%) | 344 (57.2%) |
| 10 or more Apartments | 200 (27.9%) | 517 (72.1%) |
| Mobile Home / Other | 748 (79.0%) | 199 (21.0%) |
| Total | 4,380 (57.2%) | 3,278 (42.8%) |
Housing Structures by Number of Rooms in New Port Richey
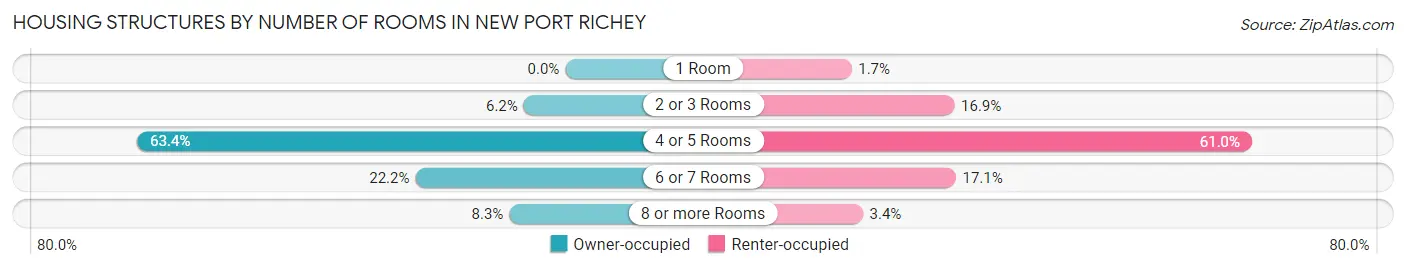
| Number of Rooms | Owner-occupied | Renter-occupied |
| 1 Room | 0 (0.0%) | 55 (1.7%) |
| 2 or 3 Rooms | 270 (6.2%) | 554 (16.9%) |
| 4 or 5 Rooms | 2,775 (63.4%) | 1,998 (61.0%) |
| 6 or 7 Rooms | 972 (22.2%) | 561 (17.1%) |
| 8 or more Rooms | 363 (8.3%) | 110 (3.4%) |
| Total | 4,380 (100.0%) | 3,278 (100.0%) |
Housing Structure by Heating Type in New Port Richey
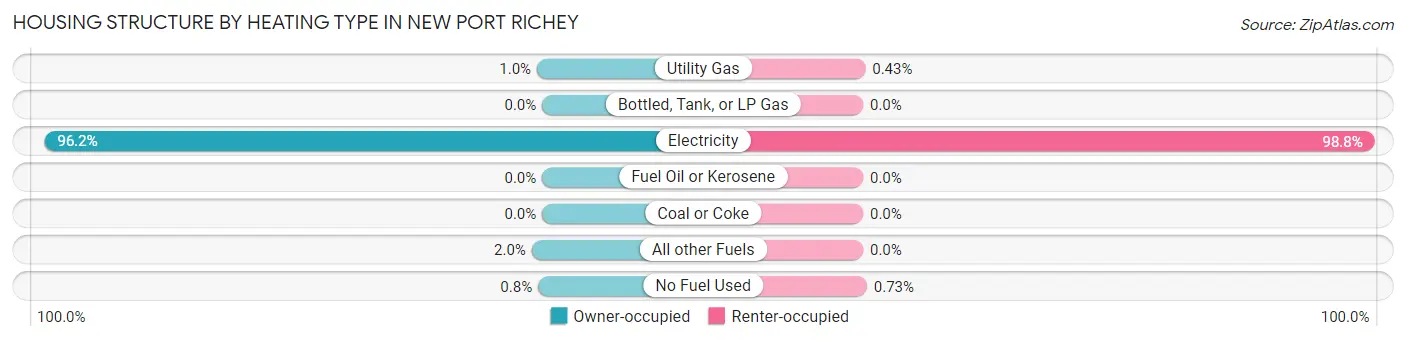
| Heating Type | Owner-occupied | Renter-occupied |
| Utility Gas | 44 (1.0%) | 14 (0.4%) |
| Bottled, Tank, or LP Gas | 0 (0.0%) | 0 (0.0%) |
| Electricity | 4,213 (96.2%) | 3,240 (98.8%) |
| Fuel Oil or Kerosene | 0 (0.0%) | 0 (0.0%) |
| Coal or Coke | 0 (0.0%) | 0 (0.0%) |
| All other Fuels | 88 (2.0%) | 0 (0.0%) |
| No Fuel Used | 35 (0.8%) | 24 (0.7%) |
| Total | 4,380 (100.0%) | 3,278 (100.0%) |
Household Vehicle Usage in New Port Richey
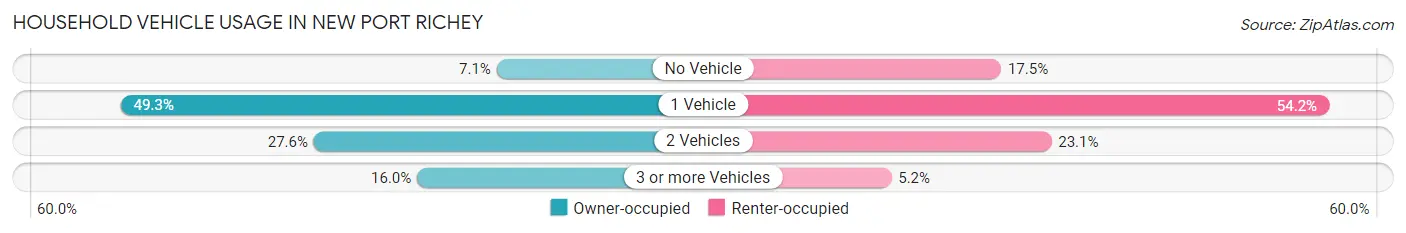
| Vehicles per Household | Owner-occupied | Renter-occupied |
| No Vehicle | 312 (7.1%) | 573 (17.5%) |
| 1 Vehicle | 2,157 (49.2%) | 1,777 (54.2%) |
| 2 Vehicles | 1,209 (27.6%) | 758 (23.1%) |
| 3 or more Vehicles | 702 (16.0%) | 170 (5.2%) |
| Total | 4,380 (100.0%) | 3,278 (100.0%) |
Real Estate & Mortgages in New Port Richey
Real Estate and Mortgage Overview in New Port Richey
| Characteristic | Without Mortgage | With Mortgage |
| Housing Units | 2,363 | 2,017 |
| Median Property Value | $89,600 | $175,600 |
| Median Household Income | $39,565 | $251 |
| Monthly Housing Costs | $482 | $86 |
| Real Estate Taxes | $952 | $107 |
Property Value by Mortgage Status in New Port Richey
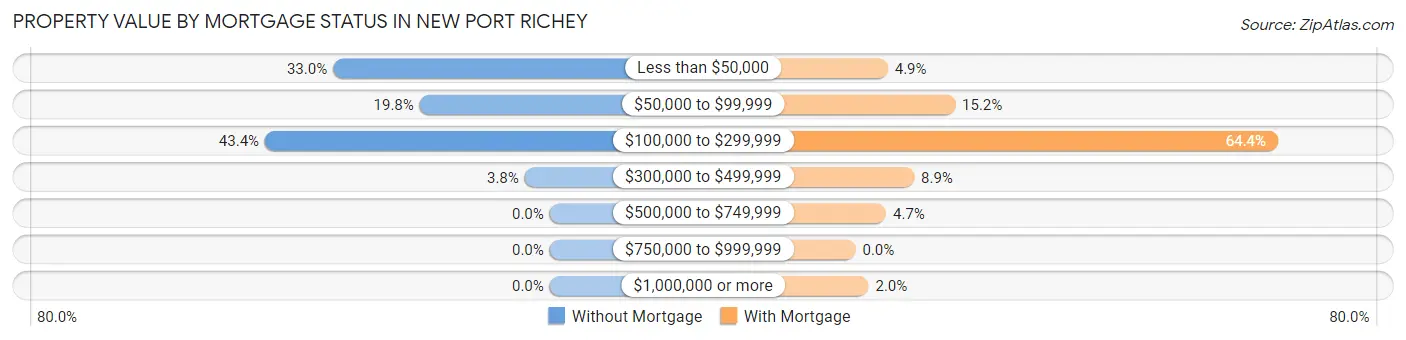
| Property Value | Without Mortgage | With Mortgage |
| Less than $50,000 | 780 (33.0%) | 99 (4.9%) |
| $50,000 to $99,999 | 468 (19.8%) | 306 (15.2%) |
| $100,000 to $299,999 | 1,025 (43.4%) | 1,298 (64.3%) |
| $300,000 to $499,999 | 90 (3.8%) | 180 (8.9%) |
| $500,000 to $749,999 | 0 (0.0%) | 94 (4.7%) |
| $750,000 to $999,999 | 0 (0.0%) | 0 (0.0%) |
| $1,000,000 or more | 0 (0.0%) | 40 (2.0%) |
| Total | 2,363 (100.0%) | 2,017 (100.0%) |
Household Income by Mortgage Status in New Port Richey
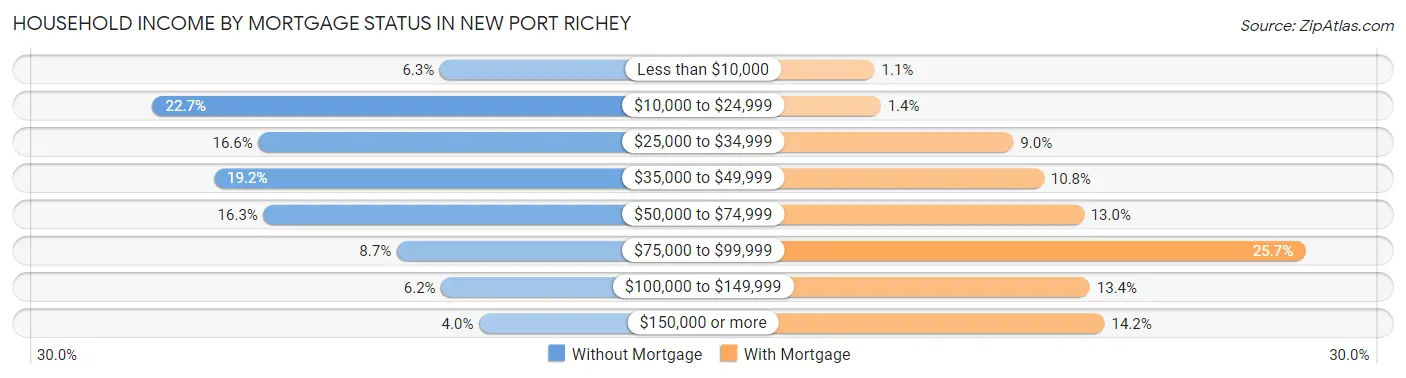
| Household Income | Without Mortgage | With Mortgage |
| Less than $10,000 | 148 (6.3%) | 22 (1.1%) |
| $10,000 to $24,999 | 536 (22.7%) | 29 (1.4%) |
| $25,000 to $34,999 | 393 (16.6%) | 182 (9.0%) |
| $35,000 to $49,999 | 453 (19.2%) | 217 (10.8%) |
| $50,000 to $74,999 | 386 (16.3%) | 263 (13.0%) |
| $75,000 to $99,999 | 206 (8.7%) | 518 (25.7%) |
| $100,000 to $149,999 | 146 (6.2%) | 270 (13.4%) |
| $150,000 or more | 95 (4.0%) | 287 (14.2%) |
| Total | 2,363 (100.0%) | 2,017 (100.0%) |
Property Value to Household Income Ratio in New Port Richey
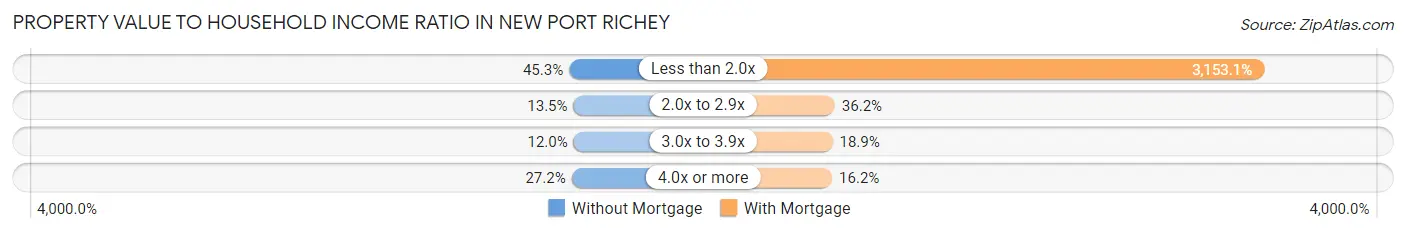
| Value-to-Income Ratio | Without Mortgage | With Mortgage |
| Less than 2.0x | 1,071 (45.3%) | 63,597 (3,153.0%) |
| 2.0x to 2.9x | 320 (13.5%) | 730 (36.2%) |
| 3.0x to 3.9x | 284 (12.0%) | 382 (18.9%) |
| 4.0x or more | 642 (27.2%) | 326 (16.2%) |
| Total | 2,363 (100.0%) | 2,017 (100.0%) |
Real Estate Taxes by Mortgage Status in New Port Richey
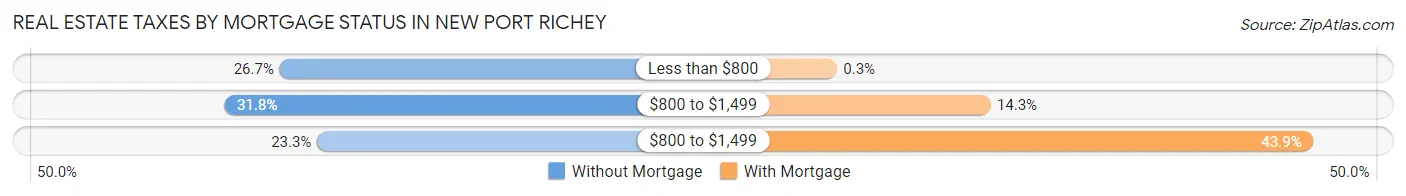
| Property Taxes | Without Mortgage | With Mortgage |
| Less than $800 | 631 (26.7%) | 6 (0.3%) |
| $800 to $1,499 | 751 (31.8%) | 289 (14.3%) |
| $800 to $1,499 | 550 (23.3%) | 885 (43.9%) |
| Total | 2,363 (100.0%) | 2,017 (100.0%) |
Health & Disability in New Port Richey
Health Insurance Coverage by Age in New Port Richey
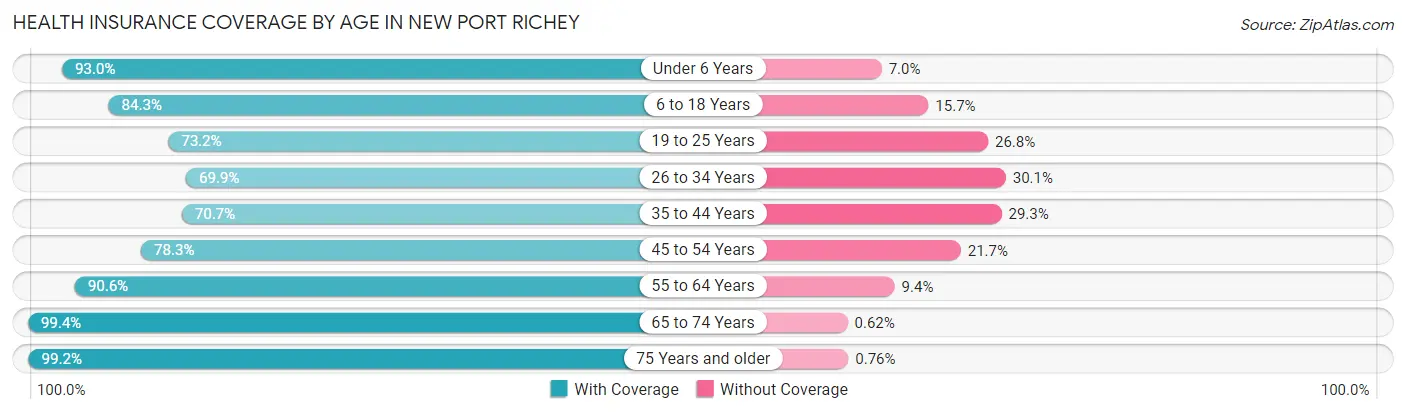
| Age Bracket | With Coverage | Without Coverage |
| Under 6 Years | 706 (93.0%) | 53 (7.0%) |
| 6 to 18 Years | 1,231 (84.3%) | 229 (15.7%) |
| 19 to 25 Years | 827 (73.2%) | 303 (26.8%) |
| 26 to 34 Years | 982 (69.9%) | 423 (30.1%) |
| 35 to 44 Years | 1,258 (70.7%) | 522 (29.3%) |
| 45 to 54 Years | 1,646 (78.3%) | 457 (21.7%) |
| 55 to 64 Years | 2,954 (90.6%) | 306 (9.4%) |
| 65 to 74 Years | 2,390 (99.4%) | 15 (0.6%) |
| 75 Years and older | 1,820 (99.2%) | 14 (0.8%) |
| Total | 13,814 (85.6%) | 2,322 (14.4%) |
Health Insurance Coverage by Citizenship Status in New Port Richey
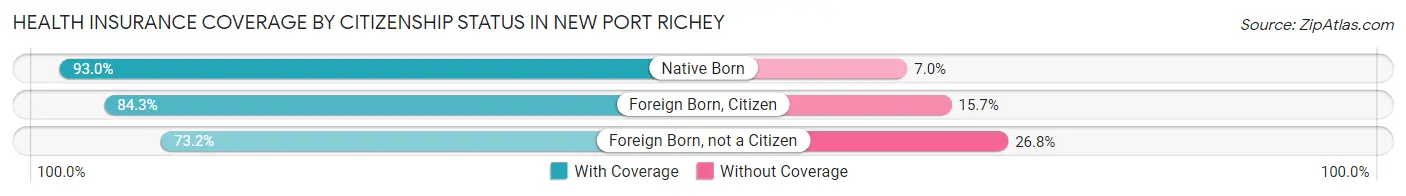
| Citizenship Status | With Coverage | Without Coverage |
| Native Born | 706 (93.0%) | 53 (7.0%) |
| Foreign Born, Citizen | 1,231 (84.3%) | 229 (15.7%) |
| Foreign Born, not a Citizen | 827 (73.2%) | 303 (26.8%) |
Health Insurance Coverage by Household Income in New Port Richey
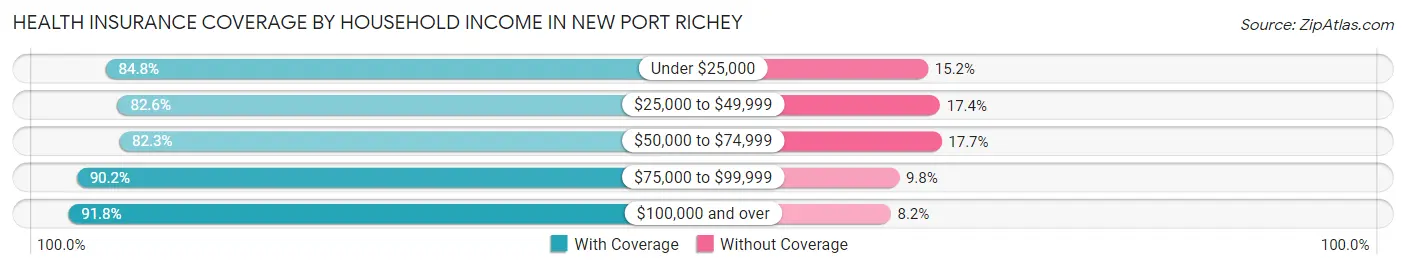
| Household Income | With Coverage | Without Coverage |
| Under $25,000 | 2,228 (84.8%) | 399 (15.2%) |
| $25,000 to $49,999 | 4,128 (82.6%) | 871 (17.4%) |
| $50,000 to $74,999 | 2,917 (82.3%) | 628 (17.7%) |
| $75,000 to $99,999 | 1,588 (90.2%) | 172 (9.8%) |
| $100,000 and over | 2,798 (91.8%) | 250 (8.2%) |
Public vs Private Health Insurance Coverage by Age in New Port Richey
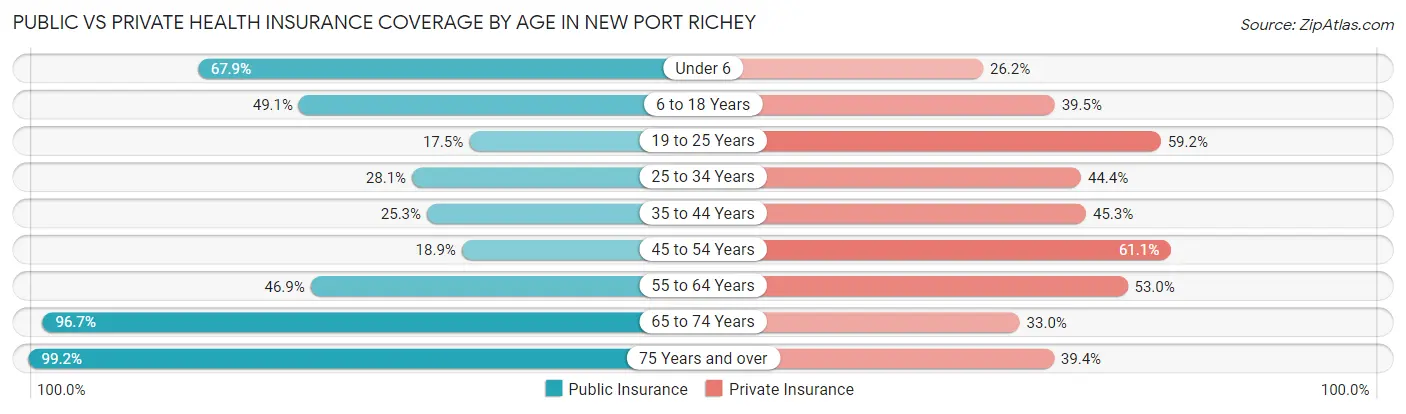
| Age Bracket | Public Insurance | Private Insurance |
| Under 6 | 515 (67.8%) | 199 (26.2%) |
| 6 to 18 Years | 717 (49.1%) | 577 (39.5%) |
| 19 to 25 Years | 198 (17.5%) | 669 (59.2%) |
| 25 to 34 Years | 395 (28.1%) | 624 (44.4%) |
| 35 to 44 Years | 451 (25.3%) | 807 (45.3%) |
| 45 to 54 Years | 397 (18.9%) | 1,285 (61.1%) |
| 55 to 64 Years | 1,530 (46.9%) | 1,729 (53.0%) |
| 65 to 74 Years | 2,325 (96.7%) | 794 (33.0%) |
| 75 Years and over | 1,820 (99.2%) | 722 (39.4%) |
| Total | 8,348 (51.7%) | 7,406 (45.9%) |
Disability Status by Sex by Age in New Port Richey
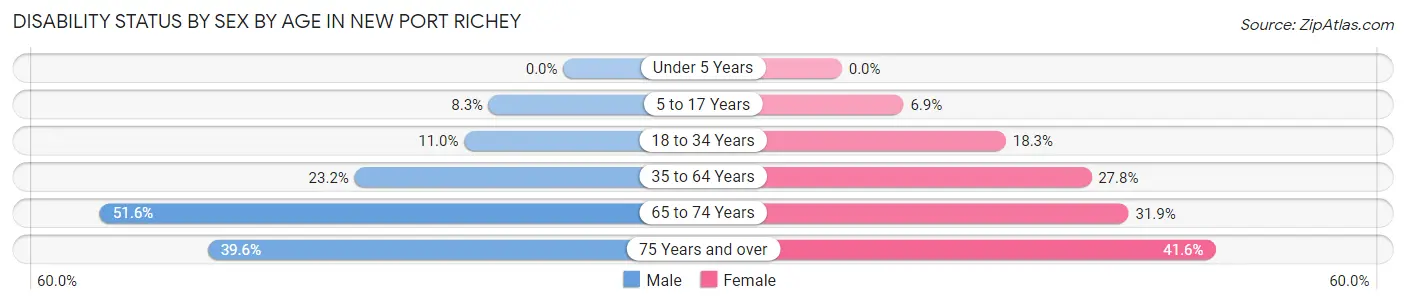
| Age Bracket | Male | Female |
| Under 5 Years | 0 (0.0%) | 0 (0.0%) |
| 5 to 17 Years | 59 (8.3%) | 57 (6.9%) |
| 18 to 34 Years | 158 (11.0%) | 218 (18.3%) |
| 35 to 64 Years | 758 (23.2%) | 1,078 (27.8%) |
| 65 to 74 Years | 624 (51.6%) | 382 (31.9%) |
| 75 Years and over | 257 (39.6%) | 493 (41.6%) |
Disability Class by Sex by Age in New Port Richey
Disability Class: Hearing Difficulty
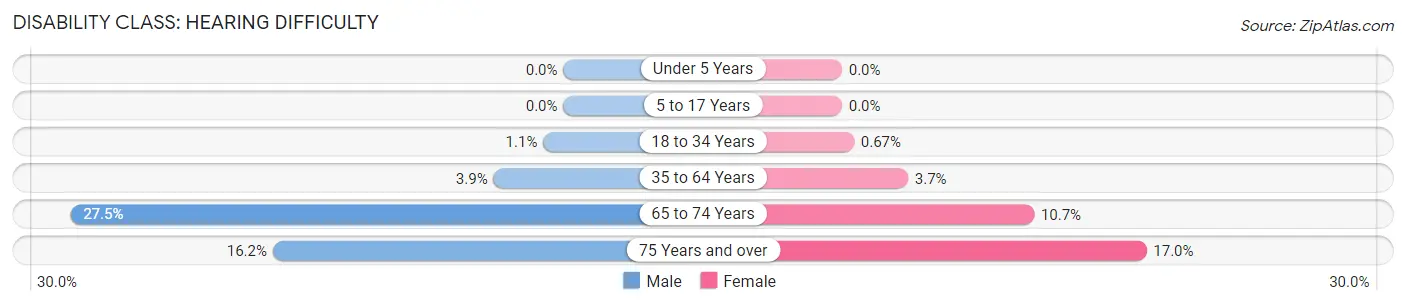
| Age Bracket | Male | Female |
| Under 5 Years | 0 (0.0%) | 0 (0.0%) |
| 5 to 17 Years | 0 (0.0%) | 0 (0.0%) |
| 18 to 34 Years | 16 (1.1%) | 8 (0.7%) |
| 35 to 64 Years | 127 (3.9%) | 143 (3.7%) |
| 65 to 74 Years | 332 (27.5%) | 128 (10.7%) |
| 75 Years and over | 105 (16.2%) | 201 (17.0%) |
Disability Class: Vision Difficulty
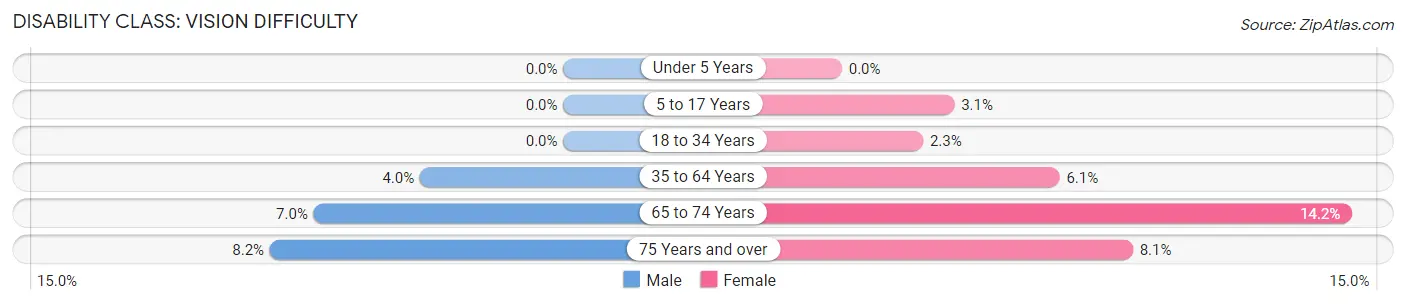
| Age Bracket | Male | Female |
| Under 5 Years | 0 (0.0%) | 0 (0.0%) |
| 5 to 17 Years | 0 (0.0%) | 26 (3.1%) |
| 18 to 34 Years | 0 (0.0%) | 27 (2.3%) |
| 35 to 64 Years | 130 (4.0%) | 235 (6.1%) |
| 65 to 74 Years | 84 (7.0%) | 170 (14.2%) |
| 75 Years and over | 53 (8.2%) | 96 (8.1%) |
Disability Class: Cognitive Difficulty

| Age Bracket | Male | Female |
| 5 to 17 Years | 59 (8.3%) | 31 (3.7%) |
| 18 to 34 Years | 98 (6.8%) | 71 (5.9%) |
| 35 to 64 Years | 209 (6.4%) | 559 (14.4%) |
| 65 to 74 Years | 56 (4.6%) | 113 (9.5%) |
| 75 Years and over | 92 (14.2%) | 156 (13.2%) |
Disability Class: Ambulatory Difficulty
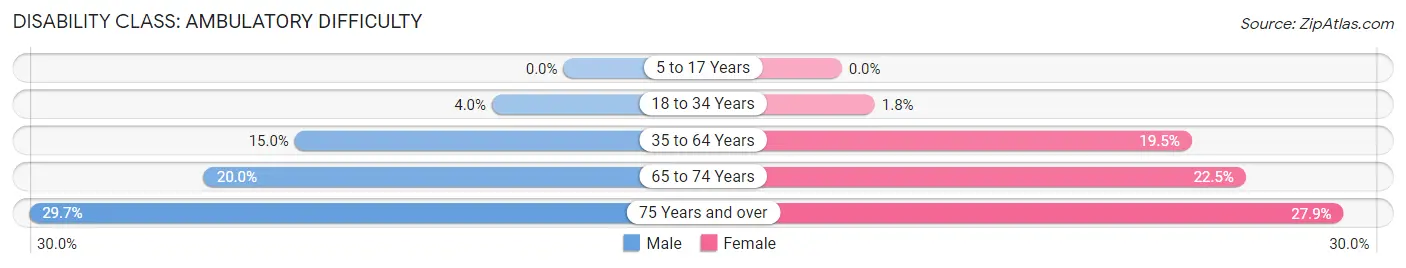
| Age Bracket | Male | Female |
| 5 to 17 Years | 0 (0.0%) | 0 (0.0%) |
| 18 to 34 Years | 57 (4.0%) | 22 (1.8%) |
| 35 to 64 Years | 488 (15.0%) | 756 (19.5%) |
| 65 to 74 Years | 242 (20.0%) | 269 (22.5%) |
| 75 Years and over | 193 (29.7%) | 331 (27.9%) |
Disability Class: Self-Care Difficulty
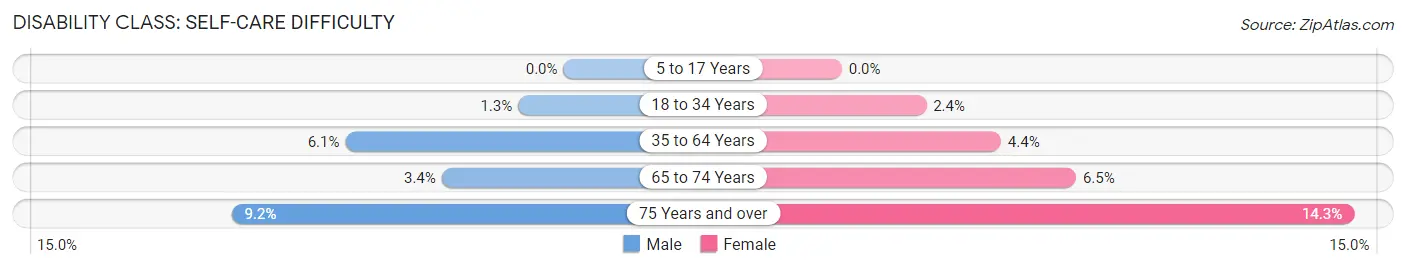
| Age Bracket | Male | Female |
| 5 to 17 Years | 0 (0.0%) | 0 (0.0%) |
| 18 to 34 Years | 18 (1.3%) | 28 (2.4%) |
| 35 to 64 Years | 198 (6.1%) | 172 (4.4%) |
| 65 to 74 Years | 41 (3.4%) | 78 (6.5%) |
| 75 Years and over | 60 (9.2%) | 169 (14.3%) |
Technology Access in New Port Richey
Computing Device Access in New Port Richey
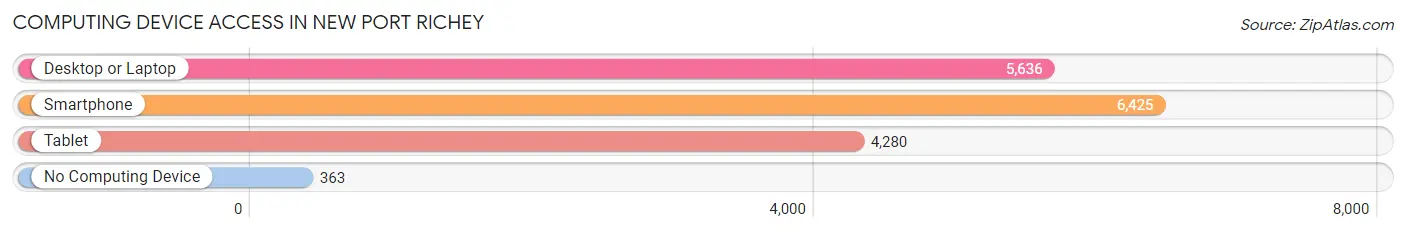
| Device Type | # Households | % Households |
| Desktop or Laptop | 5,636 | 73.6% |
| Smartphone | 6,425 | 83.9% |
| Tablet | 4,280 | 55.9% |
| No Computing Device | 363 | 4.7% |
| Total | 7,658 | 100.0% |
Internet Access in New Port Richey
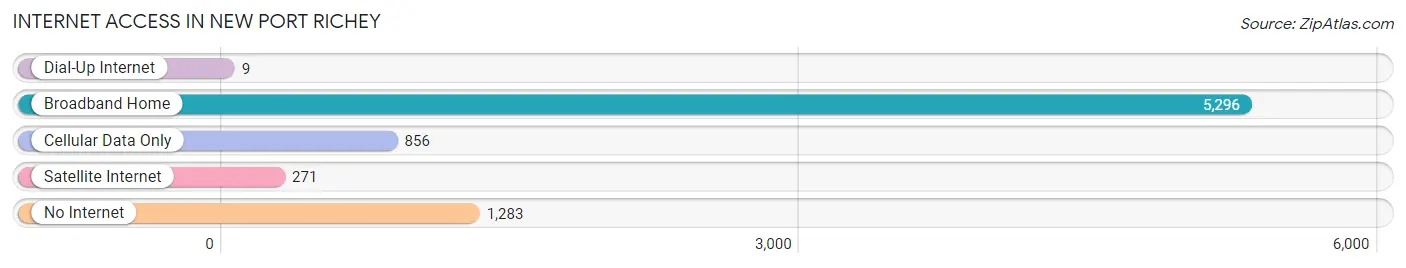
| Internet Type | # Households | % Households |
| Dial-Up Internet | 9 | 0.1% |
| Broadband Home | 5,296 | 69.2% |
| Cellular Data Only | 856 | 11.2% |
| Satellite Internet | 271 | 3.5% |
| No Internet | 1,283 | 16.8% |
| Total | 7,658 | 100.0% |
New Port Richey Summary
New Port Richey is a city located in Pasco County, Florida, United States. It is part of the Tampa-St. Petersburg-Clearwater metropolitan area. As of the 2010 census, the city had a population of 14,034.
History
New Port Richey was founded in 1908 by Captain H.B. Jeffords, a Civil War veteran. He named the city after Port Richey, Ohio, the hometown of his wife, Mary. The city was incorporated in 1924.
In the early 1900s, New Port Richey was a popular winter resort for wealthy northerners. The city was known for its beautiful beaches, fishing, and hunting.
In the 1950s, the city began to experience rapid growth due to the construction of the Cross-Florida Barge Canal. The canal was intended to connect the Gulf of Mexico to the Atlantic Ocean, but was never completed.
Geography
New Port Richey is located in Pasco County, Florida, at 28°17'N 82°43'W (28.28, -82.72). The city is situated on the Gulf of Mexico, about 25 miles northwest of Tampa.
The city has a total area of 8.3 square miles, of which 8.2 square miles is land and 0.1 square miles is water.
Economy
New Port Richey’s economy is largely based on tourism and services. The city is home to several hotels, restaurants, and retail stores.
The city is also home to several manufacturing companies, including a paper mill and a plastics factory.
Demographics
As of the 2010 census, there were 14,034 people, 6,093 households, and 3,845 families residing in the city. The population density was 1,711.3 people per square mile.
The racial makeup of the city was 87.2% White, 5.3% African American, 0.7% Native American, 1.7% Asian, 0.1% Pacific Islander, 2.7% from other races, and 2.1% from two or more races. Hispanic or Latino of any race were 11.2% of the population.
The median income for a household in the city was $37,845, and the median income for a family was $45,945. Males had a median income of $35,945 versus $27,945 for females. The per capita income for the city was $20,945. About 11.2% of families and 14.2% of the population were below the poverty line, including 19.2% of those under age 18 and 8.2% of those age 65 or over.
Common Questions
What is Per Capita Income in New Port Richey?
Per Capita income in New Port Richey is $28,811.
What is the Median Family Income in New Port Richey?
Median Family Income in New Port Richey is $51,800.
What is the Median Household income in New Port Richey?
Median Household Income in New Port Richey is $42,254.
What is Income or Wage Gap in New Port Richey?
Income or Wage Gap in New Port Richey is 23.1%.
Women in New Port Richey earn 76.9 cents for every dollar earned by a man.
What is Family Income Deficit in New Port Richey?
Family Income Deficit in New Port Richey is $10,978.
Families that are below poverty line in New Port Richey earn $10,978 less on average than the poverty threshold level.
What is Inequality or Gini Index in New Port Richey?
Inequality or Gini Index in New Port Richey is 0.45.
What is the Total Population of New Port Richey?
Total Population of New Port Richey is 16,742.
What is the Total Male Population of New Port Richey?
Total Male Population of New Port Richey is 7,654.
What is the Total Female Population of New Port Richey?
Total Female Population of New Port Richey is 9,088.
What is the Ratio of Males per 100 Females in New Port Richey?
There are 84.22 Males per 100 Females in New Port Richey.
What is the Ratio of Females per 100 Males in New Port Richey?
There are 118.74 Females per 100 Males in New Port Richey.
What is the Median Population Age in New Port Richey?
Median Population Age in New Port Richey is 54.0 Years.
What is the Average Family Size in New Port Richey
Average Family Size in New Port Richey is 2.7 People.
What is the Average Household Size in New Port Richey
Average Household Size in New Port Richey is 2.1 People.
How Large is the Labor Force in New Port Richey?
There are 6,737 People in the Labor Forcein in New Port Richey.
What is the Percentage of People in the Labor Force in New Port Richey?
45.3% of People are in the Labor Force in New Port Richey.
What is the Unemployment Rate in New Port Richey?
Unemployment Rate in New Port Richey is 4.0%.