Mount Dora, FL Map & Demographics
Mount Dora Map
Mount Dora Overview
$40,912
PER CAPITA INCOME
$89,028
AVG FAMILY INCOME
$65,774
AVG HOUSEHOLD INCOME
35.8%
WAGE / INCOME GAP [ % ]
64.2¢/ $1
WAGE / INCOME GAP [ $ ]
0.49
INEQUALITY / GINI INDEX
16,330
TOTAL POPULATION
7,512
MALE POPULATION
8,818
FEMALE POPULATION
85.19
MALES / 100 FEMALES
117.39
FEMALES / 100 MALES
48.6
MEDIAN AGE
2.8
AVG FAMILY SIZE
2.3
AVG HOUSEHOLD SIZE
7,077
LABOR FORCE [ PEOPLE ]
52.4%
PERCENT IN LABOR FORCE
6.1%
UNEMPLOYMENT RATE
Mount Dora Zip Codes
Mount Dora Area Codes
Income in Mount Dora
Income Overview in Mount Dora
Per Capita Income in Mount Dora is $40,912, while median incomes of families and households are $89,028 and $65,774 respectively.
| Characteristic | Number | Measure |
| Per Capita Income | 16,330 | $40,912 |
| Median Family Income | 4,522 | $89,028 |
| Mean Family Income | 4,522 | $115,540 |
| Median Household Income | 7,022 | $65,774 |
| Mean Household Income | 7,022 | $92,838 |
| Income Deficit | 4,522 | $0 |
| Wage / Income Gap (%) | 16,330 | 35.77% |
| Wage / Income Gap ($) | 16,330 | 64.23¢ per $1 |
| Gini / Inequality Index | 16,330 | 0.49 |
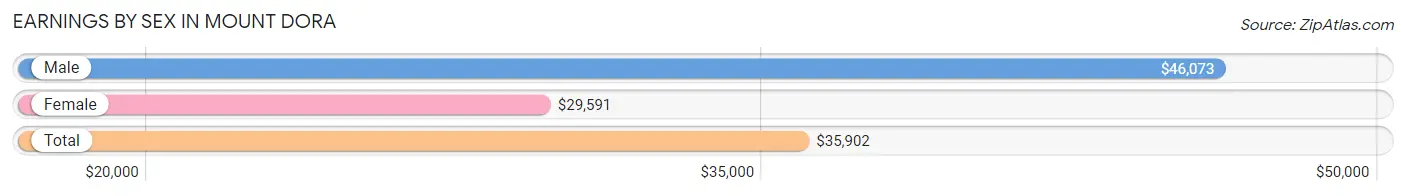
Earnings by Sex in Mount Dora
Average Earnings in Mount Dora are $35,902, $46,073 for men and $29,591 for women, a difference of 35.8%.
| Sex | Number | Average Earnings |
| Male | 3,473 (47.8%) | $46,073 |
| Female | 3,796 (52.2%) | $29,591 |
| Total | 7,269 (100.0%) | $35,902 |
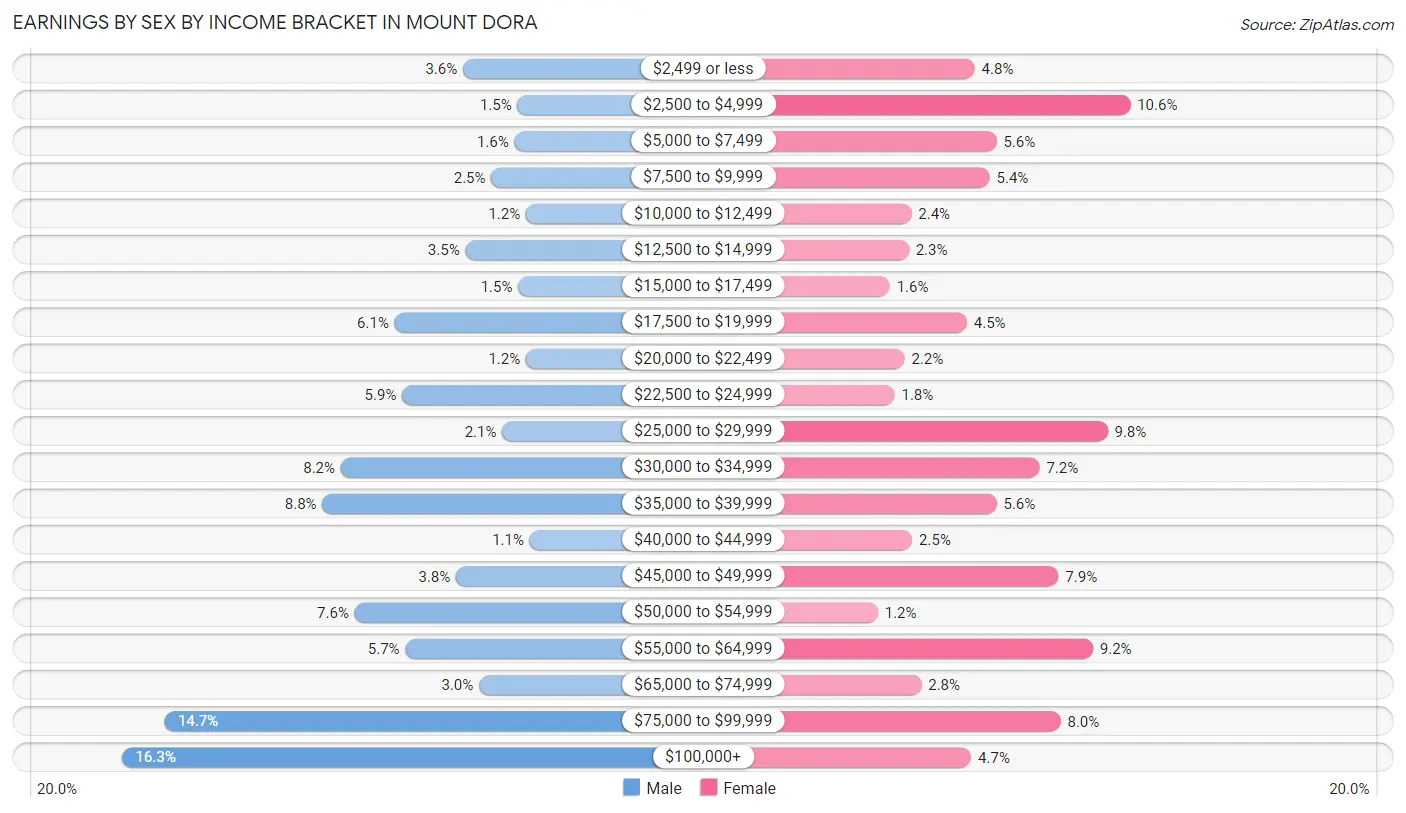
Earnings by Sex by Income Bracket in Mount Dora
The most common earnings brackets in Mount Dora are $100,000+ for men (567 | 16.3%) and $2,500 to $4,999 for women (403 | 10.6%).
| Income | Male | Female |
| $2,499 or less | 124 (3.6%) | 182 (4.8%) |
| $2,500 to $4,999 | 53 (1.5%) | 403 (10.6%) |
| $5,000 to $7,499 | 57 (1.6%) | 213 (5.6%) |
| $7,500 to $9,999 | 87 (2.5%) | 203 (5.3%) |
| $10,000 to $12,499 | 42 (1.2%) | 92 (2.4%) |
| $12,500 to $14,999 | 121 (3.5%) | 88 (2.3%) |
| $15,000 to $17,499 | 52 (1.5%) | 61 (1.6%) |
| $17,500 to $19,999 | 213 (6.1%) | 171 (4.5%) |
| $20,000 to $22,499 | 42 (1.2%) | 82 (2.2%) |
| $22,500 to $24,999 | 203 (5.9%) | 68 (1.8%) |
| $25,000 to $29,999 | 73 (2.1%) | 371 (9.8%) |
| $30,000 to $34,999 | 283 (8.2%) | 274 (7.2%) |
| $35,000 to $39,999 | 307 (8.8%) | 213 (5.6%) |
| $40,000 to $44,999 | 37 (1.1%) | 93 (2.5%) |
| $45,000 to $49,999 | 133 (3.8%) | 301 (7.9%) |
| $50,000 to $54,999 | 265 (7.6%) | 44 (1.2%) |
| $55,000 to $64,999 | 199 (5.7%) | 350 (9.2%) |
| $65,000 to $74,999 | 103 (3.0%) | 106 (2.8%) |
| $75,000 to $99,999 | 512 (14.7%) | 304 (8.0%) |
| $100,000+ | 567 (16.3%) | 177 (4.7%) |
| Total | 3,473 (100.0%) | 3,796 (100.0%) |
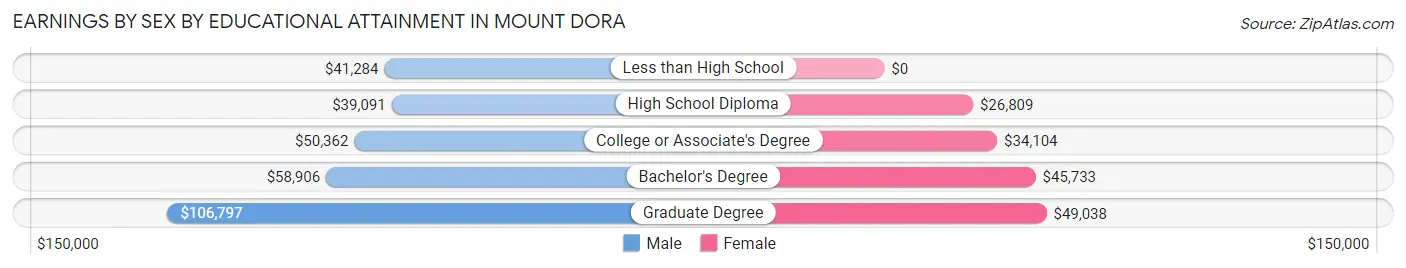
Earnings by Sex by Educational Attainment in Mount Dora
Average earnings in Mount Dora are $51,121 for men and $32,588 for women, a difference of 36.2%. Men with an educational attainment of graduate degree enjoy the highest average annual earnings of $106,797, while those with high school diploma education earn the least with $39,091. Women with an educational attainment of graduate degree earn the most with the average annual earnings of $49,038, while those with high school diploma education have the smallest earnings of $26,809.
| Educational Attainment | Male Income | Female Income |
| Less than High School | $41,284 | $0 |
| High School Diploma | $39,091 | $26,809 |
| College or Associate's Degree | $50,362 | $34,104 |
| Bachelor's Degree | $58,906 | $45,733 |
| Graduate Degree | $106,797 | $49,038 |
| Total | $51,121 | $32,588 |
Family Income in Mount Dora
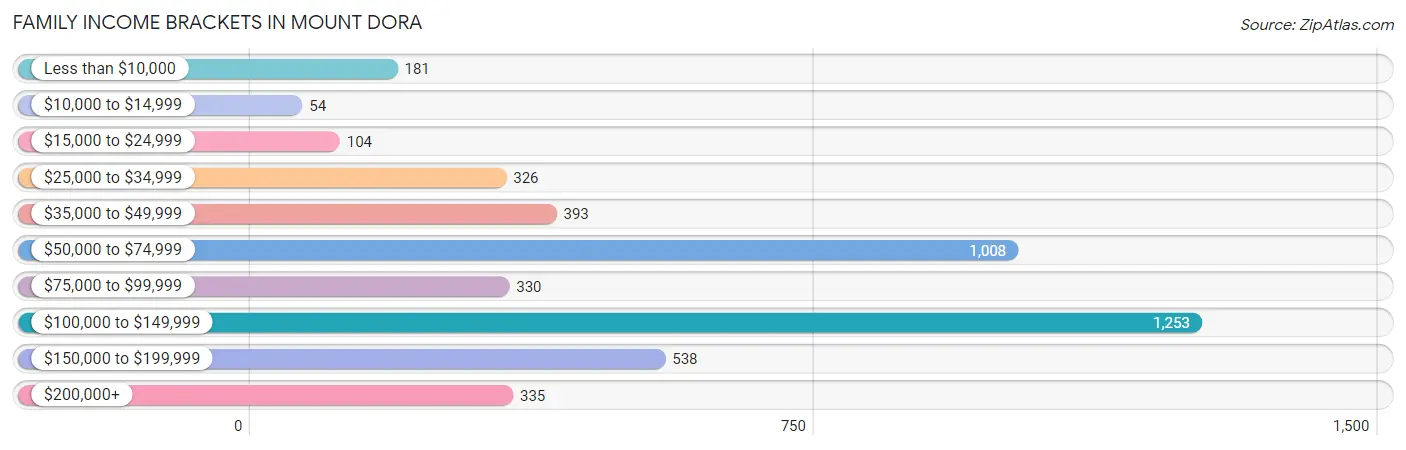
Family Income Brackets in Mount Dora
According to the Mount Dora family income data, there are 1,253 families falling into the $100,000 to $149,999 income range, which is the most common income bracket and makes up 27.7% of all families. Conversely, the $10,000 to $14,999 income bracket is the least frequent group with only 54 families (1.2%) belonging to this category.
| Income Bracket | # Families | % Families |
| Less than $10,000 | 181 | 4.0% |
| $10,000 to $14,999 | 54 | 1.2% |
| $15,000 to $24,999 | 104 | 2.3% |
| $25,000 to $34,999 | 326 | 7.2% |
| $35,000 to $49,999 | 393 | 8.7% |
| $50,000 to $74,999 | 1,008 | 22.3% |
| $75,000 to $99,999 | 330 | 7.3% |
| $100,000 to $149,999 | 1,253 | 27.7% |
| $150,000 to $199,999 | 538 | 11.9% |
| $200,000+ | 335 | 7.4% |
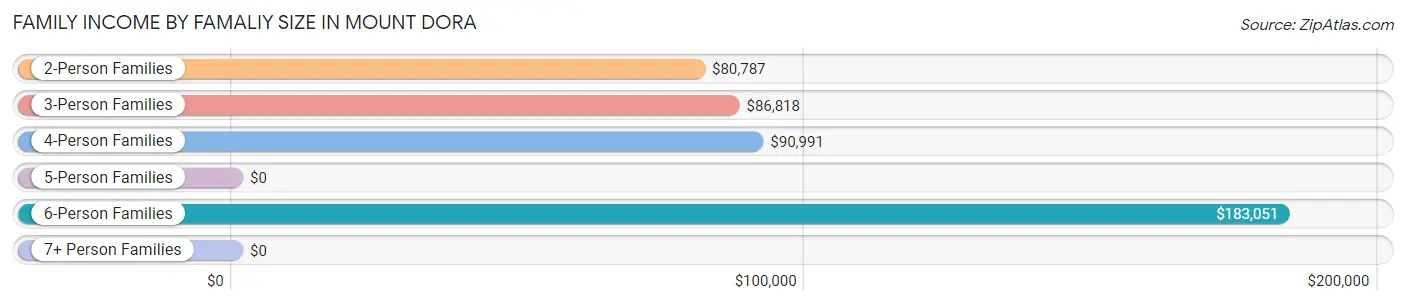
Family Income by Famaliy Size in Mount Dora
6-person families (159 | 3.5%) account for the highest median family income in Mount Dora with $183,051 per family, while 2-person families (2,855 | 63.1%) have the highest median income of $40,394 per family member.
| Income Bracket | # Families | Median Income |
| 2-Person Families | 2,855 (63.1%) | $80,787 |
| 3-Person Families | 752 (16.6%) | $86,818 |
| 4-Person Families | 582 (12.9%) | $90,991 |
| 5-Person Families | 143 (3.2%) | $0 |
| 6-Person Families | 159 (3.5%) | $183,051 |
| 7+ Person Families | 31 (0.7%) | $0 |
| Total | 4,522 (100.0%) | $89,028 |
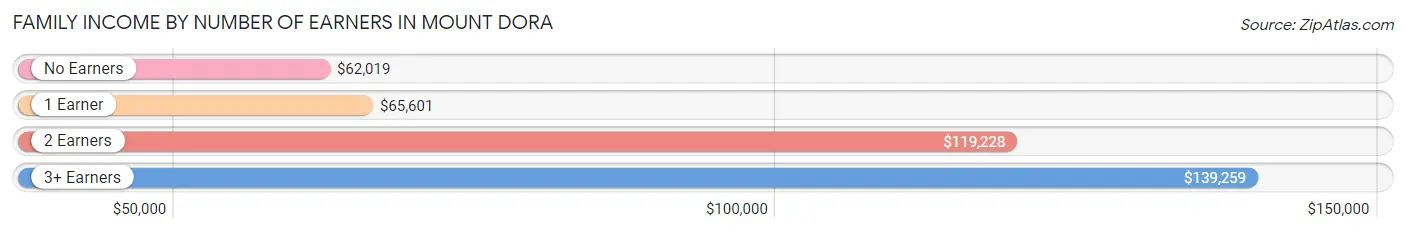
Family Income by Number of Earners in Mount Dora
The median family income in Mount Dora is $89,028, with families comprising 3+ earners (291) having the highest median family income of $139,259, while families with no earners (1,326) have the lowest median family income of $62,019, accounting for 6.4% and 29.3% of families, respectively.
| Number of Earners | # Families | Median Income |
| No Earners | 1,326 (29.3%) | $62,019 |
| 1 Earner | 1,160 (25.7%) | $65,601 |
| 2 Earners | 1,745 (38.6%) | $119,228 |
| 3+ Earners | 291 (6.4%) | $139,259 |
| Total | 4,522 (100.0%) | $89,028 |
Household Income in Mount Dora
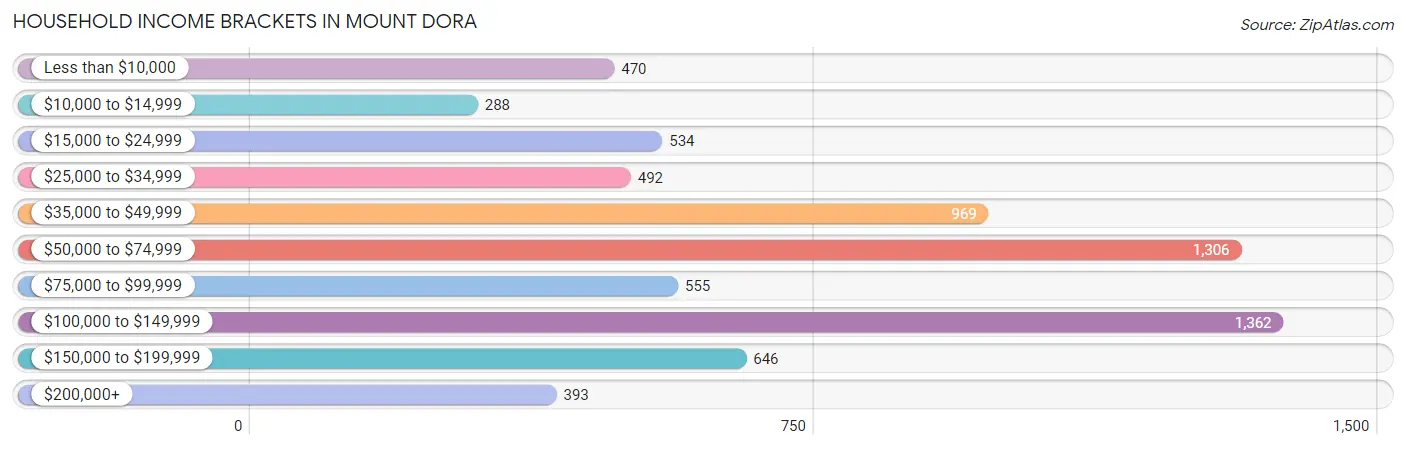
Household Income Brackets in Mount Dora
With 1,362 households falling in the category, the $100,000 to $149,999 income range is the most frequent in Mount Dora, accounting for 19.4% of all households. In contrast, only 288 households (4.1%) fall into the $10,000 to $14,999 income bracket, making it the least populous group.
| Income Bracket | # Households | % Households |
| Less than $10,000 | 470 | 6.7% |
| $10,000 to $14,999 | 288 | 4.1% |
| $15,000 to $24,999 | 534 | 7.6% |
| $25,000 to $34,999 | 492 | 7.0% |
| $35,000 to $49,999 | 969 | 13.8% |
| $50,000 to $74,999 | 1,306 | 18.6% |
| $75,000 to $99,999 | 555 | 7.9% |
| $100,000 to $149,999 | 1,362 | 19.4% |
| $150,000 to $199,999 | 646 | 9.2% |
| $200,000+ | 393 | 5.6% |
Household Income by Householder Age in Mount Dora
The median household income in Mount Dora is $65,774, with the highest median household income of $90,087 found in the 45 to 64 years age bracket for the primary householder. A total of 2,072 households (29.5%) fall into this category. Meanwhile, the 15 to 24 years age bracket for the primary householder has the lowest median household income of $0, with 45 households (0.6%) in this group.
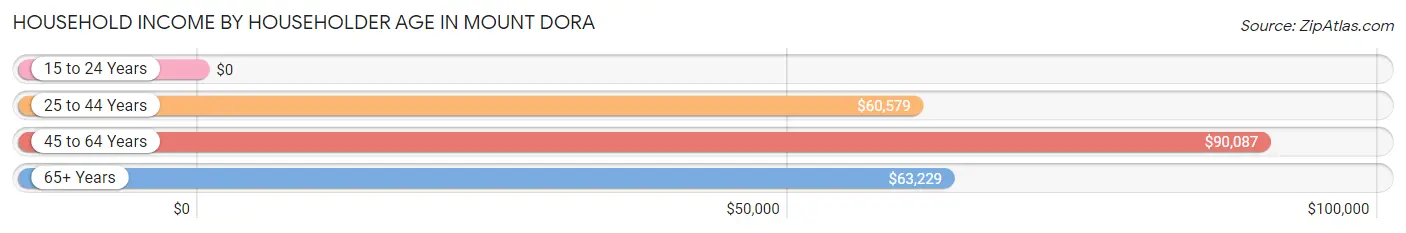
| Income Bracket | # Households | Median Income |
| 15 to 24 Years | 45 (0.6%) | $0 |
| 25 to 44 Years | 1,745 (24.8%) | $60,579 |
| 45 to 64 Years | 2,072 (29.5%) | $90,087 |
| 65+ Years | 3,160 (45.0%) | $63,229 |
| Total | 7,022 (100.0%) | $65,774 |
Poverty in Mount Dora
Income Below Poverty by Sex and Age in Mount Dora
With 11.5% poverty level for males and 18.8% for females among the residents of Mount Dora, under 5 year old males and under 5 year old females are the most vulnerable to poverty, with 176 males (50.3%) and 250 females (49.7%) in their respective age groups living below the poverty level.
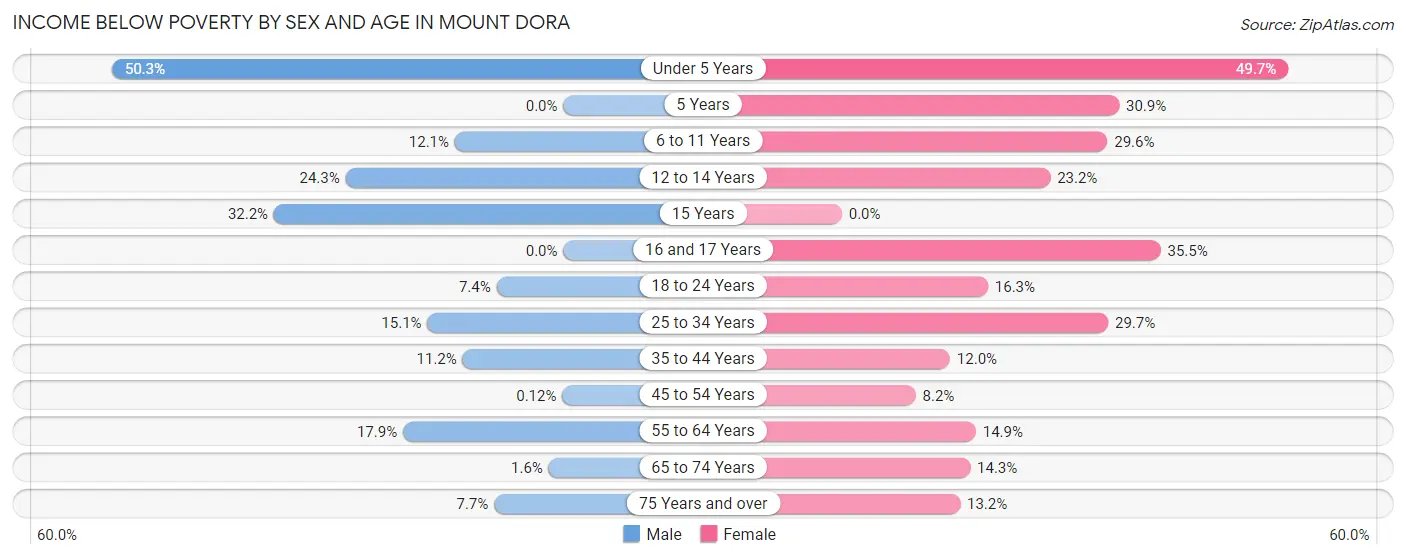
| Age Bracket | Male | Female |
| Under 5 Years | 176 (50.3%) | 250 (49.7%) |
| 5 Years | 0 (0.0%) | 63 (30.9%) |
| 6 to 11 Years | 57 (12.1%) | 131 (29.6%) |
| 12 to 14 Years | 90 (24.3%) | 26 (23.2%) |
| 15 Years | 39 (32.2%) | 0 (0.0%) |
| 16 and 17 Years | 0 (0.0%) | 71 (35.5%) |
| 18 to 24 Years | 32 (7.4%) | 83 (16.3%) |
| 25 to 34 Years | 122 (15.1%) | 260 (29.6%) |
| 35 to 44 Years | 93 (11.2%) | 108 (12.0%) |
| 45 to 54 Years | 1 (0.1%) | 68 (8.2%) |
| 55 to 64 Years | 135 (17.9%) | 159 (14.9%) |
| 65 to 74 Years | 20 (1.6%) | 225 (14.3%) |
| 75 Years and over | 74 (7.7%) | 185 (13.2%) |
| Total | 839 (11.5%) | 1,629 (18.8%) |
Income Above Poverty by Sex and Age in Mount Dora
According to the poverty statistics in Mount Dora, males aged 5 years and females aged 15 years are the age groups that are most secure financially, with 100.0% of males and 100.0% of females in these age groups living above the poverty line.
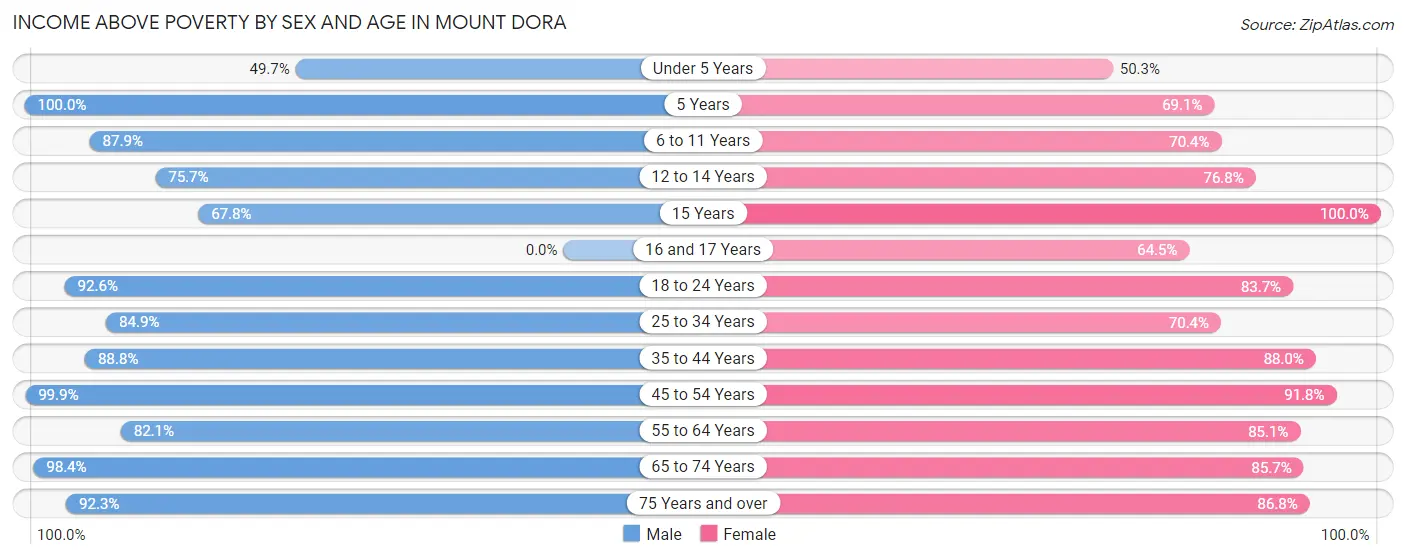
| Age Bracket | Male | Female |
| Under 5 Years | 174 (49.7%) | 253 (50.3%) |
| 5 Years | 110 (100.0%) | 141 (69.1%) |
| 6 to 11 Years | 415 (87.9%) | 312 (70.4%) |
| 12 to 14 Years | 281 (75.7%) | 86 (76.8%) |
| 15 Years | 82 (67.8%) | 42 (100.0%) |
| 16 and 17 Years | 0 (0.0%) | 129 (64.5%) |
| 18 to 24 Years | 398 (92.6%) | 427 (83.7%) |
| 25 to 34 Years | 684 (84.9%) | 617 (70.4%) |
| 35 to 44 Years | 736 (88.8%) | 789 (88.0%) |
| 45 to 54 Years | 843 (99.9%) | 759 (91.8%) |
| 55 to 64 Years | 621 (82.1%) | 907 (85.1%) |
| 65 to 74 Years | 1,209 (98.4%) | 1,349 (85.7%) |
| 75 Years and over | 886 (92.3%) | 1,220 (86.8%) |
| Total | 6,439 (88.5%) | 7,031 (81.2%) |
Income Below Poverty Among Married-Couple Families in Mount Dora
The poverty statistics for married-couple families in Mount Dora show that 2.3% or 78 of the total 3,393 families live below the poverty line. Families with 3 or 4 children have the highest poverty rate of 26.4%, comprising of 37 families. On the other hand, families with 1 or 2 children have the lowest poverty rate of 0.0%, which includes 0 families.
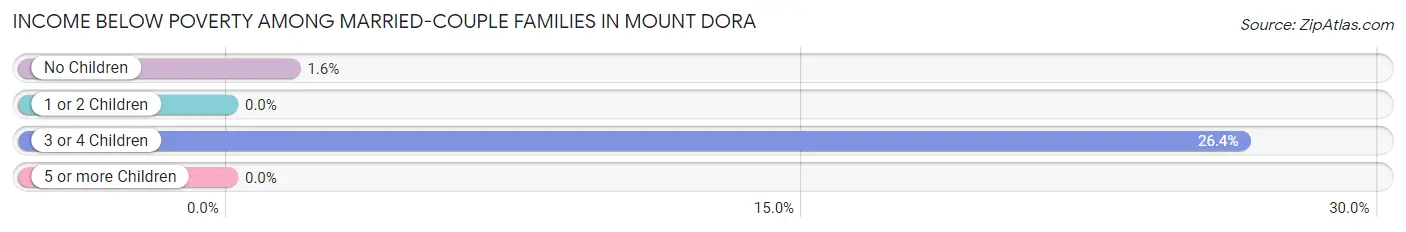
| Children | Above Poverty | Below Poverty |
| No Children | 2,471 (98.4%) | 41 (1.6%) |
| 1 or 2 Children | 741 (100.0%) | 0 (0.0%) |
| 3 or 4 Children | 103 (73.6%) | 37 (26.4%) |
| 5 or more Children | 0 (0.0%) | 0 (0.0%) |
| Total | 3,315 (97.7%) | 78 (2.3%) |
Income Below Poverty Among Single-Parent Households in Mount Dora
According to the poverty data in Mount Dora, 13.4% or 57 single-father households and 27.2% or 192 single-mother households are living below the poverty line. Among single-father households, those with 1 or 2 children have the highest poverty rate, with 26 households (13.6%) experiencing poverty. Likewise, among single-mother households, those with 3 or 4 children have the highest poverty rate, with 76 households (80.8%) falling below the poverty line.
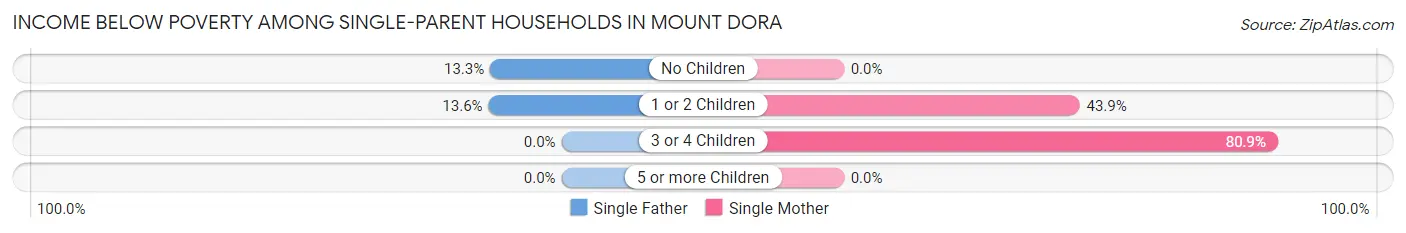
| Children | Single Father | Single Mother |
| No Children | 31 (13.3%) | 0 (0.0%) |
| 1 or 2 Children | 26 (13.6%) | 116 (43.9%) |
| 3 or 4 Children | 0 (0.0%) | 76 (80.8%) |
| 5 or more Children | 0 (0.0%) | 0 (0.0%) |
| Total | 57 (13.4%) | 192 (27.2%) |
Income Below Poverty Among Married-Couple vs Single-Parent Households in Mount Dora
The poverty data for Mount Dora shows that 78 of the married-couple family households (2.3%) and 249 of the single-parent households (22.1%) are living below the poverty level. Within the married-couple family households, those with 3 or 4 children have the highest poverty rate, with 37 households (26.4%) falling below the poverty line. Among the single-parent households, those with 3 or 4 children have the highest poverty rate, with 76 household (80.8%) living below poverty.
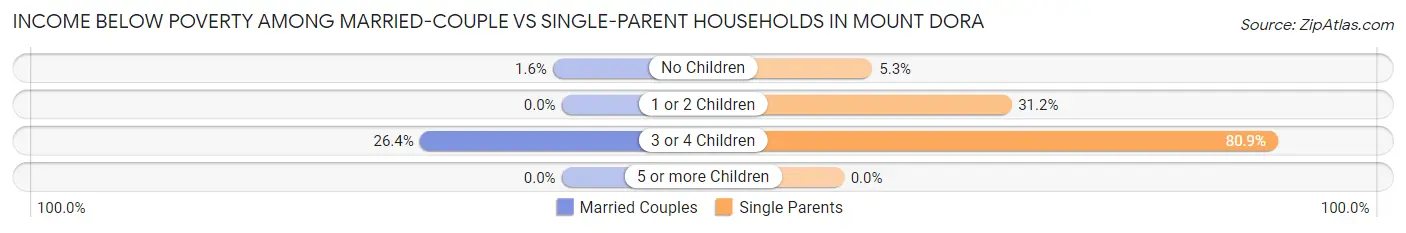
| Children | Married-Couple Families | Single-Parent Households |
| No Children | 41 (1.6%) | 31 (5.3%) |
| 1 or 2 Children | 0 (0.0%) | 142 (31.2%) |
| 3 or 4 Children | 37 (26.4%) | 76 (80.8%) |
| 5 or more Children | 0 (0.0%) | 0 (0.0%) |
| Total | 78 (2.3%) | 249 (22.1%) |
Race in Mount Dora
The most populous races in Mount Dora are White / Caucasian (12,079 | 74.0%), Hispanic or Latino (2,633 | 16.1%), and Black / African American (2,239 | 13.7%).
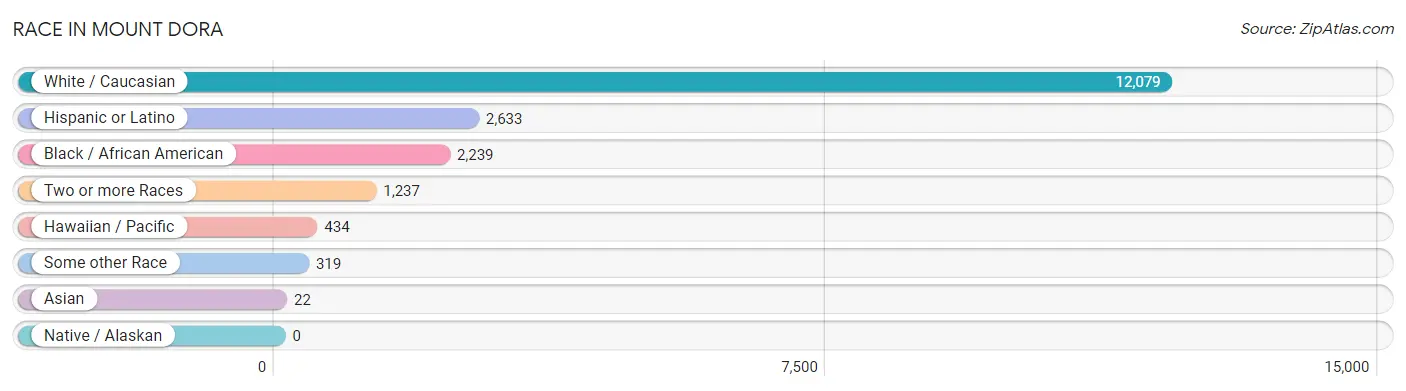
| Race | # Population | % Population |
| Asian | 22 | 0.1% |
| Black / African American | 2,239 | 13.7% |
| Hawaiian / Pacific | 434 | 2.7% |
| Hispanic or Latino | 2,633 | 16.1% |
| Native / Alaskan | 0 | 0.0% |
| White / Caucasian | 12,079 | 74.0% |
| Two or more Races | 1,237 | 7.6% |
| Some other Race | 319 | 1.9% |
| Total | 16,330 | 100.0% |
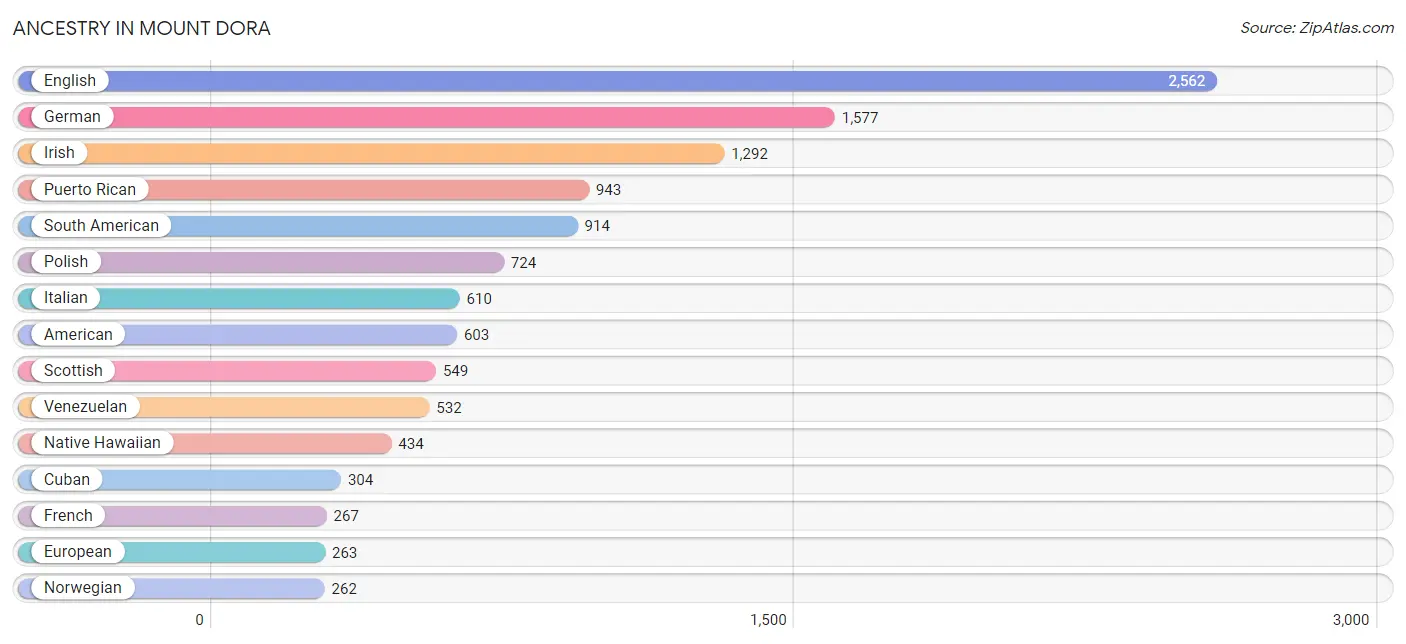
Ancestry in Mount Dora
The most populous ancestries reported in Mount Dora are English (2,562 | 15.7%), German (1,577 | 9.7%), Irish (1,292 | 7.9%), Puerto Rican (943 | 5.8%), and South American (914 | 5.6%), together accounting for 44.6% of all Mount Dora residents.
| Ancestry | # Population | % Population |
| African | 152 | 0.9% |
| Albanian | 53 | 0.3% |
| American | 603 | 3.7% |
| Arab | 20 | 0.1% |
| Armenian | 42 | 0.3% |
| Austrian | 29 | 0.2% |
| Belgian | 76 | 0.5% |
| Bhutanese | 8 | 0.1% |
| Blackfeet | 21 | 0.1% |
| Brazilian | 5 | 0.0% |
| British | 80 | 0.5% |
| Canadian | 44 | 0.3% |
| Central American | 109 | 0.7% |
| Colombian | 127 | 0.8% |
| Costa Rican | 2 | 0.0% |
| Cuban | 304 | 1.9% |
| Czech | 65 | 0.4% |
| Danish | 32 | 0.2% |
| Dominican | 91 | 0.6% |
| Dutch | 123 | 0.7% |
| Eastern European | 43 | 0.3% |
| Ecuadorian | 216 | 1.3% |
| English | 2,562 | 15.7% |
| European | 263 | 1.6% |
| Finnish | 5 | 0.0% |
| French | 267 | 1.6% |
| French Canadian | 68 | 0.4% |
| German | 1,577 | 9.7% |
| Greek | 69 | 0.4% |
| Guatemalan | 75 | 0.5% |
| Guyanese | 8 | 0.1% |
| Haitian | 73 | 0.4% |
| Honduran | 32 | 0.2% |
| Hungarian | 226 | 1.4% |
| Irish | 1,292 | 7.9% |
| Israeli | 14 | 0.1% |
| Italian | 610 | 3.7% |
| Jamaican | 127 | 0.8% |
| Lithuanian | 64 | 0.4% |
| Mexican | 251 | 1.5% |
| Native Hawaiian | 434 | 2.7% |
| Northern European | 49 | 0.3% |
| Norwegian | 262 | 1.6% |
| Pakistani | 22 | 0.1% |
| Pennsylvania German | 15 | 0.1% |
| Peruvian | 39 | 0.2% |
| Polish | 724 | 4.4% |
| Portuguese | 6 | 0.0% |
| Puerto Rican | 943 | 5.8% |
| Romanian | 14 | 0.1% |
| Russian | 26 | 0.2% |
| Scandinavian | 85 | 0.5% |
| Scotch-Irish | 184 | 1.1% |
| Scottish | 549 | 3.4% |
| Slavic | 22 | 0.1% |
| Slovak | 108 | 0.7% |
| Slovene | 15 | 0.1% |
| South American | 914 | 5.6% |
| Spanish | 21 | 0.1% |
| Subsaharan African | 152 | 0.9% |
| Swedish | 108 | 0.7% |
| Syrian | 20 | 0.1% |
| U.S. Virgin Islander | 5 | 0.0% |
| Ukrainian | 57 | 0.4% |
| Venezuelan | 532 | 3.3% |
| Welsh | 35 | 0.2% | View All 66 Rows |
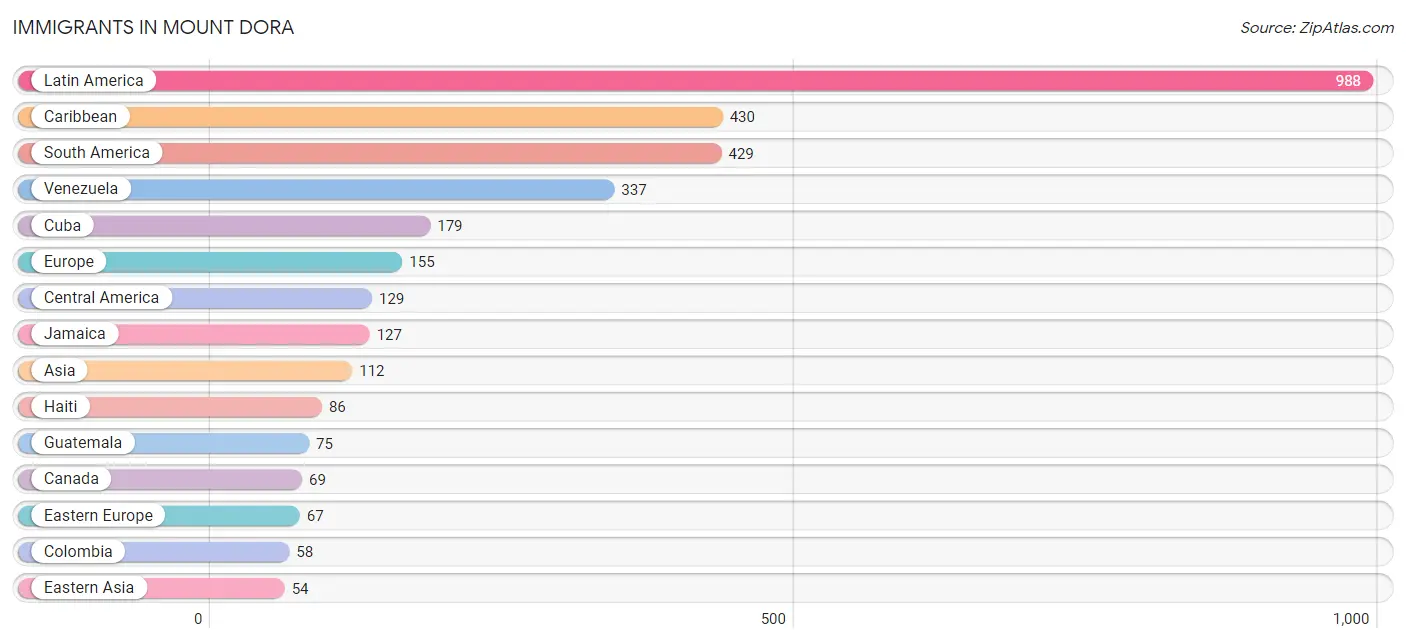
Immigrants in Mount Dora
The most numerous immigrant groups reported in Mount Dora came from Latin America (988 | 6.0%), Caribbean (430 | 2.6%), South America (429 | 2.6%), Venezuela (337 | 2.1%), and Cuba (179 | 1.1%), together accounting for 14.5% of all Mount Dora residents.
| Immigration Origin | # Population | % Population |
| Asia | 112 | 0.7% |
| Brazil | 6 | 0.0% |
| Bulgaria | 32 | 0.2% |
| Canada | 69 | 0.4% |
| Caribbean | 430 | 2.6% |
| Central America | 129 | 0.8% |
| Colombia | 58 | 0.4% |
| Costa Rica | 2 | 0.0% |
| Cuba | 179 | 1.1% |
| Dominican Republic | 38 | 0.2% |
| Eastern Asia | 54 | 0.3% |
| Eastern Europe | 67 | 0.4% |
| El Salvador | 16 | 0.1% |
| England | 32 | 0.2% |
| Europe | 155 | 0.9% |
| Germany | 26 | 0.2% |
| Guatemala | 75 | 0.5% |
| Guyana | 28 | 0.2% |
| Haiti | 86 | 0.5% |
| Honduras | 16 | 0.1% |
| Ireland | 7 | 0.0% |
| Jamaica | 127 | 0.8% |
| Japan | 54 | 0.3% |
| Latin America | 988 | 6.0% |
| Lebanon | 18 | 0.1% |
| Mexico | 20 | 0.1% |
| Netherlands | 13 | 0.1% |
| Northern Europe | 49 | 0.3% |
| South America | 429 | 2.6% |
| South Eastern Asia | 22 | 0.1% |
| Syria | 18 | 0.1% |
| Thailand | 22 | 0.1% |
| Venezuela | 337 | 2.1% |
| Western Asia | 36 | 0.2% |
| Western Europe | 39 | 0.2% | View All 35 Rows |
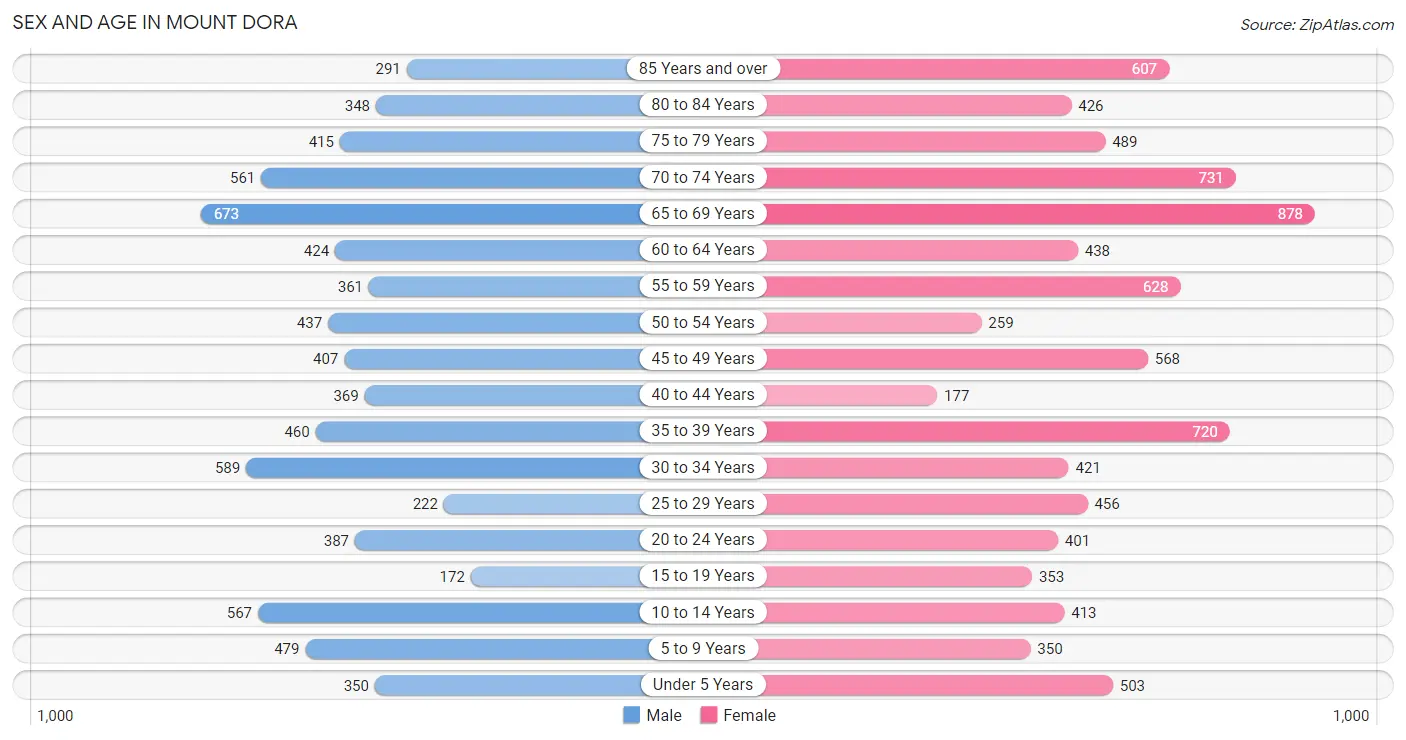
Sex and Age in Mount Dora
Sex and Age in Mount Dora
The most populous age groups in Mount Dora are 65 to 69 Years (673 | 9.0%) for men and 65 to 69 Years (878 | 10.0%) for women.
| Age Bracket | Male | Female |
| Under 5 Years | 350 (4.7%) | 503 (5.7%) |
| 5 to 9 Years | 479 (6.4%) | 350 (4.0%) |
| 10 to 14 Years | 567 (7.5%) | 413 (4.7%) |
| 15 to 19 Years | 172 (2.3%) | 353 (4.0%) |
| 20 to 24 Years | 387 (5.1%) | 401 (4.5%) |
| 25 to 29 Years | 222 (3.0%) | 456 (5.2%) |
| 30 to 34 Years | 589 (7.8%) | 421 (4.8%) |
| 35 to 39 Years | 460 (6.1%) | 720 (8.2%) |
| 40 to 44 Years | 369 (4.9%) | 177 (2.0%) |
| 45 to 49 Years | 407 (5.4%) | 568 (6.4%) |
| 50 to 54 Years | 437 (5.8%) | 259 (2.9%) |
| 55 to 59 Years | 361 (4.8%) | 628 (7.1%) |
| 60 to 64 Years | 424 (5.6%) | 438 (5.0%) |
| 65 to 69 Years | 673 (9.0%) | 878 (10.0%) |
| 70 to 74 Years | 561 (7.5%) | 731 (8.3%) |
| 75 to 79 Years | 415 (5.5%) | 489 (5.6%) |
| 80 to 84 Years | 348 (4.6%) | 426 (4.8%) |
| 85 Years and over | 291 (3.9%) | 607 (6.9%) |
| Total | 7,512 (100.0%) | 8,818 (100.0%) |
Families and Households in Mount Dora
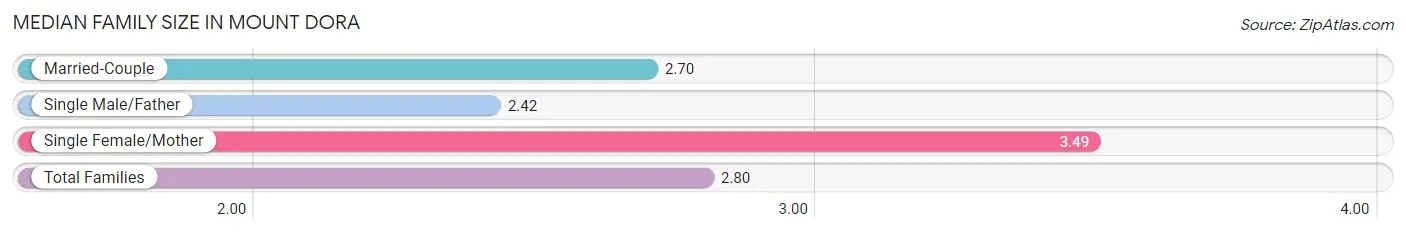
Median Family Size in Mount Dora
The median family size in Mount Dora is 2.80 persons per family, with single female/mother families (705 | 15.6%) accounting for the largest median family size of 3.49 persons per family. On the other hand, single male/father families (424 | 9.4%) represent the smallest median family size with 2.42 persons per family.
| Family Type | # Families | Family Size |
| Married-Couple | 3,393 (75.0%) | 2.70 |
| Single Male/Father | 424 (9.4%) | 2.42 |
| Single Female/Mother | 705 (15.6%) | 3.49 |
| Total Families | 4,522 (100.0%) | 2.80 |
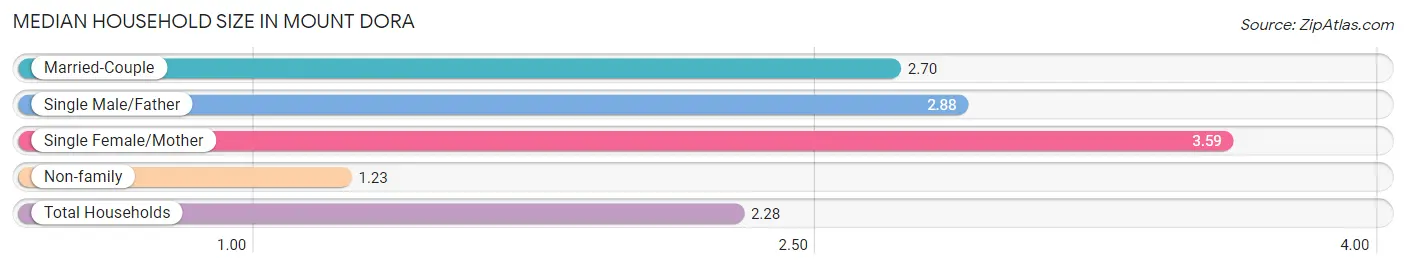
Median Household Size in Mount Dora
The median household size in Mount Dora is 2.28 persons per household, with single female/mother households (705 | 10.0%) accounting for the largest median household size of 3.59 persons per household. non-family households (2,500 | 35.6%) represent the smallest median household size with 1.23 persons per household.
| Household Type | # Households | Household Size |
| Married-Couple | 3,393 (48.3%) | 2.70 |
| Single Male/Father | 424 (6.0%) | 2.88 |
| Single Female/Mother | 705 (10.0%) | 3.59 |
| Non-family | 2,500 (35.6%) | 1.23 |
| Total Households | 7,022 (100.0%) | 2.28 |
Household Size by Marriage Status in Mount Dora
Out of a total of 7,022 households in Mount Dora, 4,522 (64.4%) are family households, while 2,500 (35.6%) are nonfamily households. The most numerous type of family households are 2-person households, comprising 2,778, and the most common type of nonfamily households are 1-person households, comprising 2,228.
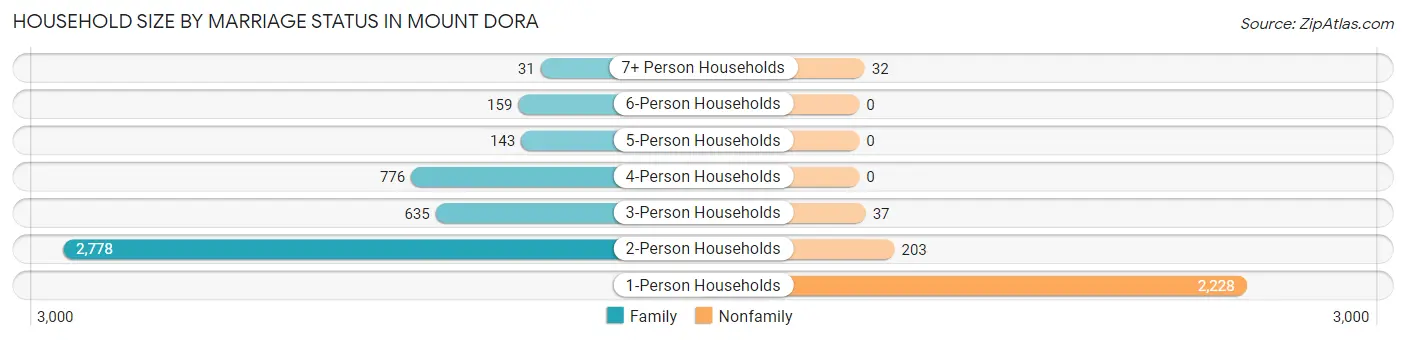
| Household Size | Family Households | Nonfamily Households |
| 1-Person Households | - | 2,228 (31.7%) |
| 2-Person Households | 2,778 (39.6%) | 203 (2.9%) |
| 3-Person Households | 635 (9.0%) | 37 (0.5%) |
| 4-Person Households | 776 (11.1%) | 0 (0.0%) |
| 5-Person Households | 143 (2.0%) | 0 (0.0%) |
| 6-Person Households | 159 (2.3%) | 0 (0.0%) |
| 7+ Person Households | 31 (0.4%) | 32 (0.5%) |
| Total | 4,522 (64.4%) | 2,500 (35.6%) |
Female Fertility in Mount Dora
Fertility by Age in Mount Dora
Average fertility rate in Mount Dora is 66.0 births per 1,000 women. Women in the age bracket of 20 to 34 years have the highest fertility rate with 119.0 births per 1,000 women. Women in the age bracket of 20 to 34 years acount for 74.9% of all women with births.
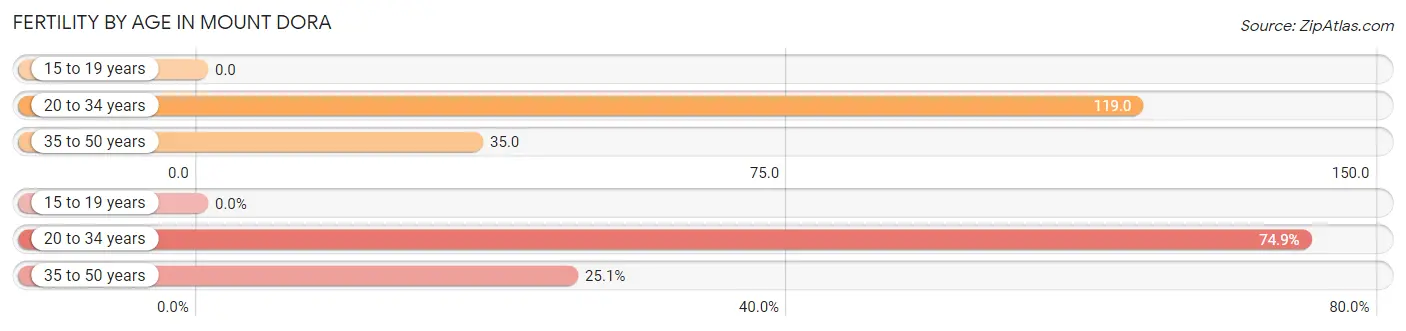
| Age Bracket | Women with Births | Births / 1,000 Women |
| 15 to 19 years | 0 (0.0%) | 0.0 |
| 20 to 34 years | 152 (74.9%) | 119.0 |
| 35 to 50 years | 51 (25.1%) | 35.0 |
| Total | 203 (100.0%) | 66.0 |
Fertility by Age by Marriage Status in Mount Dora
49.8% of women with births (203) in Mount Dora are married. The highest percentage of unmarried women with births falls into 20 to 34 years age bracket with 67.1% of them unmarried at the time of birth, while the lowest percentage of unmarried women with births belong to 35 to 50 years age bracket with 0.0% of them unmarried.
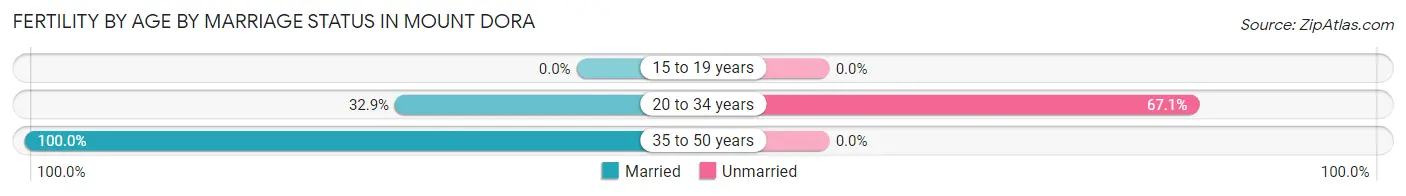
| Age Bracket | Married | Unmarried |
| 15 to 19 years | 0 (0.0%) | 0 (0.0%) |
| 20 to 34 years | 50 (32.9%) | 102 (67.1%) |
| 35 to 50 years | 51 (100.0%) | 0 (0.0%) |
| Total | 101 (49.7%) | 102 (50.2%) |
Fertility by Education in Mount Dora
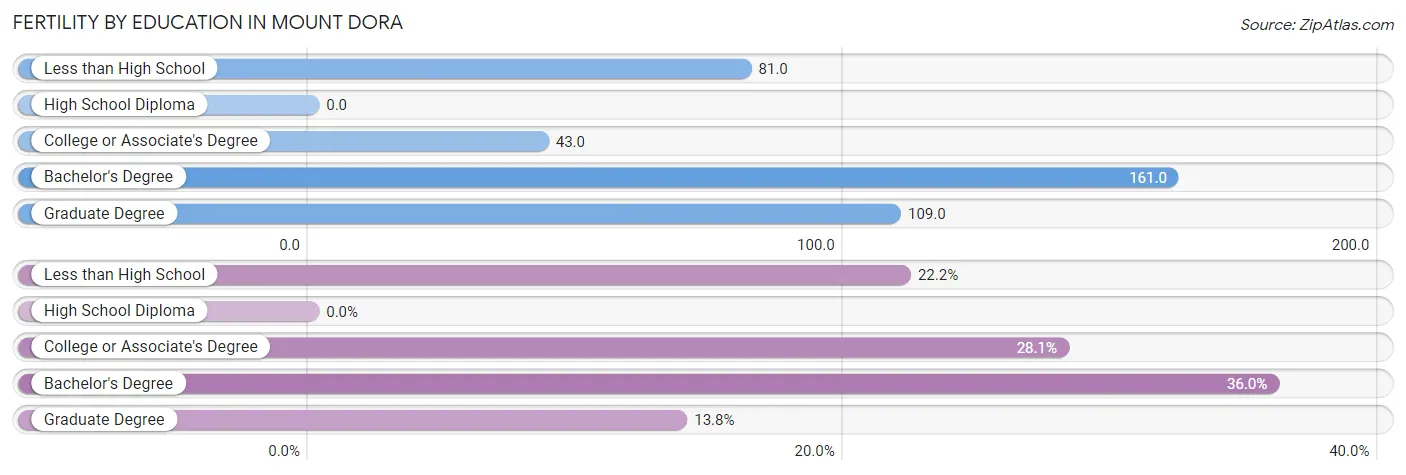
| Educational Attainment | Women with Births | Births / 1,000 Women |
| Less than High School | 45 (22.2%) | 81.0 |
| High School Diploma | 0 (0.0%) | 0.0 |
| College or Associate's Degree | 57 (28.1%) | 43.0 |
| Bachelor's Degree | 73 (36.0%) | 161.0 |
| Graduate Degree | 28 (13.8%) | 109.0 |
| Total | 203 (100.0%) | 66.0 |
Fertility by Education by Marriage Status in Mount Dora
50.2% of women with births in Mount Dora are unmarried. Women with the educational attainment of bachelor's degree are most likely to be married with 100.0% of them married at childbirth, while women with the educational attainment of less than high school are least likely to be married with 100.0% of them unmarried at childbirth.
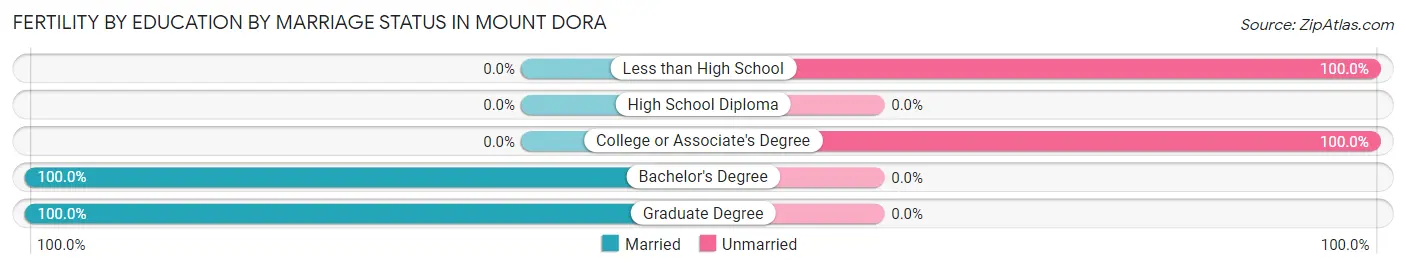
| Educational Attainment | Married | Unmarried |
| Less than High School | 0 (0.0%) | 45 (100.0%) |
| High School Diploma | 0 (0.0%) | 0 (0.0%) |
| College or Associate's Degree | 0 (0.0%) | 57 (100.0%) |
| Bachelor's Degree | 73 (100.0%) | 0 (0.0%) |
| Graduate Degree | 28 (100.0%) | 0 (0.0%) |
| Total | 101 (49.7%) | 102 (50.2%) |
Employment Characteristics in Mount Dora
Employment by Class of Employer in Mount Dora
Among the 6,475 employed individuals in Mount Dora, private company employees (4,239 | 65.5%), not-for-profit organizations (660 | 10.2%), and local government employees (581 | 9.0%) make up the most common classes of employment.
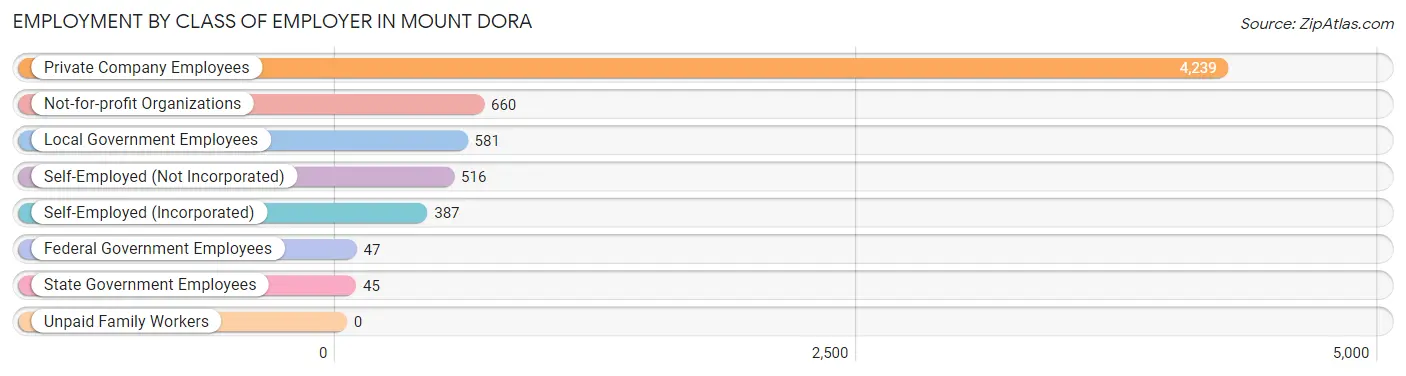
| Employer Class | # Employees | % Employees |
| Private Company Employees | 4,239 | 65.5% |
| Self-Employed (Incorporated) | 387 | 6.0% |
| Self-Employed (Not Incorporated) | 516 | 8.0% |
| Not-for-profit Organizations | 660 | 10.2% |
| Local Government Employees | 581 | 9.0% |
| State Government Employees | 45 | 0.7% |
| Federal Government Employees | 47 | 0.7% |
| Unpaid Family Workers | 0 | 0.0% |
| Total | 6,475 | 100.0% |
Employment Status by Age in Mount Dora
According to the labor force statistics for Mount Dora, out of the total population over 16 years of age (13,505), 52.4% or 7,077 individuals are in the labor force, with 6.1% or 432 of them unemployed. The age group with the highest labor force participation rate is 30 to 34 years, with 94.1% or 950 individuals in the labor force. Within the labor force, the 16 to 19 years age range has the highest percentage of unemployed individuals, with 33.6% or 71 of them being unemployed.
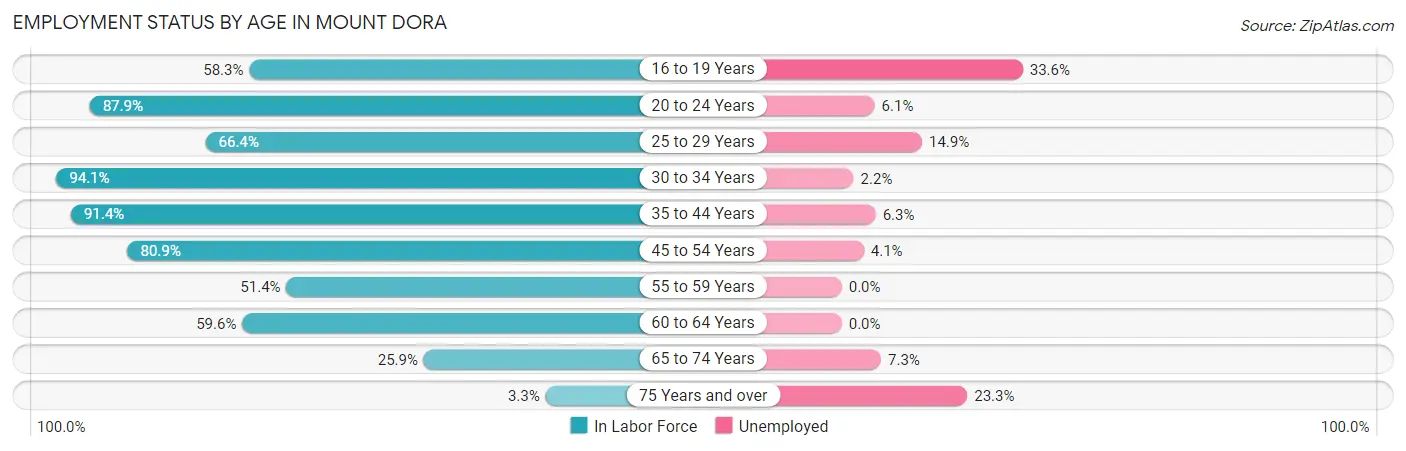
| Age Bracket | In Labor Force | Unemployed |
| 16 to 19 Years | 211 (58.3%) | 71 (33.6%) |
| 20 to 24 Years | 693 (87.9%) | 42 (6.1%) |
| 25 to 29 Years | 450 (66.4%) | 67 (14.9%) |
| 30 to 34 Years | 950 (94.1%) | 21 (2.2%) |
| 35 to 44 Years | 1,578 (91.4%) | 99 (6.3%) |
| 45 to 54 Years | 1,352 (80.9%) | 55 (4.1%) |
| 55 to 59 Years | 508 (51.4%) | 0 (0.0%) |
| 60 to 64 Years | 514 (59.6%) | 0 (0.0%) |
| 65 to 74 Years | 736 (25.9%) | 54 (7.3%) |
| 75 Years and over | 85 (3.3%) | 20 (23.3%) |
| Total | 7,077 (52.4%) | 432 (6.1%) |
Employment Status by Educational Attainment in Mount Dora
According to labor force statistics for Mount Dora, 77.1% of individuals (5,348) out of the total population between 25 and 64 years of age (6,936) are in the labor force, with 4.5% or 241 of them being unemployed. The group with the highest labor force participation rate are those with the educational attainment of bachelor's degree or higher, with 88.2% or 1,733 individuals in the labor force. Within the labor force, individuals with less than high school education have the highest percentage of unemployment, with 18.4% or 77 of them being unemployed.
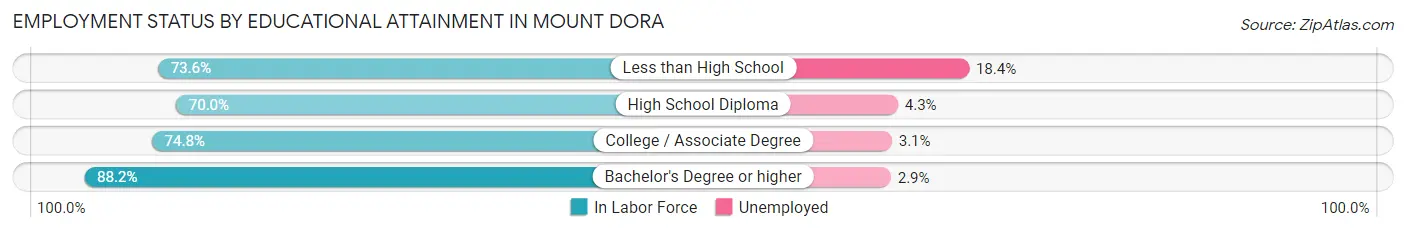
| Educational Attainment | In Labor Force | Unemployed |
| Less than High School | 419 (73.6%) | 105 (18.4%) |
| High School Diploma | 1,352 (70.0%) | 83 (4.3%) |
| College / Associate Degree | 1,848 (74.8%) | 77 (3.1%) |
| Bachelor's Degree or higher | 1,733 (88.2%) | 57 (2.9%) |
| Total | 5,348 (77.1%) | 312 (4.5%) |
Employment Occupations by Sex in Mount Dora
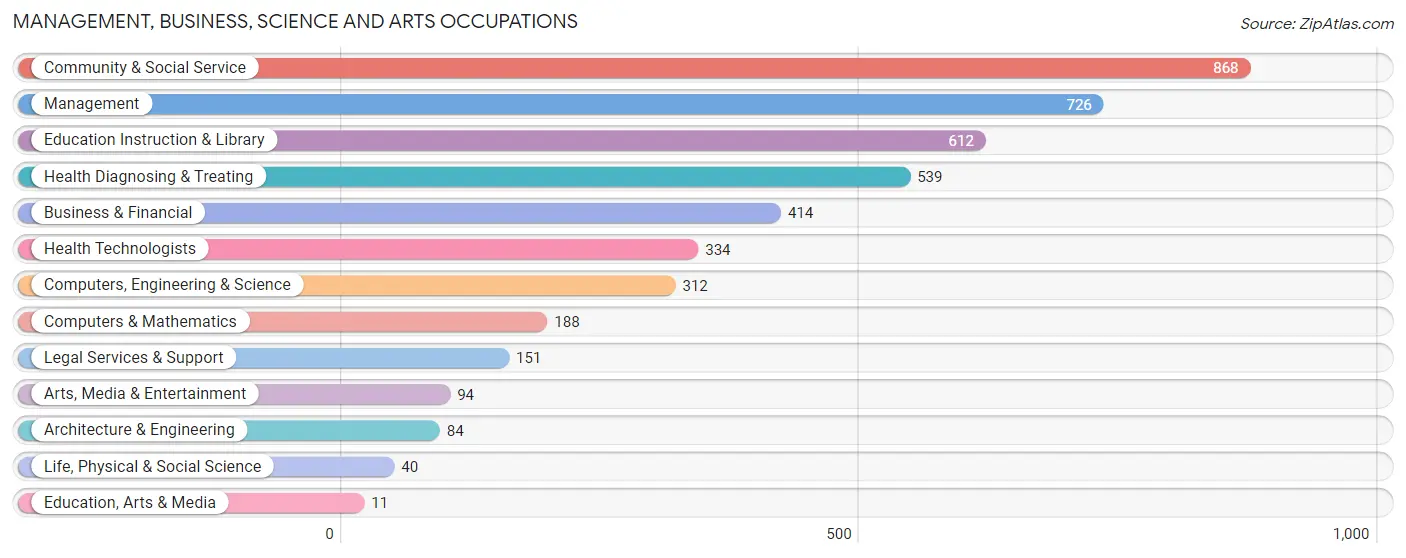
Management, Business, Science and Arts Occupations
The most common Management, Business, Science and Arts occupations in Mount Dora are Community & Social Service (868 | 13.2%), Management (726 | 11.0%), Education Instruction & Library (612 | 9.3%), Health Diagnosing & Treating (539 | 8.2%), and Business & Financial (414 | 6.3%).
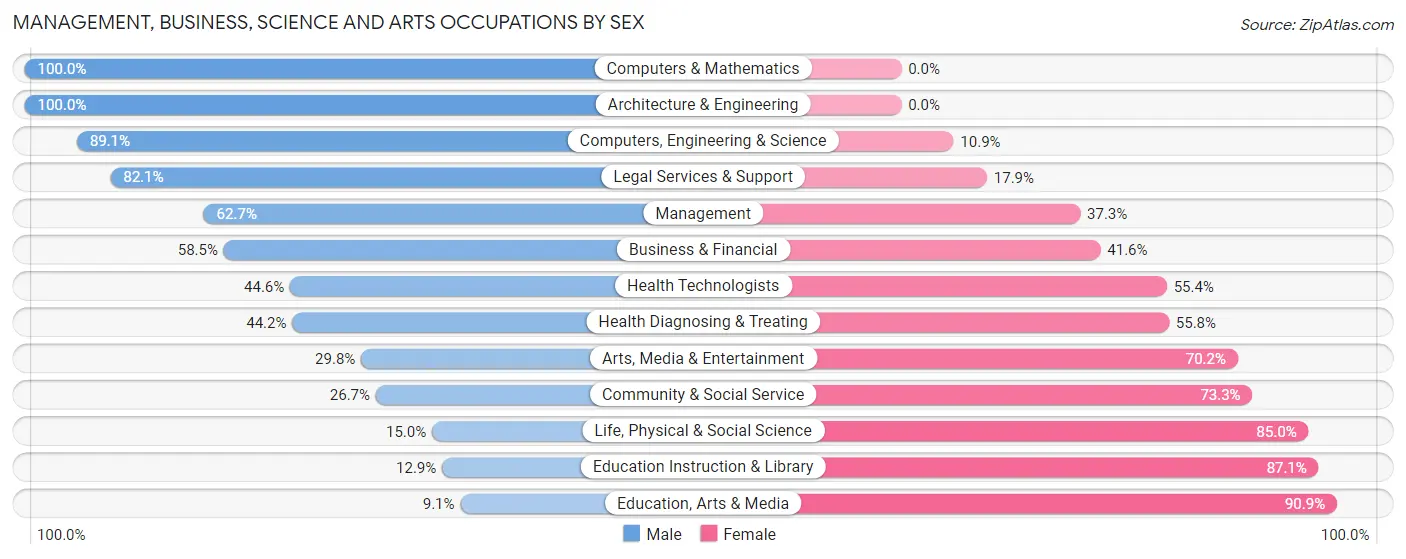
Management, Business, Science and Arts Occupations by Sex
Within the Management, Business, Science and Arts occupations in Mount Dora, the most male-oriented occupations are Computers & Mathematics (100.0%), Architecture & Engineering (100.0%), and Computers, Engineering & Science (89.1%), while the most female-oriented occupations are Education, Arts & Media (90.9%), Education Instruction & Library (87.1%), and Life, Physical & Social Science (85.0%).
| Occupation | Male | Female |
| Management | 455 (62.7%) | 271 (37.3%) |
| Business & Financial | 242 (58.5%) | 172 (41.5%) |
| Computers, Engineering & Science | 278 (89.1%) | 34 (10.9%) |
| Computers & Mathematics | 188 (100.0%) | 0 (0.0%) |
| Architecture & Engineering | 84 (100.0%) | 0 (0.0%) |
| Life, Physical & Social Science | 6 (15.0%) | 34 (85.0%) |
| Community & Social Service | 232 (26.7%) | 636 (73.3%) |
| Education, Arts & Media | 1 (9.1%) | 10 (90.9%) |
| Legal Services & Support | 124 (82.1%) | 27 (17.9%) |
| Education Instruction & Library | 79 (12.9%) | 533 (87.1%) |
| Arts, Media & Entertainment | 28 (29.8%) | 66 (70.2%) |
| Health Diagnosing & Treating | 238 (44.2%) | 301 (55.8%) |
| Health Technologists | 149 (44.6%) | 185 (55.4%) |
| Total (Category) | 1,445 (50.5%) | 1,414 (49.5%) |
| Total (Overall) | 3,274 (49.6%) | 3,328 (50.4%) |
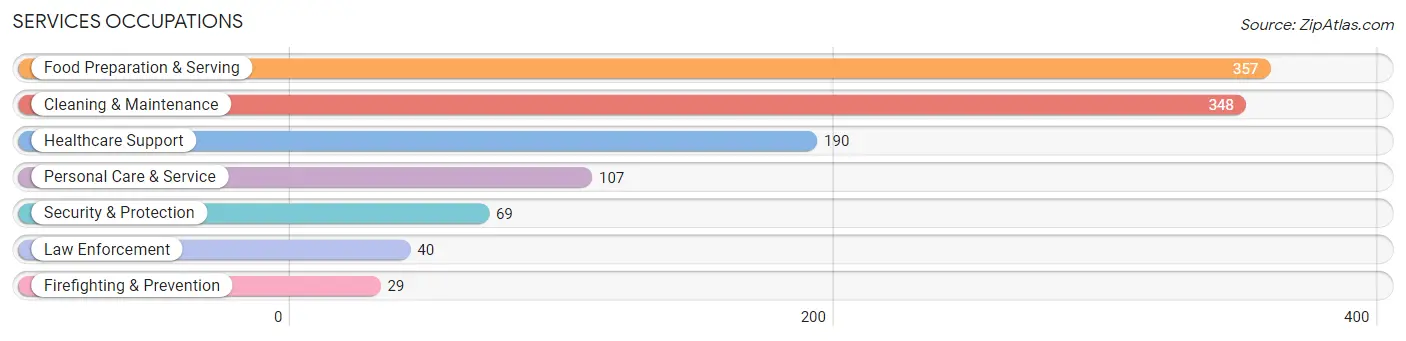
Services Occupations
The most common Services occupations in Mount Dora are Food Preparation & Serving (357 | 5.4%), Cleaning & Maintenance (348 | 5.3%), Healthcare Support (190 | 2.9%), Personal Care & Service (107 | 1.6%), and Security & Protection (69 | 1.1%).
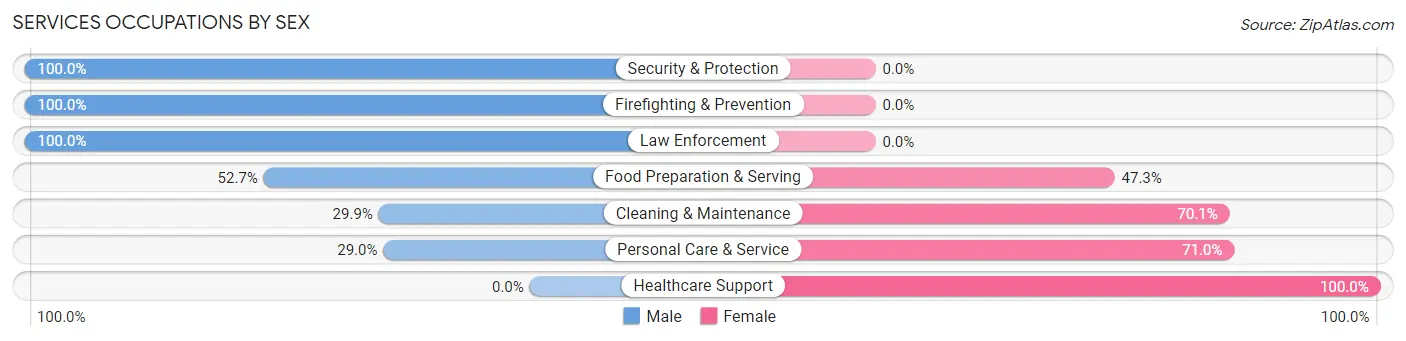
Services Occupations by Sex
Within the Services occupations in Mount Dora, the most male-oriented occupations are Security & Protection (100.0%), Firefighting & Prevention (100.0%), and Law Enforcement (100.0%), while the most female-oriented occupations are Healthcare Support (100.0%), Personal Care & Service (71.0%), and Cleaning & Maintenance (70.1%).
| Occupation | Male | Female |
| Healthcare Support | 0 (0.0%) | 190 (100.0%) |
| Security & Protection | 69 (100.0%) | 0 (0.0%) |
| Firefighting & Prevention | 29 (100.0%) | 0 (0.0%) |
| Law Enforcement | 40 (100.0%) | 0 (0.0%) |
| Food Preparation & Serving | 188 (52.7%) | 169 (47.3%) |
| Cleaning & Maintenance | 104 (29.9%) | 244 (70.1%) |
| Personal Care & Service | 31 (29.0%) | 76 (71.0%) |
| Total (Category) | 392 (36.6%) | 679 (63.4%) |
| Total (Overall) | 3,274 (49.6%) | 3,328 (50.4%) |
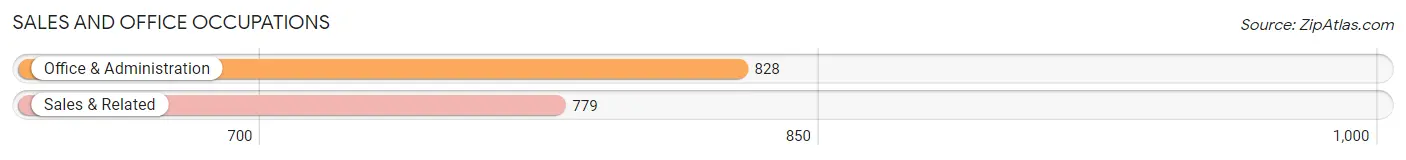
Sales and Office Occupations
The most common Sales and Office occupations in Mount Dora are Office & Administration (828 | 12.5%), and Sales & Related (779 | 11.8%).
Sales and Office Occupations by Sex
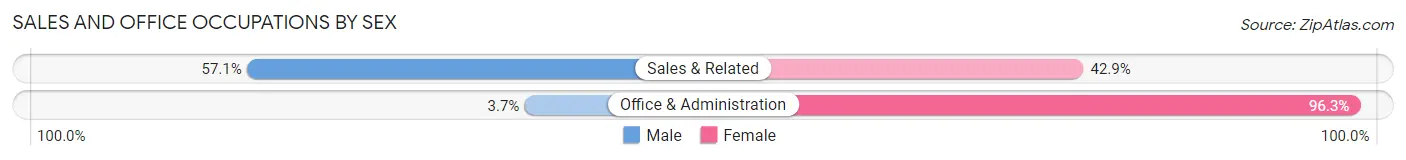
| Occupation | Male | Female |
| Sales & Related | 445 (57.1%) | 334 (42.9%) |
| Office & Administration | 31 (3.7%) | 797 (96.3%) |
| Total (Category) | 476 (29.6%) | 1,131 (70.4%) |
| Total (Overall) | 3,274 (49.6%) | 3,328 (50.4%) |
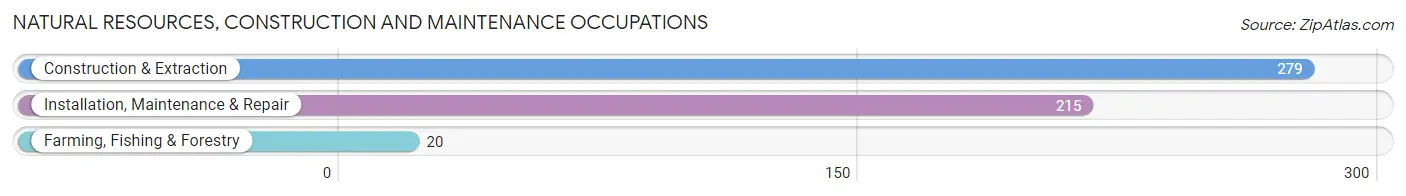
Natural Resources, Construction and Maintenance Occupations
The most common Natural Resources, Construction and Maintenance occupations in Mount Dora are Construction & Extraction (279 | 4.2%), Installation, Maintenance & Repair (215 | 3.3%), and Farming, Fishing & Forestry (20 | 0.3%).
Natural Resources, Construction and Maintenance Occupations by Sex
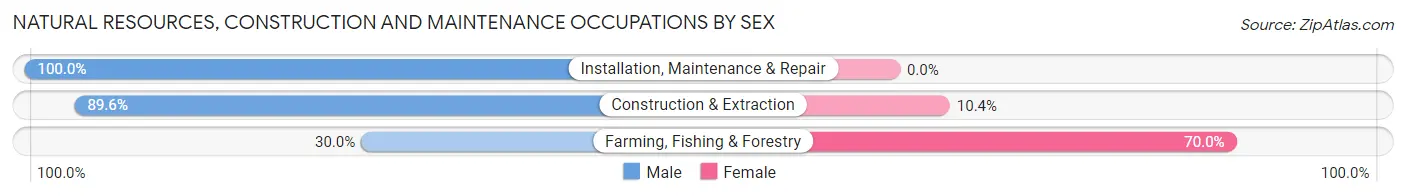
| Occupation | Male | Female |
| Farming, Fishing & Forestry | 6 (30.0%) | 14 (70.0%) |
| Construction & Extraction | 250 (89.6%) | 29 (10.4%) |
| Installation, Maintenance & Repair | 215 (100.0%) | 0 (0.0%) |
| Total (Category) | 471 (91.6%) | 43 (8.4%) |
| Total (Overall) | 3,274 (49.6%) | 3,328 (50.4%) |
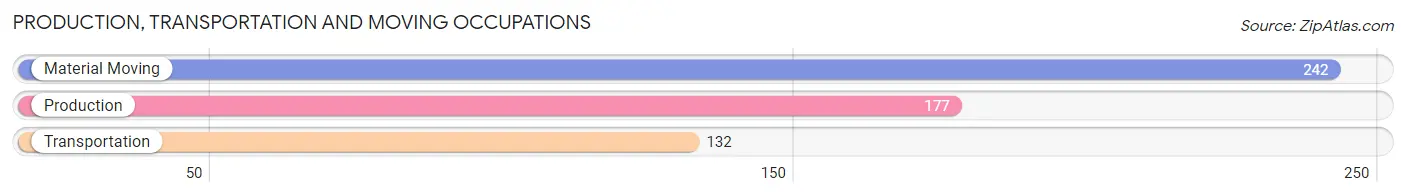
Production, Transportation and Moving Occupations
The most common Production, Transportation and Moving occupations in Mount Dora are Material Moving (242 | 3.7%), Production (177 | 2.7%), and Transportation (132 | 2.0%).
Production, Transportation and Moving Occupations by Sex
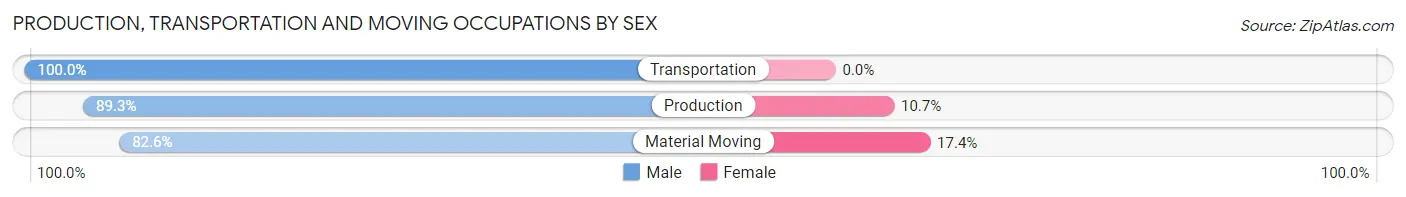
| Occupation | Male | Female |
| Production | 158 (89.3%) | 19 (10.7%) |
| Transportation | 132 (100.0%) | 0 (0.0%) |
| Material Moving | 200 (82.6%) | 42 (17.4%) |
| Total (Category) | 490 (88.9%) | 61 (11.1%) |
| Total (Overall) | 3,274 (49.6%) | 3,328 (50.4%) |
Employment Industries by Sex in Mount Dora
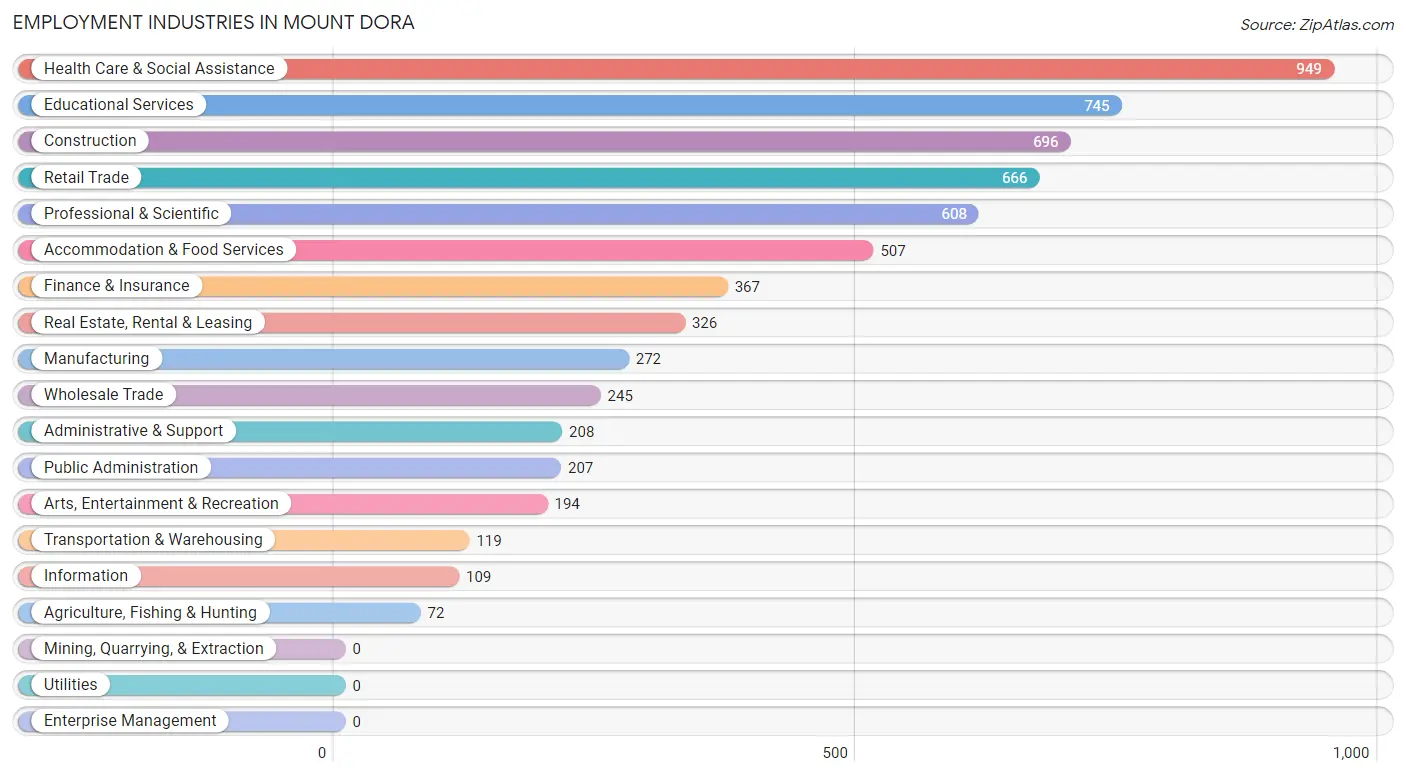
Employment Industries in Mount Dora
The major employment industries in Mount Dora include Health Care & Social Assistance (949 | 14.4%), Educational Services (745 | 11.3%), Construction (696 | 10.5%), Retail Trade (666 | 10.1%), and Professional & Scientific (608 | 9.2%).
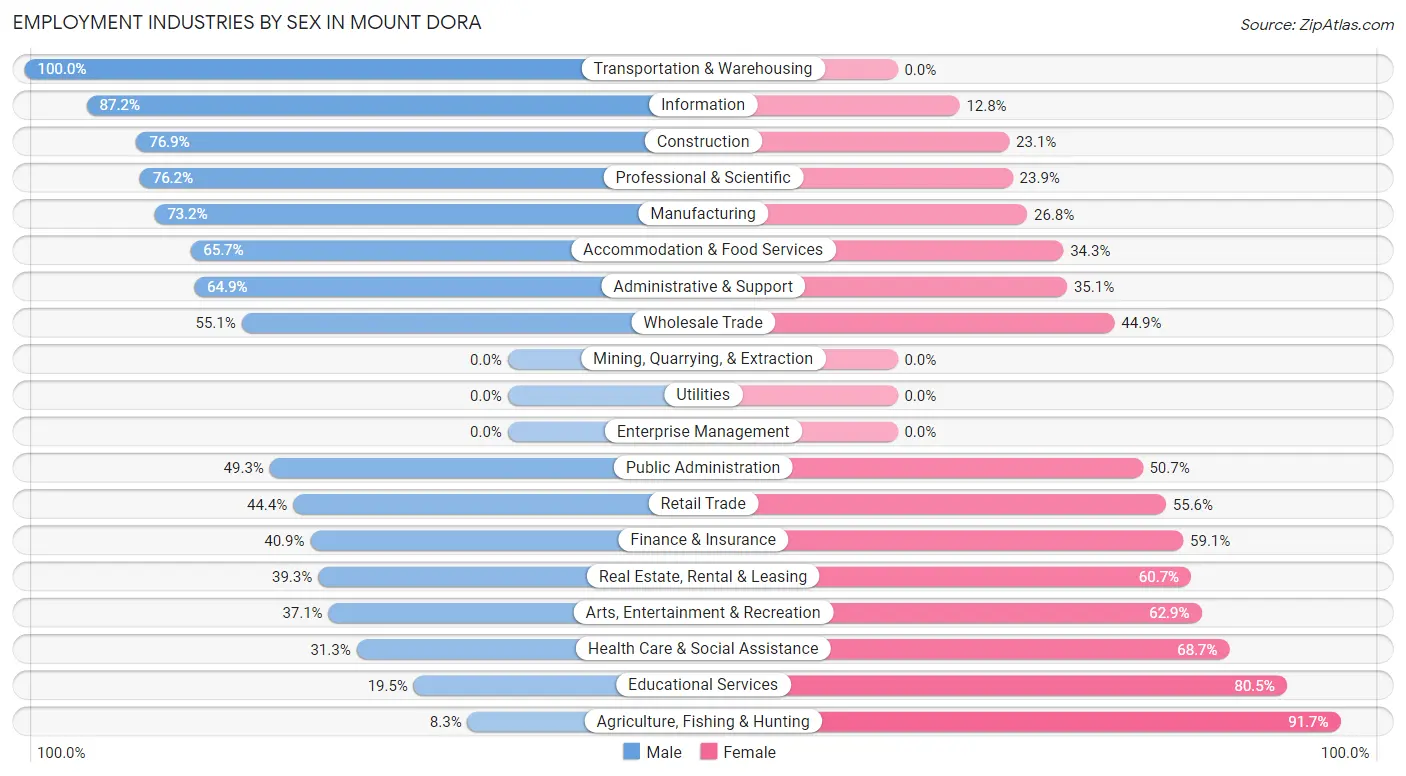
Employment Industries by Sex in Mount Dora
The Mount Dora industries that see more men than women are Transportation & Warehousing (100.0%), Information (87.2%), and Construction (76.9%), whereas the industries that tend to have a higher number of women are Agriculture, Fishing & Hunting (91.7%), Educational Services (80.5%), and Health Care & Social Assistance (68.7%).
| Industry | Male | Female |
| Agriculture, Fishing & Hunting | 6 (8.3%) | 66 (91.7%) |
| Mining, Quarrying, & Extraction | 0 (0.0%) | 0 (0.0%) |
| Construction | 535 (76.9%) | 161 (23.1%) |
| Manufacturing | 199 (73.2%) | 73 (26.8%) |
| Wholesale Trade | 135 (55.1%) | 110 (44.9%) |
| Retail Trade | 296 (44.4%) | 370 (55.6%) |
| Transportation & Warehousing | 119 (100.0%) | 0 (0.0%) |
| Utilities | 0 (0.0%) | 0 (0.0%) |
| Information | 95 (87.2%) | 14 (12.8%) |
| Finance & Insurance | 150 (40.9%) | 217 (59.1%) |
| Real Estate, Rental & Leasing | 128 (39.3%) | 198 (60.7%) |
| Professional & Scientific | 463 (76.1%) | 145 (23.8%) |
| Enterprise Management | 0 (0.0%) | 0 (0.0%) |
| Administrative & Support | 135 (64.9%) | 73 (35.1%) |
| Educational Services | 145 (19.5%) | 600 (80.5%) |
| Health Care & Social Assistance | 297 (31.3%) | 652 (68.7%) |
| Arts, Entertainment & Recreation | 72 (37.1%) | 122 (62.9%) |
| Accommodation & Food Services | 333 (65.7%) | 174 (34.3%) |
| Public Administration | 102 (49.3%) | 105 (50.7%) |
| Total | 3,274 (49.6%) | 3,328 (50.4%) |
Education in Mount Dora
School Enrollment in Mount Dora
The most common levels of schooling among the 3,051 students in Mount Dora are college / undergraduate (874 | 28.6%), elementary school (742 | 24.3%), and middle school (563 | 18.4%).
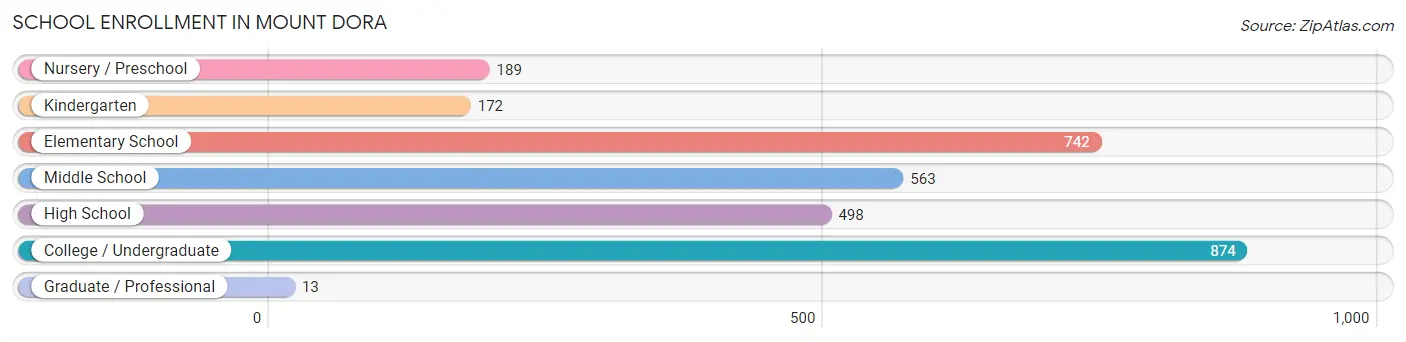
| School Level | # Students | % Students |
| Nursery / Preschool | 189 | 6.2% |
| Kindergarten | 172 | 5.6% |
| Elementary School | 742 | 24.3% |
| Middle School | 563 | 18.4% |
| High School | 498 | 16.3% |
| College / Undergraduate | 874 | 28.6% |
| Graduate / Professional | 13 | 0.4% |
| Total | 3,051 | 100.0% |
School Enrollment by Age by Funding Source in Mount Dora
Out of a total of 3,051 students who are enrolled in schools in Mount Dora, 528 (17.3%) attend a private institution, while the remaining 2,523 (82.7%) are enrolled in public schools. The age group of 20 to 24 year olds has the highest likelihood of being enrolled in private schools, with 201 (50.2% in the age bracket) enrolled. Conversely, the age group of 18 to 19 year olds has the lowest likelihood of being enrolled in a private school, with 109 (100.0% in the age bracket) attending a public institution.
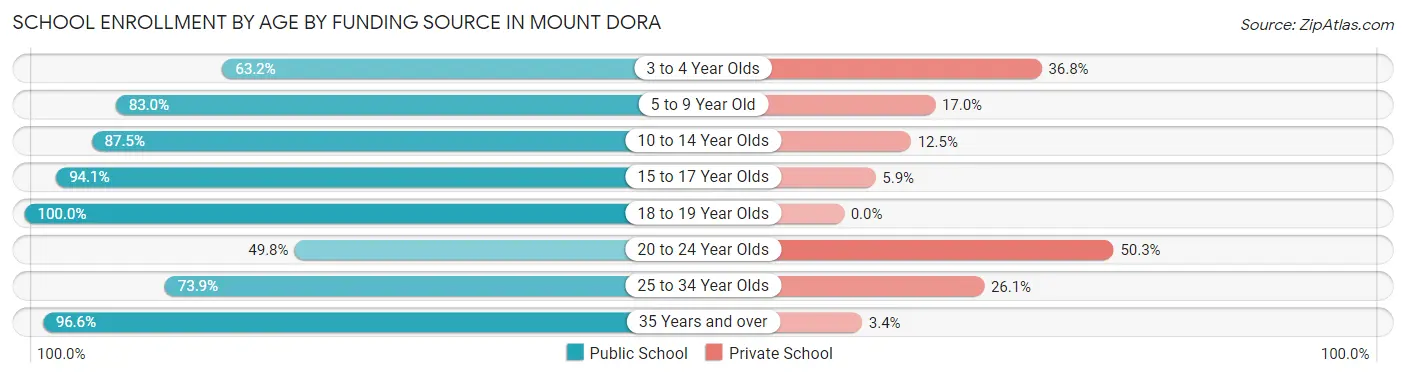
| Age Bracket | Public School | Private School |
| 3 to 4 Year Olds | 48 (63.2%) | 28 (36.8%) |
| 5 to 9 Year Old | 620 (83.0%) | 127 (17.0%) |
| 10 to 14 Year Olds | 771 (87.5%) | 110 (12.5%) |
| 15 to 17 Year Olds | 351 (94.1%) | 22 (5.9%) |
| 18 to 19 Year Olds | 109 (100.0%) | 0 (0.0%) |
| 20 to 24 Year Olds | 199 (49.7%) | 201 (50.2%) |
| 25 to 34 Year Olds | 82 (73.9%) | 29 (26.1%) |
| 35 Years and over | 342 (96.6%) | 12 (3.4%) |
| Total | 2,523 (82.7%) | 528 (17.3%) |
Educational Attainment by Field of Study in Mount Dora
Business (1,183 | 25.3%), education (775 | 16.6%), science & technology (579 | 12.4%), visual & performing arts (416 | 8.9%), and social sciences (377 | 8.1%) are the most common fields of study among 4,677 individuals in Mount Dora who have obtained a bachelor's degree or higher.
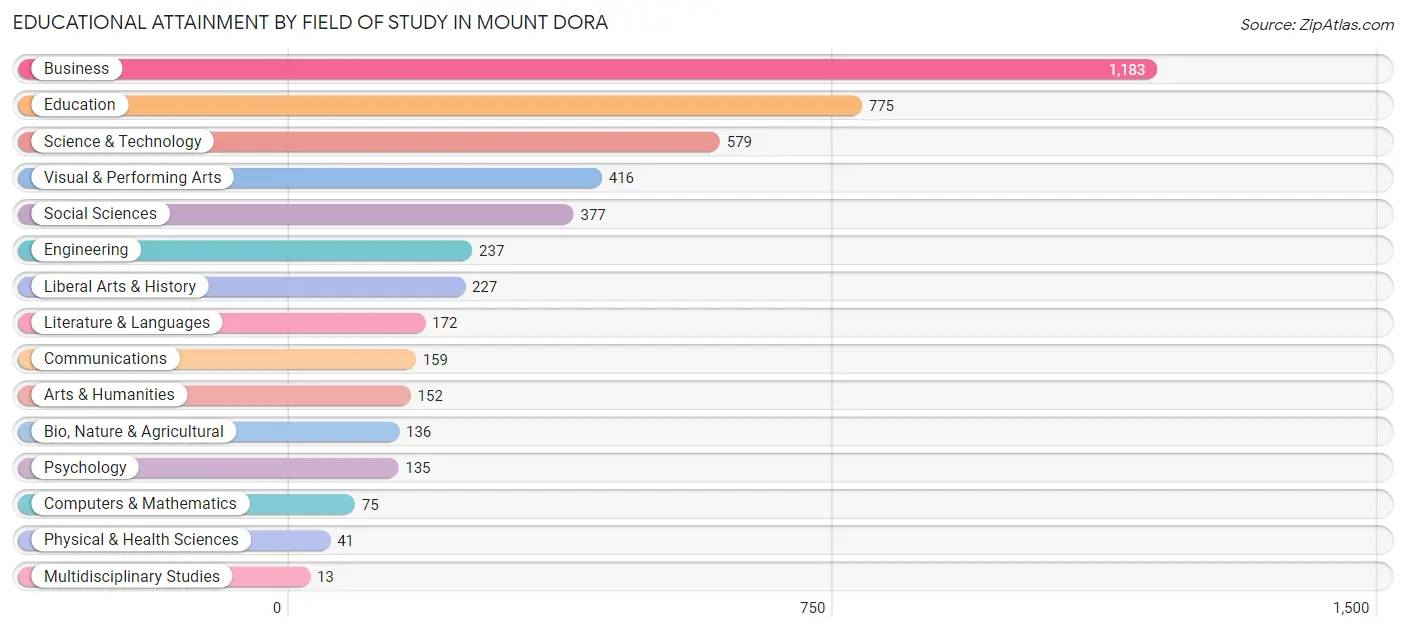
| Field of Study | # Graduates | % Graduates |
| Computers & Mathematics | 75 | 1.6% |
| Bio, Nature & Agricultural | 136 | 2.9% |
| Physical & Health Sciences | 41 | 0.9% |
| Psychology | 135 | 2.9% |
| Social Sciences | 377 | 8.1% |
| Engineering | 237 | 5.1% |
| Multidisciplinary Studies | 13 | 0.3% |
| Science & Technology | 579 | 12.4% |
| Business | 1,183 | 25.3% |
| Education | 775 | 16.6% |
| Literature & Languages | 172 | 3.7% |
| Liberal Arts & History | 227 | 4.9% |
| Visual & Performing Arts | 416 | 8.9% |
| Communications | 159 | 3.4% |
| Arts & Humanities | 152 | 3.3% |
| Total | 4,677 | 100.0% |
Transportation & Commute in Mount Dora
Vehicle Availability by Sex in Mount Dora
The most prevalent vehicle ownership categories in Mount Dora are males with 2 vehicles (1,572, accounting for 48.6%) and females with 2 vehicles (1,668, making up 49.0%).
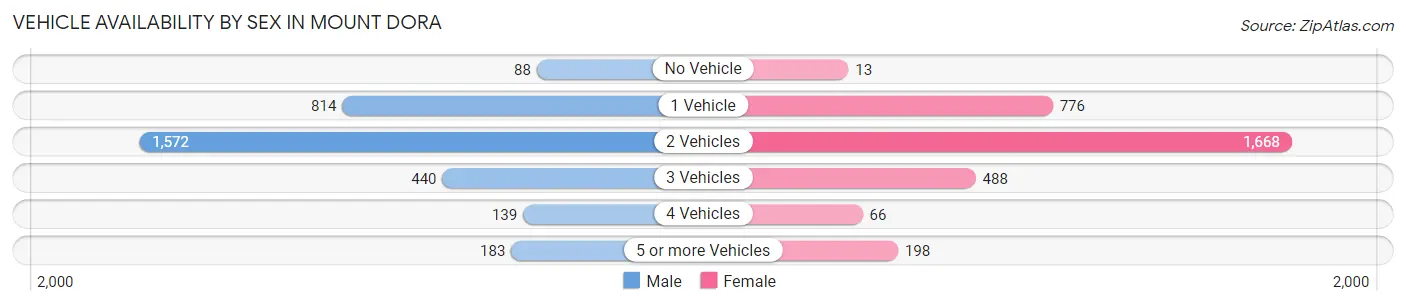
| Vehicles Available | Male | Female |
| No Vehicle | 88 (2.7%) | 13 (0.4%) |
| 1 Vehicle | 814 (25.2%) | 776 (24.2%) |
| 2 Vehicles | 1,572 (48.6%) | 1,668 (52.0%) |
| 3 Vehicles | 440 (13.6%) | 488 (15.2%) |
| 4 Vehicles | 139 (4.3%) | 66 (2.1%) |
| 5 or more Vehicles | 183 (5.7%) | 198 (6.2%) |
| Total | 3,236 (100.0%) | 3,209 (100.0%) |
Commute Time in Mount Dora
The most frequently occuring commute durations in Mount Dora are 10 to 14 minutes (878 commuters, 16.6%), 15 to 19 minutes (878 commuters, 16.6%), and 45 to 59 minutes (690 commuters, 13.1%).
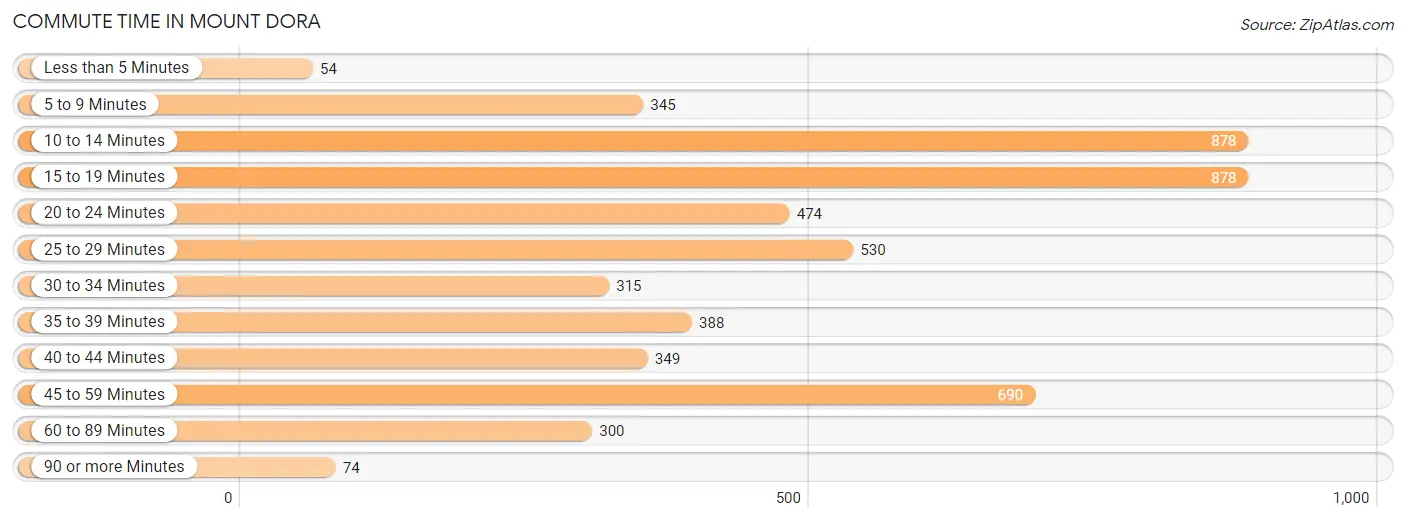
| Commute Time | # Commuters | % Commuters |
| Less than 5 Minutes | 54 | 1.0% |
| 5 to 9 Minutes | 345 | 6.5% |
| 10 to 14 Minutes | 878 | 16.6% |
| 15 to 19 Minutes | 878 | 16.6% |
| 20 to 24 Minutes | 474 | 9.0% |
| 25 to 29 Minutes | 530 | 10.1% |
| 30 to 34 Minutes | 315 | 6.0% |
| 35 to 39 Minutes | 388 | 7.4% |
| 40 to 44 Minutes | 349 | 6.6% |
| 45 to 59 Minutes | 690 | 13.1% |
| 60 to 89 Minutes | 300 | 5.7% |
| 90 or more Minutes | 74 | 1.4% |
Commute Time by Sex in Mount Dora
The most common commute times in Mount Dora are 45 to 59 minutes (519 commuters, 19.6%) for males and 10 to 14 minutes (548 commuters, 20.8%) for females.
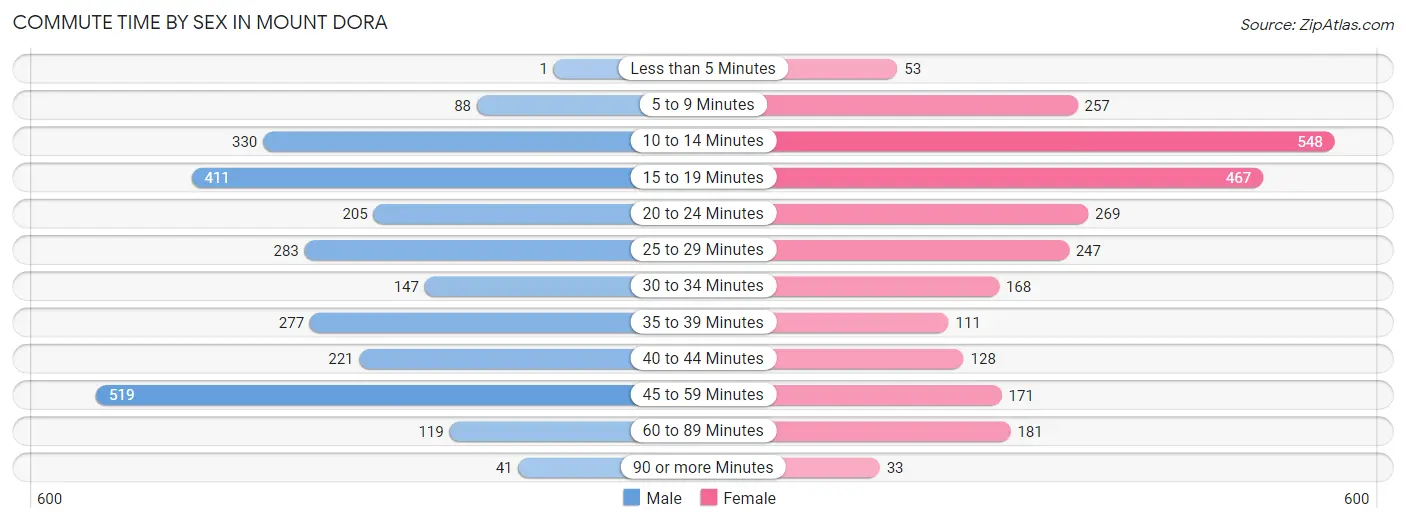
| Commute Time | Male | Female |
| Less than 5 Minutes | 1 (0.0%) | 53 (2.0%) |
| 5 to 9 Minutes | 88 (3.3%) | 257 (9.8%) |
| 10 to 14 Minutes | 330 (12.5%) | 548 (20.8%) |
| 15 to 19 Minutes | 411 (15.6%) | 467 (17.7%) |
| 20 to 24 Minutes | 205 (7.8%) | 269 (10.2%) |
| 25 to 29 Minutes | 283 (10.7%) | 247 (9.4%) |
| 30 to 34 Minutes | 147 (5.6%) | 168 (6.4%) |
| 35 to 39 Minutes | 277 (10.5%) | 111 (4.2%) |
| 40 to 44 Minutes | 221 (8.4%) | 128 (4.9%) |
| 45 to 59 Minutes | 519 (19.6%) | 171 (6.5%) |
| 60 to 89 Minutes | 119 (4.5%) | 181 (6.9%) |
| 90 or more Minutes | 41 (1.5%) | 33 (1.3%) |
Time of Departure to Work by Sex in Mount Dora
The most frequent times of departure to work in Mount Dora are 7:00 AM to 7:29 AM (407, 15.4%) for males and 7:00 AM to 7:29 AM (487, 18.5%) for females.
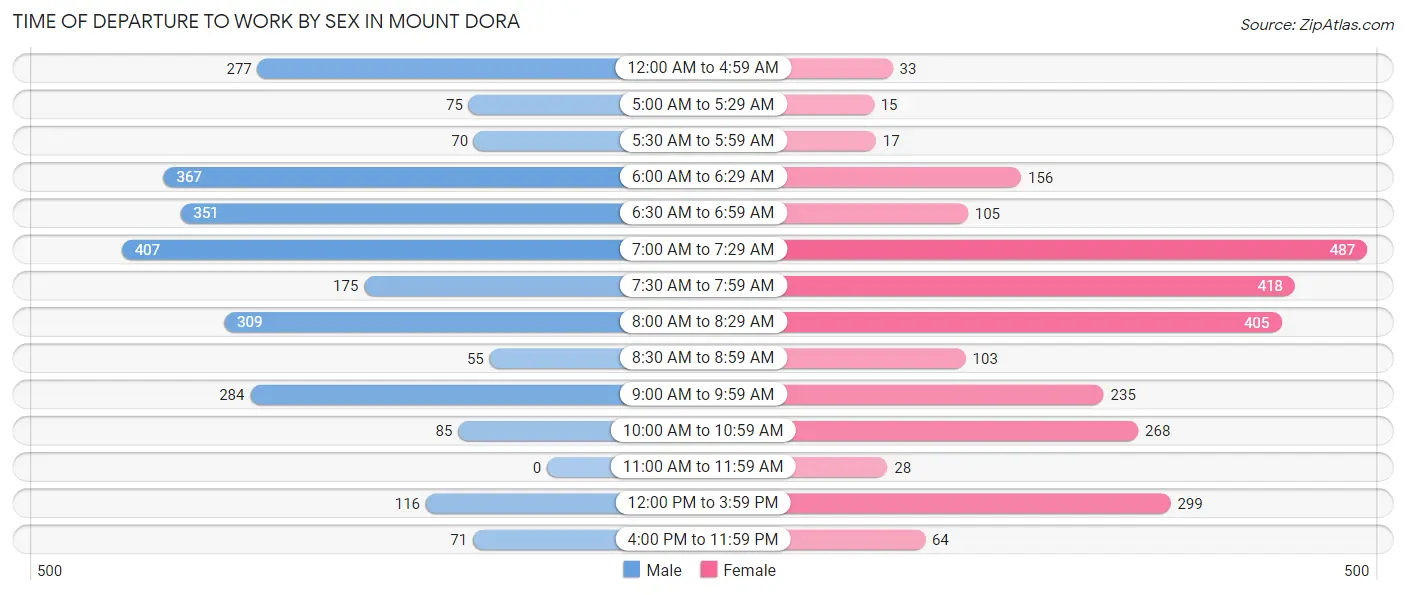
| Time of Departure | Male | Female |
| 12:00 AM to 4:59 AM | 277 (10.5%) | 33 (1.3%) |
| 5:00 AM to 5:29 AM | 75 (2.8%) | 15 (0.6%) |
| 5:30 AM to 5:59 AM | 70 (2.6%) | 17 (0.6%) |
| 6:00 AM to 6:29 AM | 367 (13.9%) | 156 (5.9%) |
| 6:30 AM to 6:59 AM | 351 (13.3%) | 105 (4.0%) |
| 7:00 AM to 7:29 AM | 407 (15.4%) | 487 (18.5%) |
| 7:30 AM to 7:59 AM | 175 (6.6%) | 418 (15.9%) |
| 8:00 AM to 8:29 AM | 309 (11.7%) | 405 (15.4%) |
| 8:30 AM to 8:59 AM | 55 (2.1%) | 103 (3.9%) |
| 9:00 AM to 9:59 AM | 284 (10.7%) | 235 (8.9%) |
| 10:00 AM to 10:59 AM | 85 (3.2%) | 268 (10.2%) |
| 11:00 AM to 11:59 AM | 0 (0.0%) | 28 (1.1%) |
| 12:00 PM to 3:59 PM | 116 (4.4%) | 299 (11.4%) |
| 4:00 PM to 11:59 PM | 71 (2.7%) | 64 (2.4%) |
| Total | 2,642 (100.0%) | 2,633 (100.0%) |
Housing Occupancy in Mount Dora
Occupancy by Ownership in Mount Dora
Of the total 7,022 dwellings in Mount Dora, owner-occupied units account for 4,405 (62.7%), while renter-occupied units make up 2,617 (37.3%).
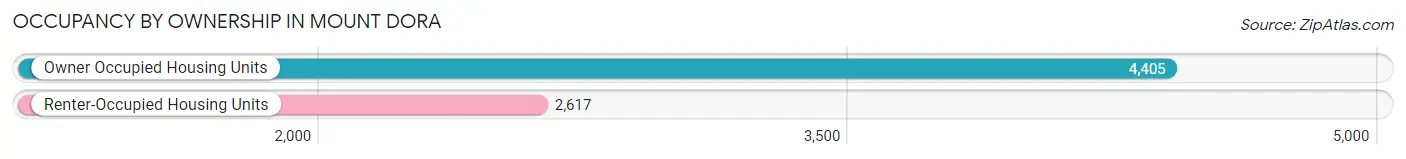
| Occupancy | # Housing Units | % Housing Units |
| Owner Occupied Housing Units | 4,405 | 62.7% |
| Renter-Occupied Housing Units | 2,617 | 37.3% |
| Total Occupied Housing Units | 7,022 | 100.0% |
Occupancy by Household Size in Mount Dora
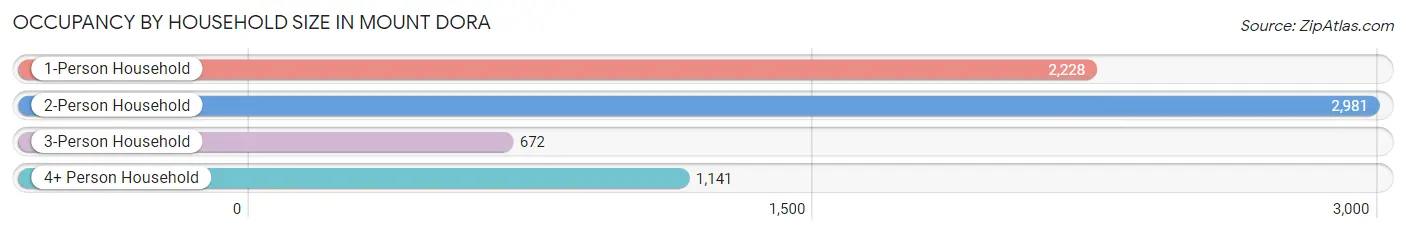
| Household Size | # Housing Units | % Housing Units |
| 1-Person Household | 2,228 | 31.7% |
| 2-Person Household | 2,981 | 42.4% |
| 3-Person Household | 672 | 9.6% |
| 4+ Person Household | 1,141 | 16.3% |
| Total Housing Units | 7,022 | 100.0% |
Occupancy by Ownership by Household Size in Mount Dora
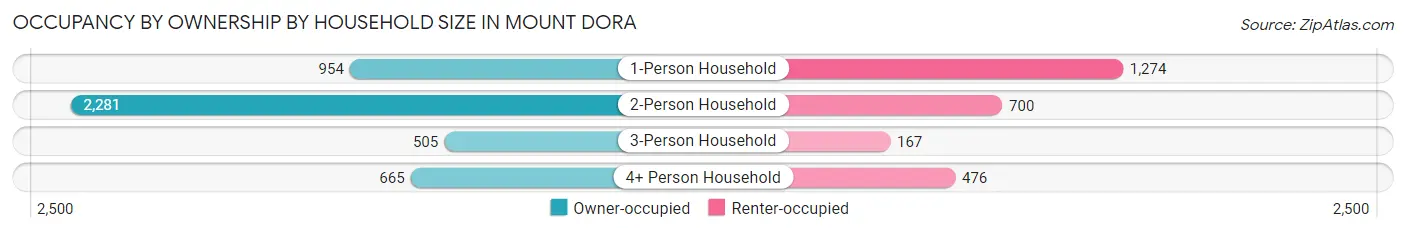
| Household Size | Owner-occupied | Renter-occupied |
| 1-Person Household | 954 (42.8%) | 1,274 (57.2%) |
| 2-Person Household | 2,281 (76.5%) | 700 (23.5%) |
| 3-Person Household | 505 (75.1%) | 167 (24.8%) |
| 4+ Person Household | 665 (58.3%) | 476 (41.7%) |
| Total Housing Units | 4,405 (62.7%) | 2,617 (37.3%) |
Occupancy by Educational Attainment in Mount Dora
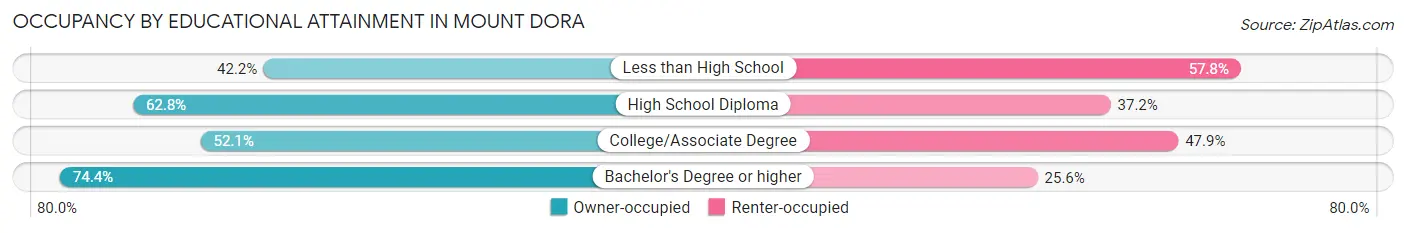
| Household Size | Owner-occupied | Renter-occupied |
| Less than High School | 183 (42.2%) | 251 (57.8%) |
| High School Diploma | 1,027 (62.8%) | 608 (37.2%) |
| College/Associate Degree | 1,144 (52.1%) | 1,052 (47.9%) |
| Bachelor's Degree or higher | 2,051 (74.4%) | 706 (25.6%) |
Occupancy by Age of Householder in Mount Dora
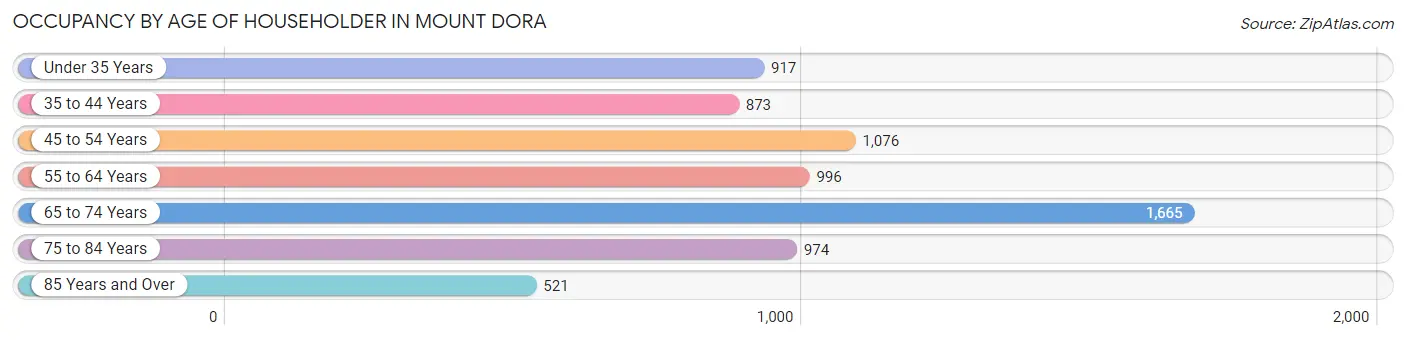
| Age Bracket | # Households | % Households |
| Under 35 Years | 917 | 13.1% |
| 35 to 44 Years | 873 | 12.4% |
| 45 to 54 Years | 1,076 | 15.3% |
| 55 to 64 Years | 996 | 14.2% |
| 65 to 74 Years | 1,665 | 23.7% |
| 75 to 84 Years | 974 | 13.9% |
| 85 Years and Over | 521 | 7.4% |
| Total | 7,022 | 100.0% |
Housing Finances in Mount Dora
Median Income by Occupancy in Mount Dora
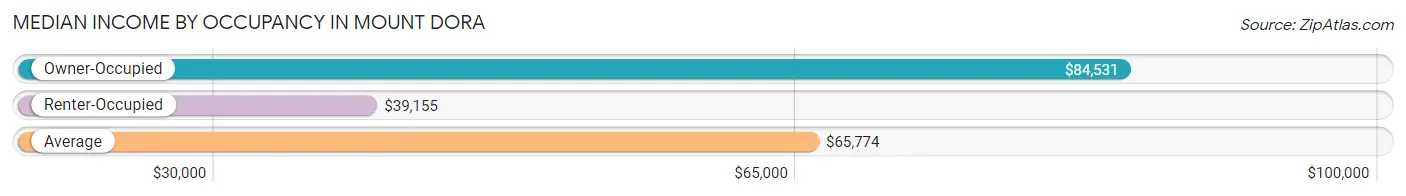
| Occupancy Type | # Households | Median Income |
| Owner-Occupied | 4,405 (62.7%) | $84,531 |
| Renter-Occupied | 2,617 (37.3%) | $39,155 |
| Average | 7,022 (100.0%) | $65,774 |
Occupancy by Householder Income Bracket in Mount Dora
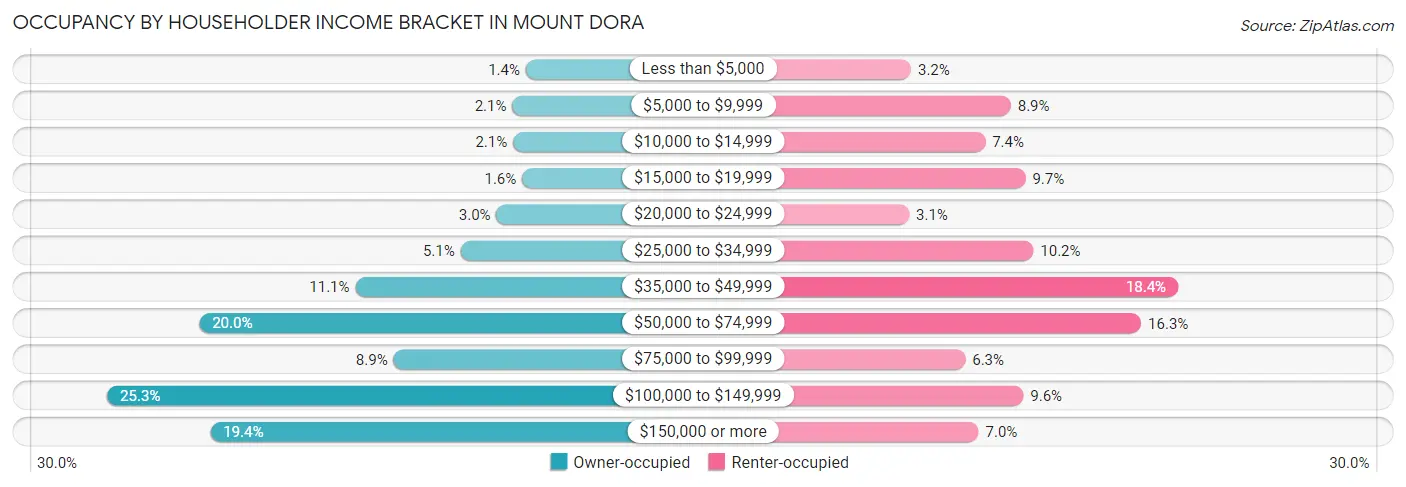
| Income Bracket | Owner-occupied | Renter-occupied |
| Less than $5,000 | 60 (1.4%) | 83 (3.2%) |
| $5,000 to $9,999 | 94 (2.1%) | 232 (8.9%) |
| $10,000 to $14,999 | 92 (2.1%) | 194 (7.4%) |
| $15,000 to $19,999 | 69 (1.6%) | 254 (9.7%) |
| $20,000 to $24,999 | 134 (3.0%) | 80 (3.1%) |
| $25,000 to $34,999 | 224 (5.1%) | 266 (10.2%) |
| $35,000 to $49,999 | 489 (11.1%) | 482 (18.4%) |
| $50,000 to $74,999 | 882 (20.0%) | 427 (16.3%) |
| $75,000 to $99,999 | 393 (8.9%) | 164 (6.3%) |
| $100,000 to $149,999 | 1,114 (25.3%) | 251 (9.6%) |
| $150,000 or more | 854 (19.4%) | 184 (7.0%) |
| Total | 4,405 (100.0%) | 2,617 (100.0%) |
Monthly Housing Cost Tiers in Mount Dora
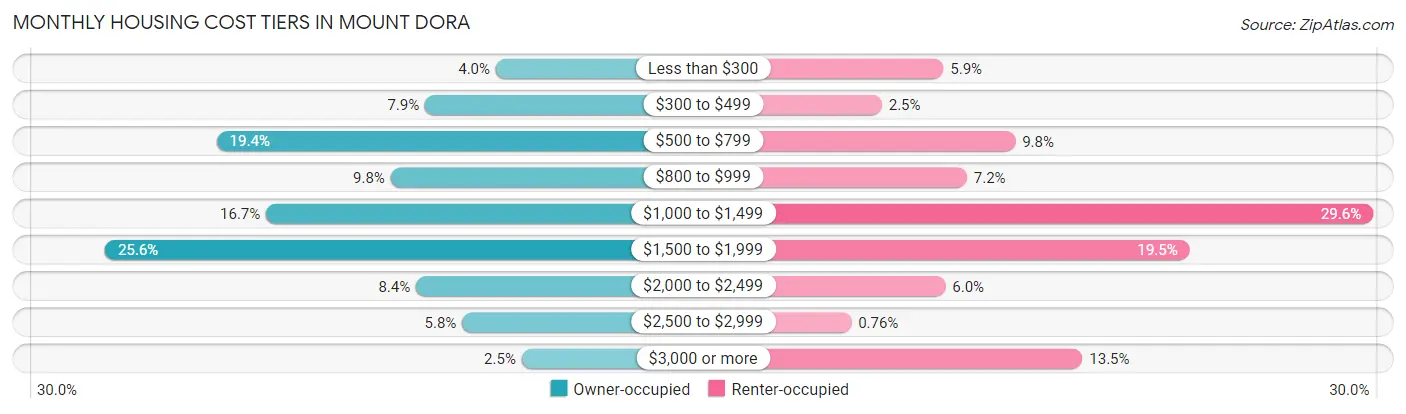
| Monthly Cost | Owner-occupied | Renter-occupied |
| Less than $300 | 175 (4.0%) | 153 (5.9%) |
| $300 to $499 | 347 (7.9%) | 64 (2.5%) |
| $500 to $799 | 854 (19.4%) | 257 (9.8%) |
| $800 to $999 | 431 (9.8%) | 187 (7.1%) |
| $1,000 to $1,499 | 734 (16.7%) | 774 (29.6%) |
| $1,500 to $1,999 | 1,126 (25.6%) | 509 (19.5%) |
| $2,000 to $2,499 | 369 (8.4%) | 156 (6.0%) |
| $2,500 to $2,999 | 257 (5.8%) | 20 (0.8%) |
| $3,000 or more | 112 (2.5%) | 354 (13.5%) |
| Total | 4,405 (100.0%) | 2,617 (100.0%) |
Physical Housing Characteristics in Mount Dora
Housing Structures in Mount Dora
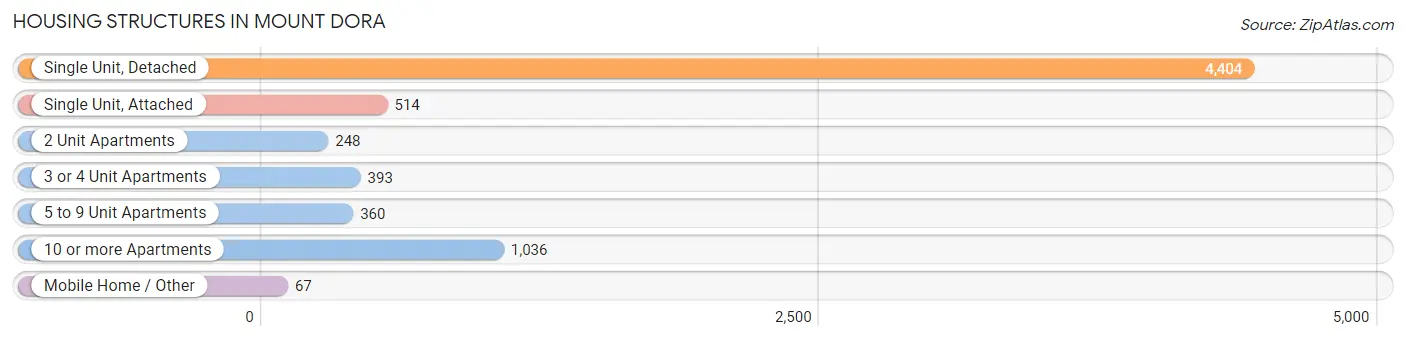
| Structure Type | # Housing Units | % Housing Units |
| Single Unit, Detached | 4,404 | 62.7% |
| Single Unit, Attached | 514 | 7.3% |
| 2 Unit Apartments | 248 | 3.5% |
| 3 or 4 Unit Apartments | 393 | 5.6% |
| 5 to 9 Unit Apartments | 360 | 5.1% |
| 10 or more Apartments | 1,036 | 14.7% |
| Mobile Home / Other | 67 | 0.9% |
| Total | 7,022 | 100.0% |
Housing Structures by Occupancy in Mount Dora
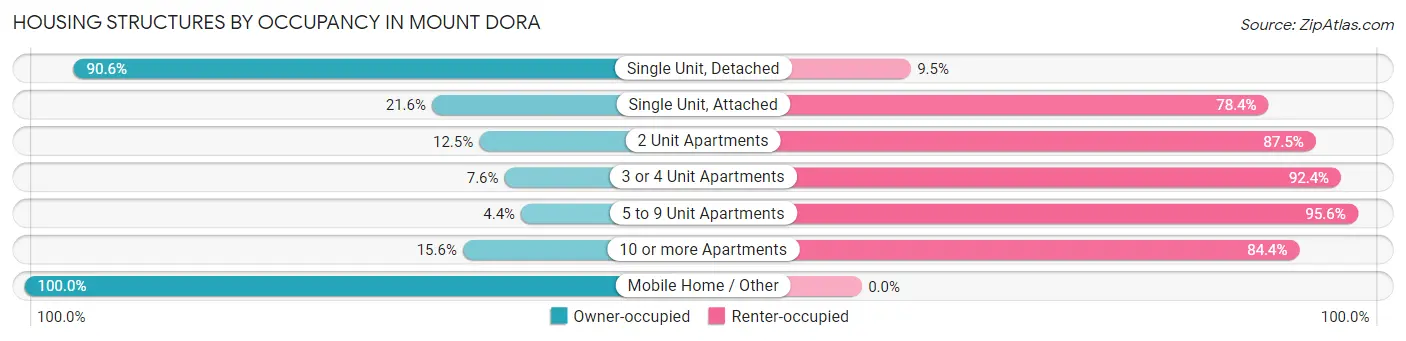
| Structure Type | Owner-occupied | Renter-occupied |
| Single Unit, Detached | 3,988 (90.5%) | 416 (9.5%) |
| Single Unit, Attached | 111 (21.6%) | 403 (78.4%) |
| 2 Unit Apartments | 31 (12.5%) | 217 (87.5%) |
| 3 or 4 Unit Apartments | 30 (7.6%) | 363 (92.4%) |
| 5 to 9 Unit Apartments | 16 (4.4%) | 344 (95.6%) |
| 10 or more Apartments | 162 (15.6%) | 874 (84.4%) |
| Mobile Home / Other | 67 (100.0%) | 0 (0.0%) |
| Total | 4,405 (62.7%) | 2,617 (37.3%) |
Housing Structures by Number of Rooms in Mount Dora
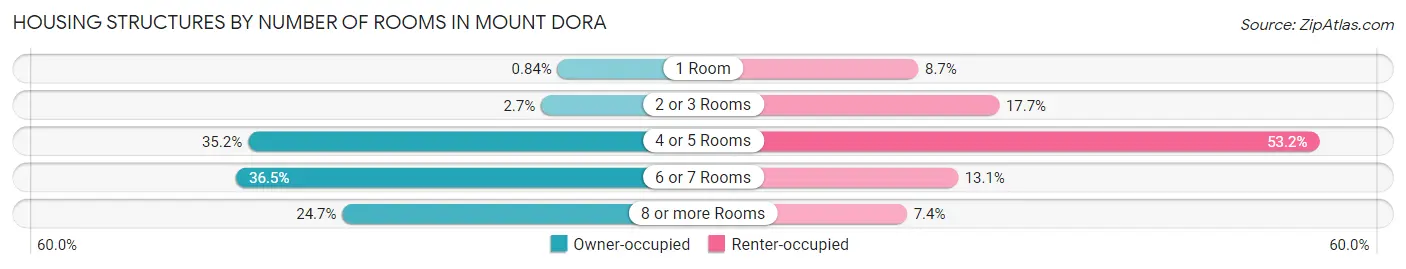
| Number of Rooms | Owner-occupied | Renter-occupied |
| 1 Room | 37 (0.8%) | 227 (8.7%) |
| 2 or 3 Rooms | 118 (2.7%) | 462 (17.6%) |
| 4 or 5 Rooms | 1,551 (35.2%) | 1,392 (53.2%) |
| 6 or 7 Rooms | 1,609 (36.5%) | 342 (13.1%) |
| 8 or more Rooms | 1,090 (24.7%) | 194 (7.4%) |
| Total | 4,405 (100.0%) | 2,617 (100.0%) |
Housing Structure by Heating Type in Mount Dora
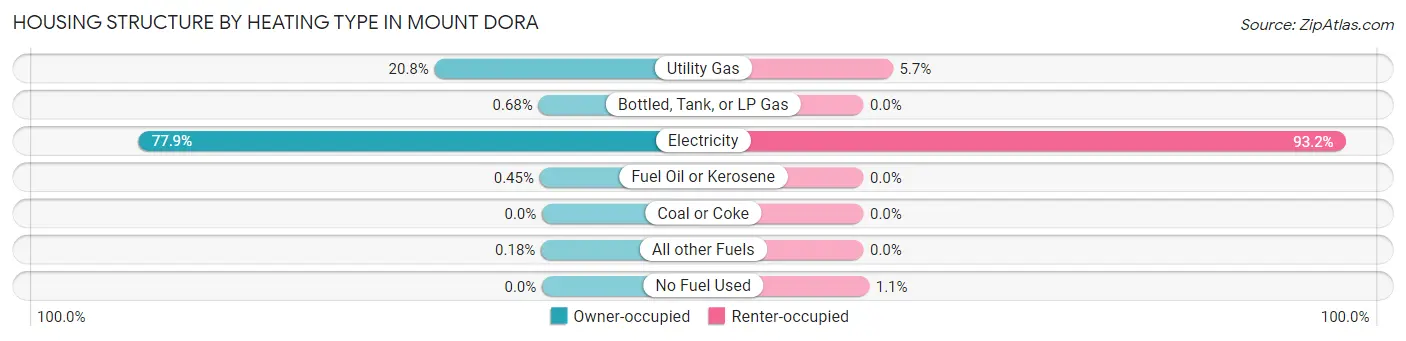
| Heating Type | Owner-occupied | Renter-occupied |
| Utility Gas | 915 (20.8%) | 149 (5.7%) |
| Bottled, Tank, or LP Gas | 30 (0.7%) | 0 (0.0%) |
| Electricity | 3,432 (77.9%) | 2,439 (93.2%) |
| Fuel Oil or Kerosene | 20 (0.4%) | 0 (0.0%) |
| Coal or Coke | 0 (0.0%) | 0 (0.0%) |
| All other Fuels | 8 (0.2%) | 0 (0.0%) |
| No Fuel Used | 0 (0.0%) | 29 (1.1%) |
| Total | 4,405 (100.0%) | 2,617 (100.0%) |
Household Vehicle Usage in Mount Dora
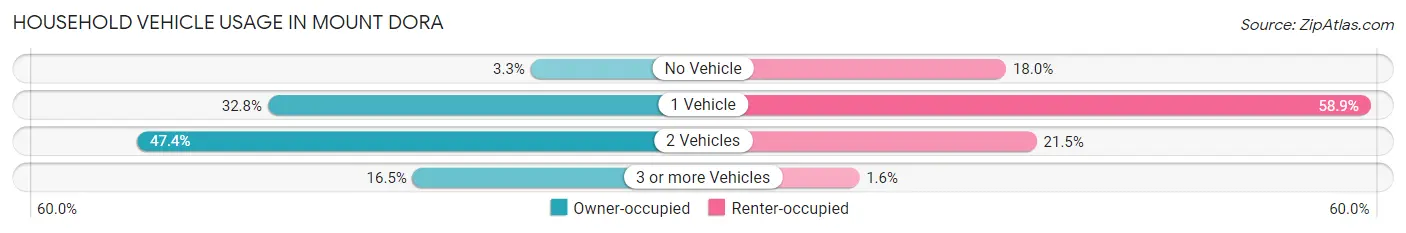
| Vehicles per Household | Owner-occupied | Renter-occupied |
| No Vehicle | 146 (3.3%) | 472 (18.0%) |
| 1 Vehicle | 1,443 (32.8%) | 1,541 (58.9%) |
| 2 Vehicles | 2,088 (47.4%) | 562 (21.5%) |
| 3 or more Vehicles | 728 (16.5%) | 42 (1.6%) |
| Total | 4,405 (100.0%) | 2,617 (100.0%) |
Real Estate & Mortgages in Mount Dora
Real Estate and Mortgage Overview in Mount Dora
| Characteristic | Without Mortgage | With Mortgage |
| Housing Units | 1,809 | 2,596 |
| Median Property Value | $286,200 | $320,000 |
| Median Household Income | $66,597 | $486 |
| Monthly Housing Costs | $638 | $112 |
| Real Estate Taxes | $2,596 | $29 |
Property Value by Mortgage Status in Mount Dora
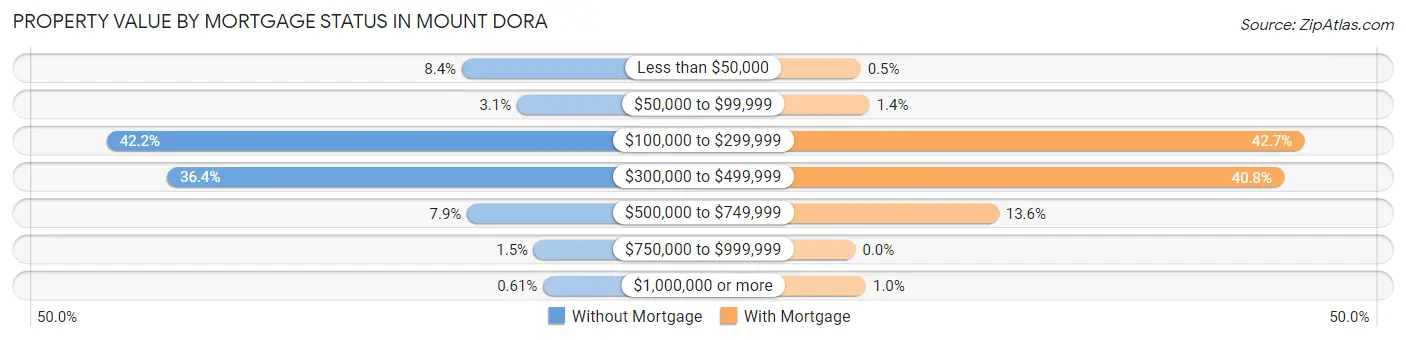
| Property Value | Without Mortgage | With Mortgage |
| Less than $50,000 | 151 (8.4%) | 13 (0.5%) |
| $50,000 to $99,999 | 56 (3.1%) | 35 (1.3%) |
| $100,000 to $299,999 | 763 (42.2%) | 1,109 (42.7%) |
| $300,000 to $499,999 | 659 (36.4%) | 1,059 (40.8%) |
| $500,000 to $749,999 | 142 (7.9%) | 354 (13.6%) |
| $750,000 to $999,999 | 27 (1.5%) | 0 (0.0%) |
| $1,000,000 or more | 11 (0.6%) | 26 (1.0%) |
| Total | 1,809 (100.0%) | 2,596 (100.0%) |
Household Income by Mortgage Status in Mount Dora
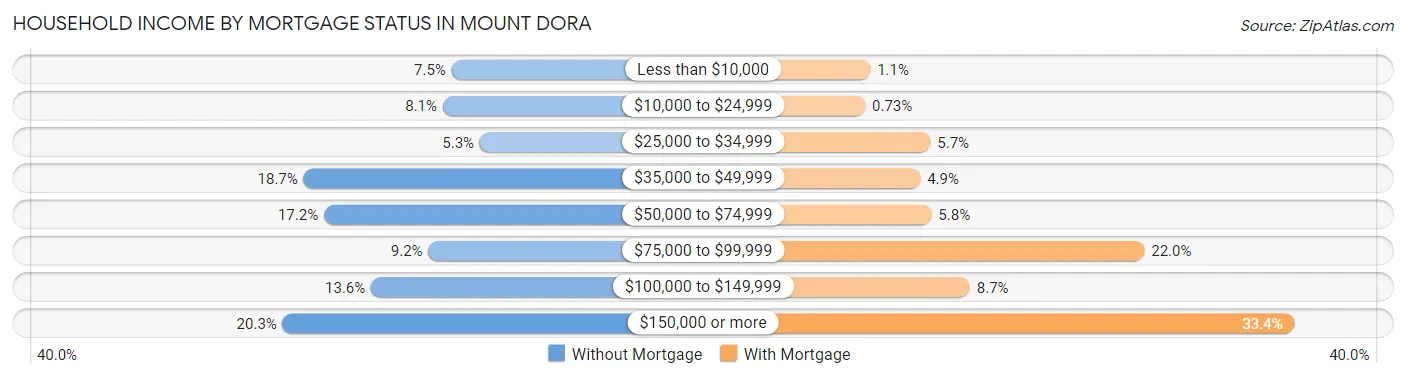
| Household Income | Without Mortgage | With Mortgage |
| Less than $10,000 | 135 (7.5%) | 29 (1.1%) |
| $10,000 to $24,999 | 147 (8.1%) | 19 (0.7%) |
| $25,000 to $34,999 | 96 (5.3%) | 148 (5.7%) |
| $35,000 to $49,999 | 339 (18.7%) | 128 (4.9%) |
| $50,000 to $74,999 | 311 (17.2%) | 150 (5.8%) |
| $75,000 to $99,999 | 167 (9.2%) | 571 (22.0%) |
| $100,000 to $149,999 | 246 (13.6%) | 226 (8.7%) |
| $150,000 or more | 368 (20.3%) | 868 (33.4%) |
| Total | 1,809 (100.0%) | 2,596 (100.0%) |
Property Value to Household Income Ratio in Mount Dora
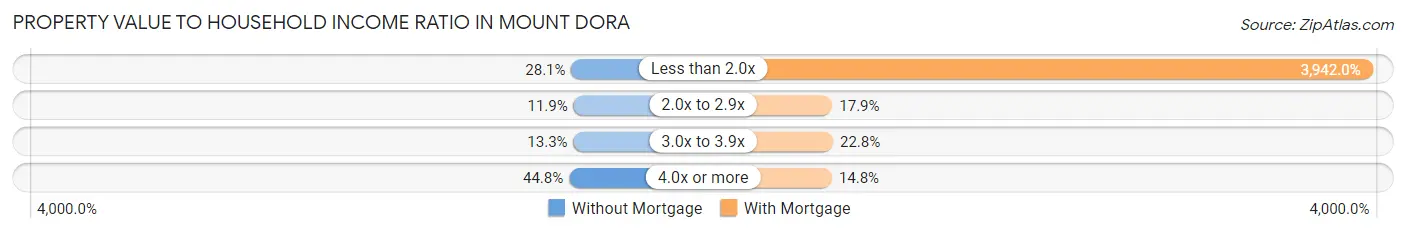
| Value-to-Income Ratio | Without Mortgage | With Mortgage |
| Less than 2.0x | 508 (28.1%) | 102,333 (3,941.9%) |
| 2.0x to 2.9x | 216 (11.9%) | 464 (17.9%) |
| 3.0x to 3.9x | 241 (13.3%) | 591 (22.8%) |
| 4.0x or more | 810 (44.8%) | 384 (14.8%) |
| Total | 1,809 (100.0%) | 2,596 (100.0%) |
Real Estate Taxes by Mortgage Status in Mount Dora
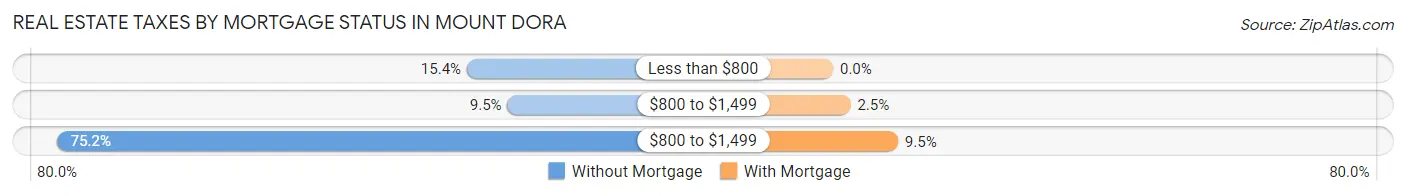
| Property Taxes | Without Mortgage | With Mortgage |
| Less than $800 | 278 (15.4%) | 0 (0.0%) |
| $800 to $1,499 | 171 (9.5%) | 66 (2.5%) |
| $800 to $1,499 | 1,360 (75.2%) | 246 (9.5%) |
| Total | 1,809 (100.0%) | 2,596 (100.0%) |
Health & Disability in Mount Dora
Health Insurance Coverage by Age in Mount Dora
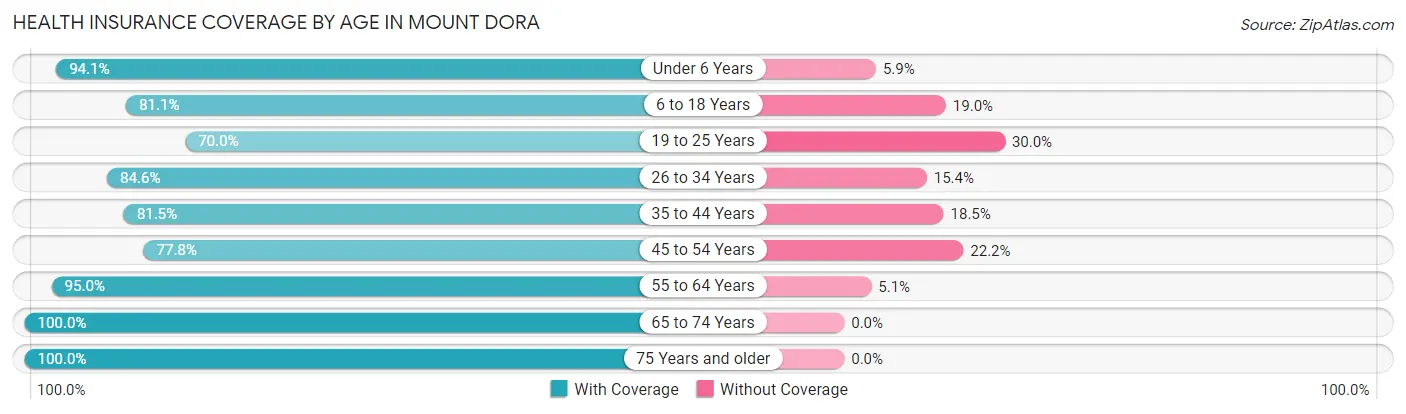
| Age Bracket | With Coverage | Without Coverage |
| Under 6 Years | 1,098 (94.1%) | 69 (5.9%) |
| 6 to 18 Years | 1,591 (81.0%) | 372 (19.0%) |
| 19 to 25 Years | 650 (70.0%) | 278 (30.0%) |
| 26 to 34 Years | 1,342 (84.6%) | 244 (15.4%) |
| 35 to 44 Years | 1,368 (81.5%) | 311 (18.5%) |
| 45 to 54 Years | 1,300 (77.8%) | 371 (22.2%) |
| 55 to 64 Years | 1,730 (95.0%) | 92 (5.1%) |
| 65 to 74 Years | 2,803 (100.0%) | 0 (0.0%) |
| 75 Years and older | 2,365 (100.0%) | 0 (0.0%) |
| Total | 14,247 (89.1%) | 1,737 (10.9%) |
Health Insurance Coverage by Citizenship Status in Mount Dora
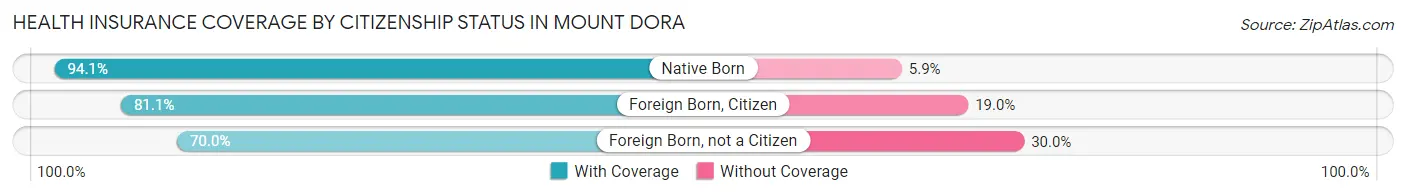
| Citizenship Status | With Coverage | Without Coverage |
| Native Born | 1,098 (94.1%) | 69 (5.9%) |
| Foreign Born, Citizen | 1,591 (81.0%) | 372 (19.0%) |
| Foreign Born, not a Citizen | 650 (70.0%) | 278 (30.0%) |
Health Insurance Coverage by Household Income in Mount Dora
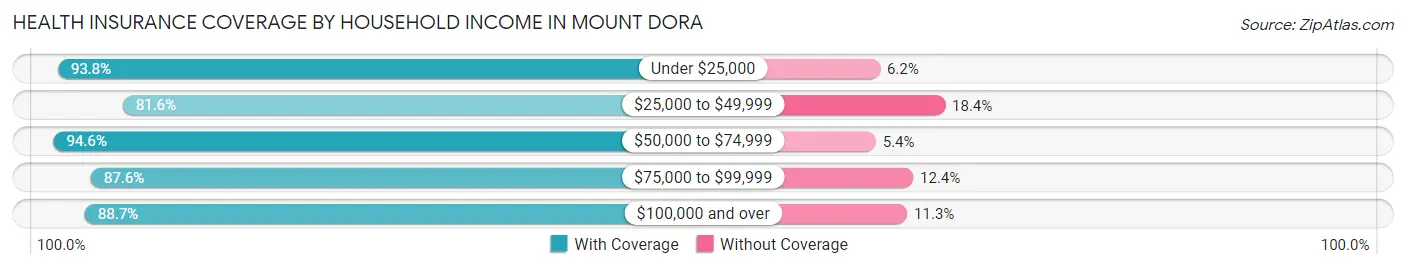
| Household Income | With Coverage | Without Coverage |
| Under $25,000 | 2,109 (93.8%) | 140 (6.2%) |
| $25,000 to $49,999 | 2,259 (81.6%) | 510 (18.4%) |
| $50,000 to $74,999 | 3,031 (94.6%) | 174 (5.4%) |
| $75,000 to $99,999 | 1,036 (87.6%) | 147 (12.4%) |
| $100,000 and over | 5,797 (88.7%) | 739 (11.3%) |
Public vs Private Health Insurance Coverage by Age in Mount Dora
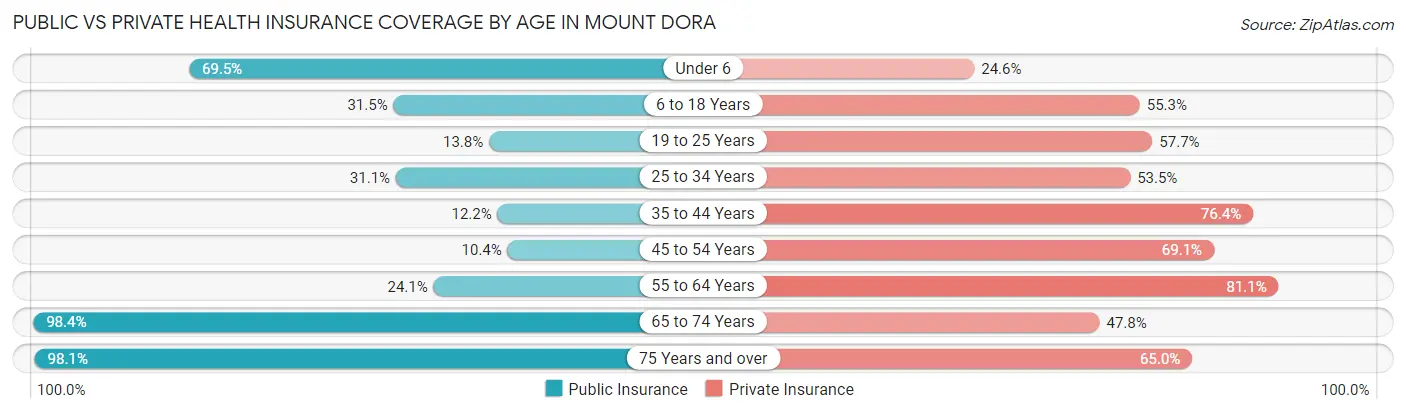
| Age Bracket | Public Insurance | Private Insurance |
| Under 6 | 811 (69.5%) | 287 (24.6%) |
| 6 to 18 Years | 619 (31.5%) | 1,086 (55.3%) |
| 19 to 25 Years | 128 (13.8%) | 535 (57.7%) |
| 25 to 34 Years | 493 (31.1%) | 849 (53.5%) |
| 35 to 44 Years | 205 (12.2%) | 1,282 (76.3%) |
| 45 to 54 Years | 173 (10.3%) | 1,154 (69.1%) |
| 55 to 64 Years | 439 (24.1%) | 1,477 (81.1%) |
| 65 to 74 Years | 2,758 (98.4%) | 1,341 (47.8%) |
| 75 Years and over | 2,321 (98.1%) | 1,538 (65.0%) |
| Total | 7,947 (49.7%) | 9,549 (59.7%) |
Disability Status by Sex by Age in Mount Dora
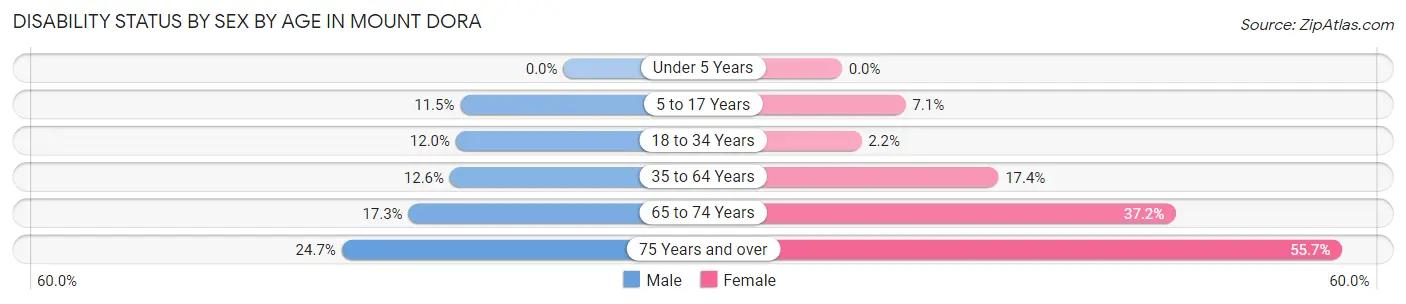
| Age Bracket | Male | Female |
| Under 5 Years | 0 (0.0%) | 0 (0.0%) |
| 5 to 17 Years | 134 (11.5%) | 71 (7.1%) |
| 18 to 34 Years | 148 (12.0%) | 30 (2.2%) |
| 35 to 64 Years | 301 (12.6%) | 486 (17.4%) |
| 65 to 74 Years | 212 (17.2%) | 586 (37.2%) |
| 75 Years and over | 237 (24.7%) | 783 (55.7%) |
Disability Class by Sex by Age in Mount Dora
Disability Class: Hearing Difficulty
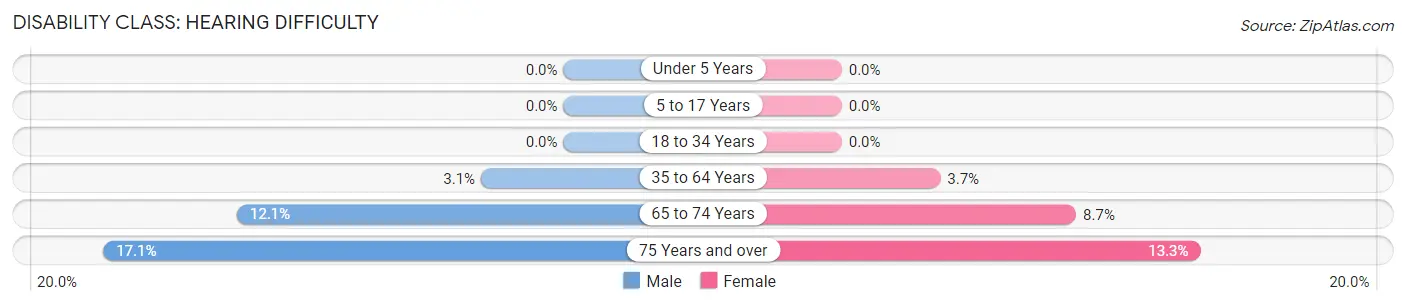
| Age Bracket | Male | Female |
| Under 5 Years | 0 (0.0%) | 0 (0.0%) |
| 5 to 17 Years | 0 (0.0%) | 0 (0.0%) |
| 18 to 34 Years | 0 (0.0%) | 0 (0.0%) |
| 35 to 64 Years | 73 (3.1%) | 102 (3.7%) |
| 65 to 74 Years | 149 (12.1%) | 137 (8.7%) |
| 75 Years and over | 164 (17.1%) | 187 (13.3%) |
Disability Class: Vision Difficulty
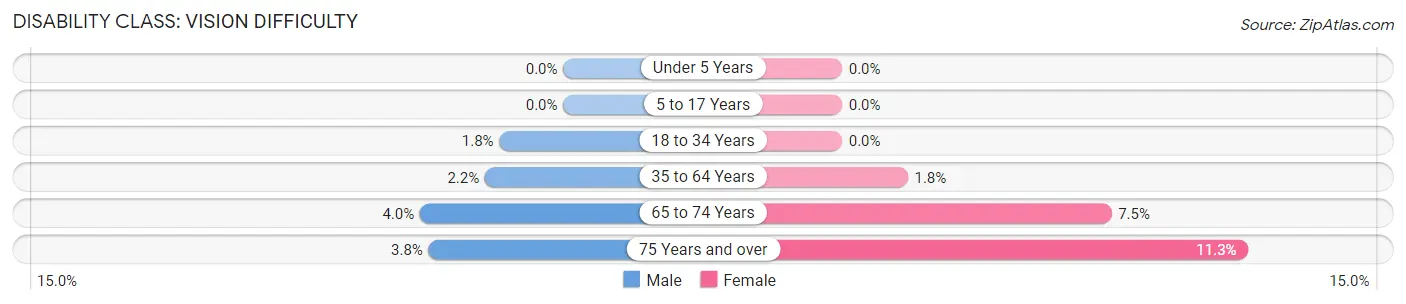
| Age Bracket | Male | Female |
| Under 5 Years | 0 (0.0%) | 0 (0.0%) |
| 5 to 17 Years | 0 (0.0%) | 0 (0.0%) |
| 18 to 34 Years | 22 (1.8%) | 0 (0.0%) |
| 35 to 64 Years | 52 (2.2%) | 51 (1.8%) |
| 65 to 74 Years | 49 (4.0%) | 118 (7.5%) |
| 75 Years and over | 36 (3.7%) | 159 (11.3%) |
Disability Class: Cognitive Difficulty
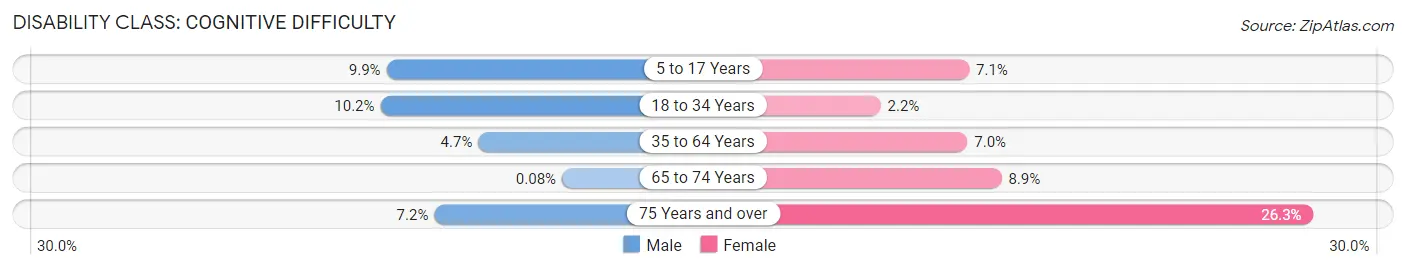
| Age Bracket | Male | Female |
| 5 to 17 Years | 115 (9.9%) | 71 (7.1%) |
| 18 to 34 Years | 126 (10.2%) | 30 (2.2%) |
| 35 to 64 Years | 113 (4.7%) | 195 (7.0%) |
| 65 to 74 Years | 1 (0.1%) | 140 (8.9%) |
| 75 Years and over | 69 (7.2%) | 369 (26.3%) |
Disability Class: Ambulatory Difficulty
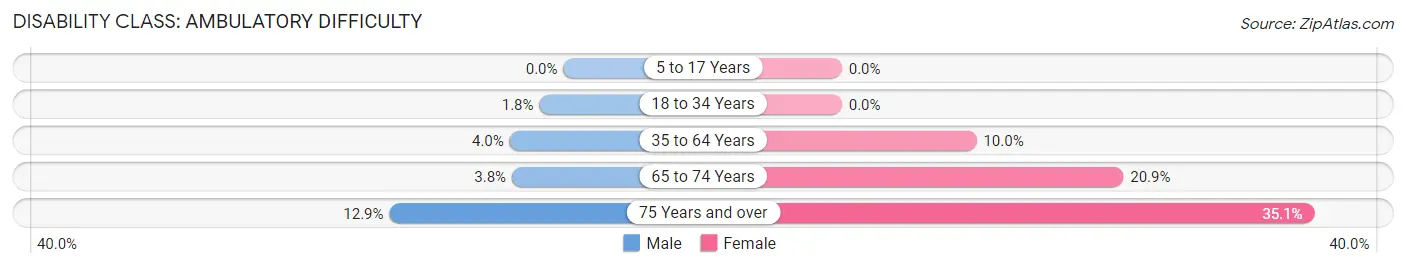
| Age Bracket | Male | Female |
| 5 to 17 Years | 0 (0.0%) | 0 (0.0%) |
| 18 to 34 Years | 22 (1.8%) | 0 (0.0%) |
| 35 to 64 Years | 95 (4.0%) | 279 (10.0%) |
| 65 to 74 Years | 47 (3.8%) | 329 (20.9%) |
| 75 Years and over | 124 (12.9%) | 493 (35.1%) |
Disability Class: Self-Care Difficulty
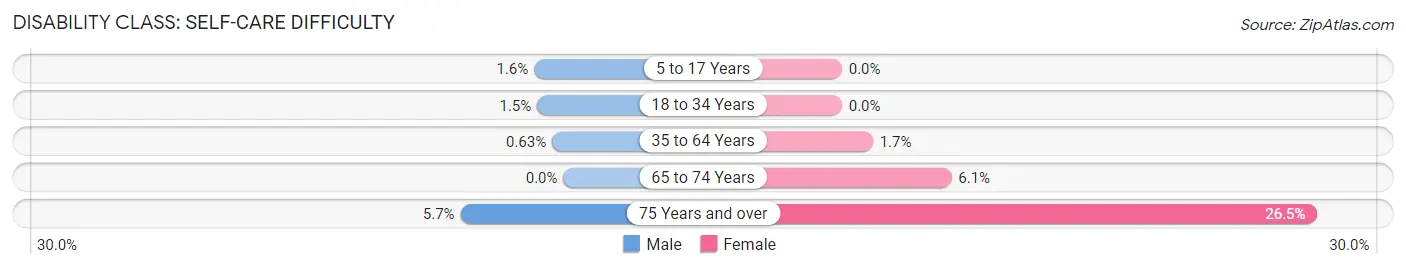
| Age Bracket | Male | Female |
| 5 to 17 Years | 19 (1.6%) | 0 (0.0%) |
| 18 to 34 Years | 18 (1.5%) | 0 (0.0%) |
| 35 to 64 Years | 15 (0.6%) | 48 (1.7%) |
| 65 to 74 Years | 0 (0.0%) | 96 (6.1%) |
| 75 Years and over | 55 (5.7%) | 372 (26.5%) |
Technology Access in Mount Dora
Computing Device Access in Mount Dora
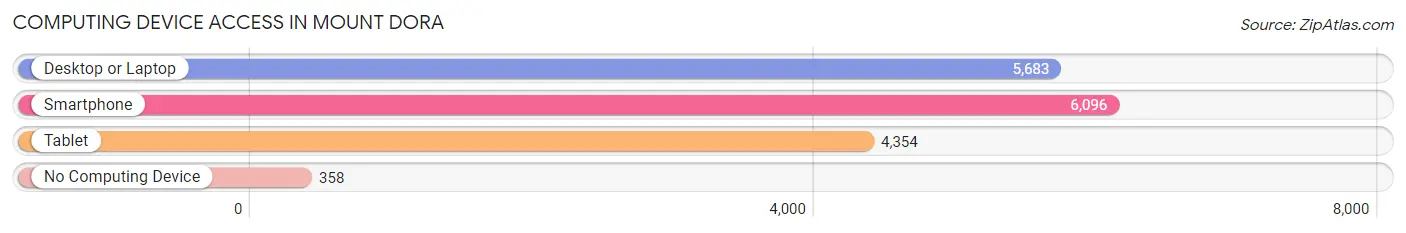
| Device Type | # Households | % Households |
| Desktop or Laptop | 5,683 | 80.9% |
| Smartphone | 6,096 | 86.8% |
| Tablet | 4,354 | 62.0% |
| No Computing Device | 358 | 5.1% |
| Total | 7,022 | 100.0% |
Internet Access in Mount Dora
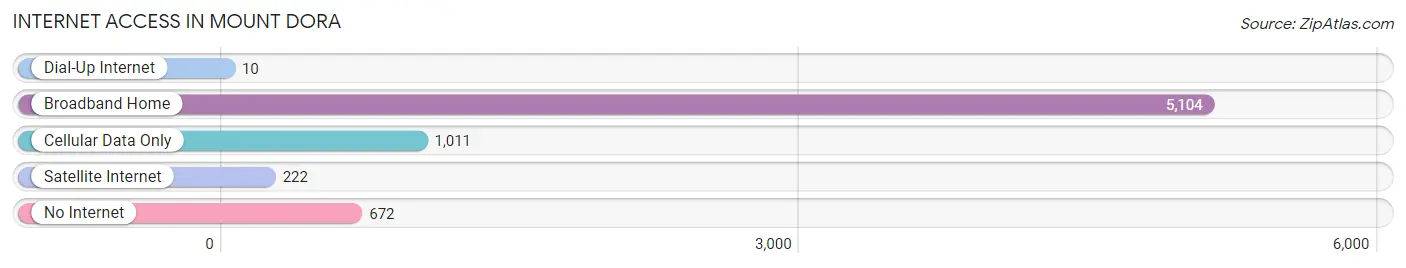
| Internet Type | # Households | % Households |
| Dial-Up Internet | 10 | 0.1% |
| Broadband Home | 5,104 | 72.7% |
| Cellular Data Only | 1,011 | 14.4% |
| Satellite Internet | 222 | 3.2% |
| No Internet | 672 | 9.6% |
| Total | 7,022 | 100.0% |
Mount Dora Summary
Mount Dora, Florida is a small city located in Lake County, Florida. It is situated on the northern shore of Lake Dora, which is part of the Harris Chain of Lakes. The city is known for its historic downtown area, which is home to many antique shops, restaurants, and other attractions. The city is also known for its annual festivals, such as the Mount Dora Arts Festival and the Mount Dora Craft Fair.
History
Mount Dora was founded in 1880 by Dr. John Stoughton Dennis, who named the city after his wife, Dora. The city was incorporated in 1910 and has since grown to a population of over 13,000. The city was originally a farming community, but has since become a popular tourist destination.
Geography
Mount Dora is located in central Florida, approximately 25 miles northwest of Orlando. The city is situated on the northern shore of Lake Dora, which is part of the Harris Chain of Lakes. The city is surrounded by rolling hills and is home to several parks, including Lake Dora Park, Gilbert Park, and Lake Eustis Park.
Economy
The economy of Mount Dora is largely based on tourism. The city is home to several attractions, such as the Mount Dora Historic Train Depot, the Mount Dora Museum of Art, and the Mount Dora Village Shopping Center. The city is also home to several festivals, such as the Mount Dora Arts Festival and the Mount Dora Craft Fair.
Demographics
As of the 2010 census, the population of Mount Dora was 13,037. The racial makeup of the city was 79.2% White, 14.2% African American, 0.4% Native American, 1.3% Asian, 0.1% Pacific Islander, 2.7% from other races, and 2.1% from two or more races. Hispanic or Latino of any race were 8.3% of the population.
The median income for a household in the city was $37,945, and the median income for a family was $45,945. The per capita income for the city was $22,945. About 11.2% of families and 14.2% of the population were below the poverty line, including 19.2% of those under age 18 and 8.2% of those age 65 or over.
Mount Dora is a small city with a rich history and a vibrant economy. The city is home to several attractions, festivals, and parks, making it a popular tourist destination. The city is also home to a diverse population, with a median income that is slightly higher than the national average.
Common Questions
What is Per Capita Income in Mount Dora?
Per Capita income in Mount Dora is $40,912.
What is the Median Family Income in Mount Dora?
Median Family Income in Mount Dora is $89,028.
What is the Median Household income in Mount Dora?
Median Household Income in Mount Dora is $65,774.
What is Income or Wage Gap in Mount Dora?
Income or Wage Gap in Mount Dora is 35.8%.
Women in Mount Dora earn 64.2 cents for every dollar earned by a man.
What is Inequality or Gini Index in Mount Dora?
Inequality or Gini Index in Mount Dora is 0.49.
What is the Total Population of Mount Dora?
Total Population of Mount Dora is 16,330.
What is the Total Male Population of Mount Dora?
Total Male Population of Mount Dora is 7,512.
What is the Total Female Population of Mount Dora?
Total Female Population of Mount Dora is 8,818.
What is the Ratio of Males per 100 Females in Mount Dora?
There are 85.19 Males per 100 Females in Mount Dora.
What is the Ratio of Females per 100 Males in Mount Dora?
There are 117.39 Females per 100 Males in Mount Dora.
What is the Median Population Age in Mount Dora?
Median Population Age in Mount Dora is 48.6 Years.
What is the Average Family Size in Mount Dora
Average Family Size in Mount Dora is 2.8 People.
What is the Average Household Size in Mount Dora
Average Household Size in Mount Dora is 2.3 People.
How Large is the Labor Force in Mount Dora?
There are 7,077 People in the Labor Forcein in Mount Dora.
What is the Percentage of People in the Labor Force in Mount Dora?
52.4% of People are in the Labor Force in Mount Dora.
What is the Unemployment Rate in Mount Dora?
Unemployment Rate in Mount Dora is 6.1%.