Zip Codes with the Highest Percentage of Population Employed in Accommodation & Food Services in Miami, FL

RELATED REPORTS & OPTIONS

Accommodation & Food Services
Population
Families and Households
Female Fertility
Female Fertility (Unmarried)
Race (Community Size)
Race (Percentage)
Ancestry (Community Size)
AfghanAfricanAlbanianAmericanApacheArabArgentineanArmenianAustralianAustrianBahamianBarbadianBasqueBelgianBelizeanBermudanBhutaneseBlackfeetBolivianBrazilianBritishBritish West IndianBulgarianBurmeseCanadianCelticCentral AmericanCentral American IndianCherokeeChickasawChileanChippewaChoctawColombianComancheCosta RicanCreekCroatianCubanCypriotCzechCzechoslovakianDanishDominicanDutchDutch West IndianEastern EuropeanEcuadorianEgyptianEnglishEstonianEthiopianEuropeanFilipinoFinnishFrenchFrench American IndianFrench CanadianGermanGreekGuamanian / ChamorroGuatemalanGuyaneseHaitianHonduranHungarianIcelanderIndian (Asian)IndonesianInupiatIranianIraqiIrishIroquoisIsraeliItalianJamaicanJapaneseJordanianKenyanKoreanLaotianLatvianLebaneseLithuanianMacedonianMalaysianMalteseMexicanMexican American IndianMongolianMoroccanNative HawaiianNavajoNew ZealanderNicaraguanNigerianNorthern EuropeanNorwegianPakistaniPalestinianPanamanianParaguayanPennsylvania GermanPeruvianPolishPortuguesePuerto RicanRomanianRussianSalvadoranSamoanScandinavianScotch-IrishScottishSeminoleSenegaleseSerbianSiouxSlavicSlovakSloveneSouth AfricanSouth AmericanSouth American IndianSpaniardSpanishSpanish AmericanSpanish American IndianSri LankanSubsaharan AfricanSudaneseSwedishSwissSyrianThaiTrinidadian and TobagonianTurkishU.S. Virgin IslanderUkrainianUruguayanVenezuelanVietnameseWelshWest IndianYugoslavianZimbabwean
Ancestry (Percentage)
AfghanAfricanAlbanianAmericanApacheArabArgentineanArmenianAustralianAustrianBahamianBarbadianBasqueBelgianBelizeanBermudanBhutaneseBlackfeetBolivianBrazilianBritishBritish West IndianBulgarianBurmeseCanadianCelticCentral AmericanCentral American IndianCherokeeChickasawChileanChippewaChoctawColombianComancheCosta RicanCreekCroatianCubanCypriotCzechCzechoslovakianDanishDominicanDutchDutch West IndianEastern EuropeanEcuadorianEgyptianEnglishEstonianEthiopianEuropeanFilipinoFinnishFrenchFrench American IndianFrench CanadianGermanGreekGuamanian / ChamorroGuatemalanGuyaneseHaitianHonduranHungarianIcelanderIndian (Asian)IndonesianInupiatIranianIraqiIrishIroquoisIsraeliItalianJamaicanJapaneseJordanianKenyanKoreanLaotianLatvianLebaneseLithuanianMacedonianMalaysianMalteseMexicanMexican American IndianMongolianMoroccanNative HawaiianNavajoNew ZealanderNicaraguanNigerianNorthern EuropeanNorwegianPakistaniPalestinianPanamanianParaguayanPennsylvania GermanPeruvianPolishPortuguesePuerto RicanRomanianRussianSalvadoranSamoanScandinavianScotch-IrishScottishSeminoleSenegaleseSerbianSiouxSlavicSlovakSloveneSouth AfricanSouth AmericanSouth American IndianSpaniardSpanishSpanish AmericanSpanish American IndianSri LankanSubsaharan AfricanSudaneseSwedishSwissSyrianThaiTrinidadian and TobagonianTurkishU.S. Virgin IslanderUkrainianUruguayanVenezuelanVietnameseWelshWest IndianYugoslavianZimbabwean
Immigrant Origin (Total)
AfghanistanAfricaAlbaniaArgentinaArmeniaAsiaAustraliaAustriaBahamasBangladeshBarbadosBelarusBelgiumBelizeBoliviaBosnia and HerzegovinaBrazilBulgariaBurma / MyanmarCambodiaCameroonCanadaCaribbeanCentral AmericaChileChinaColombiaCosta RicaCroatiaCubaCzechoslovakiaDenmarkDominicaDominican RepublicEastern AfricaEastern AsiaEastern EuropeEcuadorEgyptEl SalvadorEnglandEthiopiaEuropeFranceGermanyGreeceGrenadaGuatemalaGuyanaHaitiHondurasHong KongHungaryIndiaIndonesiaIranIraqIrelandIsraelItalyJamaicaJapanJordanKazakhstanKenyaKoreaKuwaitLaosLatin AmericaLatviaLebanonLithuaniaMalaysiaMexicoMiddle AfricaMoldovaMoroccoNepalNetherlandsNicaraguaNigeriaNorthern AfricaNorthern EuropeNorwayOceaniaPakistanPanamaPeruPhilippinesPolandPortugalRomaniaRussiaSaudi ArabiaScotlandSerbiaSingaporeSouth AfricaSouth AmericaSouth Central AsiaSouth Eastern AsiaSouthern EuropeSpainSri LankaSt. Vincent and the GrenadinesSudanSwedenSwitzerlandSyriaTaiwanThailandTrinidad and TobagoTurkeyUgandaUkraineUruguayUzbekistanVenezuelaVietnamWest IndiesWestern AfricaWestern AsiaWestern EuropeZaireZimbabwe
Immigrant Origin (Percentage)
AfghanistanAfricaAlbaniaArgentinaArmeniaAsiaAustraliaAustriaBahamasBangladeshBarbadosBelarusBelgiumBelizeBoliviaBosnia and HerzegovinaBrazilBulgariaBurma / MyanmarCambodiaCameroonCanadaCaribbeanCentral AmericaChileChinaColombiaCosta RicaCroatiaCubaCzechoslovakiaDenmarkDominicaDominican RepublicEastern AfricaEastern AsiaEastern EuropeEcuadorEgyptEl SalvadorEnglandEthiopiaEuropeFranceGermanyGreeceGrenadaGuatemalaGuyanaHaitiHondurasHong KongHungaryIndiaIndonesiaIranIraqIrelandIsraelItalyJamaicaJapanJordanKazakhstanKenyaKoreaKuwaitLaosLatin AmericaLatviaLebanonLithuaniaMalaysiaMexicoMiddle AfricaMoldovaMoroccoNepalNetherlandsNicaraguaNigeriaNorthern AfricaNorthern EuropeNorwayOceaniaPakistanPanamaPeruPhilippinesPolandPortugalRomaniaRussiaSaudi ArabiaScotlandSerbiaSingaporeSouth AfricaSouth AmericaSouth Central AsiaSouth Eastern AsiaSouthern EuropeSpainSri LankaSt. Vincent and the GrenadinesSudanSwedenSwitzerlandSyriaTaiwanThailandTrinidad and TobagoTurkeyUgandaUkraineUruguayUzbekistanVenezuelaVietnamWest IndiesWestern AfricaWestern AsiaWestern EuropeZaireZimbabwe
Income
Income (Families)
Income (Households)
Poverty
Poverty (Families)
Unemployment
Employment Occupations
Employment Industries
Employer Class
Commute Time
Commute Means
School Enrollment
Education by Degree Field
Occupancy
Finances
Physical Characteristics
Miami
States
Florida Cities
Altamonte SpringsApopkaArcadiaBoca RatonBonita SpringsBoynton BeachBradentonBrandonBrooksvilleCape CoralCasselberryClearwaterClermontCocoaCoral SpringsCrestviewCrystal RiverDade CityDavenportDaytona BeachDeerfield BeachDefuniak SpringsDelandDelray BeachDeltonaDunnellonEdgewaterEnglewoodEustisFort LauderdaleFort MyersFort PierceFort Walton BeachGainesvilleGulf BreezeHialeahHolidayHollywoodHomesteadHomosassaHudsonInvernessJacksonvilleJupiterKissimmeeLake CityLake WalesLake WorthLakelandLand O LakesLargoLeesburgLehigh AcresLive OakLongwoodLutzMariannaMelbourneMerritt IslandMiamiMiami BeachMiltonNaplesNew Port RicheyNew Smyrna BeachNorth Fort MyersNorth PortOcalaOkeechobeeOpa LockaOrange ParkOrlandoOrmond BeachOviedoPalm BayPalm Beach GardensPalm CoastPalm HarborPanama CityPanama City BeachPensacolaPerryPinellas ParkPlant CityPompano BeachPort CharlottePort OrangePort Saint LuciePunta GordaQuincyRiverviewSaint AugustineSaint CloudSaint PetersburgSanfordSarasotaSebastianSebringSeminoleSpring HillStuartTallahasseeTampaTarpon SpringsThe VillagesTitusvilleValricoVeniceVero BeachWesley ChapelWest Palm BeachWinter HavenWinter ParkZephyrhills
Compare Zip Codes
Comparison Subject

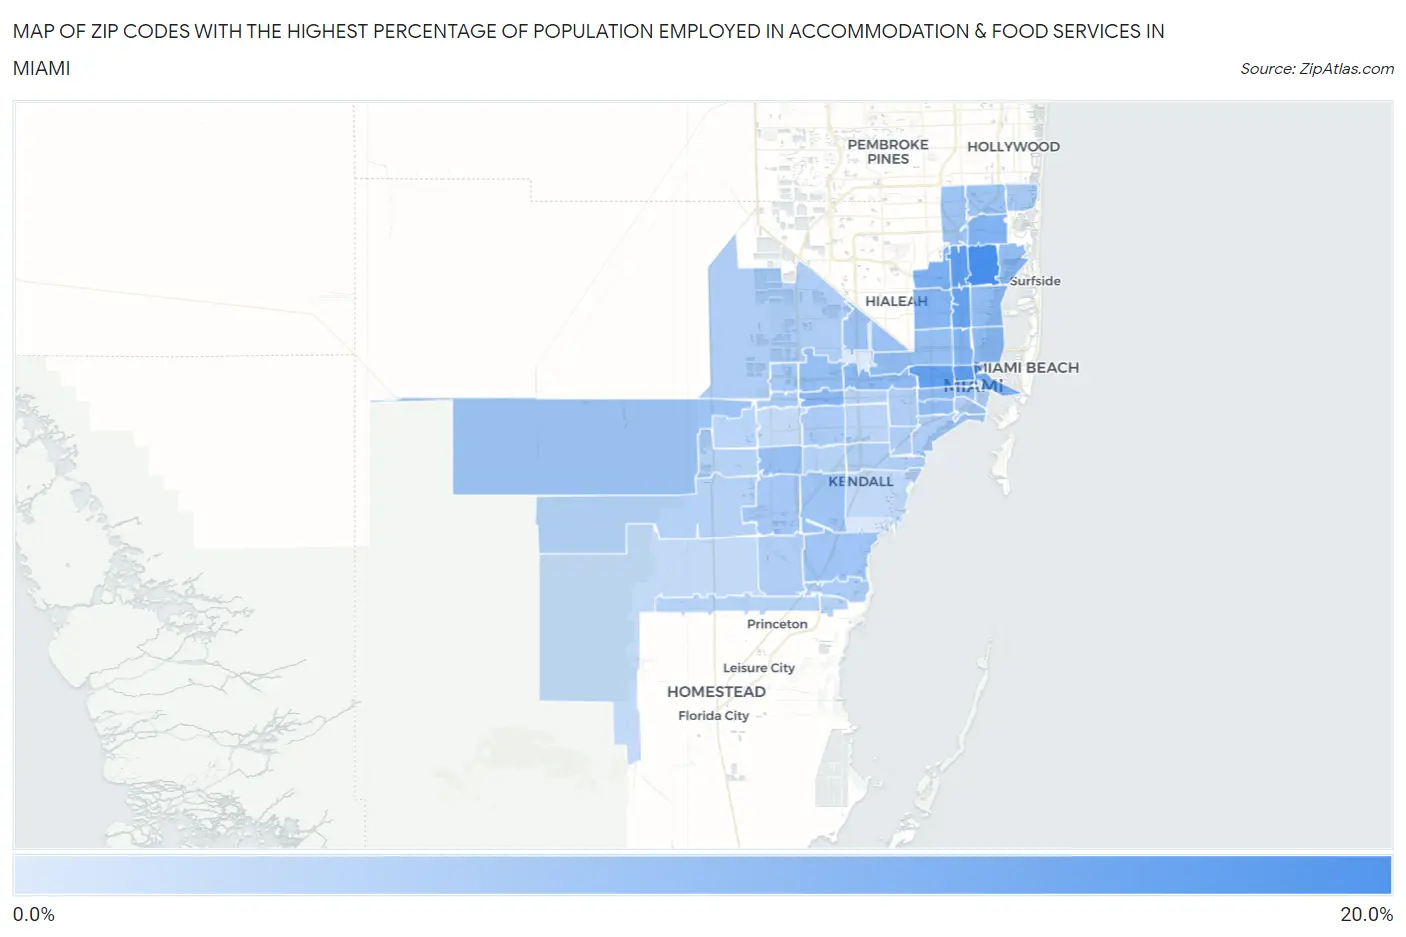
Map of Zip Codes with the Highest Percentage of Population Employed in Accommodation & Food Services in Miami

0.0%
20.0%
Zip Codes with the Highest Percentage of Population Employed in Accommodation & Food Services in Miami Map

Zip Codes with the Highest Percentage of Population Employed in Accommodation & Food Services in Miami, FL

Zip Code % Employed vs State vs National
1.3316117.9%8.4%(+9.54)#266.9%(+11.0)#1,112
2.3316815.2%8.4%(+6.82)#576.9%(+8.31)#1,626
3.3313614.8%8.4%(+6.42)#646.9%(+7.90)#1,733
4.3312514.6%8.4%(+6.26)#696.9%(+7.75)#1,782
5.3315013.9%8.4%(+5.57)#786.9%(+7.06)#1,993
6.3316711.6%8.4%(+3.24)#1526.9%(+4.73)#3,090
7.3313211.4%8.4%(+3.08)#1606.9%(+4.57)#3,196
8.3316211.1%8.4%(+2.76)#1746.9%(+4.25)#3,446
9.3312711.0%8.4%(+2.64)#1826.9%(+4.13)#3,546
10.3314710.8%8.4%(+2.42)#1916.9%(+3.91)#3,728
11.3312810.7%8.4%(+2.37)#1946.9%(+3.86)#3,768
12.3317410.2%8.4%(+1.79)#2396.9%(+3.28)#4,346
13.331269.7%8.4%(+1.31)#2906.9%(+2.80)#4,953
14.331379.6%8.4%(+1.23)#2986.9%(+2.72)#5,075
15.331359.4%8.4%(+0.999)#3166.9%(+2.49)#5,397
16.331459.4%8.4%(+0.984)#3206.9%(+2.47)#5,419
17.331819.1%8.4%(+0.749)#3386.9%(+2.24)#5,775
18.331389.1%8.4%(+0.698)#3416.9%(+2.19)#5,857
19.331429.0%8.4%(+0.599)#3456.9%(+2.09)#6,010
20.331728.9%8.4%(+0.540)#3526.9%(+2.03)#6,109
21.331838.7%8.4%(+0.303)#3846.9%(+1.79)#6,520
22.331668.5%8.4%(+0.095)#4076.9%(+1.58)#6,879
23.331308.2%8.4%(-0.169)#4426.9%(+1.32)#7,410
24.331697.9%8.4%(-0.436)#4676.9%(+1.05)#7,959
25.331767.8%8.4%(-0.534)#4786.9%(+0.955)#8,184
26.331797.8%8.4%(-0.579)#4806.9%(+0.911)#8,277
27.331947.7%8.4%(-0.641)#4926.9%(+0.848)#8,419
28.331577.6%8.4%(-0.810)#5076.9%(+0.680)#8,831
29.331827.0%8.4%(-1.39)#5736.9%(+0.096)#10,388
30.331867.0%8.4%(-1.39)#5746.9%(+0.094)#10,395
31.331806.8%8.4%(-1.52)#5946.9%(-0.034)#10,735
32.331846.6%8.4%(-1.77)#6246.9%(-0.280)#11,520
33.331656.6%8.4%(-1.79)#6256.9%(-0.301)#11,578
34.331336.3%8.4%(-2.02)#6556.9%(-0.533)#12,331
35.331896.3%8.4%(-2.06)#6626.9%(-0.569)#12,442
36.331296.3%8.4%(-2.10)#6656.9%(-0.607)#12,564
37.331776.2%8.4%(-2.19)#6766.9%(-0.696)#12,849
38.331346.1%8.4%(-2.22)#6836.9%(-0.734)#12,976
39.331466.1%8.4%(-2.26)#6856.9%(-0.770)#13,098
40.331436.1%8.4%(-2.28)#6876.9%(-0.795)#13,188
41.331786.0%8.4%(-2.38)#7006.9%(-0.888)#13,464
42.331965.4%8.4%(-2.96)#7556.9%(-1.47)#15,381
43.331935.4%8.4%(-3.00)#7606.9%(-1.51)#15,501
44.331735.4%8.4%(-3.01)#7626.9%(-1.52)#15,546
45.331445.3%8.4%(-3.02)#7636.9%(-1.53)#15,593
46.331705.3%8.4%(-3.07)#7716.9%(-1.58)#15,791
47.331905.0%8.4%(-3.39)#8016.9%(-1.90)#16,897
48.331854.9%8.4%(-3.51)#8126.9%(-2.02)#17,278
49.331554.7%8.4%(-3.63)#8206.9%(-2.14)#17,676
50.331314.7%8.4%(-3.63)#8216.9%(-2.14)#17,688
51.331564.2%8.4%(-4.22)#8556.9%(-2.73)#19,653
52.331874.0%8.4%(-4.40)#8656.9%(-2.91)#20,242
53.331753.9%8.4%(-4.46)#8716.9%(-2.97)#20,453
54.331581.6%8.4%(-6.77)#9296.9%(-5.28)#26,293
55.331221.2%8.4%(-7.16)#9356.9%(-5.67)#26,963

Common Questions

What are the Top 10 Zip Codes with the Highest Percentage of Population Employed in Accommodation & Food Services in Miami, FL?
Top 10 Zip Codes with the Highest Percentage of Population Employed in Accommodation & Food Services in Miami, FL are:
#1
17.9%
#2
15.2%
#3
14.8%
#4
14.6%
#5
13.9%
#6
11.6%
#7
11.4%
#8
11.1%
#9
11.0%
#10
10.8%
What zip code has the Highest Percentage of Population Employed in Accommodation & Food Services in Miami, FL?
33161 has the Highest Percentage of Population Employed in Accommodation & Food Services in Miami, FL with 17.9%.
What is the Percentage of Population Employed in Accommodation & Food Services in Miami, FL?
Percentage of Population Employed in Accommodation & Food Services in Miami is 9.8%.
What is the Percentage of Population Employed in Accommodation & Food Services in Florida?
Percentage of Population Employed in Accommodation & Food Services in Florida is 8.4%.
What is the Percentage of Population Employed in Accommodation & Food Services in the United States?
Percentage of Population Employed in Accommodation & Food Services in the United States is 6.9%.