Zip Codes with the Most Immigrants from El Salvador in Miami, FL
RELATED REPORTS & OPTIONS
El Salvador
Miami
Compare Zip Codes
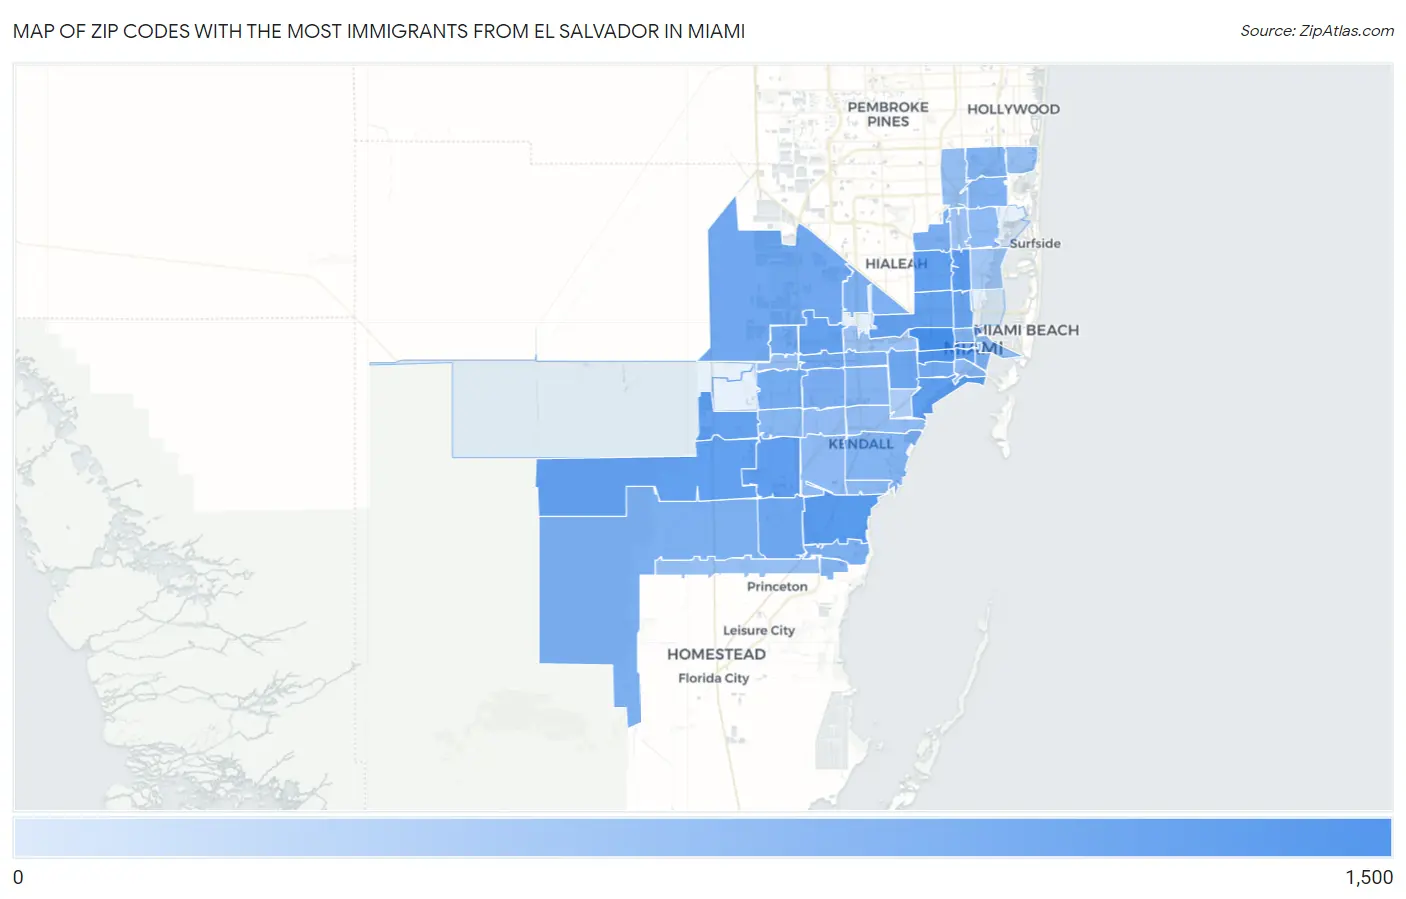
Map of Zip Codes with the Most Immigrants from El Salvador in Miami
9
1,449
Zip Codes with the Most Immigrants from El Salvador in Miami, FL
| Zip Code | El Salvador | vs State | vs National | |
| 1. | 33125 | 1,449 | 49,838(2.91%)#1 | 1,408,349(0.10%)#174 |
| 2. | 33135 | 1,090 | 49,838(2.19%)#4 | 1,408,349(0.08%)#258 |
| 3. | 33157 | 644 | 49,838(1.29%)#10 | 1,408,349(0.05%)#469 |
| 4. | 33150 | 475 | 49,838(0.95%)#18 | 1,408,349(0.03%)#651 |
| 5. | 33133 | 437 | 49,838(0.88%)#21 | 1,408,349(0.03%)#694 |
| 6. | 33186 | 400 | 49,838(0.80%)#23 | 1,408,349(0.03%)#751 |
| 7. | 33196 | 387 | 49,838(0.78%)#28 | 1,408,349(0.03%)#783 |
| 8. | 33147 | 357 | 49,838(0.72%)#31 | 1,408,349(0.03%)#837 |
| 9. | 33142 | 352 | 49,838(0.71%)#32 | 1,408,349(0.02%)#850 |
| 10. | 33172 | 350 | 49,838(0.70%)#33 | 1,408,349(0.02%)#857 |
| 11. | 33193 | 347 | 49,838(0.70%)#34 | 1,408,349(0.02%)#866 |
| 12. | 33130 | 334 | 49,838(0.67%)#36 | 1,408,349(0.02%)#898 |
| 13. | 33127 | 267 | 49,838(0.54%)#53 | 1,408,349(0.02%)#1,088 |
| 14. | 33134 | 218 | 49,838(0.44%)#64 | 1,408,349(0.02%)#1,278 |
| 15. | 33177 | 217 | 49,838(0.44%)#65 | 1,408,349(0.02%)#1,282 |
| 16. | 33174 | 195 | 49,838(0.39%)#69 | 1,408,349(0.01%)#1,388 |
| 17. | 33178 | 191 | 49,838(0.38%)#71 | 1,408,349(0.01%)#1,407 |
| 18. | 33145 | 174 | 49,838(0.35%)#80 | 1,408,349(0.01%)#1,514 |
| 19. | 33182 | 174 | 49,838(0.35%)#81 | 1,408,349(0.01%)#1,516 |
| 20. | 33175 | 151 | 49,838(0.30%)#99 | 1,408,349(0.01%)#1,691 |
| 21. | 33167 | 127 | 49,838(0.25%)#117 | 1,408,349(0.01%)#1,899 |
| 22. | 33128 | 125 | 49,838(0.25%)#120 | 1,408,349(0.01%)#1,929 |
| 23. | 33165 | 122 | 49,838(0.24%)#121 | 1,408,349(0.01%)#1,943 |
| 24. | 33187 | 114 | 49,838(0.23%)#127 | 1,408,349(0.01%)#2,049 |
| 25. | 33144 | 106 | 49,838(0.21%)#129 | 1,408,349(0.01%)#2,135 |
| 26. | 33189 | 105 | 49,838(0.21%)#131 | 1,408,349(0.01%)#2,149 |
| 27. | 33166 | 98 | 49,838(0.20%)#137 | 1,408,349(0.01%)#2,239 |
| 28. | 33162 | 90 | 49,838(0.18%)#142 | 1,408,349(0.01%)#2,350 |
| 29. | 33179 | 90 | 49,838(0.18%)#143 | 1,408,349(0.01%)#2,351 |
| 30. | 33131 | 79 | 49,838(0.16%)#168 | 1,408,349(0.01%)#2,574 |
| 31. | 33156 | 75 | 49,838(0.15%)#171 | 1,408,349(0.01%)#2,643 |
| 32. | 33136 | 74 | 49,838(0.15%)#176 | 1,408,349(0.01%)#2,678 |
| 33. | 33155 | 73 | 49,838(0.15%)#178 | 1,408,349(0.01%)#2,691 |
| 34. | 33190 | 70 | 49,838(0.14%)#182 | 1,408,349(0.00%)#2,773 |
| 35. | 33183 | 59 | 49,838(0.12%)#199 | 1,408,349(0.00%)#3,003 |
| 36. | 33158 | 51 | 49,838(0.10%)#216 | 1,408,349(0.00%)#3,243 |
| 37. | 33161 | 46 | 49,838(0.09%)#227 | 1,408,349(0.00%)#3,367 |
| 38. | 33129 | 46 | 49,838(0.09%)#231 | 1,408,349(0.00%)#3,391 |
| 39. | 33176 | 43 | 49,838(0.09%)#238 | 1,408,349(0.00%)#3,473 |
| 40. | 33143 | 40 | 49,838(0.08%)#248 | 1,408,349(0.00%)#3,584 |
| 41. | 33173 | 39 | 49,838(0.08%)#250 | 1,408,349(0.00%)#3,625 |
| 42. | 33184 | 34 | 49,838(0.07%)#270 | 1,408,349(0.00%)#3,845 |
| 43. | 33170 | 32 | 49,838(0.06%)#275 | 1,408,349(0.00%)#3,939 |
| 44. | 33132 | 31 | 49,838(0.06%)#283 | 1,408,349(0.00%)#3,979 |
| 45. | 33169 | 30 | 49,838(0.06%)#286 | 1,408,349(0.00%)#4,006 |
| 46. | 33180 | 30 | 49,838(0.06%)#288 | 1,408,349(0.00%)#4,015 |
| 47. | 33168 | 22 | 49,838(0.04%)#319 | 1,408,349(0.00%)#4,471 |
| 48. | 33126 | 21 | 49,838(0.04%)#320 | 1,408,349(0.00%)#4,516 |
| 49. | 33138 | 16 | 49,838(0.03%)#347 | 1,408,349(0.00%)#4,913 |
| 50. | 33146 | 9 | 49,838(0.02%)#388 | 1,408,349(0.00%)#5,633 |
1
Common Questions
What are the Top 10 Zip Codes with the Most Immigrants from El Salvador in Miami, FL?
Top 10 Zip Codes with the Most Immigrants from El Salvador in Miami, FL are:
What zip code has the Most Immigrants from El Salvador in Miami, FL?
33125 has the Most Immigrants from El Salvador in Miami, FL with 1,449.
What is the Total Immigrants from El Salvador in Miami, FL?
Total Immigrants from El Salvador in Miami is 4,518.
What is the Total Immigrants from El Salvador in Florida?
Total Immigrants from El Salvador in Florida is 49,838.
What is the Total Immigrants from El Salvador in the United States?
Total Immigrants from El Salvador in the United States is 1,408,349.