Zip Codes with the Highest Percentage of Population with a Degree in Literature and Languages in Gainesville, FL

RELATED REPORTS & OPTIONS

Literature and Languages
Population
Families and Households
Female Fertility
Female Fertility (Unmarried)
Race (Community Size)
Race (Percentage)
Ancestry (Community Size)
AfricanAlbanianAmericanArabArgentineanArmenianAustralianAustrianBahamianBelgianBelizeanBhutaneseBlackfeetBolivianBrazilianBritishBulgarianBurmeseCanadianCelticCentral AmericanCentral American IndianCherokeeChickasawChileanChippewaChoctawColombianCosta RicanCreekCroatianCubanCzechCzechoslovakianDanishDominicanDutchEastern EuropeanEcuadorianEgyptianEnglishEthiopianEuropeanFilipinoFinnishFrenchFrench CanadianGermanGhanaianGreekGuamanian / ChamorroGuatemalanGuyaneseHaitianHonduranHungarianIndian (Asian)IranianIraqiIrishIroquoisIsraeliItalianJamaicanJordanianKenyanKoreanLaotianLatvianLebaneseLithuanianLumbeeMacedonianMexicanMexican American IndianNative HawaiianNavajoNicaraguanNigerianNorthern EuropeanNorwegianPalestinianPanamanianParaguayanPennsylvania GermanPeruvianPolishPortuguesePuebloPuerto RicanRomanianRussianSalvadoranSamoanScandinavianScotch-IrishScottishSeminoleSerbianSlavicSlovakSloveneSouth AfricanSouth AmericanSouth American IndianSpaniardSpanishSri LankanSubsaharan AfricanSwedishSwissSyrianThaiTonganTrinidadian and TobagonianTurkishU.S. Virgin IslanderUkrainianUruguayanVenezuelanVietnameseWelshWest IndianYugoslavian
Ancestry (Percentage)
AfricanAlbanianAmericanArabArgentineanArmenianAustralianAustrianBahamianBelgianBelizeanBhutaneseBlackfeetBolivianBrazilianBritishBulgarianBurmeseCanadianCelticCentral AmericanCentral American IndianCherokeeChickasawChileanChippewaChoctawColombianCosta RicanCreekCroatianCubanCzechCzechoslovakianDanishDominicanDutchEastern EuropeanEcuadorianEgyptianEnglishEthiopianEuropeanFilipinoFinnishFrenchFrench CanadianGermanGhanaianGreekGuamanian / ChamorroGuatemalanGuyaneseHaitianHonduranHungarianIndian (Asian)IranianIraqiIrishIroquoisIsraeliItalianJamaicanJordanianKenyanKoreanLaotianLatvianLebaneseLithuanianLumbeeMacedonianMexicanMexican American IndianNative HawaiianNavajoNicaraguanNigerianNorthern EuropeanNorwegianPalestinianPanamanianParaguayanPennsylvania GermanPeruvianPolishPortuguesePuebloPuerto RicanRomanianRussianSalvadoranSamoanScandinavianScotch-IrishScottishSeminoleSerbianSlavicSlovakSloveneSouth AfricanSouth AmericanSouth American IndianSpaniardSpanishSri LankanSubsaharan AfricanSwedishSwissSyrianThaiTonganTrinidadian and TobagonianTurkishU.S. Virgin IslanderUkrainianUruguayanVenezuelanVietnameseWelshWest IndianYugoslavian
Immigrant Origin (Total)
Immigrant Origin (Percentage)
Income
Income (Families)
Income (Households)
Poverty
Poverty (Families)
Unemployment
Employment Occupations
Employment Industries
Employer Class
Commute Time
Commute Means
School Enrollment
Education by Degree Field
Occupancy
Finances
Physical Characteristics
Gainesville
States
Florida Cities
AlachuaAltamonte SpringsApopkaArcadiaBoca RatonBonita SpringsBoynton BeachBradentonBrandonBrooksvilleCape CoralCasselberryClearwaterClermontCocoaCoral SpringsCrestviewCrystal RiverDade CityDavenportDaytona BeachDeerfield BeachDelandDelray BeachDeltonaDunnellonEdgewaterEnglewoodEustisFort LauderdaleFort MyersFort PierceFort Walton BeachGainesvilleGulf BreezeHialeahHolidayHollywoodHomesteadHomosassaHudsonInvernessJacksonvilleJupiterKissimmeeLake CityLake WalesLake WorthLakelandLand O LakesLargoLeesburgLehigh AcresLive OakLongwoodLutzMelbourneMerritt IslandMiamiMiami BeachMiltonNaplesNew Port RicheyNew Smyrna BeachNorth Fort MyersNorth PortOcalaOkeechobeeOpa LockaOrange ParkOrlandoOrmond BeachOviedoPalm BayPalm Beach GardensPalm CoastPalm HarborPanama CityPanama City BeachPensacolaPerryPinellas ParkPlant CityPompano BeachPort CharlottePort OrangePort Saint LuciePunta GordaRiverviewSaint AugustineSaint CloudSaint PetersburgSanfordSarasotaSebastianSebringSeminoleSpring HillStuartTallahasseeTampaTarpon SpringsThe VillagesTitusvilleValricoVeniceVero BeachWesley ChapelWest Palm BeachWinter HavenWinter ParkZephyrhills
Compare Zip Codes
Comparison Subject

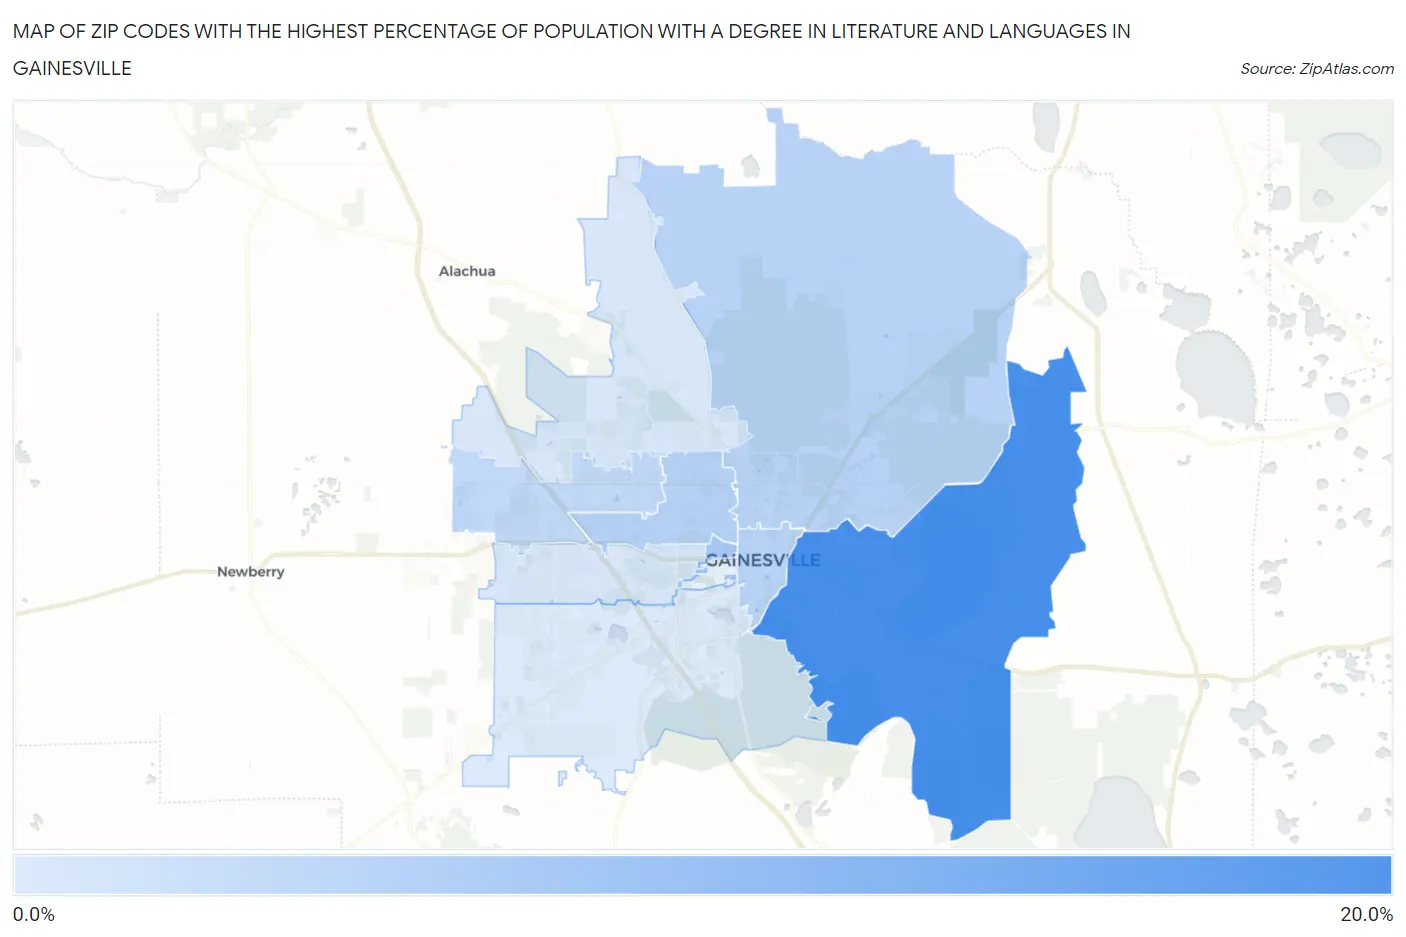
Map of Zip Codes with the Highest Percentage of Population with a Degree in Literature and Languages in Gainesville

0.0%
20.0%
Zip Codes with the Highest Percentage of Population with a Degree in Literature and Languages in Gainesville Map

Zip Codes with the Highest Percentage of Population with a Degree in Literature and Languages in Gainesville, FL

Zip Code % Graduates vs State vs National
1.3264115.6%3.4%(+12.2)#54.4%(+11.2)#758
2.326038.1%3.4%(+4.65)#334.4%(+3.65)#2,939
3.326056.9%3.4%(+3.45)#574.4%(+2.44)#4,175
4.326096.6%3.4%(+3.24)#594.4%(+2.23)#4,443
5.326016.6%3.4%(+3.22)#604.4%(+2.22)#4,463
6.326065.9%3.4%(+2.53)#854.4%(+1.52)#5,541
7.326534.2%3.4%(+0.798)#2574.4%(-0.210)#9,607
8.326074.1%3.4%(+0.718)#2694.4%(-0.290)#9,855
9.326083.8%3.4%(+0.446)#3164.4%(-0.562)#10,675

Common Questions

What are the Top 10 Zip Codes with the Highest Percentage of Population with a Degree in Literature and Languages in Gainesville, FL?
Top 10 Zip Codes with the Highest Percentage of Population with a Degree in Literature and Languages in Gainesville, FL are:
#1
15.6%
#2
8.1%
#3
6.9%
#4
6.6%
#5
6.6%
#6
5.9%
#7
4.2%
#8
4.1%
#9
3.8%
#10
0.0%
What zip code has the Highest Percentage of Population with a Degree in Literature and Languages in Gainesville, FL?
32641 has the Highest Percentage of Population with a Degree in Literature and Languages in Gainesville, FL with 15.6%.
What is the Percentage of Population with a Degree in Literature and Languages in Gainesville, FL?
Percentage of Population with a Degree in Literature and Languages in Gainesville is 6.0%.
What is the Percentage of Population with a Degree in Literature and Languages in Florida?
Percentage of Population with a Degree in Literature and Languages in Florida is 3.4%.
What is the Percentage of Population with a Degree in Literature and Languages in the United States?
Percentage of Population with a Degree in Literature and Languages in the United States is 4.4%.