Lake Butler, FL Map & Demographics
Lake Butler Map
Lake Butler Overview
$19,335
PER CAPITA INCOME
$53,906
AVG FAMILY INCOME
$41,941
AVG HOUSEHOLD INCOME
51.9%
WAGE / INCOME GAP [ % ]
48.1¢/ $1
WAGE / INCOME GAP [ $ ]
0.39
INEQUALITY / GINI INDEX
1,842
TOTAL POPULATION
882
MALE POPULATION
960
FEMALE POPULATION
91.88
MALES / 100 FEMALES
108.84
FEMALES / 100 MALES
25.3
MEDIAN AGE
3.0
AVG FAMILY SIZE
2.6
AVG HOUSEHOLD SIZE
693
LABOR FORCE [ PEOPLE ]
57.1%
PERCENT IN LABOR FORCE
10.0%
UNEMPLOYMENT RATE
Lake Butler Zip Codes
Lake Butler Area Codes
Income in Lake Butler
Income Overview in Lake Butler
Per Capita Income in Lake Butler is $19,335, while median incomes of families and households are $53,906 and $41,941 respectively.
| Characteristic | Number | Measure |
| Per Capita Income | 1,842 | $19,335 |
| Median Family Income | 490 | $53,906 |
| Mean Family Income | 490 | $62,641 |
| Median Household Income | 701 | $41,941 |
| Mean Household Income | 701 | $56,239 |
| Income Deficit | 490 | $0 |
| Wage / Income Gap (%) | 1,842 | 51.88% |
| Wage / Income Gap ($) | 1,842 | 48.12¢ per $1 |
| Gini / Inequality Index | 1,842 | 0.39 |
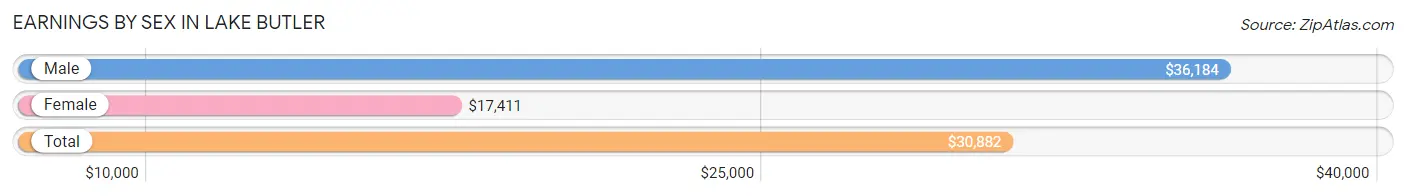
Earnings by Sex in Lake Butler
Average Earnings in Lake Butler are $30,882, $36,184 for men and $17,411 for women, a difference of 51.9%.
| Sex | Number | Average Earnings |
| Male | 412 (56.4%) | $36,184 |
| Female | 318 (43.6%) | $17,411 |
| Total | 730 (100.0%) | $30,882 |
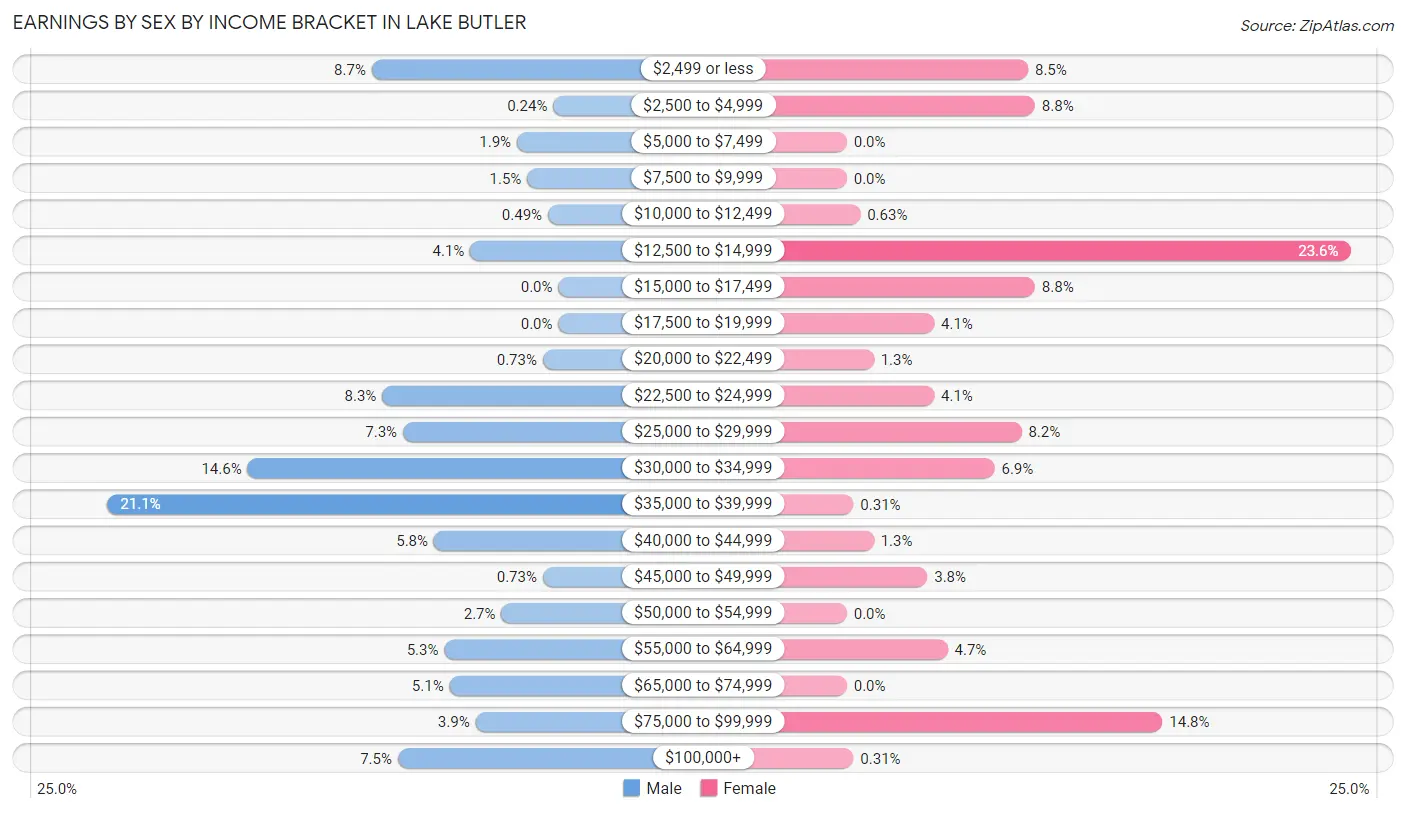
Earnings by Sex by Income Bracket in Lake Butler
The most common earnings brackets in Lake Butler are $35,000 to $39,999 for men (87 | 21.1%) and $12,500 to $14,999 for women (75 | 23.6%).
| Income | Male | Female |
| $2,499 or less | 36 (8.7%) | 27 (8.5%) |
| $2,500 to $4,999 | 1 (0.2%) | 28 (8.8%) |
| $5,000 to $7,499 | 8 (1.9%) | 0 (0.0%) |
| $7,500 to $9,999 | 6 (1.5%) | 0 (0.0%) |
| $10,000 to $12,499 | 2 (0.5%) | 2 (0.6%) |
| $12,500 to $14,999 | 17 (4.1%) | 75 (23.6%) |
| $15,000 to $17,499 | 0 (0.0%) | 28 (8.8%) |
| $17,500 to $19,999 | 0 (0.0%) | 13 (4.1%) |
| $20,000 to $22,499 | 3 (0.7%) | 4 (1.3%) |
| $22,500 to $24,999 | 34 (8.3%) | 13 (4.1%) |
| $25,000 to $29,999 | 30 (7.3%) | 26 (8.2%) |
| $30,000 to $34,999 | 60 (14.6%) | 22 (6.9%) |
| $35,000 to $39,999 | 87 (21.1%) | 1 (0.3%) |
| $40,000 to $44,999 | 24 (5.8%) | 4 (1.3%) |
| $45,000 to $49,999 | 3 (0.7%) | 12 (3.8%) |
| $50,000 to $54,999 | 11 (2.7%) | 0 (0.0%) |
| $55,000 to $64,999 | 22 (5.3%) | 15 (4.7%) |
| $65,000 to $74,999 | 21 (5.1%) | 0 (0.0%) |
| $75,000 to $99,999 | 16 (3.9%) | 47 (14.8%) |
| $100,000+ | 31 (7.5%) | 1 (0.3%) |
| Total | 412 (100.0%) | 318 (100.0%) |
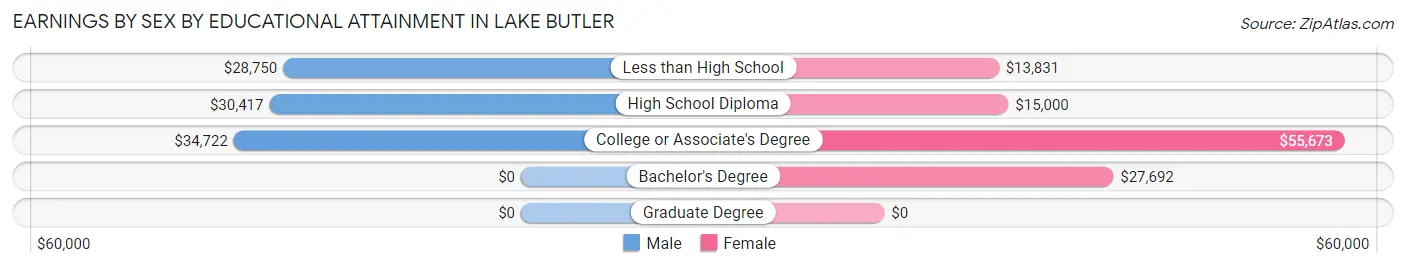
Earnings by Sex by Educational Attainment in Lake Butler
Average earnings in Lake Butler are $36,645 for men and $20,625 for women, a difference of 43.7%. Men with an educational attainment of college or associate's degree enjoy the highest average annual earnings of $34,722, while those with less than high school education earn the least with $28,750. Women with an educational attainment of college or associate's degree earn the most with the average annual earnings of $55,673, while those with less than high school education have the smallest earnings of $13,831.
| Educational Attainment | Male Income | Female Income |
| Less than High School | $28,750 | $13,831 |
| High School Diploma | $30,417 | $15,000 |
| College or Associate's Degree | $34,722 | $55,673 |
| Bachelor's Degree | - | - |
| Graduate Degree | - | - |
| Total | $36,645 | $20,625 |
Family Income in Lake Butler
Family Income Brackets in Lake Butler
According to the Lake Butler family income data, there are 108 families falling into the $35,000 to $49,999 income range, which is the most common income bracket and makes up 22.0% of all families. Conversely, the $200,000+ income bracket is the least frequent group with only 2 families (0.4%) belonging to this category.
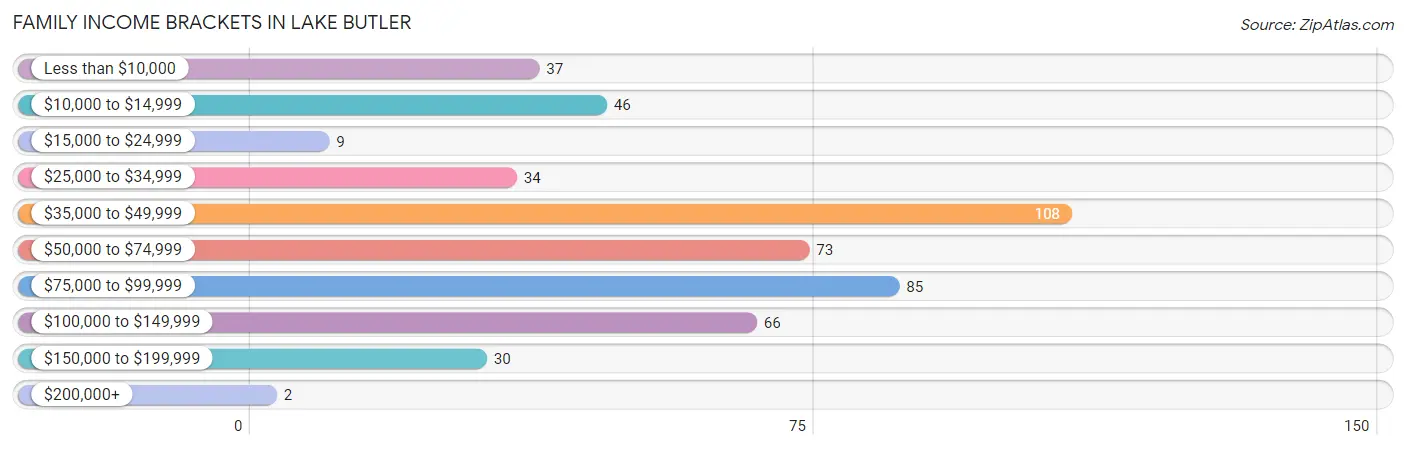
| Income Bracket | # Families | % Families |
| Less than $10,000 | 37 | 7.6% |
| $10,000 to $14,999 | 46 | 9.4% |
| $15,000 to $24,999 | 9 | 1.8% |
| $25,000 to $34,999 | 34 | 6.9% |
| $35,000 to $49,999 | 108 | 22.0% |
| $50,000 to $74,999 | 73 | 14.9% |
| $75,000 to $99,999 | 85 | 17.3% |
| $100,000 to $149,999 | 66 | 13.5% |
| $150,000 to $199,999 | 30 | 6.1% |
| $200,000+ | 2 | 0.4% |
Family Income by Famaliy Size in Lake Butler
2-person families (129 | 26.3%) account for the highest median family income in Lake Butler with $80,750 per family, while 2-person families (129 | 26.3%) have the highest median income of $40,375 per family member.
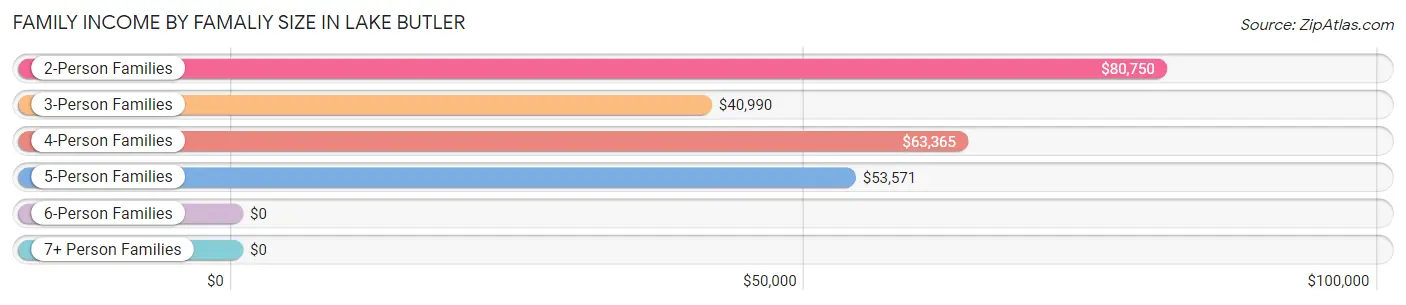
| Income Bracket | # Families | Median Income |
| 2-Person Families | 129 (26.3%) | $80,750 |
| 3-Person Families | 141 (28.8%) | $40,990 |
| 4-Person Families | 131 (26.7%) | $63,365 |
| 5-Person Families | 22 (4.5%) | $53,571 |
| 6-Person Families | 57 (11.6%) | $0 |
| 7+ Person Families | 10 (2.0%) | $0 |
| Total | 490 (100.0%) | $53,906 |
Family Income by Number of Earners in Lake Butler
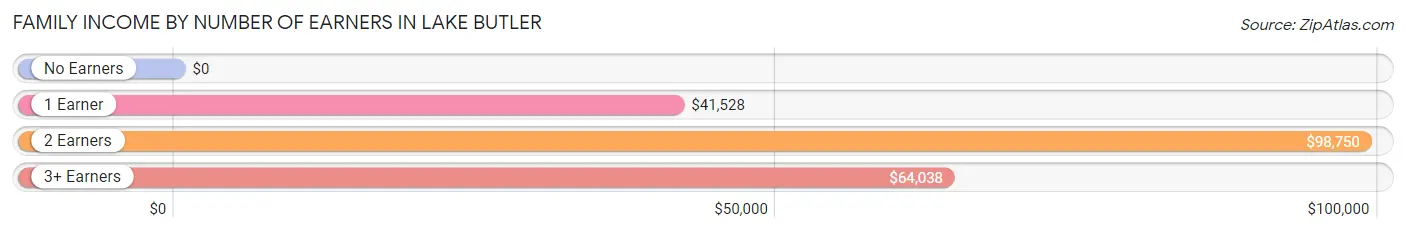
| Number of Earners | # Families | Median Income |
| No Earners | 49 (10.0%) | $0 |
| 1 Earner | 303 (61.8%) | $41,528 |
| 2 Earners | 122 (24.9%) | $98,750 |
| 3+ Earners | 16 (3.3%) | $64,038 |
| Total | 490 (100.0%) | $53,906 |
Household Income in Lake Butler
Household Income Brackets in Lake Butler
With 121 households falling in the category, the $75,000 to $99,999 income range is the most frequent in Lake Butler, accounting for 17.3% of all households. In contrast, only 2 households (0.3%) fall into the $200,000+ income bracket, making it the least populous group.
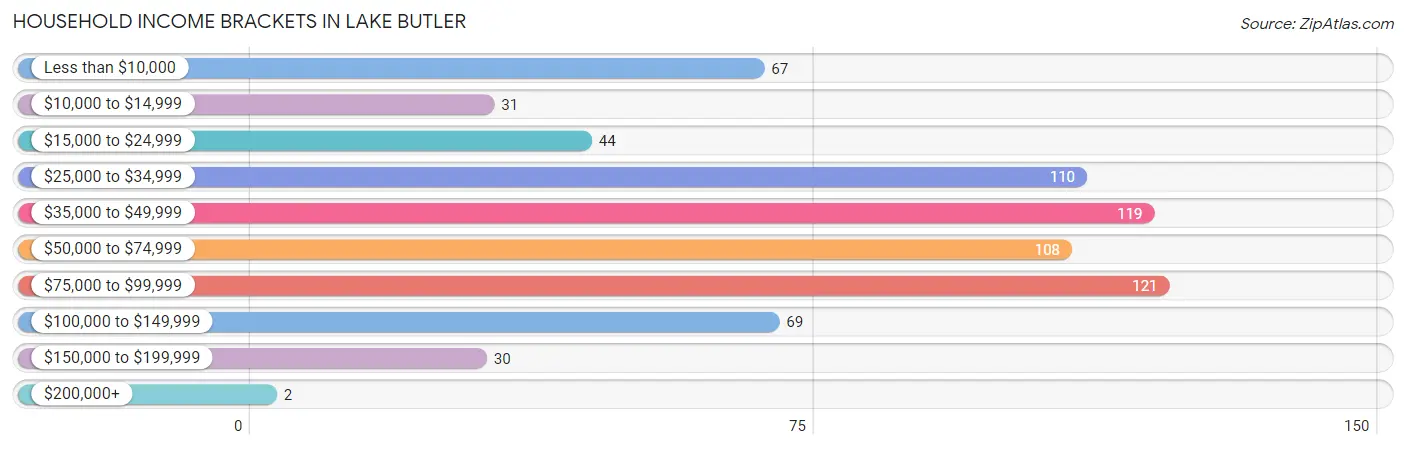
| Income Bracket | # Households | % Households |
| Less than $10,000 | 67 | 9.6% |
| $10,000 to $14,999 | 31 | 4.4% |
| $15,000 to $24,999 | 44 | 6.3% |
| $25,000 to $34,999 | 110 | 15.7% |
| $35,000 to $49,999 | 119 | 17.0% |
| $50,000 to $74,999 | 108 | 15.4% |
| $75,000 to $99,999 | 121 | 17.3% |
| $100,000 to $149,999 | 69 | 9.8% |
| $150,000 to $199,999 | 30 | 4.3% |
| $200,000+ | 2 | 0.3% |
Household Income by Householder Age in Lake Butler
The median household income in Lake Butler is $41,941, with the highest median household income of $73,250 found in the 45 to 64 years age bracket for the primary householder. A total of 181 households (25.8%) fall into this category. Meanwhile, the 25 to 44 years age bracket for the primary householder has the lowest median household income of $37,143, with 308 households (43.9%) in this group.
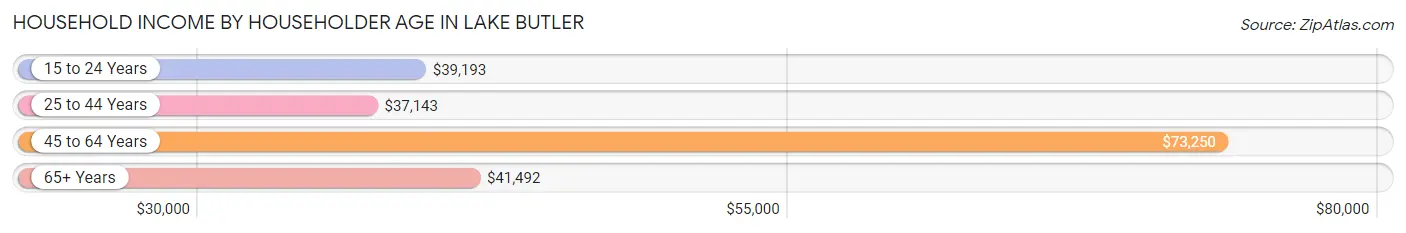
| Income Bracket | # Households | Median Income |
| 15 to 24 Years | 93 (13.3%) | $39,193 |
| 25 to 44 Years | 308 (43.9%) | $37,143 |
| 45 to 64 Years | 181 (25.8%) | $73,250 |
| 65+ Years | 119 (17.0%) | $41,492 |
| Total | 701 (100.0%) | $41,941 |
Poverty in Lake Butler
Income Below Poverty by Sex and Age in Lake Butler
With 24.3% poverty level for males and 37.8% for females among the residents of Lake Butler, 15 year old males and 15 year old females are the most vulnerable to poverty, with 18 males (100.0%) and 4 females (100.0%) in their respective age groups living below the poverty level.
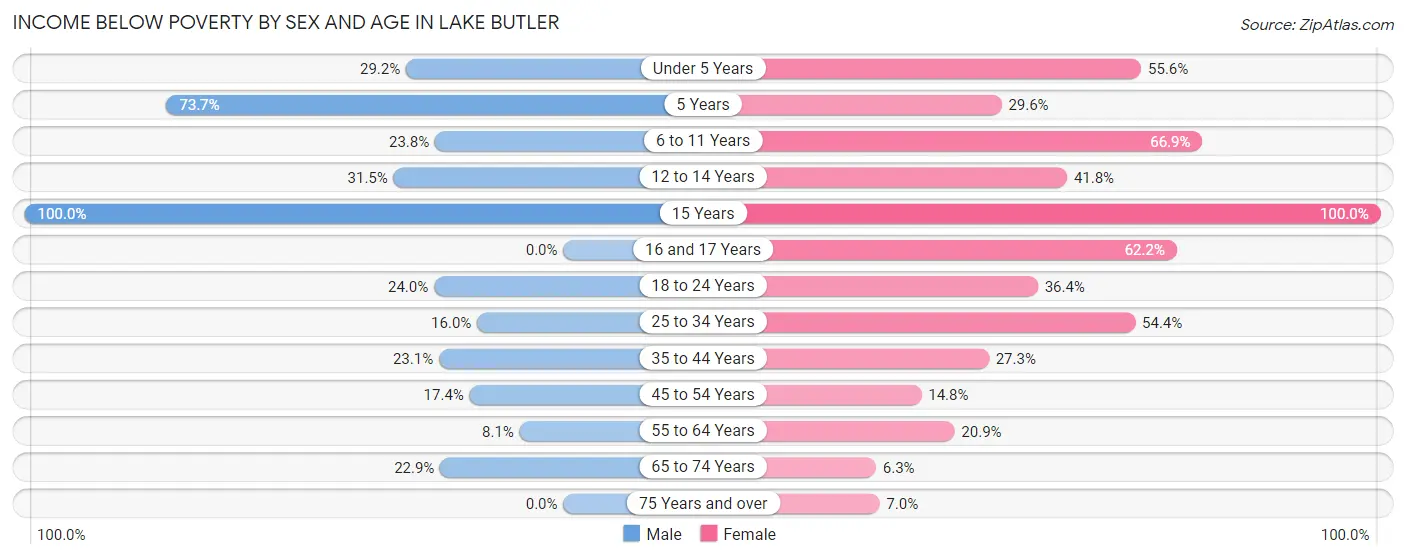
| Age Bracket | Male | Female |
| Under 5 Years | 33 (29.2%) | 15 (55.6%) |
| 5 Years | 14 (73.7%) | 8 (29.6%) |
| 6 to 11 Years | 30 (23.8%) | 87 (66.9%) |
| 12 to 14 Years | 23 (31.5%) | 28 (41.8%) |
| 15 Years | 18 (100.0%) | 4 (100.0%) |
| 16 and 17 Years | 0 (0.0%) | 23 (62.2%) |
| 18 to 24 Years | 30 (24.0%) | 36 (36.4%) |
| 25 to 34 Years | 12 (16.0%) | 92 (54.4%) |
| 35 to 44 Years | 12 (23.1%) | 33 (27.3%) |
| 45 to 54 Years | 20 (17.4%) | 9 (14.7%) |
| 55 to 64 Years | 6 (8.1%) | 14 (20.9%) |
| 65 to 74 Years | 8 (22.9%) | 6 (6.3%) |
| 75 Years and over | 0 (0.0%) | 3 (7.0%) |
| Total | 206 (24.3%) | 358 (37.8%) |
Income Above Poverty by Sex and Age in Lake Butler
According to the poverty statistics in Lake Butler, males aged 16 and 17 years and females aged 65 to 74 years are the age groups that are most secure financially, with 100.0% of males and 93.7% of females in these age groups living above the poverty line.
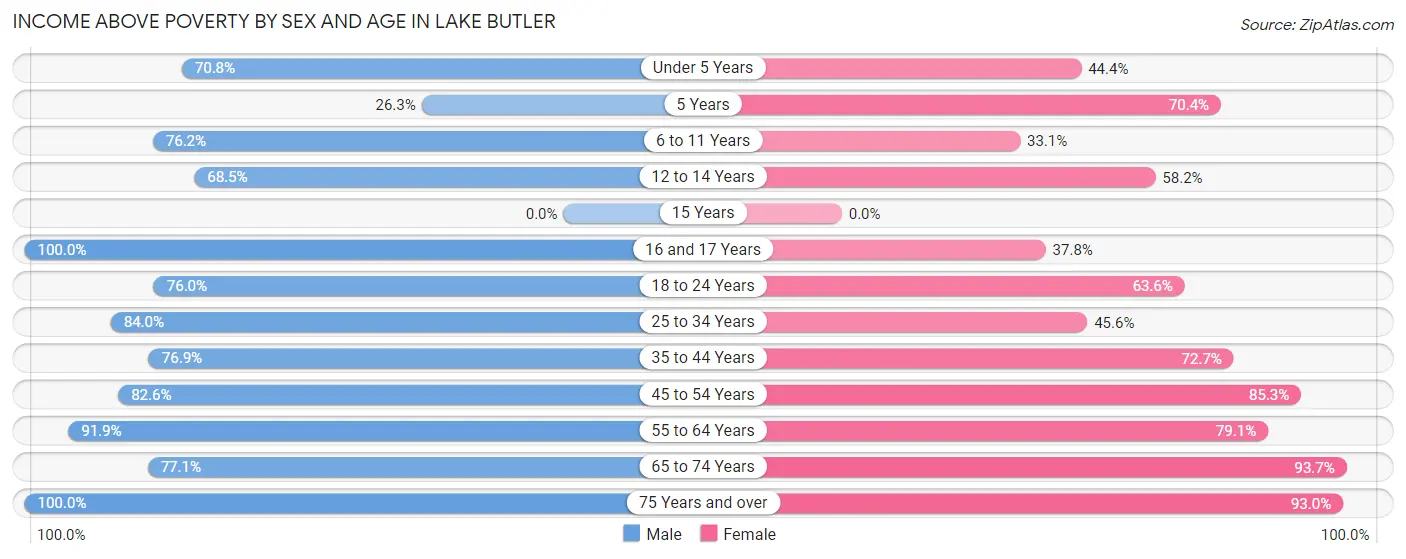
| Age Bracket | Male | Female |
| Under 5 Years | 80 (70.8%) | 12 (44.4%) |
| 5 Years | 5 (26.3%) | 19 (70.4%) |
| 6 to 11 Years | 96 (76.2%) | 43 (33.1%) |
| 12 to 14 Years | 50 (68.5%) | 39 (58.2%) |
| 15 Years | 0 (0.0%) | 0 (0.0%) |
| 16 and 17 Years | 9 (100.0%) | 14 (37.8%) |
| 18 to 24 Years | 95 (76.0%) | 63 (63.6%) |
| 25 to 34 Years | 63 (84.0%) | 77 (45.6%) |
| 35 to 44 Years | 40 (76.9%) | 88 (72.7%) |
| 45 to 54 Years | 95 (82.6%) | 52 (85.3%) |
| 55 to 64 Years | 68 (91.9%) | 53 (79.1%) |
| 65 to 74 Years | 27 (77.1%) | 89 (93.7%) |
| 75 Years and over | 12 (100.0%) | 40 (93.0%) |
| Total | 640 (75.6%) | 589 (62.2%) |
Income Below Poverty Among Married-Couple Families in Lake Butler
The poverty statistics for married-couple families in Lake Butler show that 1.9% or 5 of the total 269 families live below the poverty line. Families with no children have the highest poverty rate of 4.2%, comprising of 5 families. On the other hand, families with 1 or 2 children have the lowest poverty rate of 0.0%, which includes 0 families.
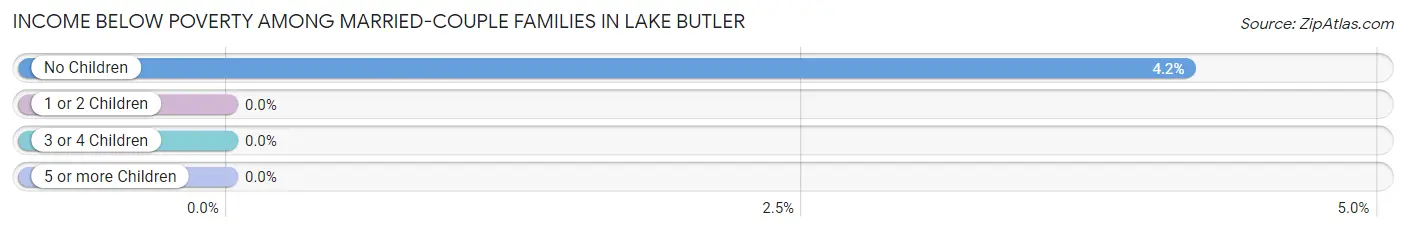
| Children | Above Poverty | Below Poverty |
| No Children | 115 (95.8%) | 5 (4.2%) |
| 1 or 2 Children | 123 (100.0%) | 0 (0.0%) |
| 3 or 4 Children | 26 (100.0%) | 0 (0.0%) |
| 5 or more Children | 0 (0.0%) | 0 (0.0%) |
| Total | 264 (98.1%) | 5 (1.9%) |
Income Below Poverty Among Single-Parent Households in Lake Butler
According to the poverty data in Lake Butler, 46.2% or 18 single-father households and 51.1% or 93 single-mother households are living below the poverty line. Among single-father households, those with 3 or 4 children have the highest poverty rate, with 18 households (100.0%) experiencing poverty. Likewise, among single-mother households, those with 3 or 4 children have the highest poverty rate, with 29 households (100.0%) falling below the poverty line.
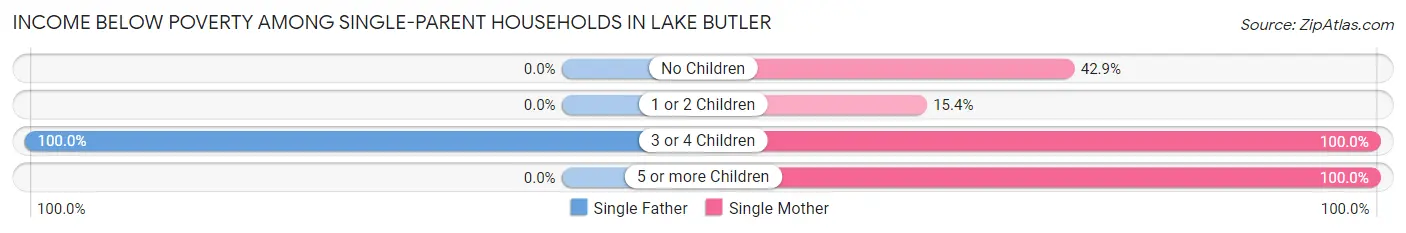
| Children | Single Father | Single Mother |
| No Children | 0 (0.0%) | 9 (42.9%) |
| 1 or 2 Children | 0 (0.0%) | 14 (15.4%) |
| 3 or 4 Children | 18 (100.0%) | 29 (100.0%) |
| 5 or more Children | 0 (0.0%) | 41 (100.0%) |
| Total | 18 (46.2%) | 93 (51.1%) |
Income Below Poverty Among Married-Couple vs Single-Parent Households in Lake Butler
The poverty data for Lake Butler shows that 5 of the married-couple family households (1.9%) and 111 of the single-parent households (50.2%) are living below the poverty level. Within the married-couple family households, those with no children have the highest poverty rate, with 5 households (4.2%) falling below the poverty line. Among the single-parent households, those with 3 or 4 children have the highest poverty rate, with 47 household (100.0%) living below poverty.
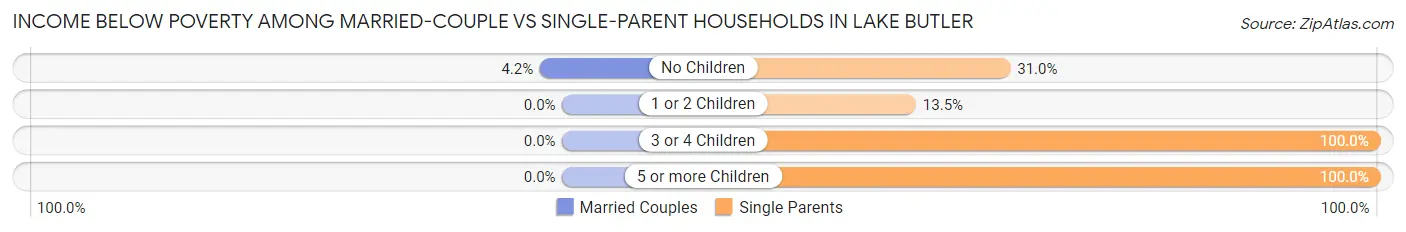
| Children | Married-Couple Families | Single-Parent Households |
| No Children | 5 (4.2%) | 9 (31.0%) |
| 1 or 2 Children | 0 (0.0%) | 14 (13.5%) |
| 3 or 4 Children | 0 (0.0%) | 47 (100.0%) |
| 5 or more Children | 0 (0.0%) | 41 (100.0%) |
| Total | 5 (1.9%) | 111 (50.2%) |
Race in Lake Butler
The most populous races in Lake Butler are White / Caucasian (1,368 | 74.3%), Black / African American (324 | 17.6%), and Two or more Races (117 | 6.4%).
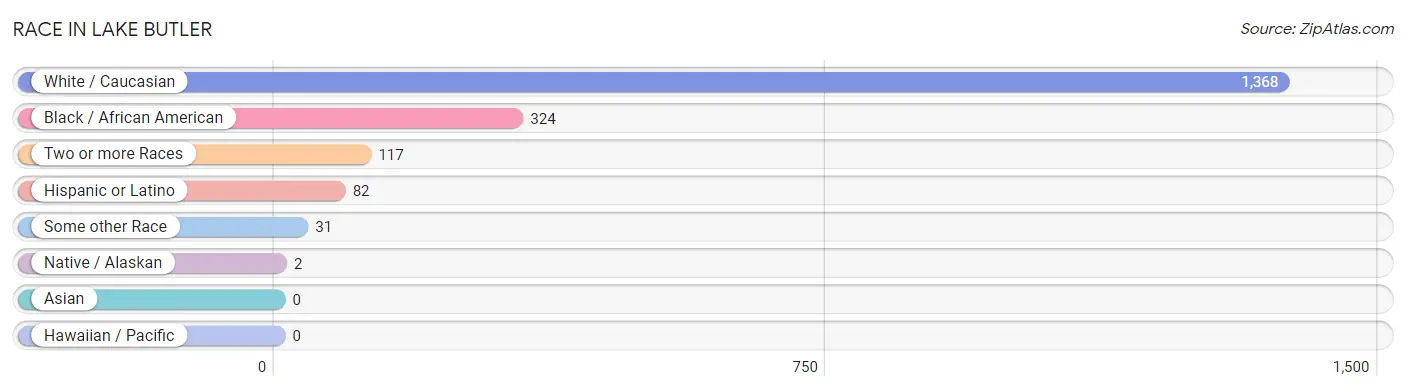
| Race | # Population | % Population |
| Asian | 0 | 0.0% |
| Black / African American | 324 | 17.6% |
| Hawaiian / Pacific | 0 | 0.0% |
| Hispanic or Latino | 82 | 4.4% |
| Native / Alaskan | 2 | 0.1% |
| White / Caucasian | 1,368 | 74.3% |
| Two or more Races | 117 | 6.4% |
| Some other Race | 31 | 1.7% |
| Total | 1,842 | 100.0% |
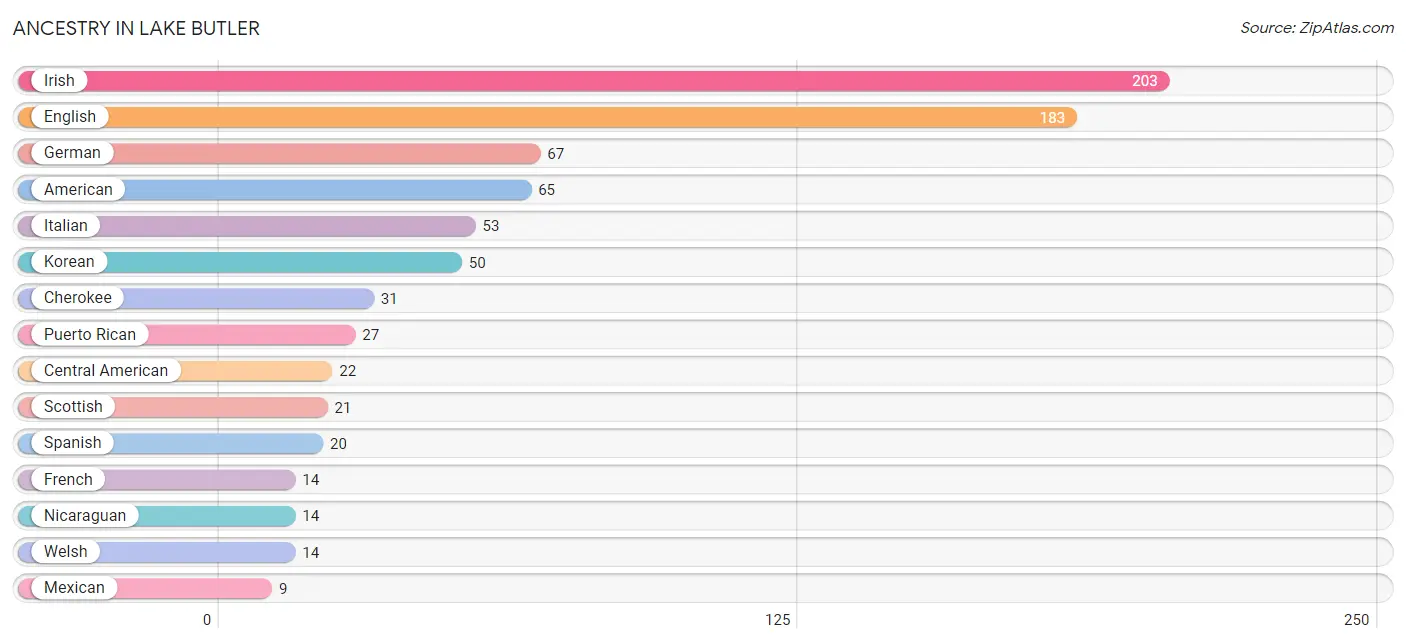
Ancestry in Lake Butler
The most populous ancestries reported in Lake Butler are Irish (203 | 11.0%), English (183 | 9.9%), German (67 | 3.6%), American (65 | 3.5%), and Italian (53 | 2.9%), together accounting for 31.0% of all Lake Butler residents.
| Ancestry | # Population | % Population |
| African | 3 | 0.2% |
| American | 65 | 3.5% |
| British | 2 | 0.1% |
| Central American | 22 | 1.2% |
| Cherokee | 31 | 1.7% |
| Croatian | 3 | 0.2% |
| Cuban | 4 | 0.2% |
| Dutch | 2 | 0.1% |
| English | 183 | 9.9% |
| French | 14 | 0.8% |
| German | 67 | 3.6% |
| Guatemalan | 5 | 0.3% |
| Irish | 203 | 11.0% |
| Italian | 53 | 2.9% |
| Jamaican | 4 | 0.2% |
| Korean | 50 | 2.7% |
| Mexican | 9 | 0.5% |
| Nicaraguan | 14 | 0.8% |
| Panamanian | 3 | 0.2% |
| Polish | 9 | 0.5% |
| Puerto Rican | 27 | 1.5% |
| Scotch-Irish | 2 | 0.1% |
| Scottish | 21 | 1.1% |
| Spanish | 20 | 1.1% |
| Subsaharan African | 3 | 0.2% |
| Swedish | 2 | 0.1% |
| Swiss | 2 | 0.1% |
| Welsh | 14 | 0.8% | View All 28 Rows |
Immigrants in Lake Butler
The most numerous immigrant groups reported in Lake Butler came from Latin America (23 | 1.3%), Central America (19 | 1.0%), Nicaragua (14 | 0.8%), Guatemala (5 | 0.3%), and Caribbean (4 | 0.2%), together accounting for 3.5% of all Lake Butler residents.
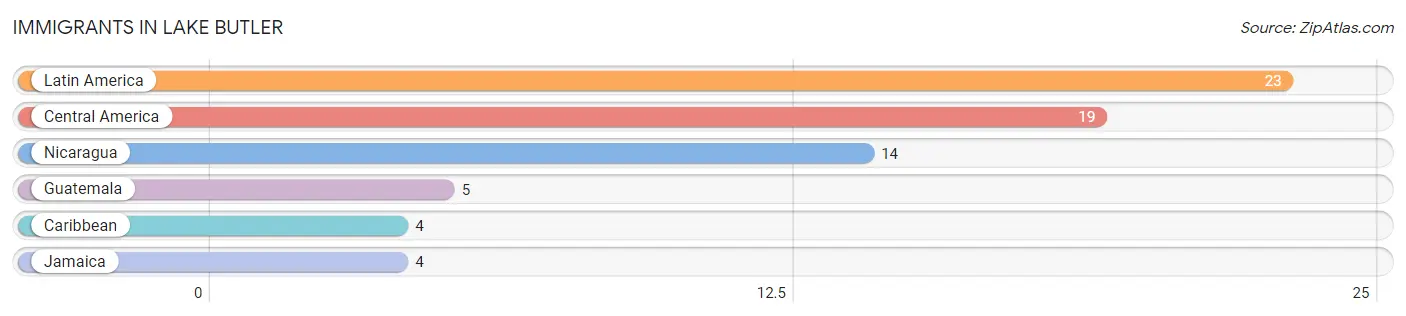
| Immigration Origin | # Population | % Population |
| Caribbean | 4 | 0.2% |
| Central America | 19 | 1.0% |
| Guatemala | 5 | 0.3% |
| Jamaica | 4 | 0.2% |
| Latin America | 23 | 1.3% |
| Nicaragua | 14 | 0.8% | View All 6 Rows |
Sex and Age in Lake Butler
Sex and Age in Lake Butler
The most populous age groups in Lake Butler are 5 to 9 Years (133 | 15.1%) for men and 10 to 14 Years (126 | 13.1%) for women.
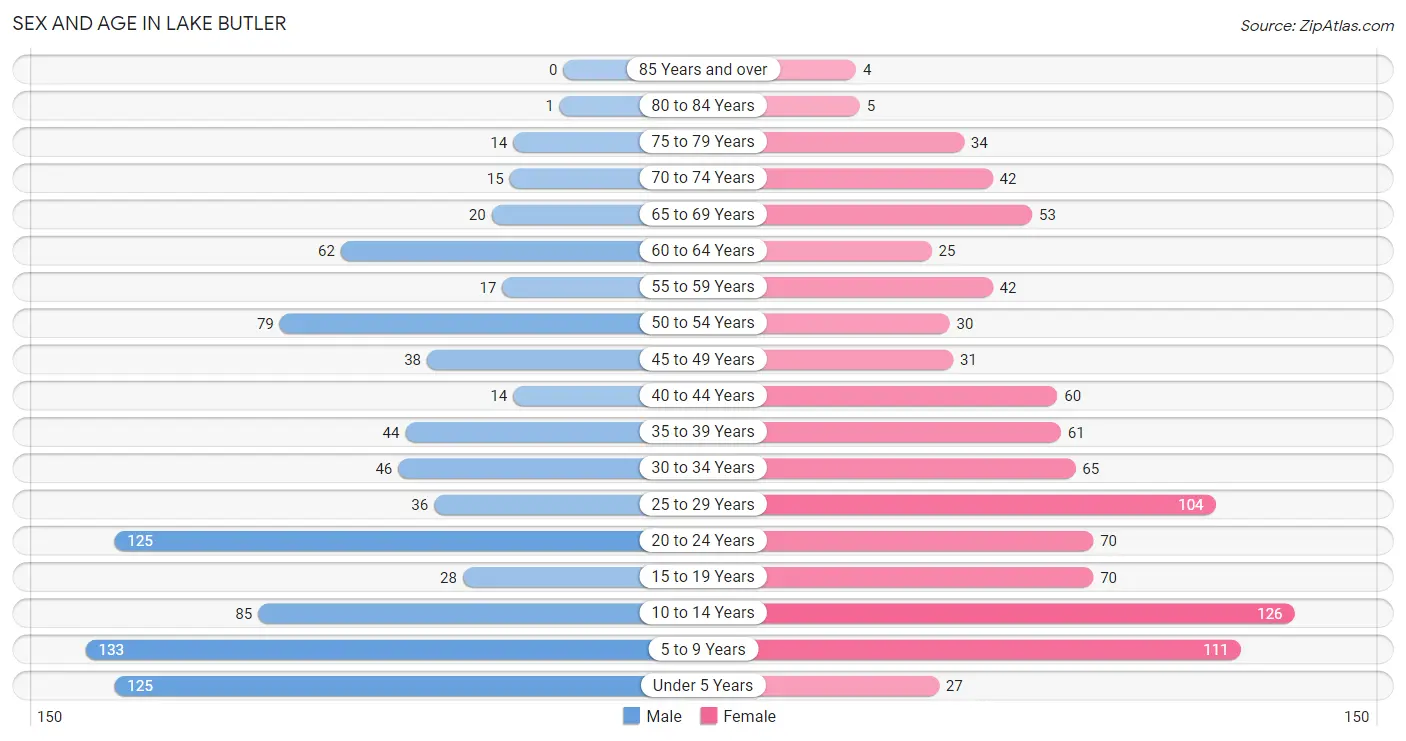
| Age Bracket | Male | Female |
| Under 5 Years | 125 (14.2%) | 27 (2.8%) |
| 5 to 9 Years | 133 (15.1%) | 111 (11.6%) |
| 10 to 14 Years | 85 (9.6%) | 126 (13.1%) |
| 15 to 19 Years | 28 (3.2%) | 70 (7.3%) |
| 20 to 24 Years | 125 (14.2%) | 70 (7.3%) |
| 25 to 29 Years | 36 (4.1%) | 104 (10.8%) |
| 30 to 34 Years | 46 (5.2%) | 65 (6.8%) |
| 35 to 39 Years | 44 (5.0%) | 61 (6.4%) |
| 40 to 44 Years | 14 (1.6%) | 60 (6.2%) |
| 45 to 49 Years | 38 (4.3%) | 31 (3.2%) |
| 50 to 54 Years | 79 (9.0%) | 30 (3.1%) |
| 55 to 59 Years | 17 (1.9%) | 42 (4.4%) |
| 60 to 64 Years | 62 (7.0%) | 25 (2.6%) |
| 65 to 69 Years | 20 (2.3%) | 53 (5.5%) |
| 70 to 74 Years | 15 (1.7%) | 42 (4.4%) |
| 75 to 79 Years | 14 (1.6%) | 34 (3.5%) |
| 80 to 84 Years | 1 (0.1%) | 5 (0.5%) |
| 85 Years and over | 0 (0.0%) | 4 (0.4%) |
| Total | 882 (100.0%) | 960 (100.0%) |
Families and Households in Lake Butler
Median Family Size in Lake Butler
The median family size in Lake Butler is 3.05 persons per family, with married-couple families (269 | 54.9%) accounting for the largest median family size of 3.12 persons per family. On the other hand, single male/father families (39 | 8.0%) represent the smallest median family size with 2.33 persons per family.
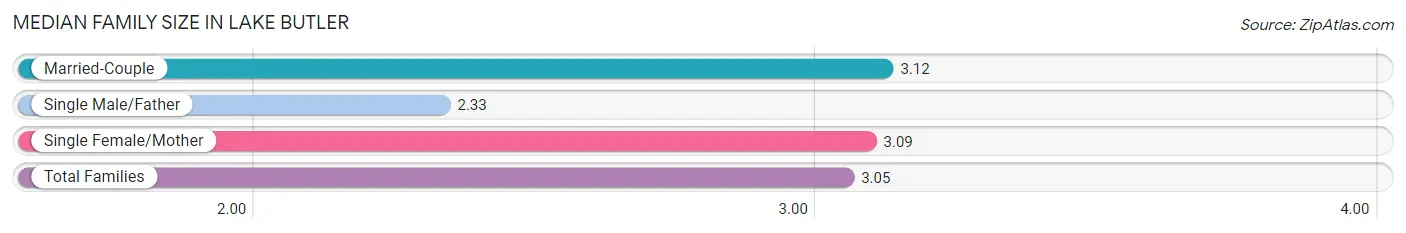
| Family Type | # Families | Family Size |
| Married-Couple | 269 (54.9%) | 3.12 |
| Single Male/Father | 39 (8.0%) | 2.33 |
| Single Female/Mother | 182 (37.1%) | 3.09 |
| Total Families | 490 (100.0%) | 3.05 |
Median Household Size in Lake Butler
The median household size in Lake Butler is 2.59 persons per household, with single female/mother households (182 | 26.0%) accounting for the largest median household size of 3.23 persons per household. non-family households (211 | 30.1%) represent the smallest median household size with 1.32 persons per household.
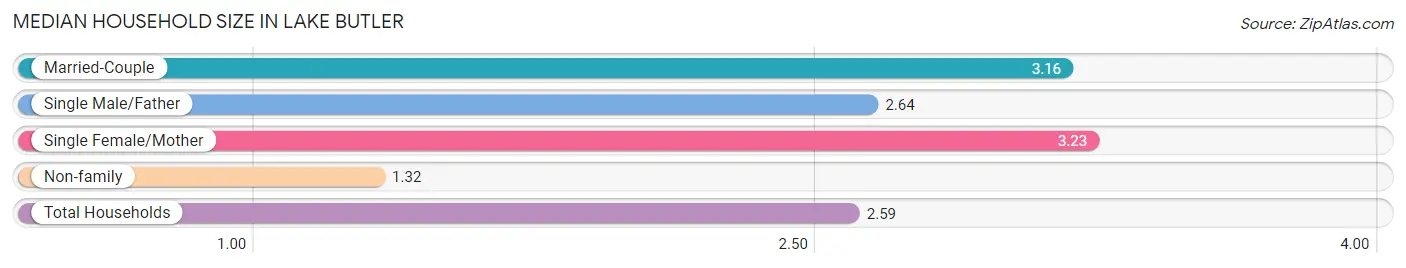
| Household Type | # Households | Household Size |
| Married-Couple | 269 (38.4%) | 3.16 |
| Single Male/Father | 39 (5.6%) | 2.64 |
| Single Female/Mother | 182 (26.0%) | 3.23 |
| Non-family | 211 (30.1%) | 1.32 |
| Total Households | 701 (100.0%) | 2.59 |
Household Size by Marriage Status in Lake Butler
Out of a total of 701 households in Lake Butler, 490 (69.9%) are family households, while 211 (30.1%) are nonfamily households. The most numerous type of family households are 3-person households, comprising 142, and the most common type of nonfamily households are 1-person households, comprising 108.
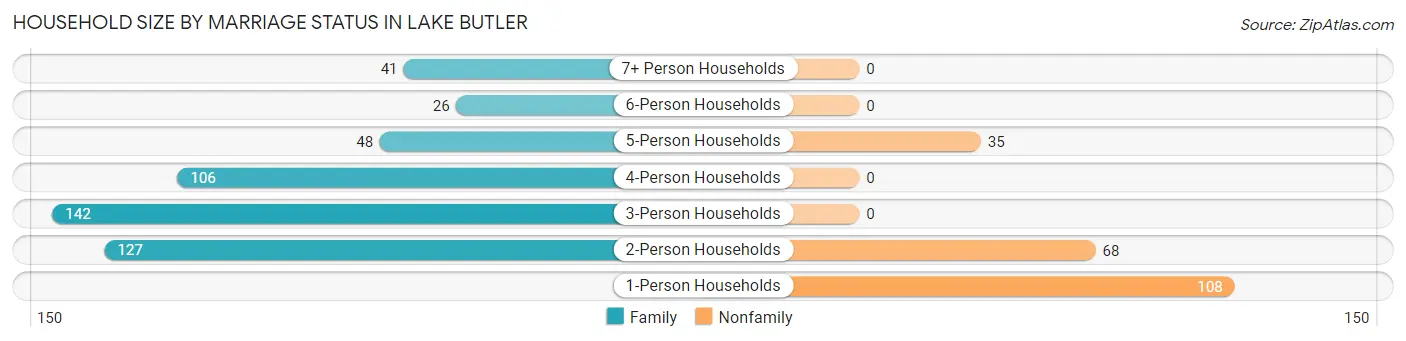
| Household Size | Family Households | Nonfamily Households |
| 1-Person Households | - | 108 (15.4%) |
| 2-Person Households | 127 (18.1%) | 68 (9.7%) |
| 3-Person Households | 142 (20.3%) | 0 (0.0%) |
| 4-Person Households | 106 (15.1%) | 0 (0.0%) |
| 5-Person Households | 48 (6.9%) | 35 (5.0%) |
| 6-Person Households | 26 (3.7%) | 0 (0.0%) |
| 7+ Person Households | 41 (5.9%) | 0 (0.0%) |
| Total | 490 (69.9%) | 211 (30.1%) |
Female Fertility in Lake Butler
Fertility by Age in Lake Butler
Average fertility rate in Lake Butler is 117.0 births per 1,000 women. Women in the age bracket of 20 to 34 years have the highest fertility rate with 213.0 births per 1,000 women. Women in the age bracket of 20 to 34 years acount for 94.4% of all women with births.
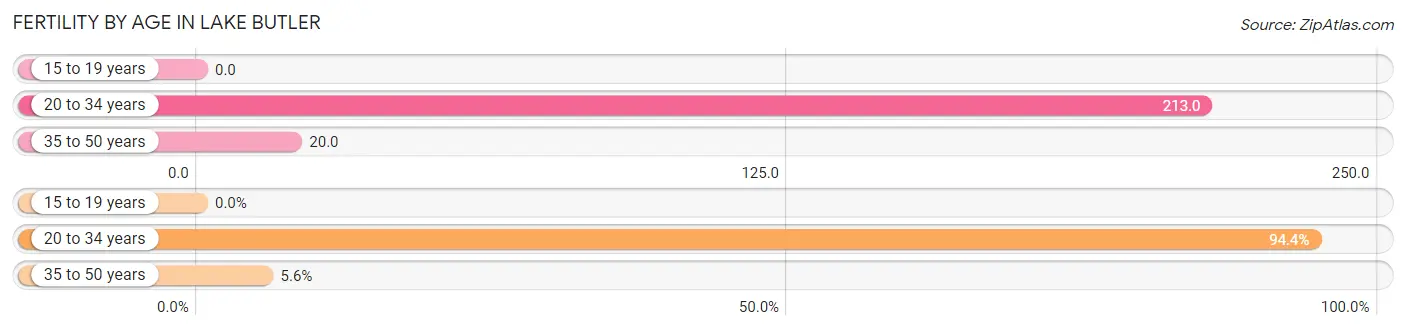
| Age Bracket | Women with Births | Births / 1,000 Women |
| 15 to 19 years | 0 (0.0%) | 0.0 |
| 20 to 34 years | 51 (94.4%) | 213.0 |
| 35 to 50 years | 3 (5.6%) | 20.0 |
| Total | 54 (100.0%) | 117.0 |
Fertility by Age by Marriage Status in Lake Butler
64.8% of women with births (54) in Lake Butler are married. The highest percentage of unmarried women with births falls into 35 to 50 years age bracket with 100.0% of them unmarried at the time of birth, while the lowest percentage of unmarried women with births belong to 20 to 34 years age bracket with 31.4% of them unmarried.
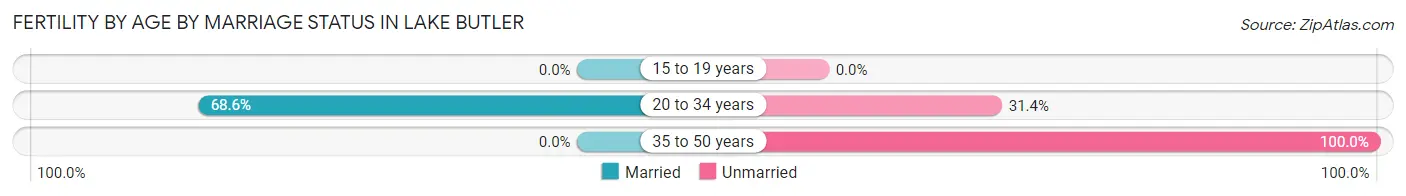
| Age Bracket | Married | Unmarried |
| 15 to 19 years | 0 (0.0%) | 0 (0.0%) |
| 20 to 34 years | 35 (68.6%) | 16 (31.4%) |
| 35 to 50 years | 0 (0.0%) | 3 (100.0%) |
| Total | 35 (64.8%) | 19 (35.2%) |
Fertility by Education in Lake Butler
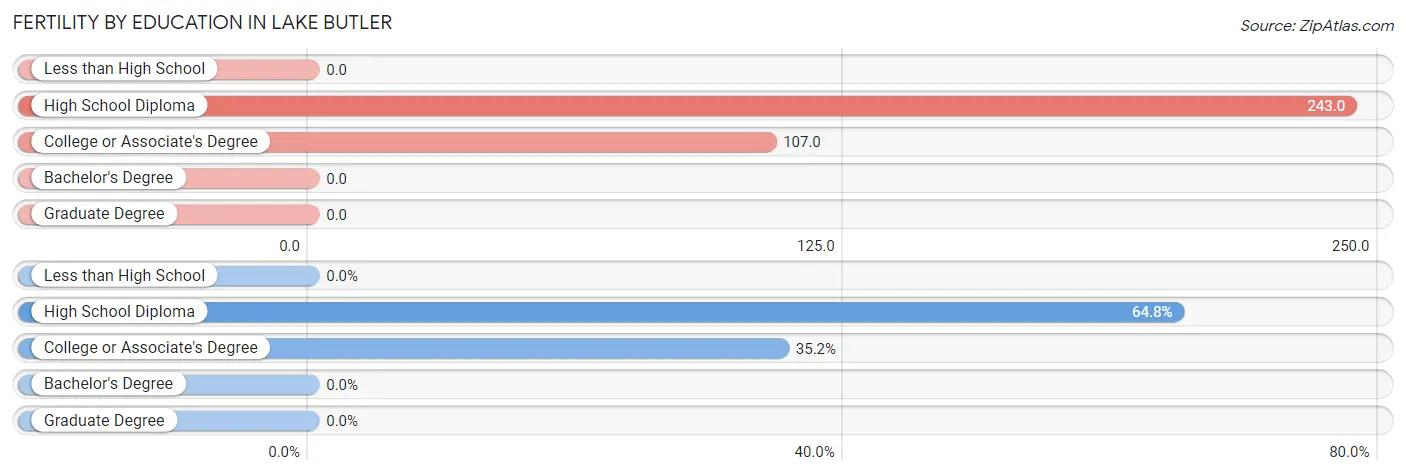
| Educational Attainment | Women with Births | Births / 1,000 Women |
| Less than High School | 0 (0.0%) | 0.0 |
| High School Diploma | 35 (64.8%) | 243.0 |
| College or Associate's Degree | 19 (35.2%) | 107.0 |
| Bachelor's Degree | 0 (0.0%) | 0.0 |
| Graduate Degree | 0 (0.0%) | 0.0 |
| Total | 54 (100.0%) | 117.0 |
Fertility by Education by Marriage Status in Lake Butler
35.2% of women with births in Lake Butler are unmarried. Women with the educational attainment of high school diploma are most likely to be married with 100.0% of them married at childbirth, while women with the educational attainment of college or associate's degree are least likely to be married with 100.0% of them unmarried at childbirth.
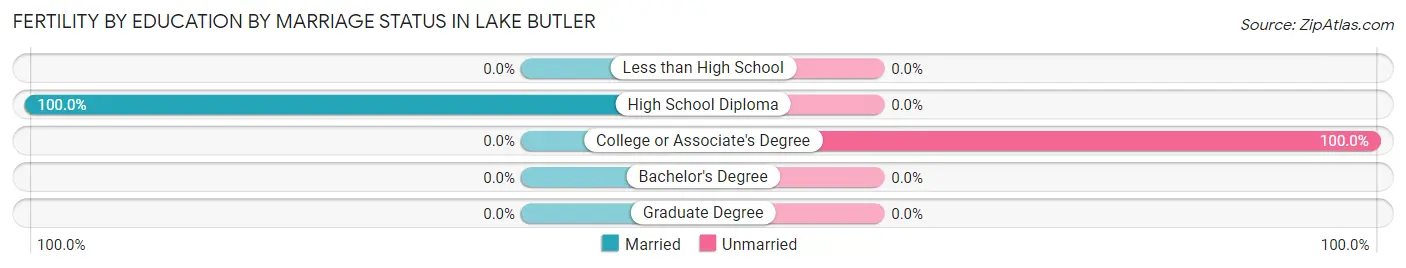
| Educational Attainment | Married | Unmarried |
| Less than High School | 0 (0.0%) | 0 (0.0%) |
| High School Diploma | 35 (100.0%) | 0 (0.0%) |
| College or Associate's Degree | 0 (0.0%) | 19 (100.0%) |
| Bachelor's Degree | 0 (0.0%) | 0 (0.0%) |
| Graduate Degree | 0 (0.0%) | 0 (0.0%) |
| Total | 35 (64.8%) | 19 (35.2%) |
Employment Characteristics in Lake Butler
Employment by Class of Employer in Lake Butler
Among the 623 employed individuals in Lake Butler, private company employees (328 | 52.6%), local government employees (101 | 16.2%), and state government employees (78 | 12.5%) make up the most common classes of employment.
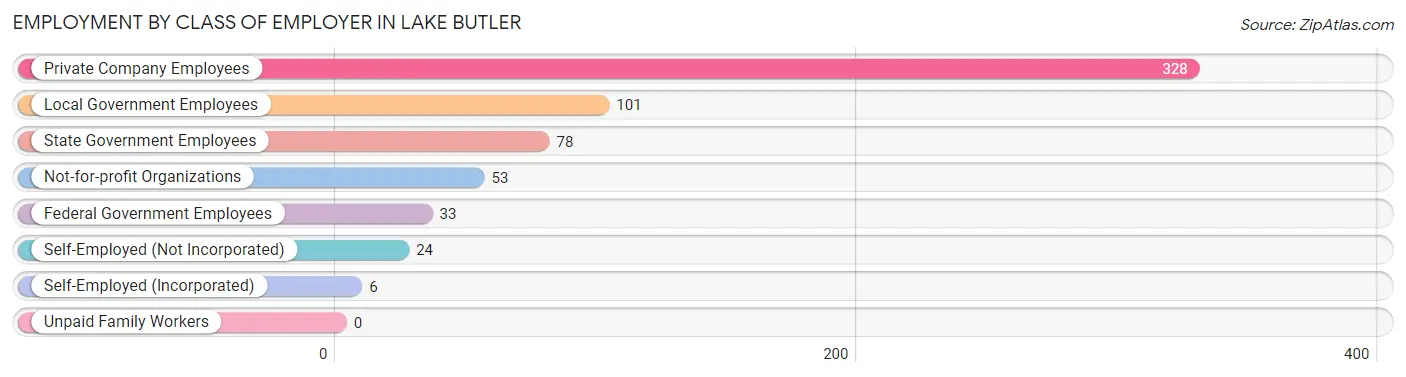
| Employer Class | # Employees | % Employees |
| Private Company Employees | 328 | 52.6% |
| Self-Employed (Incorporated) | 6 | 1.0% |
| Self-Employed (Not Incorporated) | 24 | 3.8% |
| Not-for-profit Organizations | 53 | 8.5% |
| Local Government Employees | 101 | 16.2% |
| State Government Employees | 78 | 12.5% |
| Federal Government Employees | 33 | 5.3% |
| Unpaid Family Workers | 0 | 0.0% |
| Total | 623 | 100.0% |
Employment Status by Age in Lake Butler
According to the labor force statistics for Lake Butler, out of the total population over 16 years of age (1,213), 57.1% or 693 individuals are in the labor force, with 10.0% or 69 of them unemployed. The age group with the highest labor force participation rate is 20 to 24 years, with 71.3% or 139 individuals in the labor force. Within the labor force, the 16 to 19 years age range has the highest percentage of unemployed individuals, with 44.2% or 19 of them being unemployed.
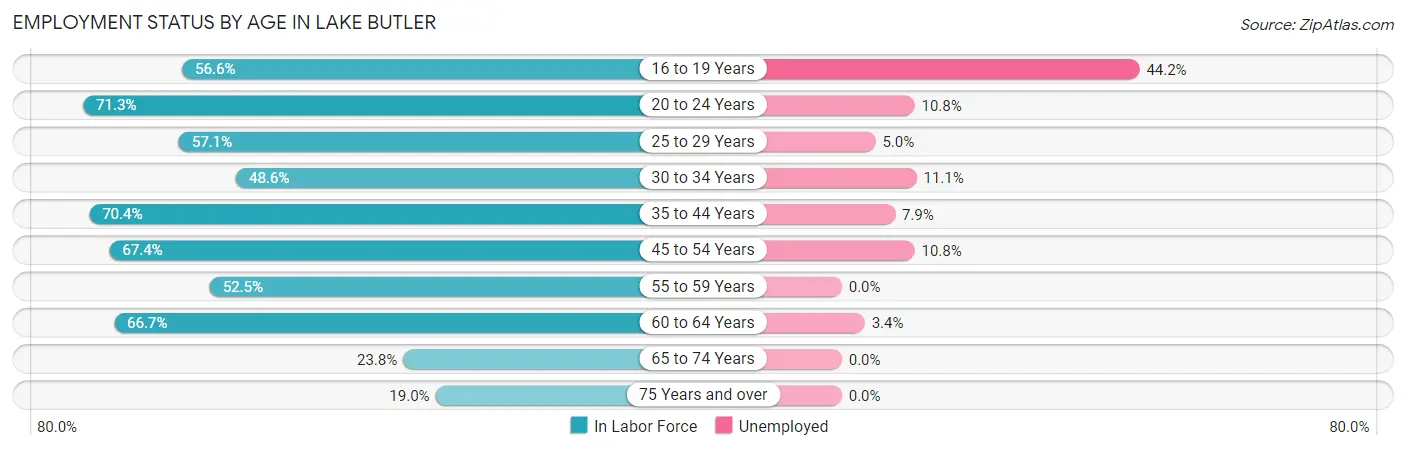
| Age Bracket | In Labor Force | Unemployed |
| 16 to 19 Years | 43 (56.6%) | 19 (44.2%) |
| 20 to 24 Years | 139 (71.3%) | 15 (10.8%) |
| 25 to 29 Years | 80 (57.1%) | 4 (5.0%) |
| 30 to 34 Years | 54 (48.6%) | 6 (11.1%) |
| 35 to 44 Years | 126 (70.4%) | 10 (7.9%) |
| 45 to 54 Years | 120 (67.4%) | 13 (10.8%) |
| 55 to 59 Years | 31 (52.5%) | 0 (0.0%) |
| 60 to 64 Years | 58 (66.7%) | 2 (3.4%) |
| 65 to 74 Years | 31 (23.8%) | 0 (0.0%) |
| 75 Years and over | 11 (19.0%) | 0 (0.0%) |
| Total | 693 (57.1%) | 69 (10.0%) |
Employment Status by Educational Attainment in Lake Butler
According to labor force statistics for Lake Butler, 62.2% of individuals (469) out of the total population between 25 and 64 years of age (754) are in the labor force, with 7.5% or 35 of them being unemployed. The group with the highest labor force participation rate are those with the educational attainment of bachelor's degree or higher, with 92.2% or 95 individuals in the labor force. Within the labor force, individuals with less than high school education have the highest percentage of unemployment, with 75.0% or 6 of them being unemployed.
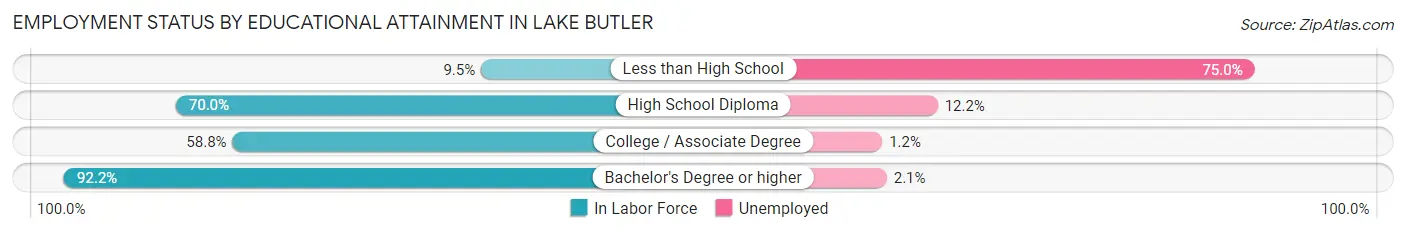
| Educational Attainment | In Labor Force | Unemployed |
| Less than High School | 8 (9.5%) | 63 (75.0%) |
| High School Diploma | 205 (70.0%) | 36 (12.2%) |
| College / Associate Degree | 161 (58.8%) | 3 (1.2%) |
| Bachelor's Degree or higher | 95 (92.2%) | 2 (2.1%) |
| Total | 469 (62.2%) | 57 (7.5%) |
Employment Occupations by Sex in Lake Butler
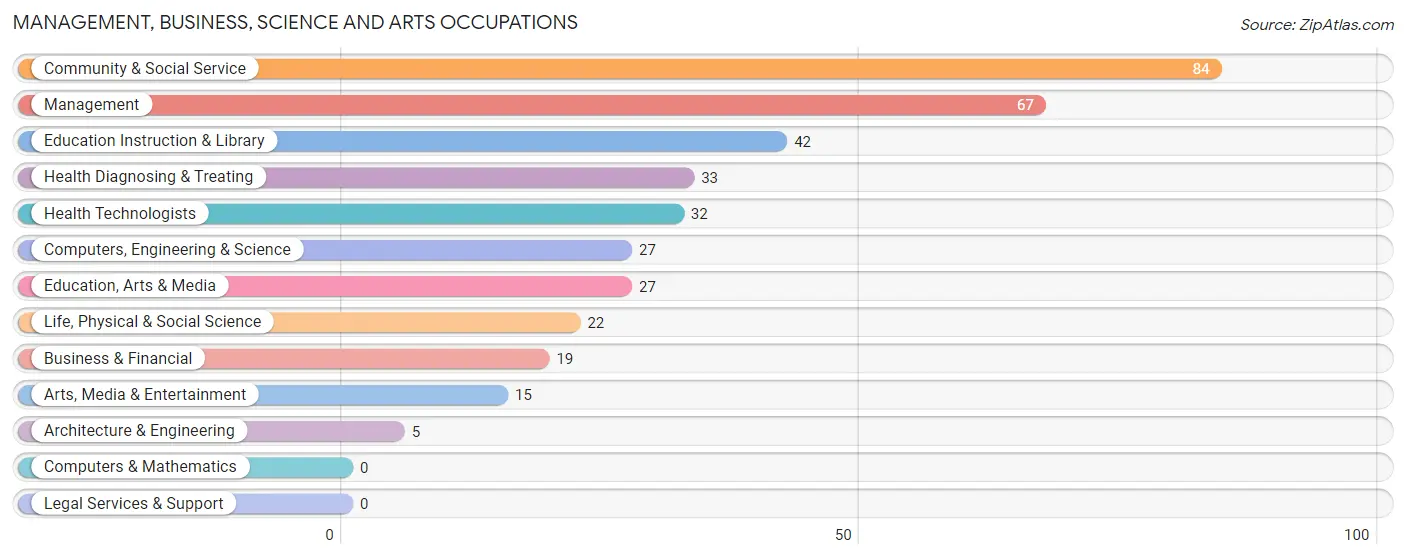
Management, Business, Science and Arts Occupations
The most common Management, Business, Science and Arts occupations in Lake Butler are Community & Social Service (84 | 13.5%), Management (67 | 10.7%), Education Instruction & Library (42 | 6.7%), Health Diagnosing & Treating (33 | 5.3%), and Health Technologists (32 | 5.1%).
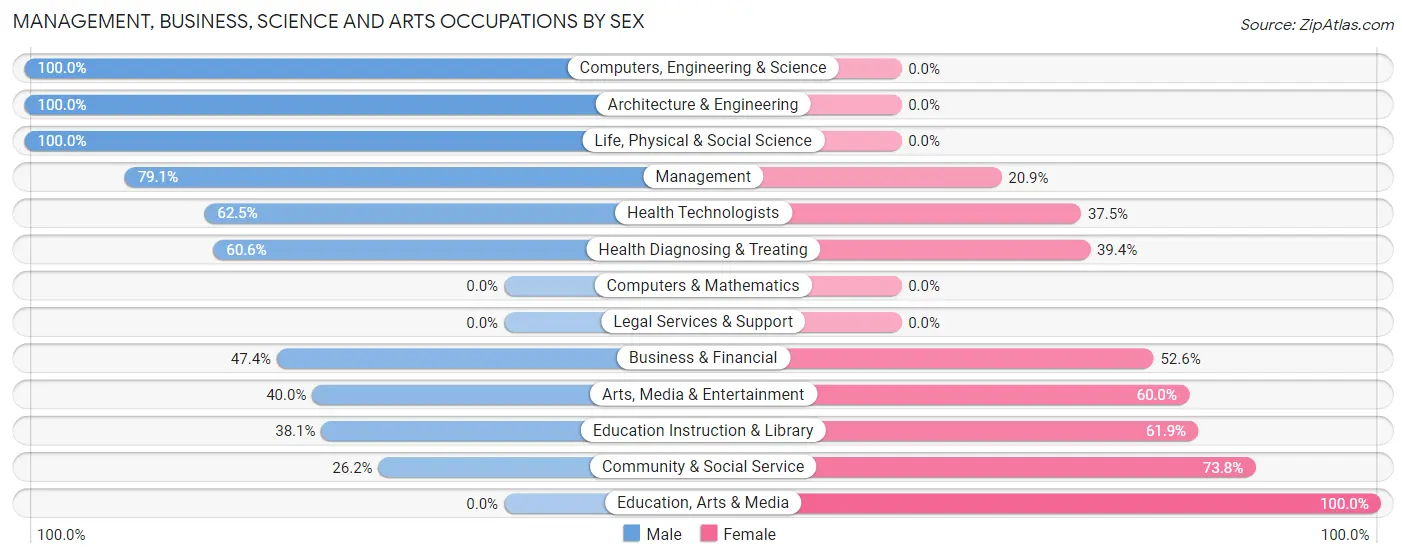
Management, Business, Science and Arts Occupations by Sex
Within the Management, Business, Science and Arts occupations in Lake Butler, the most male-oriented occupations are Computers, Engineering & Science (100.0%), Architecture & Engineering (100.0%), and Life, Physical & Social Science (100.0%), while the most female-oriented occupations are Education, Arts & Media (100.0%), Community & Social Service (73.8%), and Education Instruction & Library (61.9%).
| Occupation | Male | Female |
| Management | 53 (79.1%) | 14 (20.9%) |
| Business & Financial | 9 (47.4%) | 10 (52.6%) |
| Computers, Engineering & Science | 27 (100.0%) | 0 (0.0%) |
| Computers & Mathematics | 0 (0.0%) | 0 (0.0%) |
| Architecture & Engineering | 5 (100.0%) | 0 (0.0%) |
| Life, Physical & Social Science | 22 (100.0%) | 0 (0.0%) |
| Community & Social Service | 22 (26.2%) | 62 (73.8%) |
| Education, Arts & Media | 0 (0.0%) | 27 (100.0%) |
| Legal Services & Support | 0 (0.0%) | 0 (0.0%) |
| Education Instruction & Library | 16 (38.1%) | 26 (61.9%) |
| Arts, Media & Entertainment | 6 (40.0%) | 9 (60.0%) |
| Health Diagnosing & Treating | 20 (60.6%) | 13 (39.4%) |
| Health Technologists | 20 (62.5%) | 12 (37.5%) |
| Total (Category) | 131 (57.0%) | 99 (43.0%) |
| Total (Overall) | 370 (59.3%) | 254 (40.7%) |
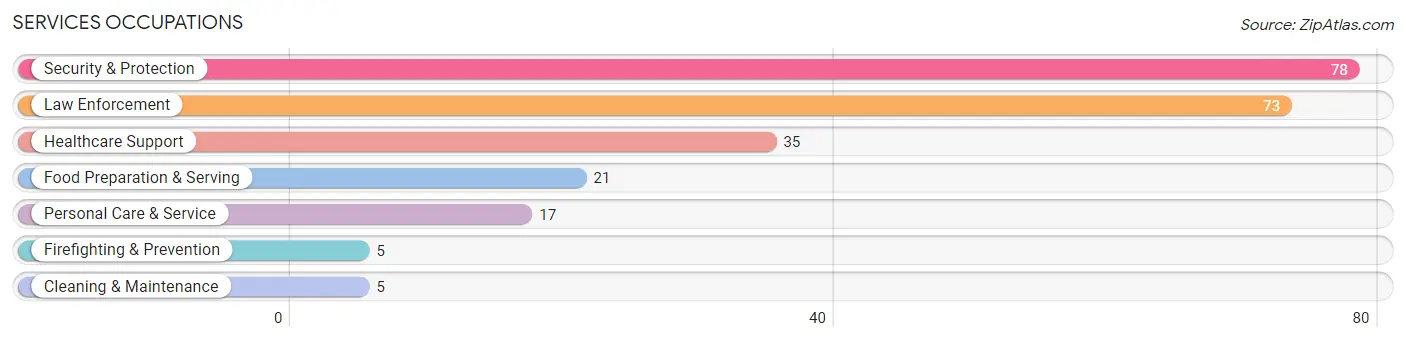
Services Occupations
The most common Services occupations in Lake Butler are Security & Protection (78 | 12.5%), Law Enforcement (73 | 11.7%), Healthcare Support (35 | 5.6%), Food Preparation & Serving (21 | 3.4%), and Personal Care & Service (17 | 2.7%).
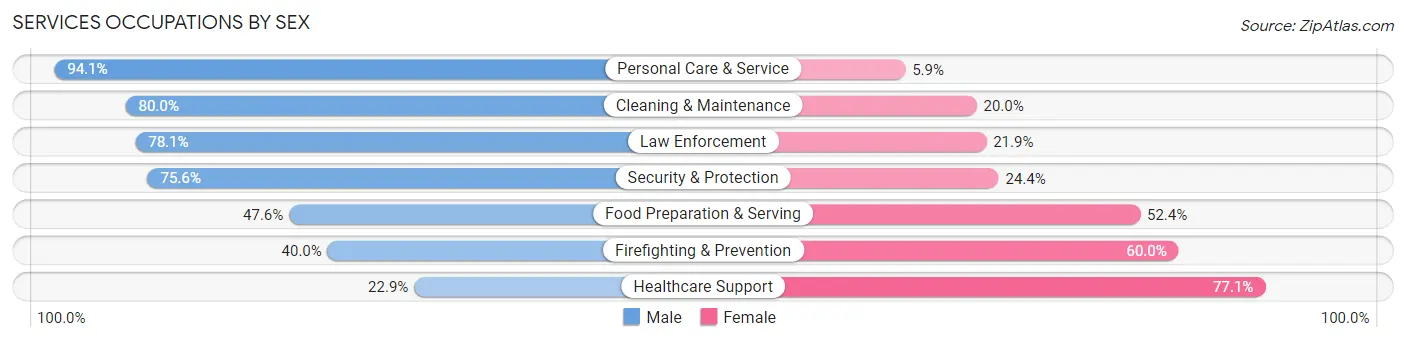
Services Occupations by Sex
Within the Services occupations in Lake Butler, the most male-oriented occupations are Personal Care & Service (94.1%), Cleaning & Maintenance (80.0%), and Law Enforcement (78.1%), while the most female-oriented occupations are Healthcare Support (77.1%), Firefighting & Prevention (60.0%), and Food Preparation & Serving (52.4%).
| Occupation | Male | Female |
| Healthcare Support | 8 (22.9%) | 27 (77.1%) |
| Security & Protection | 59 (75.6%) | 19 (24.4%) |
| Firefighting & Prevention | 2 (40.0%) | 3 (60.0%) |
| Law Enforcement | 57 (78.1%) | 16 (21.9%) |
| Food Preparation & Serving | 10 (47.6%) | 11 (52.4%) |
| Cleaning & Maintenance | 4 (80.0%) | 1 (20.0%) |
| Personal Care & Service | 16 (94.1%) | 1 (5.9%) |
| Total (Category) | 97 (62.2%) | 59 (37.8%) |
| Total (Overall) | 370 (59.3%) | 254 (40.7%) |
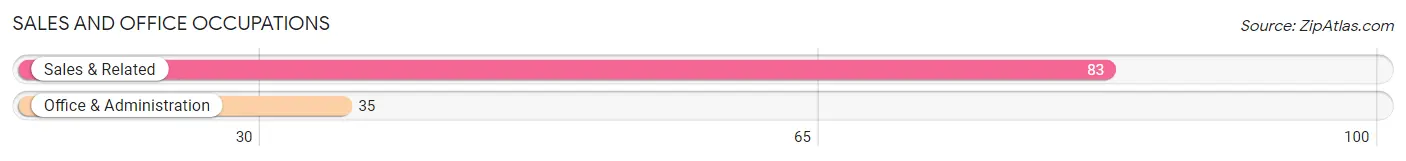
Sales and Office Occupations
The most common Sales and Office occupations in Lake Butler are Sales & Related (83 | 13.3%), and Office & Administration (35 | 5.6%).
Sales and Office Occupations by Sex
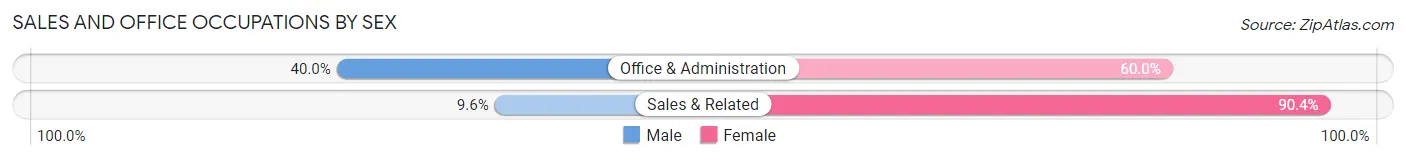
| Occupation | Male | Female |
| Sales & Related | 8 (9.6%) | 75 (90.4%) |
| Office & Administration | 14 (40.0%) | 21 (60.0%) |
| Total (Category) | 22 (18.6%) | 96 (81.4%) |
| Total (Overall) | 370 (59.3%) | 254 (40.7%) |
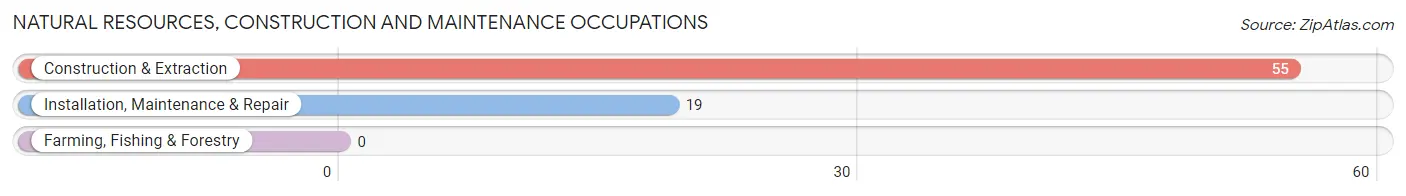
Natural Resources, Construction and Maintenance Occupations
The most common Natural Resources, Construction and Maintenance occupations in Lake Butler are Construction & Extraction (55 | 8.8%), and Installation, Maintenance & Repair (19 | 3.0%).
Natural Resources, Construction and Maintenance Occupations by Sex
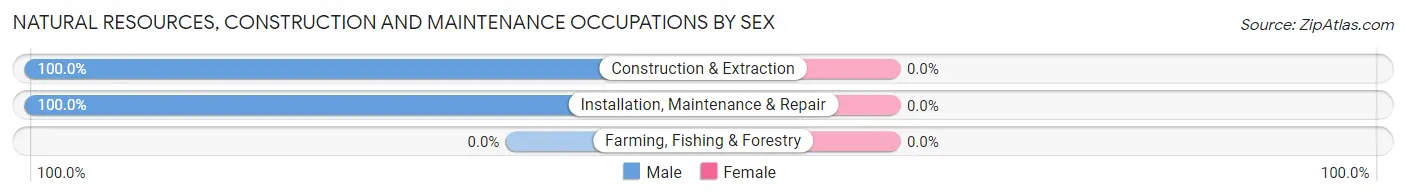
| Occupation | Male | Female |
| Farming, Fishing & Forestry | 0 (0.0%) | 0 (0.0%) |
| Construction & Extraction | 55 (100.0%) | 0 (0.0%) |
| Installation, Maintenance & Repair | 19 (100.0%) | 0 (0.0%) |
| Total (Category) | 74 (100.0%) | 0 (0.0%) |
| Total (Overall) | 370 (59.3%) | 254 (40.7%) |
Production, Transportation and Moving Occupations
The most common Production, Transportation and Moving occupations in Lake Butler are Material Moving (34 | 5.4%), Transportation (10 | 1.6%), and Production (2 | 0.3%).
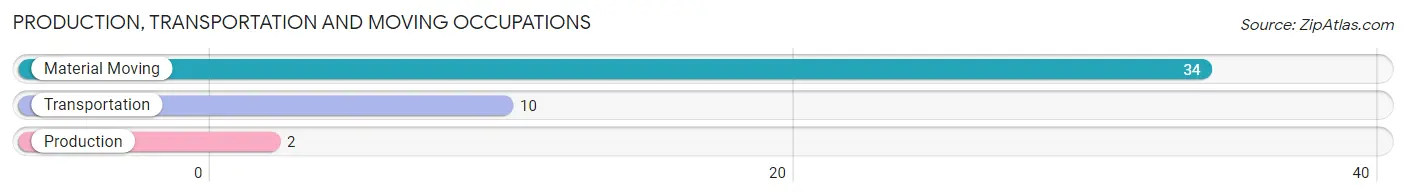
Production, Transportation and Moving Occupations by Sex
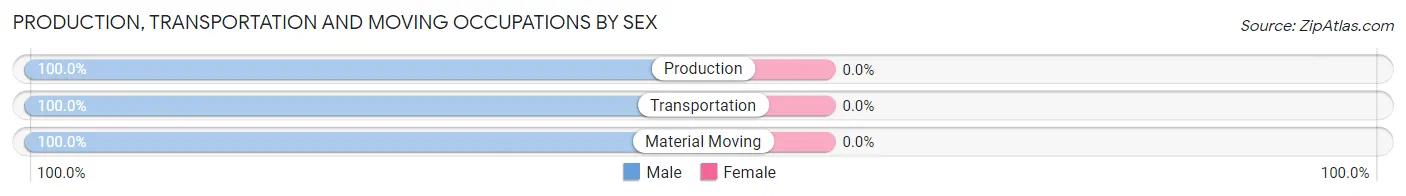
| Occupation | Male | Female |
| Production | 2 (100.0%) | 0 (0.0%) |
| Transportation | 10 (100.0%) | 0 (0.0%) |
| Material Moving | 34 (100.0%) | 0 (0.0%) |
| Total (Category) | 46 (100.0%) | 0 (0.0%) |
| Total (Overall) | 370 (59.3%) | 254 (40.7%) |
Employment Industries by Sex in Lake Butler
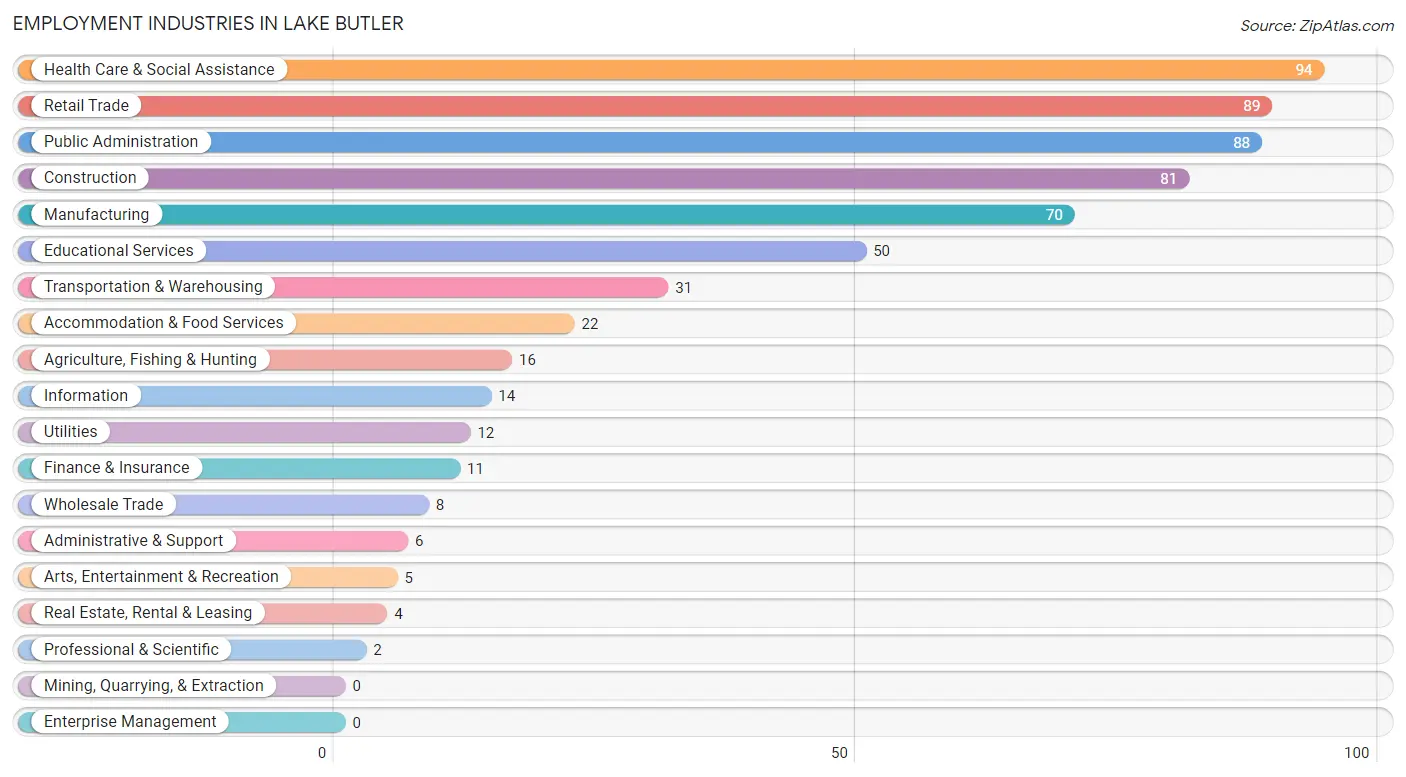
Employment Industries in Lake Butler
The major employment industries in Lake Butler include Health Care & Social Assistance (94 | 15.1%), Retail Trade (89 | 14.3%), Public Administration (88 | 14.1%), Construction (81 | 13.0%), and Manufacturing (70 | 11.2%).
Employment Industries by Sex in Lake Butler
The Lake Butler industries that see more men than women are Agriculture, Fishing & Hunting (100.0%), Manufacturing (100.0%), and Transportation & Warehousing (100.0%), whereas the industries that tend to have a higher number of women are Information (100.0%), Finance & Insurance (90.9%), and Retail Trade (88.8%).
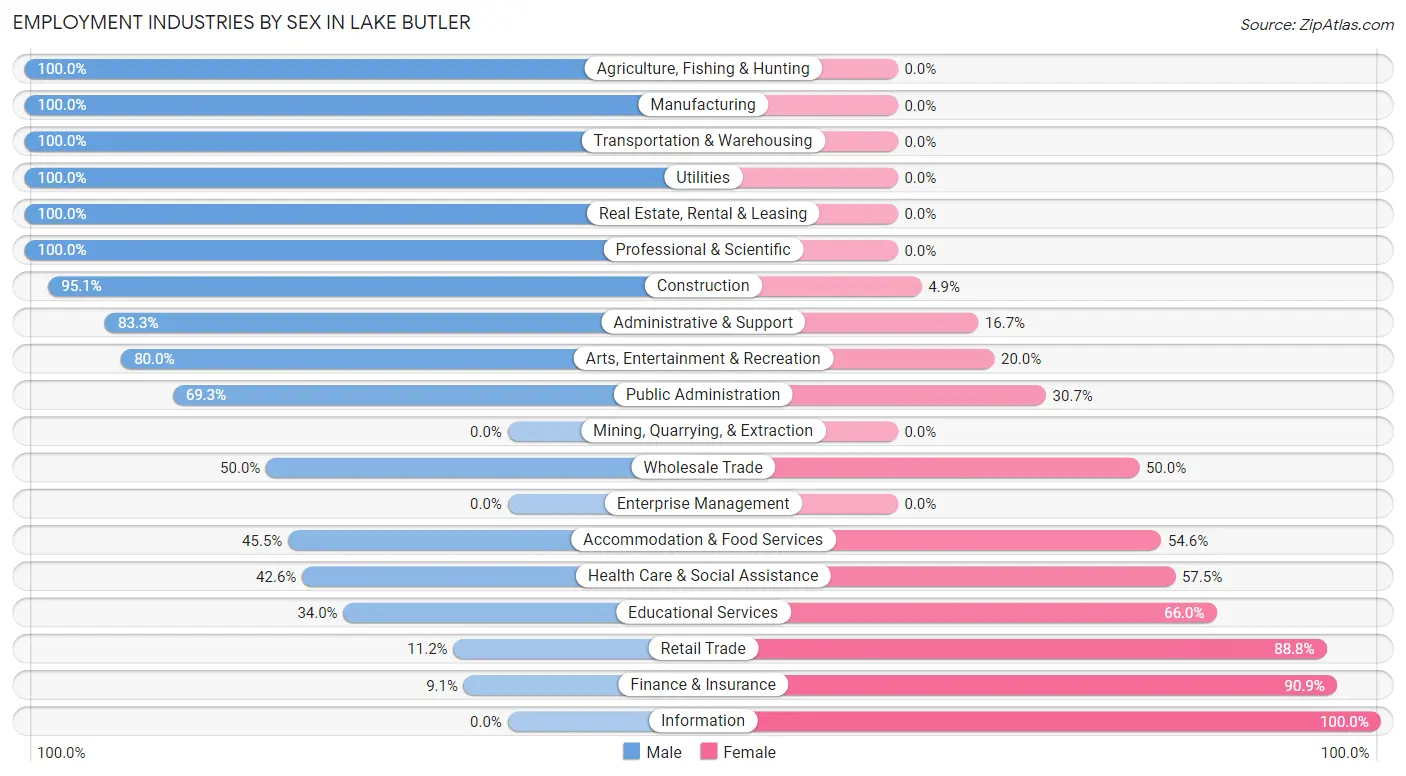
| Industry | Male | Female |
| Agriculture, Fishing & Hunting | 16 (100.0%) | 0 (0.0%) |
| Mining, Quarrying, & Extraction | 0 (0.0%) | 0 (0.0%) |
| Construction | 77 (95.1%) | 4 (4.9%) |
| Manufacturing | 70 (100.0%) | 0 (0.0%) |
| Wholesale Trade | 4 (50.0%) | 4 (50.0%) |
| Retail Trade | 10 (11.2%) | 79 (88.8%) |
| Transportation & Warehousing | 31 (100.0%) | 0 (0.0%) |
| Utilities | 12 (100.0%) | 0 (0.0%) |
| Information | 0 (0.0%) | 14 (100.0%) |
| Finance & Insurance | 1 (9.1%) | 10 (90.9%) |
| Real Estate, Rental & Leasing | 4 (100.0%) | 0 (0.0%) |
| Professional & Scientific | 2 (100.0%) | 0 (0.0%) |
| Enterprise Management | 0 (0.0%) | 0 (0.0%) |
| Administrative & Support | 5 (83.3%) | 1 (16.7%) |
| Educational Services | 17 (34.0%) | 33 (66.0%) |
| Health Care & Social Assistance | 40 (42.5%) | 54 (57.5%) |
| Arts, Entertainment & Recreation | 4 (80.0%) | 1 (20.0%) |
| Accommodation & Food Services | 10 (45.5%) | 12 (54.5%) |
| Public Administration | 61 (69.3%) | 27 (30.7%) |
| Total | 370 (59.3%) | 254 (40.7%) |
Education in Lake Butler
School Enrollment in Lake Butler
The most common levels of schooling among the 598 students in Lake Butler are elementary school (175 | 29.3%), middle school (175 | 29.3%), and high school (89 | 14.9%).
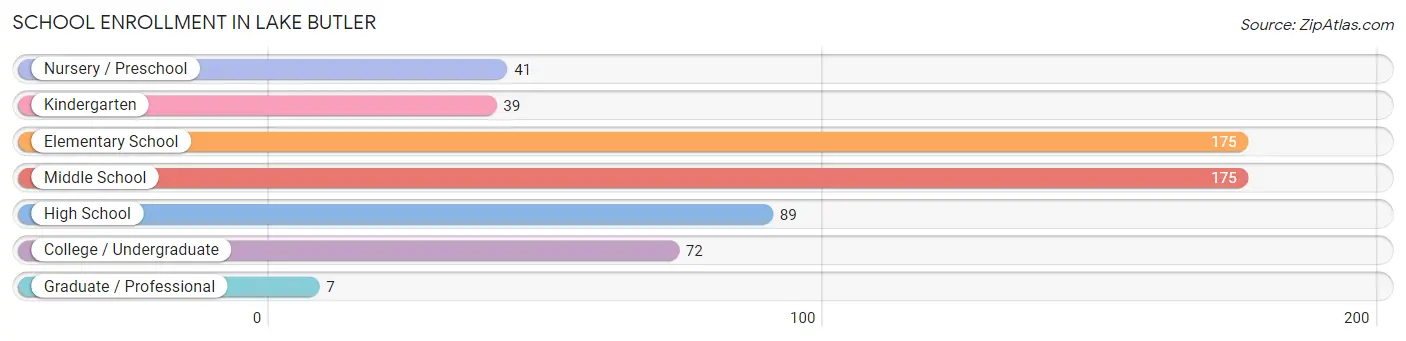
| School Level | # Students | % Students |
| Nursery / Preschool | 41 | 6.9% |
| Kindergarten | 39 | 6.5% |
| Elementary School | 175 | 29.3% |
| Middle School | 175 | 29.3% |
| High School | 89 | 14.9% |
| College / Undergraduate | 72 | 12.0% |
| Graduate / Professional | 7 | 1.2% |
| Total | 598 | 100.0% |
School Enrollment by Age by Funding Source in Lake Butler
Out of a total of 598 students who are enrolled in schools in Lake Butler, 88 (14.7%) attend a private institution, while the remaining 510 (85.3%) are enrolled in public schools. The age group of 25 to 34 year olds has the highest likelihood of being enrolled in private schools, with 7 (29.2% in the age bracket) enrolled. Conversely, the age group of 3 to 4 year olds has the lowest likelihood of being enrolled in a private school, with 22 (100.0% in the age bracket) attending a public institution.
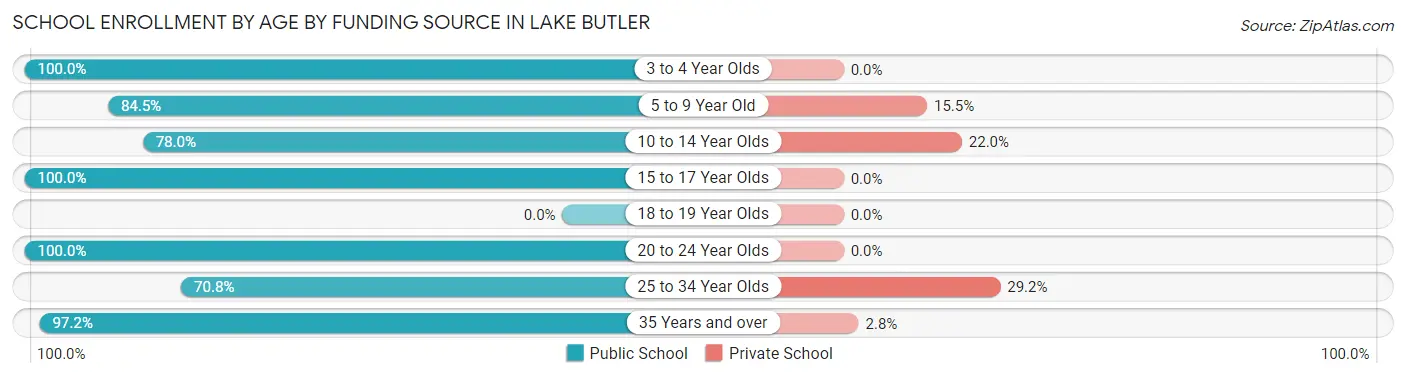
| Age Bracket | Public School | Private School |
| 3 to 4 Year Olds | 22 (100.0%) | 0 (0.0%) |
| 5 to 9 Year Old | 185 (84.5%) | 34 (15.5%) |
| 10 to 14 Year Olds | 163 (78.0%) | 46 (22.0%) |
| 15 to 17 Year Olds | 68 (100.0%) | 0 (0.0%) |
| 18 to 19 Year Olds | 0 (0.0%) | 0 (0.0%) |
| 20 to 24 Year Olds | 20 (100.0%) | 0 (0.0%) |
| 25 to 34 Year Olds | 17 (70.8%) | 7 (29.2%) |
| 35 Years and over | 35 (97.2%) | 1 (2.8%) |
| Total | 510 (85.3%) | 88 (14.7%) |
Educational Attainment by Field of Study in Lake Butler
Business (41 | 29.5%), education (22 | 15.8%), science & technology (21 | 15.1%), engineering (18 | 13.0%), and communications (13 | 9.3%) are the most common fields of study among 139 individuals in Lake Butler who have obtained a bachelor's degree or higher.
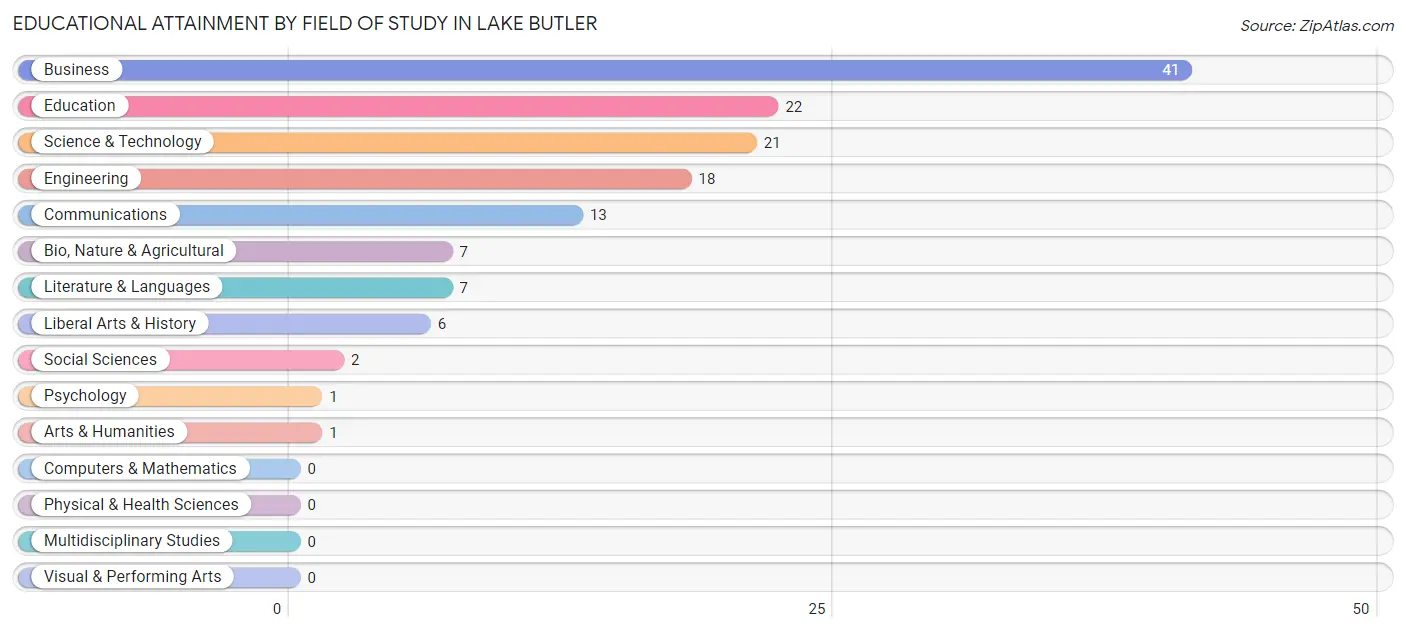
| Field of Study | # Graduates | % Graduates |
| Computers & Mathematics | 0 | 0.0% |
| Bio, Nature & Agricultural | 7 | 5.0% |
| Physical & Health Sciences | 0 | 0.0% |
| Psychology | 1 | 0.7% |
| Social Sciences | 2 | 1.4% |
| Engineering | 18 | 13.0% |
| Multidisciplinary Studies | 0 | 0.0% |
| Science & Technology | 21 | 15.1% |
| Business | 41 | 29.5% |
| Education | 22 | 15.8% |
| Literature & Languages | 7 | 5.0% |
| Liberal Arts & History | 6 | 4.3% |
| Visual & Performing Arts | 0 | 0.0% |
| Communications | 13 | 9.3% |
| Arts & Humanities | 1 | 0.7% |
| Total | 139 | 100.0% |
Transportation & Commute in Lake Butler
Vehicle Availability by Sex in Lake Butler
The most prevalent vehicle ownership categories in Lake Butler are males with 2 vehicles (151, accounting for 40.9%) and females with 2 vehicles (105, making up 59.5%).
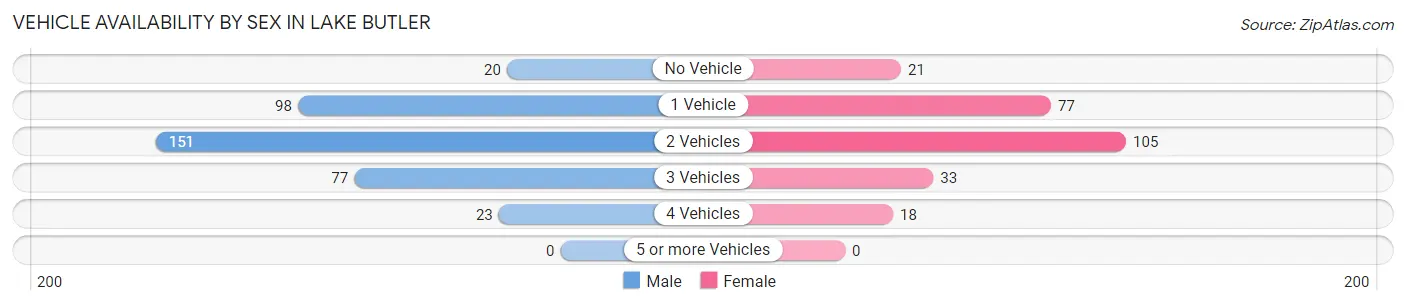
| Vehicles Available | Male | Female |
| No Vehicle | 20 (5.4%) | 21 (8.3%) |
| 1 Vehicle | 98 (26.6%) | 77 (30.3%) |
| 2 Vehicles | 151 (40.9%) | 105 (41.3%) |
| 3 Vehicles | 77 (20.9%) | 33 (13.0%) |
| 4 Vehicles | 23 (6.2%) | 18 (7.1%) |
| 5 or more Vehicles | 0 (0.0%) | 0 (0.0%) |
| Total | 369 (100.0%) | 254 (100.0%) |
Commute Time in Lake Butler
The most frequently occuring commute durations in Lake Butler are 5 to 9 minutes (182 commuters, 31.1%), 10 to 14 minutes (73 commuters, 12.5%), and 45 to 59 minutes (54 commuters, 9.2%).
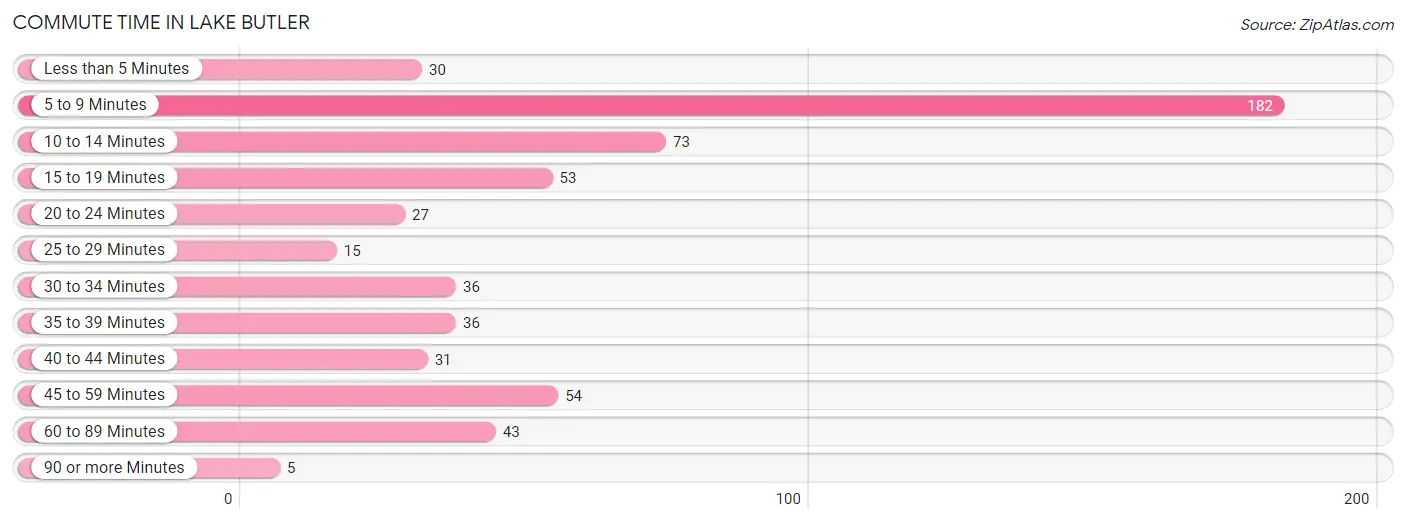
| Commute Time | # Commuters | % Commuters |
| Less than 5 Minutes | 30 | 5.1% |
| 5 to 9 Minutes | 182 | 31.1% |
| 10 to 14 Minutes | 73 | 12.5% |
| 15 to 19 Minutes | 53 | 9.1% |
| 20 to 24 Minutes | 27 | 4.6% |
| 25 to 29 Minutes | 15 | 2.6% |
| 30 to 34 Minutes | 36 | 6.1% |
| 35 to 39 Minutes | 36 | 6.1% |
| 40 to 44 Minutes | 31 | 5.3% |
| 45 to 59 Minutes | 54 | 9.2% |
| 60 to 89 Minutes | 43 | 7.3% |
| 90 or more Minutes | 5 | 0.9% |
Commute Time by Sex in Lake Butler
The most common commute times in Lake Butler are 5 to 9 minutes (116 commuters, 32.1%) for males and 5 to 9 minutes (66 commuters, 29.5%) for females.
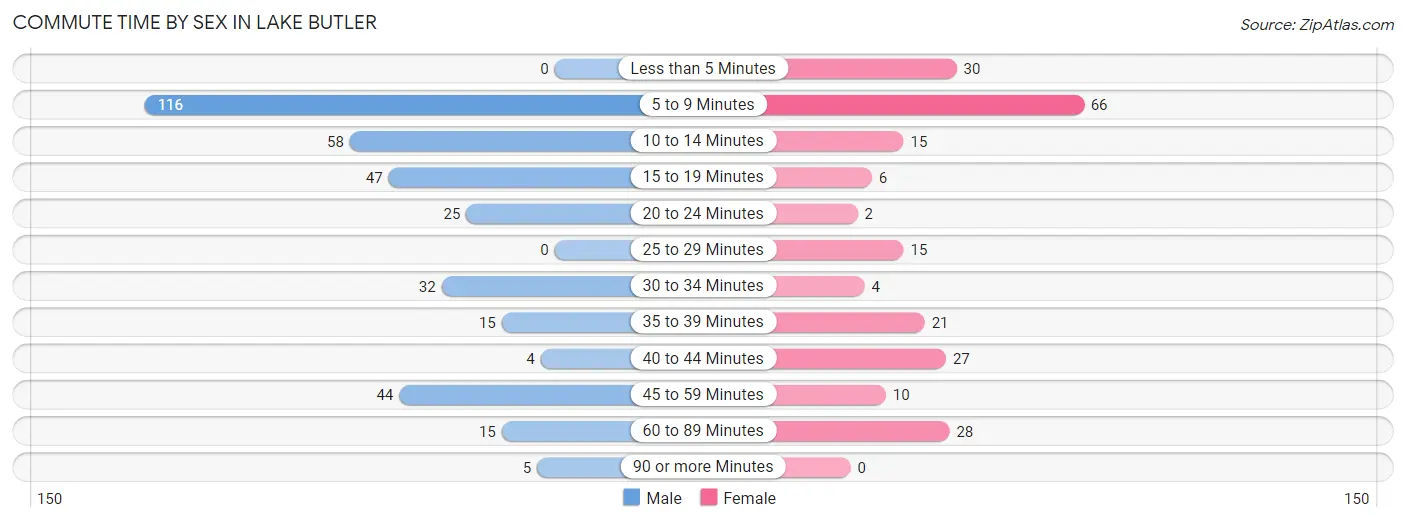
| Commute Time | Male | Female |
| Less than 5 Minutes | 0 (0.0%) | 30 (13.4%) |
| 5 to 9 Minutes | 116 (32.1%) | 66 (29.5%) |
| 10 to 14 Minutes | 58 (16.1%) | 15 (6.7%) |
| 15 to 19 Minutes | 47 (13.0%) | 6 (2.7%) |
| 20 to 24 Minutes | 25 (6.9%) | 2 (0.9%) |
| 25 to 29 Minutes | 0 (0.0%) | 15 (6.7%) |
| 30 to 34 Minutes | 32 (8.9%) | 4 (1.8%) |
| 35 to 39 Minutes | 15 (4.2%) | 21 (9.4%) |
| 40 to 44 Minutes | 4 (1.1%) | 27 (12.0%) |
| 45 to 59 Minutes | 44 (12.2%) | 10 (4.5%) |
| 60 to 89 Minutes | 15 (4.2%) | 28 (12.5%) |
| 90 or more Minutes | 5 (1.4%) | 0 (0.0%) |
Time of Departure to Work by Sex in Lake Butler
The most frequent times of departure to work in Lake Butler are 7:00 AM to 7:29 AM (60, 16.6%) for males and 7:30 AM to 7:59 AM (82, 36.6%) for females.
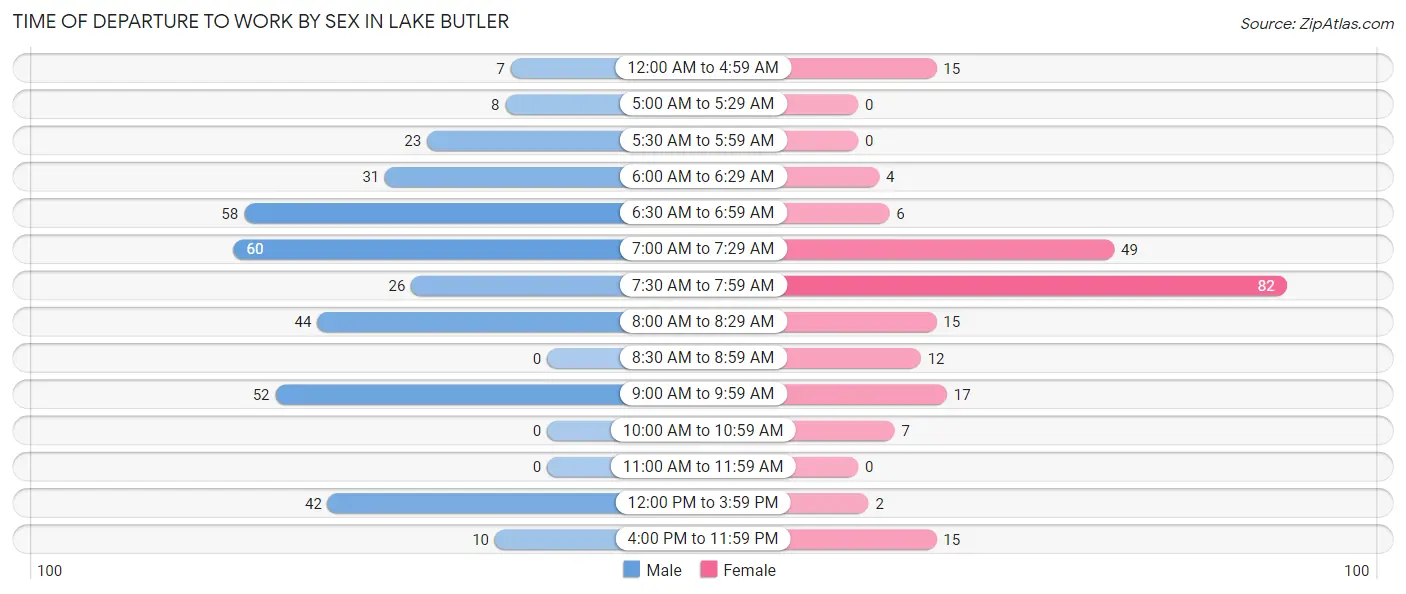
| Time of Departure | Male | Female |
| 12:00 AM to 4:59 AM | 7 (1.9%) | 15 (6.7%) |
| 5:00 AM to 5:29 AM | 8 (2.2%) | 0 (0.0%) |
| 5:30 AM to 5:59 AM | 23 (6.4%) | 0 (0.0%) |
| 6:00 AM to 6:29 AM | 31 (8.6%) | 4 (1.8%) |
| 6:30 AM to 6:59 AM | 58 (16.1%) | 6 (2.7%) |
| 7:00 AM to 7:29 AM | 60 (16.6%) | 49 (21.9%) |
| 7:30 AM to 7:59 AM | 26 (7.2%) | 82 (36.6%) |
| 8:00 AM to 8:29 AM | 44 (12.2%) | 15 (6.7%) |
| 8:30 AM to 8:59 AM | 0 (0.0%) | 12 (5.4%) |
| 9:00 AM to 9:59 AM | 52 (14.4%) | 17 (7.6%) |
| 10:00 AM to 10:59 AM | 0 (0.0%) | 7 (3.1%) |
| 11:00 AM to 11:59 AM | 0 (0.0%) | 0 (0.0%) |
| 12:00 PM to 3:59 PM | 42 (11.6%) | 2 (0.9%) |
| 4:00 PM to 11:59 PM | 10 (2.8%) | 15 (6.7%) |
| Total | 361 (100.0%) | 224 (100.0%) |
Housing Occupancy in Lake Butler
Occupancy by Ownership in Lake Butler
Of the total 701 dwellings in Lake Butler, owner-occupied units account for 274 (39.1%), while renter-occupied units make up 427 (60.9%).
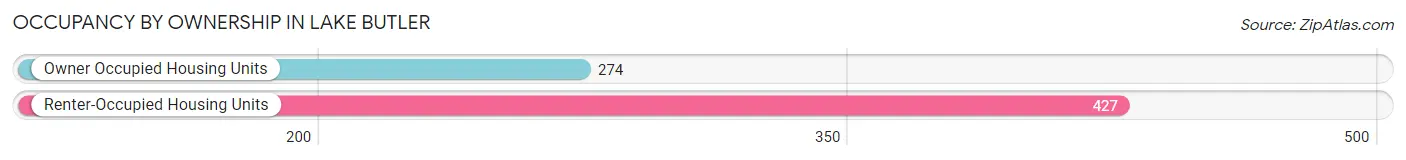
| Occupancy | # Housing Units | % Housing Units |
| Owner Occupied Housing Units | 274 | 39.1% |
| Renter-Occupied Housing Units | 427 | 60.9% |
| Total Occupied Housing Units | 701 | 100.0% |
Occupancy by Household Size in Lake Butler
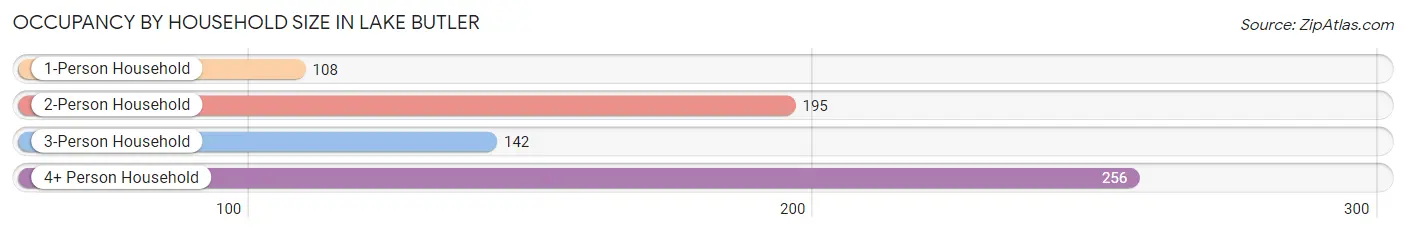
| Household Size | # Housing Units | % Housing Units |
| 1-Person Household | 108 | 15.4% |
| 2-Person Household | 195 | 27.8% |
| 3-Person Household | 142 | 20.3% |
| 4+ Person Household | 256 | 36.5% |
| Total Housing Units | 701 | 100.0% |
Occupancy by Ownership by Household Size in Lake Butler
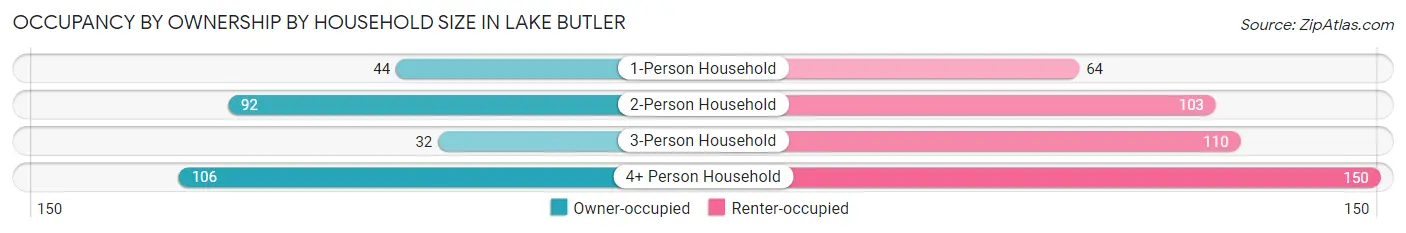
| Household Size | Owner-occupied | Renter-occupied |
| 1-Person Household | 44 (40.7%) | 64 (59.3%) |
| 2-Person Household | 92 (47.2%) | 103 (52.8%) |
| 3-Person Household | 32 (22.5%) | 110 (77.5%) |
| 4+ Person Household | 106 (41.4%) | 150 (58.6%) |
| Total Housing Units | 274 (39.1%) | 427 (60.9%) |
Occupancy by Educational Attainment in Lake Butler
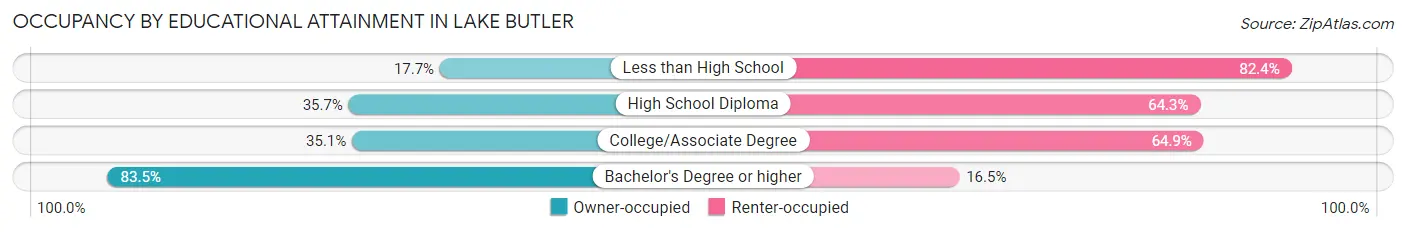
| Household Size | Owner-occupied | Renter-occupied |
| Less than High School | 15 (17.6%) | 70 (82.4%) |
| High School Diploma | 94 (35.7%) | 169 (64.3%) |
| College/Associate Degree | 94 (35.1%) | 174 (64.9%) |
| Bachelor's Degree or higher | 71 (83.5%) | 14 (16.5%) |
Occupancy by Age of Householder in Lake Butler
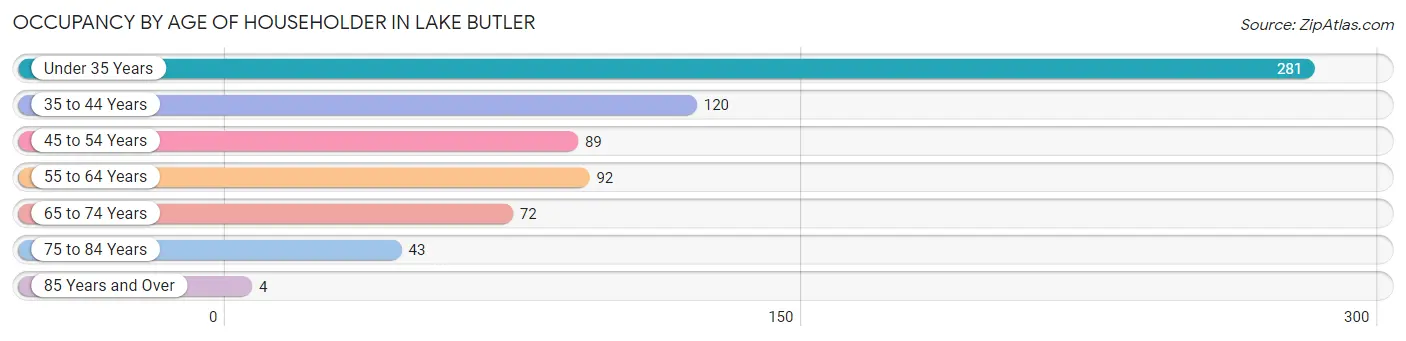
| Age Bracket | # Households | % Households |
| Under 35 Years | 281 | 40.1% |
| 35 to 44 Years | 120 | 17.1% |
| 45 to 54 Years | 89 | 12.7% |
| 55 to 64 Years | 92 | 13.1% |
| 65 to 74 Years | 72 | 10.3% |
| 75 to 84 Years | 43 | 6.1% |
| 85 Years and Over | 4 | 0.6% |
| Total | 701 | 100.0% |
Housing Finances in Lake Butler
Median Income by Occupancy in Lake Butler
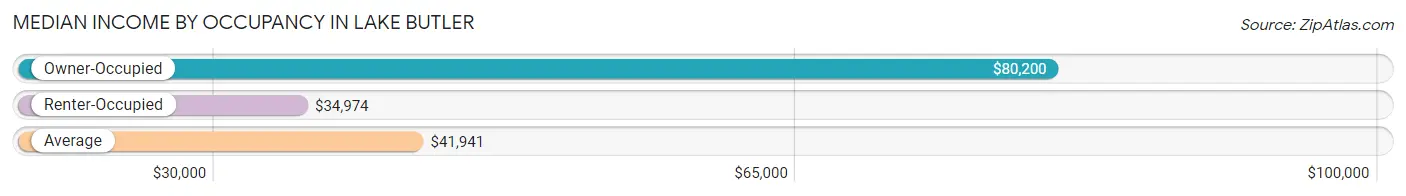
| Occupancy Type | # Households | Median Income |
| Owner-Occupied | 274 (39.1%) | $80,200 |
| Renter-Occupied | 427 (60.9%) | $34,974 |
| Average | 701 (100.0%) | $41,941 |
Occupancy by Householder Income Bracket in Lake Butler
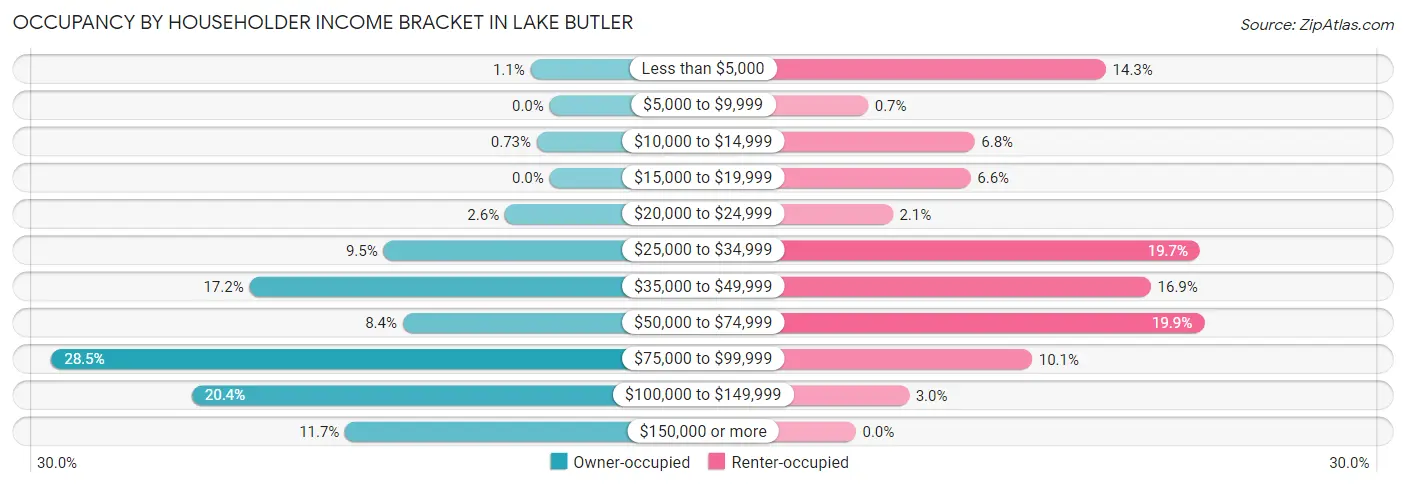
| Income Bracket | Owner-occupied | Renter-occupied |
| Less than $5,000 | 3 (1.1%) | 61 (14.3%) |
| $5,000 to $9,999 | 0 (0.0%) | 3 (0.7%) |
| $10,000 to $14,999 | 2 (0.7%) | 29 (6.8%) |
| $15,000 to $19,999 | 0 (0.0%) | 28 (6.6%) |
| $20,000 to $24,999 | 7 (2.5%) | 9 (2.1%) |
| $25,000 to $34,999 | 26 (9.5%) | 84 (19.7%) |
| $35,000 to $49,999 | 47 (17.2%) | 72 (16.9%) |
| $50,000 to $74,999 | 23 (8.4%) | 85 (19.9%) |
| $75,000 to $99,999 | 78 (28.5%) | 43 (10.1%) |
| $100,000 to $149,999 | 56 (20.4%) | 13 (3.0%) |
| $150,000 or more | 32 (11.7%) | 0 (0.0%) |
| Total | 274 (100.0%) | 427 (100.0%) |
Monthly Housing Cost Tiers in Lake Butler
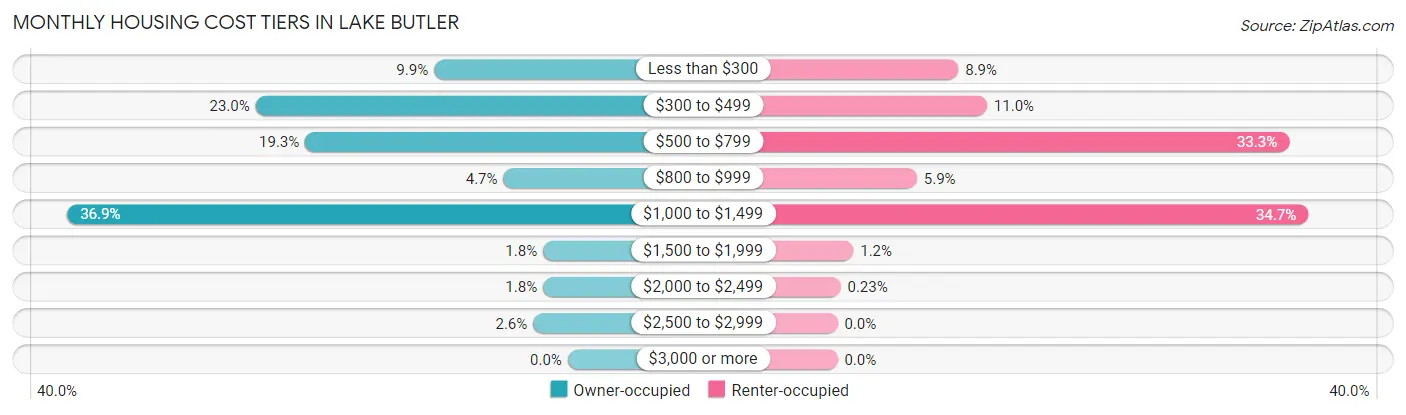
| Monthly Cost | Owner-occupied | Renter-occupied |
| Less than $300 | 27 (9.9%) | 38 (8.9%) |
| $300 to $499 | 63 (23.0%) | 47 (11.0%) |
| $500 to $799 | 53 (19.3%) | 142 (33.3%) |
| $800 to $999 | 13 (4.7%) | 25 (5.9%) |
| $1,000 to $1,499 | 101 (36.9%) | 148 (34.7%) |
| $1,500 to $1,999 | 5 (1.8%) | 5 (1.2%) |
| $2,000 to $2,499 | 5 (1.8%) | 1 (0.2%) |
| $2,500 to $2,999 | 7 (2.5%) | 0 (0.0%) |
| $3,000 or more | 0 (0.0%) | 0 (0.0%) |
| Total | 274 (100.0%) | 427 (100.0%) |
Physical Housing Characteristics in Lake Butler
Housing Structures in Lake Butler
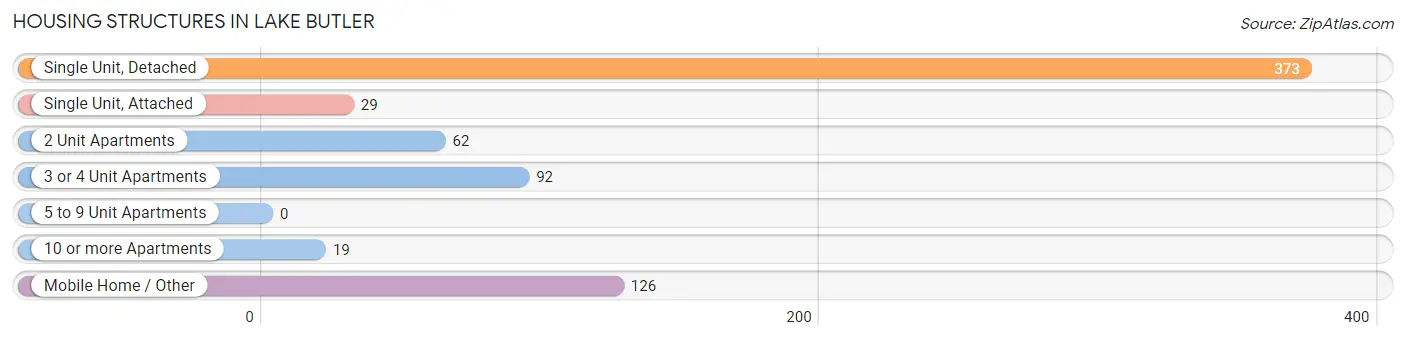
| Structure Type | # Housing Units | % Housing Units |
| Single Unit, Detached | 373 | 53.2% |
| Single Unit, Attached | 29 | 4.1% |
| 2 Unit Apartments | 62 | 8.8% |
| 3 or 4 Unit Apartments | 92 | 13.1% |
| 5 to 9 Unit Apartments | 0 | 0.0% |
| 10 or more Apartments | 19 | 2.7% |
| Mobile Home / Other | 126 | 18.0% |
| Total | 701 | 100.0% |
Housing Structures by Occupancy in Lake Butler
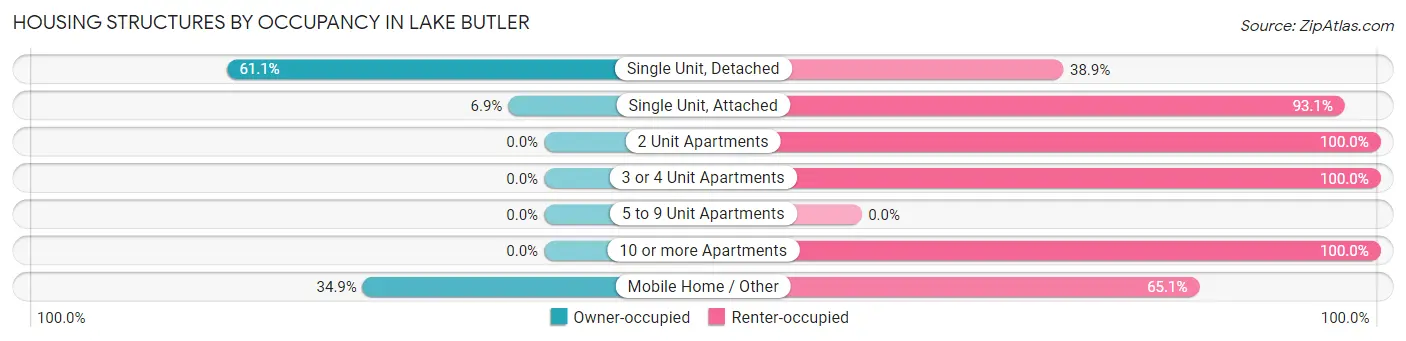
| Structure Type | Owner-occupied | Renter-occupied |
| Single Unit, Detached | 228 (61.1%) | 145 (38.9%) |
| Single Unit, Attached | 2 (6.9%) | 27 (93.1%) |
| 2 Unit Apartments | 0 (0.0%) | 62 (100.0%) |
| 3 or 4 Unit Apartments | 0 (0.0%) | 92 (100.0%) |
| 5 to 9 Unit Apartments | 0 (0.0%) | 0 (0.0%) |
| 10 or more Apartments | 0 (0.0%) | 19 (100.0%) |
| Mobile Home / Other | 44 (34.9%) | 82 (65.1%) |
| Total | 274 (39.1%) | 427 (60.9%) |
Housing Structures by Number of Rooms in Lake Butler
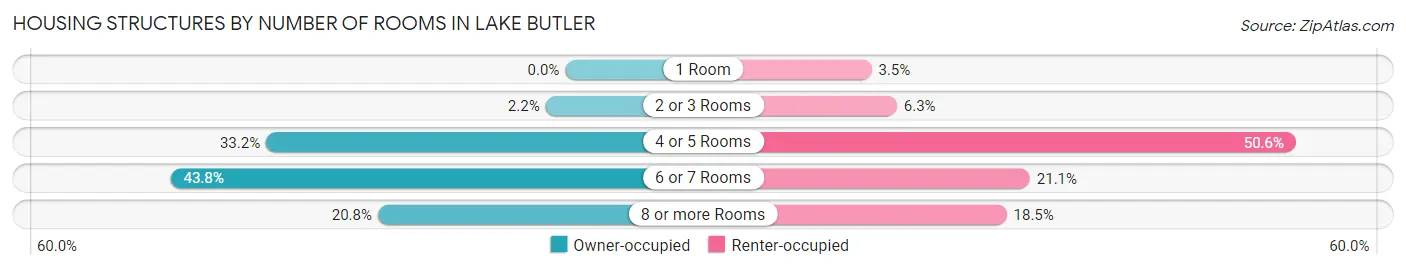
| Number of Rooms | Owner-occupied | Renter-occupied |
| 1 Room | 0 (0.0%) | 15 (3.5%) |
| 2 or 3 Rooms | 6 (2.2%) | 27 (6.3%) |
| 4 or 5 Rooms | 91 (33.2%) | 216 (50.6%) |
| 6 or 7 Rooms | 120 (43.8%) | 90 (21.1%) |
| 8 or more Rooms | 57 (20.8%) | 79 (18.5%) |
| Total | 274 (100.0%) | 427 (100.0%) |
Housing Structure by Heating Type in Lake Butler
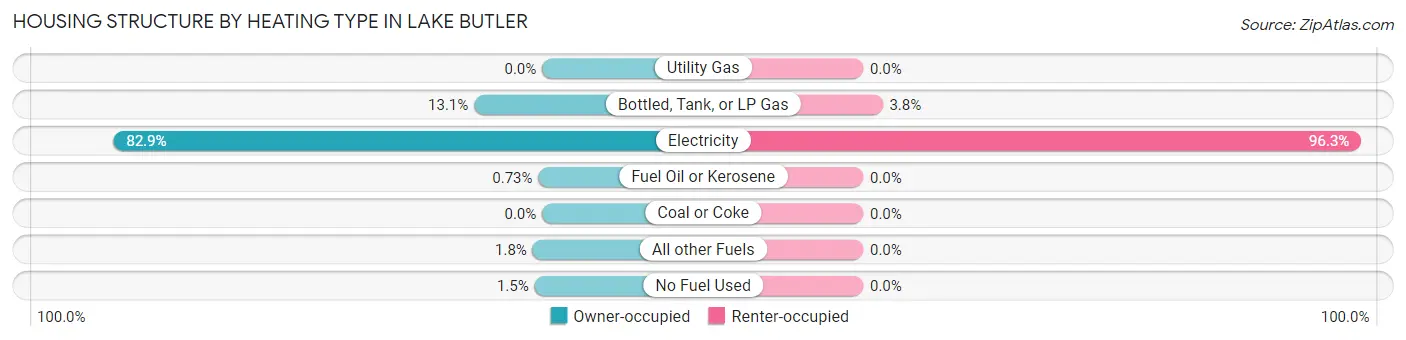
| Heating Type | Owner-occupied | Renter-occupied |
| Utility Gas | 0 (0.0%) | 0 (0.0%) |
| Bottled, Tank, or LP Gas | 36 (13.1%) | 16 (3.7%) |
| Electricity | 227 (82.9%) | 411 (96.3%) |
| Fuel Oil or Kerosene | 2 (0.7%) | 0 (0.0%) |
| Coal or Coke | 0 (0.0%) | 0 (0.0%) |
| All other Fuels | 5 (1.8%) | 0 (0.0%) |
| No Fuel Used | 4 (1.5%) | 0 (0.0%) |
| Total | 274 (100.0%) | 427 (100.0%) |
Household Vehicle Usage in Lake Butler
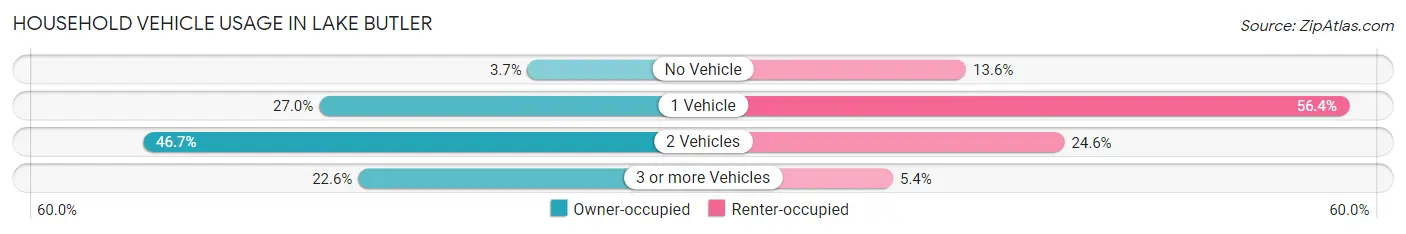
| Vehicles per Household | Owner-occupied | Renter-occupied |
| No Vehicle | 10 (3.6%) | 58 (13.6%) |
| 1 Vehicle | 74 (27.0%) | 241 (56.4%) |
| 2 Vehicles | 128 (46.7%) | 105 (24.6%) |
| 3 or more Vehicles | 62 (22.6%) | 23 (5.4%) |
| Total | 274 (100.0%) | 427 (100.0%) |
Real Estate & Mortgages in Lake Butler
Real Estate and Mortgage Overview in Lake Butler
| Characteristic | Without Mortgage | With Mortgage |
| Housing Units | 1,962 | 159 |
| Median Property Value | $865,100 | $147,400 |
| Median Household Income | $215,313 | $28 |
| Monthly Housing Costs | $1,466 | $0 |
| Real Estate Taxes | $8,686 | $8 |
Property Value by Mortgage Status in Lake Butler
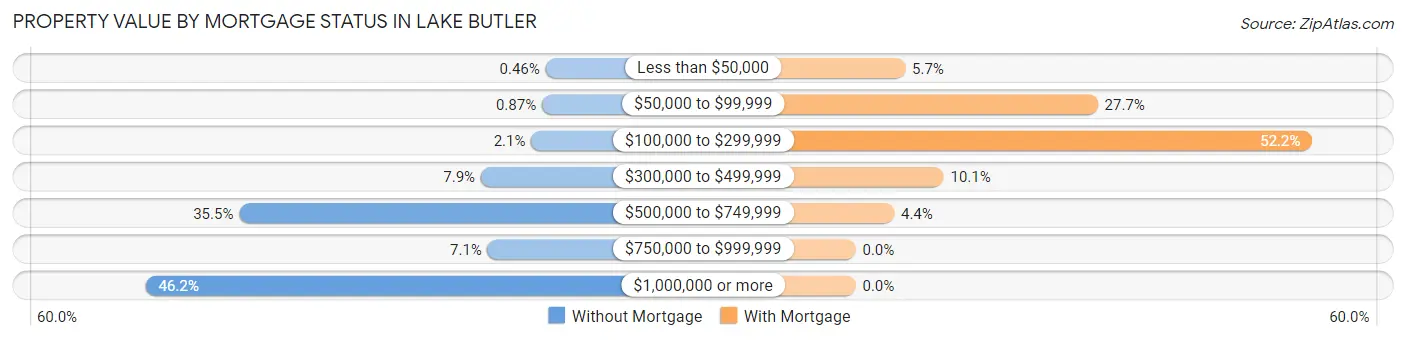
| Property Value | Without Mortgage | With Mortgage |
| Less than $50,000 | 9 (0.5%) | 9 (5.7%) |
| $50,000 to $99,999 | 17 (0.9%) | 44 (27.7%) |
| $100,000 to $299,999 | 41 (2.1%) | 83 (52.2%) |
| $300,000 to $499,999 | 154 (7.9%) | 16 (10.1%) |
| $500,000 to $749,999 | 696 (35.5%) | 7 (4.4%) |
| $750,000 to $999,999 | 139 (7.1%) | 0 (0.0%) |
| $1,000,000 or more | 906 (46.2%) | 0 (0.0%) |
| Total | 1,962 (100.0%) | 159 (100.0%) |
Household Income by Mortgage Status in Lake Butler
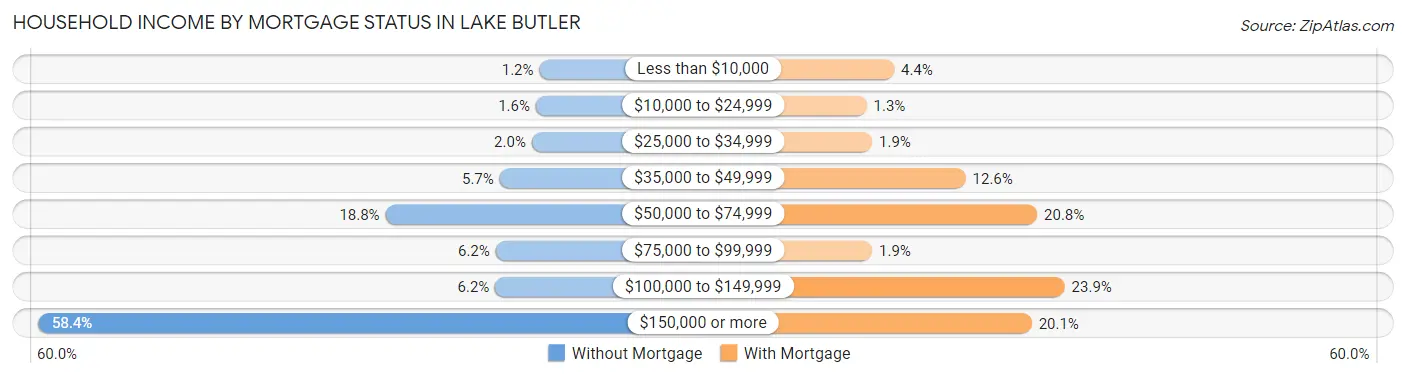
| Household Income | Without Mortgage | With Mortgage |
| Less than $10,000 | 23 (1.2%) | 7 (4.4%) |
| $10,000 to $24,999 | 31 (1.6%) | 2 (1.3%) |
| $25,000 to $34,999 | 40 (2.0%) | 3 (1.9%) |
| $35,000 to $49,999 | 112 (5.7%) | 20 (12.6%) |
| $50,000 to $74,999 | 368 (18.8%) | 33 (20.7%) |
| $75,000 to $99,999 | 121 (6.2%) | 3 (1.9%) |
| $100,000 to $149,999 | 122 (6.2%) | 38 (23.9%) |
| $150,000 or more | 1,145 (58.4%) | 32 (20.1%) |
| Total | 1,962 (100.0%) | 159 (100.0%) |
Property Value to Household Income Ratio in Lake Butler
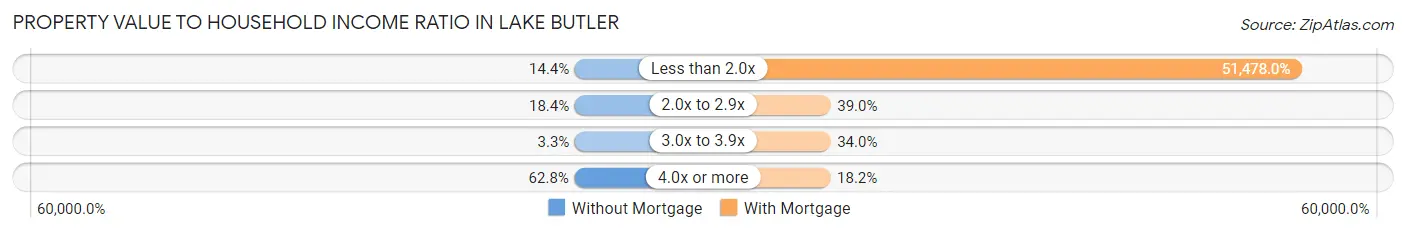
| Value-to-Income Ratio | Without Mortgage | With Mortgage |
| Less than 2.0x | 282 (14.4%) | 81,850 (51,478.0%) |
| 2.0x to 2.9x | 361 (18.4%) | 62 (39.0%) |
| 3.0x to 3.9x | 64 (3.3%) | 54 (34.0%) |
| 4.0x or more | 1,232 (62.8%) | 29 (18.2%) |
| Total | 1,962 (100.0%) | 159 (100.0%) |
Real Estate Taxes by Mortgage Status in Lake Butler
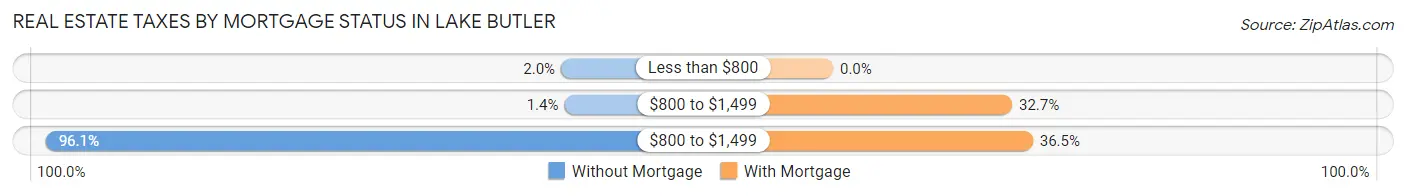
| Property Taxes | Without Mortgage | With Mortgage |
| Less than $800 | 40 (2.0%) | 0 (0.0%) |
| $800 to $1,499 | 28 (1.4%) | 52 (32.7%) |
| $800 to $1,499 | 1,886 (96.1%) | 58 (36.5%) |
| Total | 1,962 (100.0%) | 159 (100.0%) |
Health & Disability in Lake Butler
Health Insurance Coverage by Age in Lake Butler
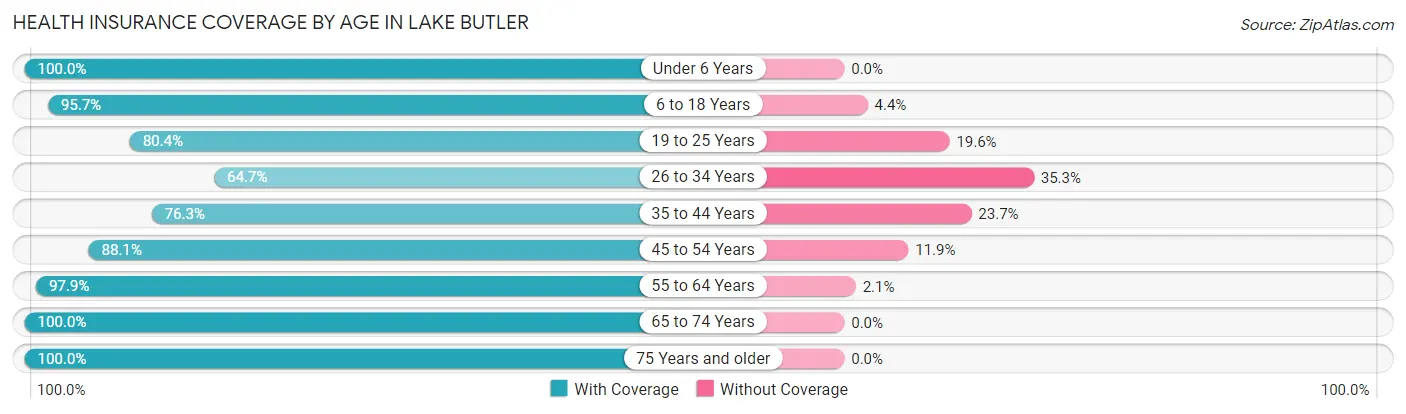
| Age Bracket | With Coverage | Without Coverage |
| Under 6 Years | 198 (100.0%) | 0 (0.0%) |
| 6 to 18 Years | 484 (95.7%) | 22 (4.3%) |
| 19 to 25 Years | 205 (80.4%) | 50 (19.6%) |
| 26 to 34 Years | 119 (64.7%) | 65 (35.3%) |
| 35 to 44 Years | 132 (76.3%) | 41 (23.7%) |
| 45 to 54 Years | 155 (88.1%) | 21 (11.9%) |
| 55 to 64 Years | 138 (97.9%) | 3 (2.1%) |
| 65 to 74 Years | 130 (100.0%) | 0 (0.0%) |
| 75 Years and older | 55 (100.0%) | 0 (0.0%) |
| Total | 1,616 (88.9%) | 202 (11.1%) |
Health Insurance Coverage by Citizenship Status in Lake Butler
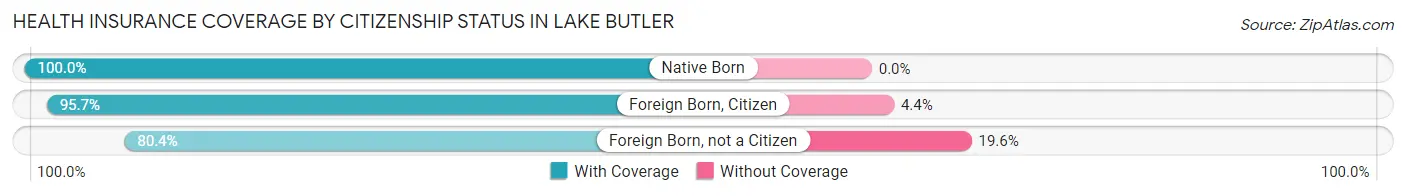
| Citizenship Status | With Coverage | Without Coverage |
| Native Born | 198 (100.0%) | 0 (0.0%) |
| Foreign Born, Citizen | 484 (95.7%) | 22 (4.3%) |
| Foreign Born, not a Citizen | 205 (80.4%) | 50 (19.6%) |
Health Insurance Coverage by Household Income in Lake Butler
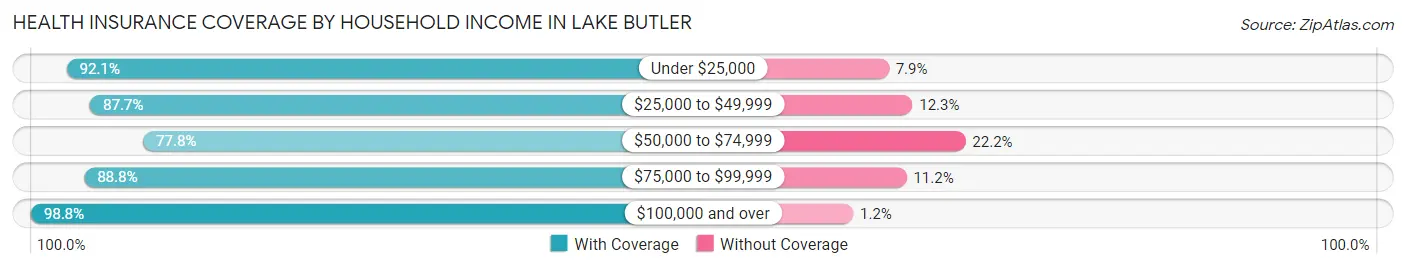
| Household Income | With Coverage | Without Coverage |
| Under $25,000 | 293 (92.1%) | 25 (7.9%) |
| $25,000 to $49,999 | 436 (87.7%) | 61 (12.3%) |
| $50,000 to $74,999 | 266 (77.8%) | 76 (22.2%) |
| $75,000 to $99,999 | 286 (88.8%) | 36 (11.2%) |
| $100,000 and over | 335 (98.8%) | 4 (1.2%) |
Public vs Private Health Insurance Coverage by Age in Lake Butler
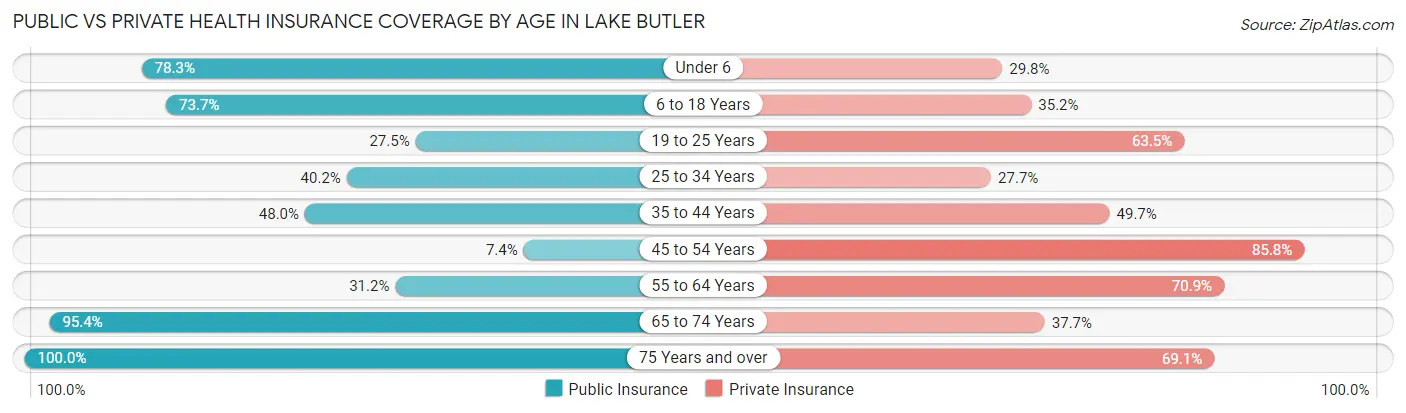
| Age Bracket | Public Insurance | Private Insurance |
| Under 6 | 155 (78.3%) | 59 (29.8%) |
| 6 to 18 Years | 373 (73.7%) | 178 (35.2%) |
| 19 to 25 Years | 70 (27.5%) | 162 (63.5%) |
| 25 to 34 Years | 74 (40.2%) | 51 (27.7%) |
| 35 to 44 Years | 83 (48.0%) | 86 (49.7%) |
| 45 to 54 Years | 13 (7.4%) | 151 (85.8%) |
| 55 to 64 Years | 44 (31.2%) | 100 (70.9%) |
| 65 to 74 Years | 124 (95.4%) | 49 (37.7%) |
| 75 Years and over | 55 (100.0%) | 38 (69.1%) |
| Total | 991 (54.5%) | 874 (48.1%) |
Disability Status by Sex by Age in Lake Butler
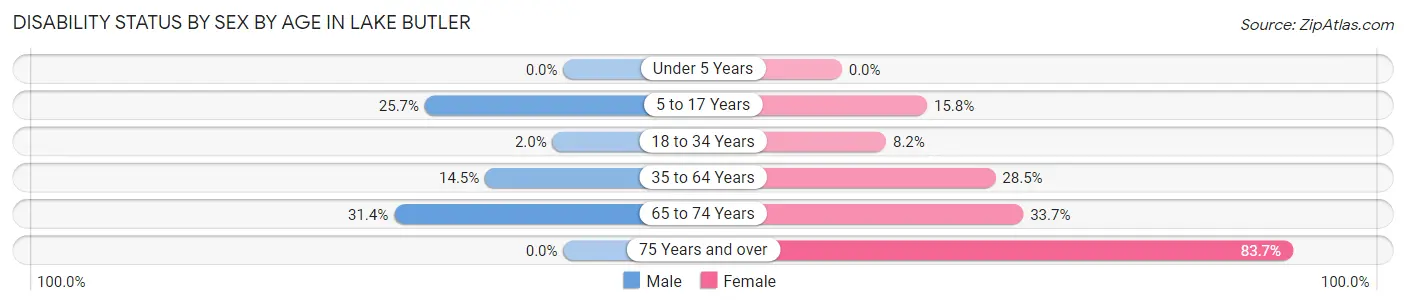
| Age Bracket | Male | Female |
| Under 5 Years | 0 (0.0%) | 0 (0.0%) |
| 5 to 17 Years | 63 (25.7%) | 44 (15.8%) |
| 18 to 34 Years | 4 (2.0%) | 22 (8.2%) |
| 35 to 64 Years | 35 (14.5%) | 71 (28.5%) |
| 65 to 74 Years | 11 (31.4%) | 32 (33.7%) |
| 75 Years and over | 0 (0.0%) | 36 (83.7%) |
Disability Class by Sex by Age in Lake Butler
Disability Class: Hearing Difficulty
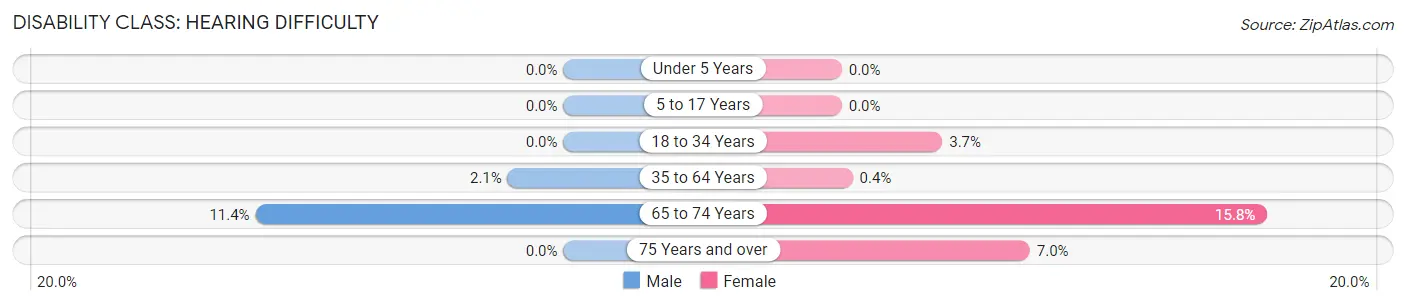
| Age Bracket | Male | Female |
| Under 5 Years | 0 (0.0%) | 0 (0.0%) |
| 5 to 17 Years | 0 (0.0%) | 0 (0.0%) |
| 18 to 34 Years | 0 (0.0%) | 10 (3.7%) |
| 35 to 64 Years | 5 (2.1%) | 1 (0.4%) |
| 65 to 74 Years | 4 (11.4%) | 15 (15.8%) |
| 75 Years and over | 0 (0.0%) | 3 (7.0%) |
Disability Class: Vision Difficulty
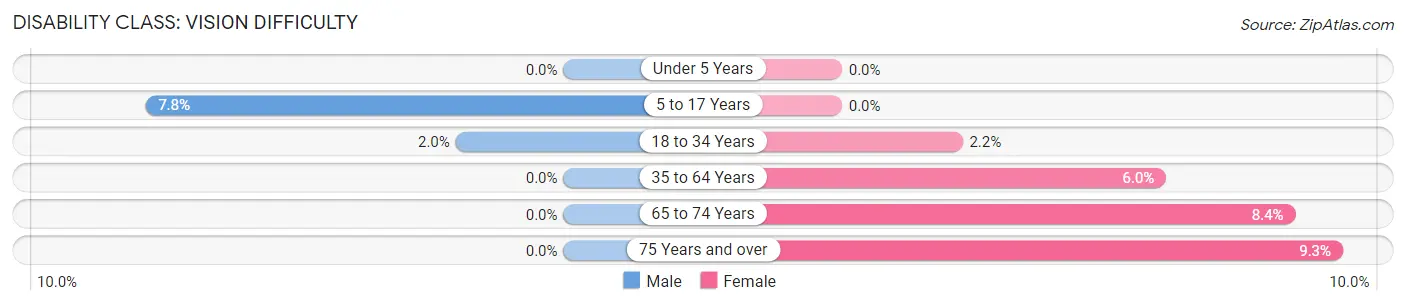
| Age Bracket | Male | Female |
| Under 5 Years | 0 (0.0%) | 0 (0.0%) |
| 5 to 17 Years | 19 (7.8%) | 0 (0.0%) |
| 18 to 34 Years | 4 (2.0%) | 6 (2.2%) |
| 35 to 64 Years | 0 (0.0%) | 15 (6.0%) |
| 65 to 74 Years | 0 (0.0%) | 8 (8.4%) |
| 75 Years and over | 0 (0.0%) | 4 (9.3%) |
Disability Class: Cognitive Difficulty
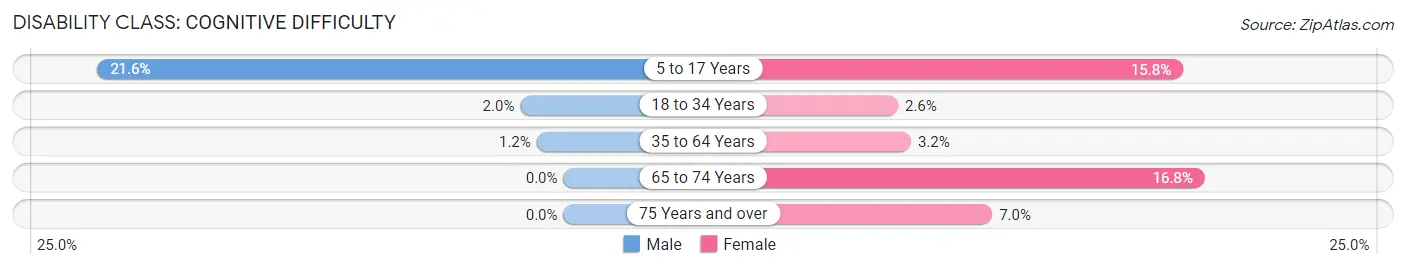
| Age Bracket | Male | Female |
| 5 to 17 Years | 53 (21.6%) | 44 (15.8%) |
| 18 to 34 Years | 4 (2.0%) | 7 (2.6%) |
| 35 to 64 Years | 3 (1.2%) | 8 (3.2%) |
| 65 to 74 Years | 0 (0.0%) | 16 (16.8%) |
| 75 Years and over | 0 (0.0%) | 3 (7.0%) |
Disability Class: Ambulatory Difficulty
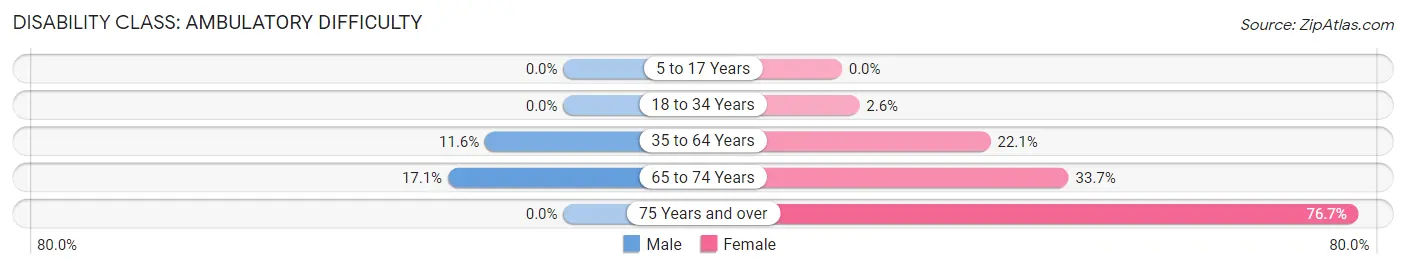
| Age Bracket | Male | Female |
| 5 to 17 Years | 0 (0.0%) | 0 (0.0%) |
| 18 to 34 Years | 0 (0.0%) | 7 (2.6%) |
| 35 to 64 Years | 28 (11.6%) | 55 (22.1%) |
| 65 to 74 Years | 6 (17.1%) | 32 (33.7%) |
| 75 Years and over | 0 (0.0%) | 33 (76.7%) |
Disability Class: Self-Care Difficulty
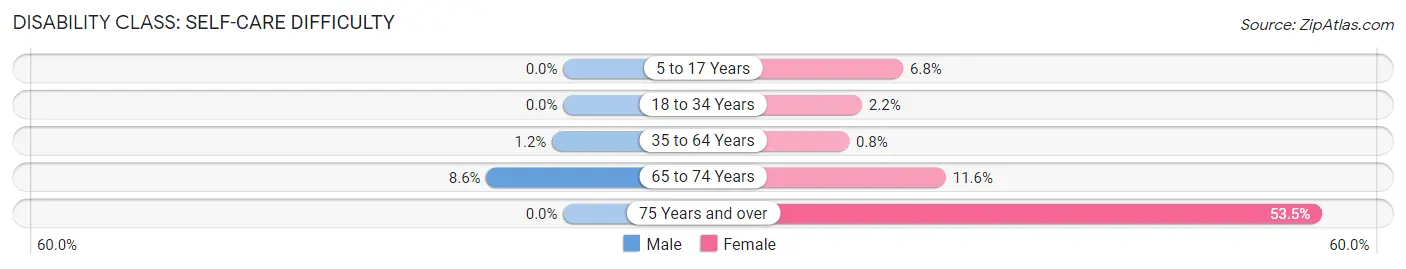
| Age Bracket | Male | Female |
| 5 to 17 Years | 0 (0.0%) | 19 (6.8%) |
| 18 to 34 Years | 0 (0.0%) | 6 (2.2%) |
| 35 to 64 Years | 3 (1.2%) | 2 (0.8%) |
| 65 to 74 Years | 3 (8.6%) | 11 (11.6%) |
| 75 Years and over | 0 (0.0%) | 23 (53.5%) |
Technology Access in Lake Butler
Computing Device Access in Lake Butler
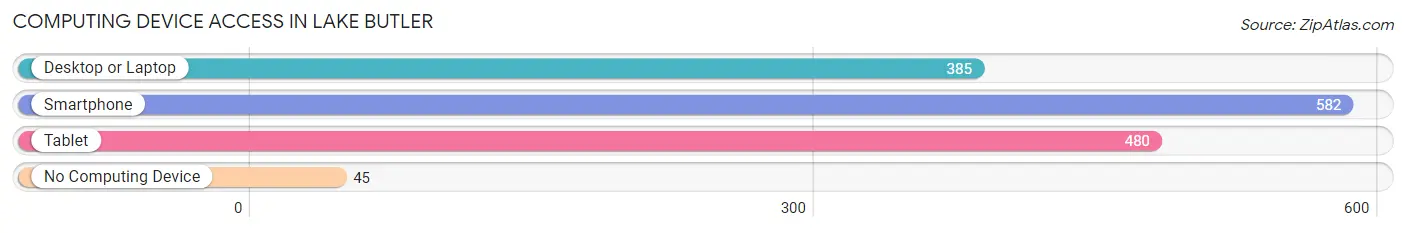
| Device Type | # Households | % Households |
| Desktop or Laptop | 385 | 54.9% |
| Smartphone | 582 | 83.0% |
| Tablet | 480 | 68.5% |
| No Computing Device | 45 | 6.4% |
| Total | 701 | 100.0% |
Internet Access in Lake Butler
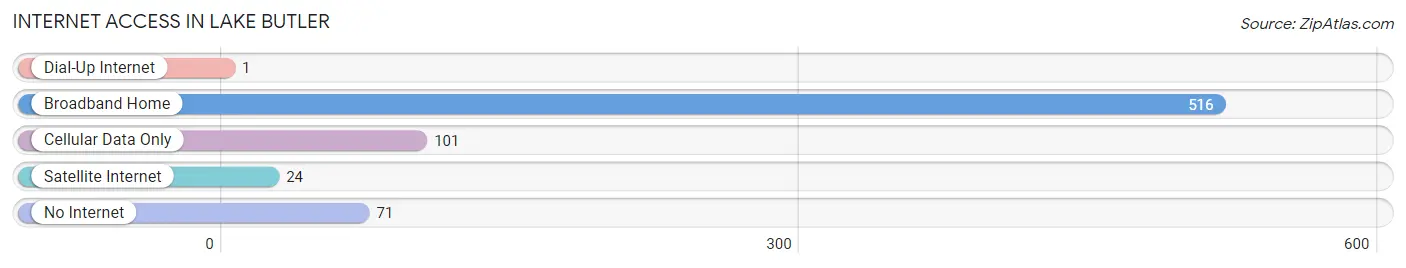
| Internet Type | # Households | % Households |
| Dial-Up Internet | 1 | 0.1% |
| Broadband Home | 516 | 73.6% |
| Cellular Data Only | 101 | 14.4% |
| Satellite Internet | 24 | 3.4% |
| No Internet | 71 | 10.1% |
| Total | 701 | 100.0% |
Lake Butler Summary
History
The small town of Lake Butler, Florida is located in Union County, in the north-central part of the state. It is situated on the banks of Lake Butler, a natural lake that was formed by the Suwannee River. The town was first settled in the late 1800s by settlers from Georgia and South Carolina. The town was originally known as “Butler’s Lake”, named after the first settler, William Butler. The town was officially incorporated in 1891.
In the early 1900s, Lake Butler was a thriving agricultural community. The town was home to several cotton gins, a sawmill, and a grist mill. The town also had a railroad station, which connected it to the rest of the state. The town was also home to several churches, a school, and a post office.
In the 1920s, the town began to decline as the railroad station closed and the cotton industry declined. The town was also hit hard by the Great Depression. In the 1940s, the town began to experience a resurgence as the timber industry began to boom. The town was also home to several sawmills and lumber companies.
In the 1950s, the town began to experience a decline again as the timber industry began to decline. The town was also hit hard by the Civil Rights Movement. In the 1960s, the town began to experience a resurgence as the timber industry began to boom again. The town was also home to several sawmills and lumber companies.
In the 1970s, the town began to experience a decline again as the timber industry began to decline. The town was also hit hard by the oil crisis. In the 1980s, the town began to experience a resurgence as the timber industry began to boom again. The town was also home to several sawmills and lumber companies.
In the 1990s, the town began to experience a decline again as the timber industry began to decline. The town was also hit hard by the recession. In the 2000s, the town began to experience a resurgence as the timber industry began to boom again. The town was also home to several sawmills and lumber companies.
Geography
Lake Butler is located in Union County, in the north-central part of the state. The town is situated on the banks of Lake Butler, a natural lake that was formed by the Suwannee River. The town is located about 25 miles west of Gainesville and about 50 miles east of Jacksonville. The town is also located about 25 miles south of the Georgia border.
The town is located in a rural area and is surrounded by forests and farmland. The town is also located near several state parks, including the Okefenokee National Wildlife Refuge and the Osceola National Forest. The town is also located near several rivers, including the Suwannee River, the Santa Fe River, and the St. Johns River.
Economy
The economy of Lake Butler is largely based on agriculture and timber. The town is home to several sawmills and lumber companies. The town is also home to several farms, which produce a variety of crops, including corn, soybeans, and cotton. The town is also home to several nurseries, which produce a variety of plants and flowers.
The town is also home to several businesses, including restaurants, retail stores, and service providers. The town is also home to several manufacturing companies, which produce a variety of products, including furniture, clothing, and electronics.
Demographics
As of the 2010 census, the population of Lake Butler was 1,845. The town has a total area of 2.2 square miles, all of which is land. The town has a population density of 837.3 people per square mile.
The racial makeup of the town is 87.3% White, 8.2% African American, 0.2% Native American, 0.2% Asian, 0.1% Pacific Islander, 1.7% from other races, and 2.5% from two or more races. The median household income in the town is $30,938. The per capita income in the town is $15,945.
Common Questions
What is Per Capita Income in Lake Butler?
Per Capita income in Lake Butler is $19,335.
What is the Median Family Income in Lake Butler?
Median Family Income in Lake Butler is $53,906.
What is the Median Household income in Lake Butler?
Median Household Income in Lake Butler is $41,941.
What is Income or Wage Gap in Lake Butler?
Income or Wage Gap in Lake Butler is 51.9%.
Women in Lake Butler earn 48.1 cents for every dollar earned by a man.
What is Inequality or Gini Index in Lake Butler?
Inequality or Gini Index in Lake Butler is 0.39.
What is the Total Population of Lake Butler?
Total Population of Lake Butler is 1,842.
What is the Total Male Population of Lake Butler?
Total Male Population of Lake Butler is 882.
What is the Total Female Population of Lake Butler?
Total Female Population of Lake Butler is 960.
What is the Ratio of Males per 100 Females in Lake Butler?
There are 91.88 Males per 100 Females in Lake Butler.
What is the Ratio of Females per 100 Males in Lake Butler?
There are 108.84 Females per 100 Males in Lake Butler.
What is the Median Population Age in Lake Butler?
Median Population Age in Lake Butler is 25.3 Years.
What is the Average Family Size in Lake Butler
Average Family Size in Lake Butler is 3.0 People.
What is the Average Household Size in Lake Butler
Average Household Size in Lake Butler is 2.6 People.
How Large is the Labor Force in Lake Butler?
There are 693 People in the Labor Forcein in Lake Butler.
What is the Percentage of People in the Labor Force in Lake Butler?
57.1% of People are in the Labor Force in Lake Butler.
What is the Unemployment Rate in Lake Butler?
Unemployment Rate in Lake Butler is 10.0%.