Inverness, FL Map & Demographics
Inverness Map
Inverness Overview
$27,752
PER CAPITA INCOME
$55,971
AVG FAMILY INCOME
$42,282
AVG HOUSEHOLD INCOME
24.8%
WAGE / INCOME GAP [ % ]
75.2¢/ $1
WAGE / INCOME GAP [ $ ]
0.42
INEQUALITY / GINI INDEX
7,602
TOTAL POPULATION
3,320
MALE POPULATION
4,282
FEMALE POPULATION
77.53
MALES / 100 FEMALES
128.98
FEMALES / 100 MALES
56.7
MEDIAN AGE
2.7
AVG FAMILY SIZE
1.9
AVG HOUSEHOLD SIZE
3,141
LABOR FORCE [ PEOPLE ]
46.6%
PERCENT IN LABOR FORCE
7.2%
UNEMPLOYMENT RATE
Inverness Area Codes
Income in Inverness
Income Overview in Inverness
Per Capita Income in Inverness is $27,752, while median incomes of families and households are $55,971 and $42,282 respectively.
| Characteristic | Number | Measure |
| Per Capita Income | 7,602 | $27,752 |
| Median Family Income | 1,676 | $55,971 |
| Mean Family Income | 1,676 | $67,242 |
| Median Household Income | 3,744 | $42,282 |
| Mean Household Income | 3,744 | $53,253 |
| Income Deficit | 1,676 | $0 |
| Wage / Income Gap (%) | 7,602 | 24.76% |
| Wage / Income Gap ($) | 7,602 | 75.24¢ per $1 |
| Gini / Inequality Index | 7,602 | 0.42 |
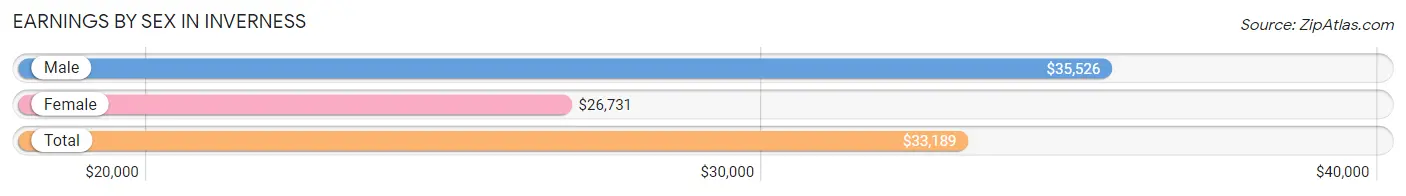
Earnings by Sex in Inverness
Average Earnings in Inverness are $33,189, $35,526 for men and $26,731 for women, a difference of 24.8%.
| Sex | Number | Average Earnings |
| Male | 1,602 (49.9%) | $35,526 |
| Female | 1,610 (50.1%) | $26,731 |
| Total | 3,212 (100.0%) | $33,189 |
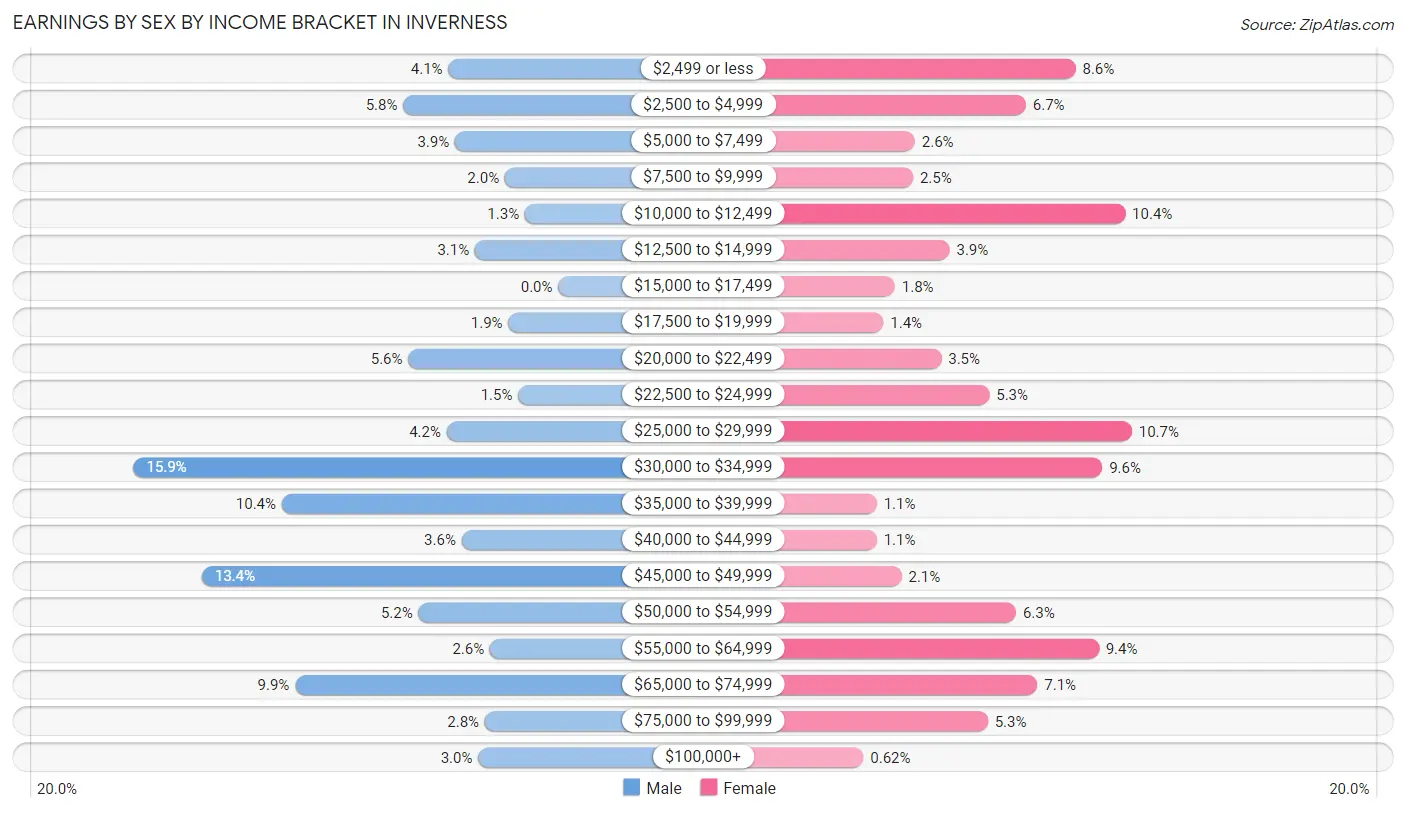
Earnings by Sex by Income Bracket in Inverness
The most common earnings brackets in Inverness are $30,000 to $34,999 for men (255 | 15.9%) and $25,000 to $29,999 for women (172 | 10.7%).
| Income | Male | Female |
| $2,499 or less | 66 (4.1%) | 138 (8.6%) |
| $2,500 to $4,999 | 93 (5.8%) | 108 (6.7%) |
| $5,000 to $7,499 | 62 (3.9%) | 41 (2.5%) |
| $7,500 to $9,999 | 32 (2.0%) | 40 (2.5%) |
| $10,000 to $12,499 | 20 (1.3%) | 168 (10.4%) |
| $12,500 to $14,999 | 50 (3.1%) | 62 (3.8%) |
| $15,000 to $17,499 | 0 (0.0%) | 29 (1.8%) |
| $17,500 to $19,999 | 30 (1.9%) | 22 (1.4%) |
| $20,000 to $22,499 | 90 (5.6%) | 57 (3.5%) |
| $22,500 to $24,999 | 24 (1.5%) | 86 (5.3%) |
| $25,000 to $29,999 | 67 (4.2%) | 172 (10.7%) |
| $30,000 to $34,999 | 255 (15.9%) | 154 (9.6%) |
| $35,000 to $39,999 | 166 (10.4%) | 18 (1.1%) |
| $40,000 to $44,999 | 58 (3.6%) | 18 (1.1%) |
| $45,000 to $49,999 | 214 (13.4%) | 33 (2.1%) |
| $50,000 to $54,999 | 84 (5.2%) | 102 (6.3%) |
| $55,000 to $64,999 | 41 (2.6%) | 152 (9.4%) |
| $65,000 to $74,999 | 158 (9.9%) | 115 (7.1%) |
| $75,000 to $99,999 | 44 (2.8%) | 85 (5.3%) |
| $100,000+ | 48 (3.0%) | 10 (0.6%) |
| Total | 1,602 (100.0%) | 1,610 (100.0%) |
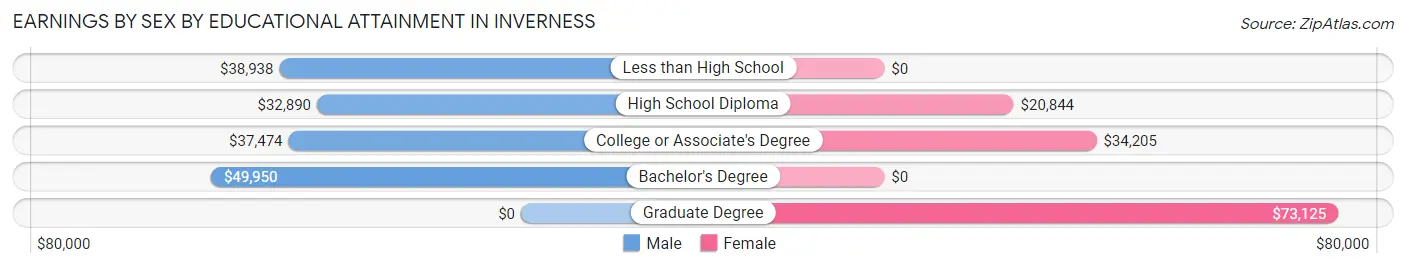
Earnings by Sex by Educational Attainment in Inverness
Average earnings in Inverness are $37,412 for men and $30,238 for women, a difference of 19.2%. Men with an educational attainment of bachelor's degree enjoy the highest average annual earnings of $49,950, while those with high school diploma education earn the least with $32,890. Women with an educational attainment of graduate degree earn the most with the average annual earnings of $73,125, while those with high school diploma education have the smallest earnings of $20,844.
| Educational Attainment | Male Income | Female Income |
| Less than High School | $38,938 | $0 |
| High School Diploma | $32,890 | $20,844 |
| College or Associate's Degree | $37,474 | $34,205 |
| Bachelor's Degree | $49,950 | $0 |
| Graduate Degree | - | - |
| Total | $37,412 | $30,238 |
Family Income in Inverness
Family Income Brackets in Inverness
According to the Inverness family income data, there are 442 families falling into the $50,000 to $74,999 income range, which is the most common income bracket and makes up 26.4% of all families. Conversely, the $200,000+ income bracket is the least frequent group with only 12 families (0.7%) belonging to this category.
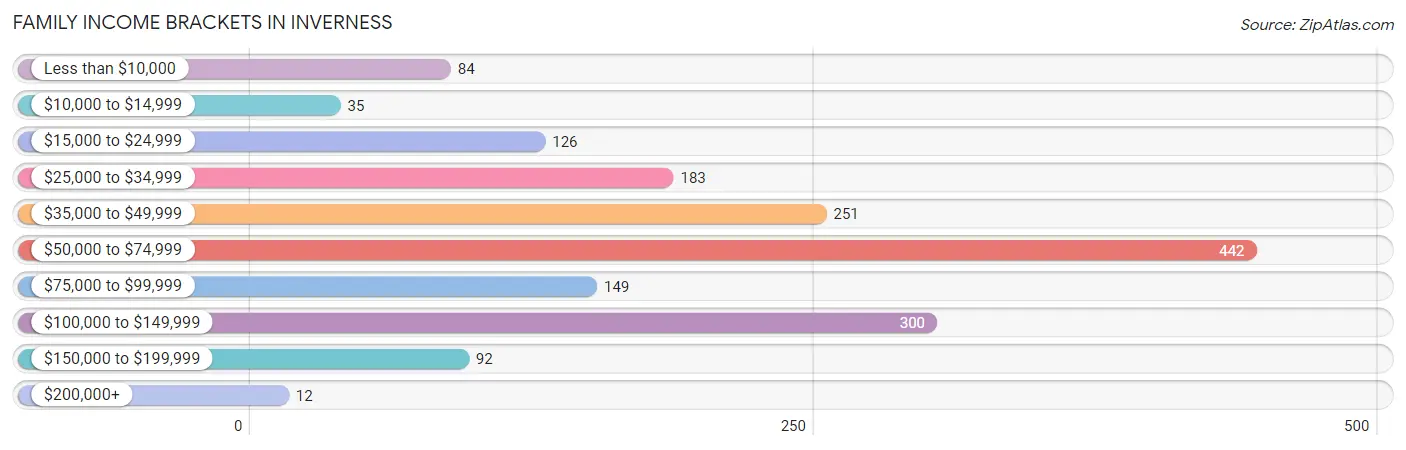
| Income Bracket | # Families | % Families |
| Less than $10,000 | 84 | 5.0% |
| $10,000 to $14,999 | 35 | 2.1% |
| $15,000 to $24,999 | 126 | 7.5% |
| $25,000 to $34,999 | 183 | 10.9% |
| $35,000 to $49,999 | 251 | 15.0% |
| $50,000 to $74,999 | 442 | 26.4% |
| $75,000 to $99,999 | 149 | 8.9% |
| $100,000 to $149,999 | 300 | 17.9% |
| $150,000 to $199,999 | 92 | 5.5% |
| $200,000+ | 12 | 0.7% |
Family Income by Famaliy Size in Inverness
4-person families (240 | 14.3%) account for the highest median family income in Inverness with $56,591 per family, while 2-person families (1,034 | 61.7%) have the highest median income of $26,178 per family member.
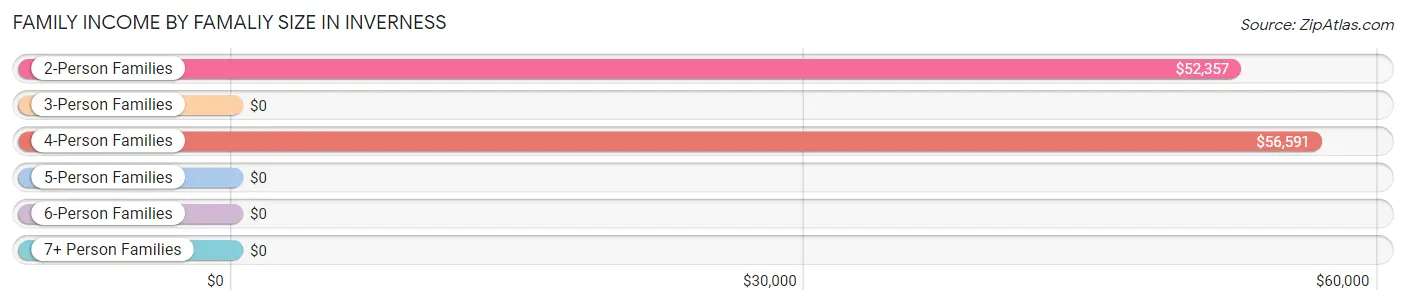
| Income Bracket | # Families | Median Income |
| 2-Person Families | 1,034 (61.7%) | $52,357 |
| 3-Person Families | 348 (20.8%) | $0 |
| 4-Person Families | 240 (14.3%) | $56,591 |
| 5-Person Families | 54 (3.2%) | $0 |
| 6-Person Families | 0 (0.0%) | $0 |
| 7+ Person Families | 0 (0.0%) | $0 |
| Total | 1,676 (100.0%) | $55,971 |
Family Income by Number of Earners in Inverness
The median family income in Inverness is $55,971, with families comprising 3+ earners (77) having the highest median family income of $150,739, while families with 1 earner (562) have the lowest median family income of $47,287, accounting for 4.6% and 33.5% of families, respectively.
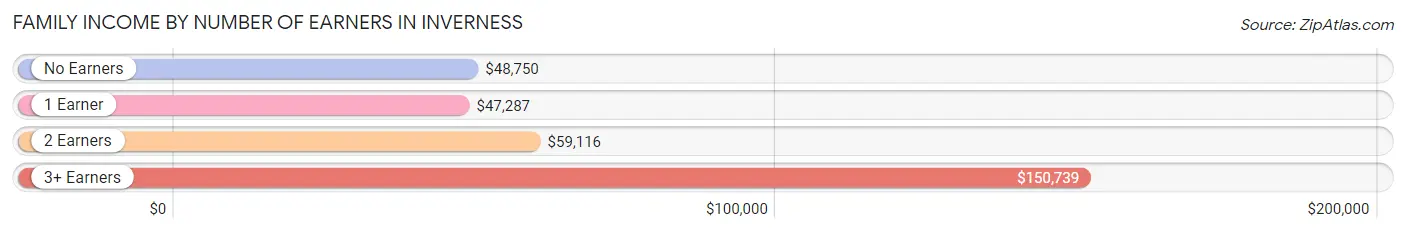
| Number of Earners | # Families | Median Income |
| No Earners | 448 (26.7%) | $48,750 |
| 1 Earner | 562 (33.5%) | $47,287 |
| 2 Earners | 589 (35.1%) | $59,116 |
| 3+ Earners | 77 (4.6%) | $150,739 |
| Total | 1,676 (100.0%) | $55,971 |
Household Income in Inverness
Household Income Brackets in Inverness
With 741 households falling in the category, the $35,000 to $49,999 income range is the most frequent in Inverness, accounting for 19.8% of all households. In contrast, only 52 households (1.4%) fall into the $200,000+ income bracket, making it the least populous group.
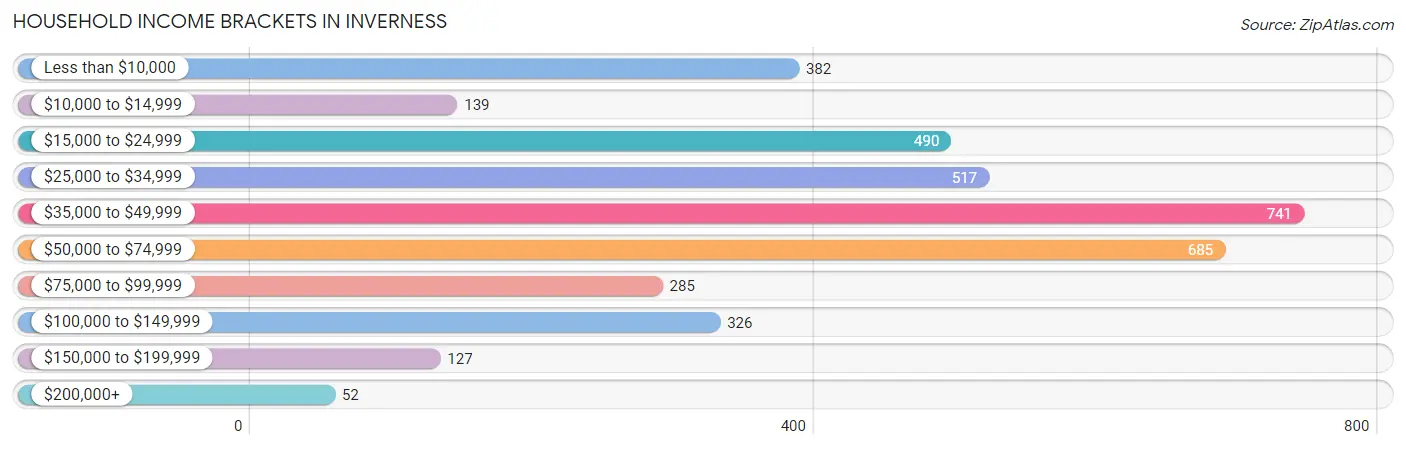
| Income Bracket | # Households | % Households |
| Less than $10,000 | 382 | 10.2% |
| $10,000 to $14,999 | 139 | 3.7% |
| $15,000 to $24,999 | 490 | 13.1% |
| $25,000 to $34,999 | 517 | 13.8% |
| $35,000 to $49,999 | 741 | 19.8% |
| $50,000 to $74,999 | 685 | 18.3% |
| $75,000 to $99,999 | 285 | 7.6% |
| $100,000 to $149,999 | 326 | 8.7% |
| $150,000 to $199,999 | 127 | 3.4% |
| $200,000+ | 52 | 1.4% |
Household Income by Householder Age in Inverness
The median household income in Inverness is $42,282, with the highest median household income of $57,576 found in the 45 to 64 years age bracket for the primary householder. A total of 968 households (25.9%) fall into this category. Meanwhile, the 65+ years age bracket for the primary householder has the lowest median household income of $33,821, with 1,892 households (50.5%) in this group.
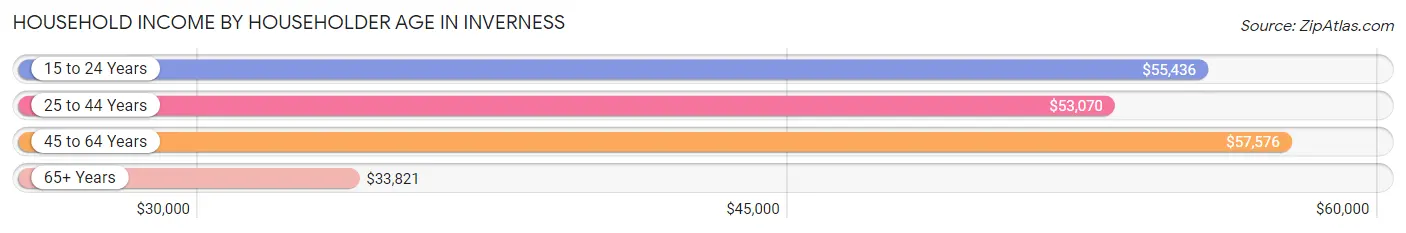
| Income Bracket | # Households | Median Income |
| 15 to 24 Years | 133 (3.5%) | $55,436 |
| 25 to 44 Years | 751 (20.1%) | $53,070 |
| 45 to 64 Years | 968 (25.9%) | $57,576 |
| 65+ Years | 1,892 (50.5%) | $33,821 |
| Total | 3,744 (100.0%) | $42,282 |
Poverty in Inverness
Income Below Poverty by Sex and Age in Inverness
With 10.7% poverty level for males and 18.8% for females among the residents of Inverness, 12 to 14 year old males and 6 to 11 year old females are the most vulnerable to poverty, with 21 males (38.9%) and 49 females (46.2%) in their respective age groups living below the poverty level.
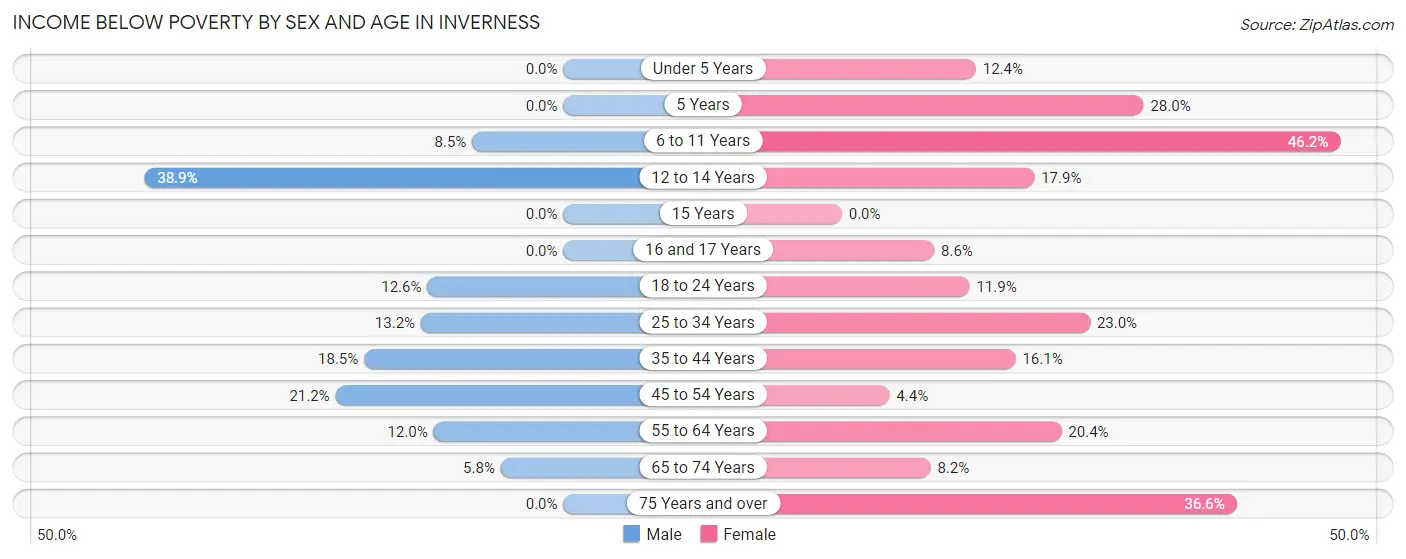
| Age Bracket | Male | Female |
| Under 5 Years | 0 (0.0%) | 25 (12.4%) |
| 5 Years | 0 (0.0%) | 28 (28.0%) |
| 6 to 11 Years | 11 (8.5%) | 49 (46.2%) |
| 12 to 14 Years | 21 (38.9%) | 10 (17.9%) |
| 15 Years | 0 (0.0%) | 0 (0.0%) |
| 16 and 17 Years | 0 (0.0%) | 3 (8.6%) |
| 18 to 24 Years | 37 (12.6%) | 34 (11.8%) |
| 25 to 34 Years | 48 (13.2%) | 82 (23.0%) |
| 35 to 44 Years | 83 (18.5%) | 64 (16.1%) |
| 45 to 54 Years | 48 (21.1%) | 14 (4.4%) |
| 55 to 64 Years | 46 (12.0%) | 108 (20.4%) |
| 65 to 74 Years | 31 (5.8%) | 70 (8.2%) |
| 75 Years and over | 0 (0.0%) | 273 (36.6%) |
| Total | 325 (10.7%) | 760 (18.8%) |
Income Above Poverty by Sex and Age in Inverness
According to the poverty statistics in Inverness, males aged under 5 years and females aged 15 years are the age groups that are most secure financially, with 100.0% of males and 100.0% of females in these age groups living above the poverty line.
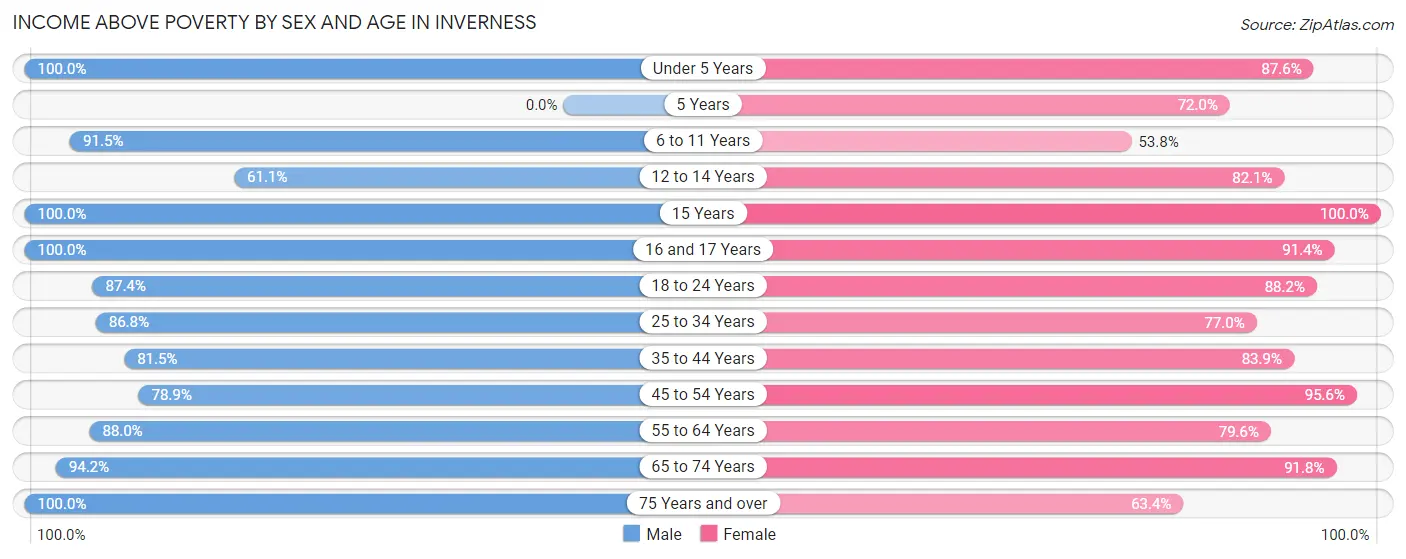
| Age Bracket | Male | Female |
| Under 5 Years | 66 (100.0%) | 176 (87.6%) |
| 5 Years | 0 (0.0%) | 72 (72.0%) |
| 6 to 11 Years | 119 (91.5%) | 57 (53.8%) |
| 12 to 14 Years | 33 (61.1%) | 46 (82.1%) |
| 15 Years | 31 (100.0%) | 68 (100.0%) |
| 16 and 17 Years | 29 (100.0%) | 32 (91.4%) |
| 18 to 24 Years | 256 (87.4%) | 253 (88.1%) |
| 25 to 34 Years | 315 (86.8%) | 274 (77.0%) |
| 35 to 44 Years | 366 (81.5%) | 333 (83.9%) |
| 45 to 54 Years | 179 (78.8%) | 303 (95.6%) |
| 55 to 64 Years | 336 (88.0%) | 422 (79.6%) |
| 65 to 74 Years | 503 (94.2%) | 781 (91.8%) |
| 75 Years and over | 466 (100.0%) | 472 (63.4%) |
| Total | 2,699 (89.2%) | 3,289 (81.2%) |
Income Below Poverty Among Married-Couple Families in Inverness
The poverty statistics for married-couple families in Inverness show that 4.7% or 57 of the total 1,212 families live below the poverty line. Families with 3 or 4 children have the highest poverty rate of 100.0%, comprising of 22 families. On the other hand, families with 1 or 2 children have the lowest poverty rate of 0.0%, which includes 0 families.
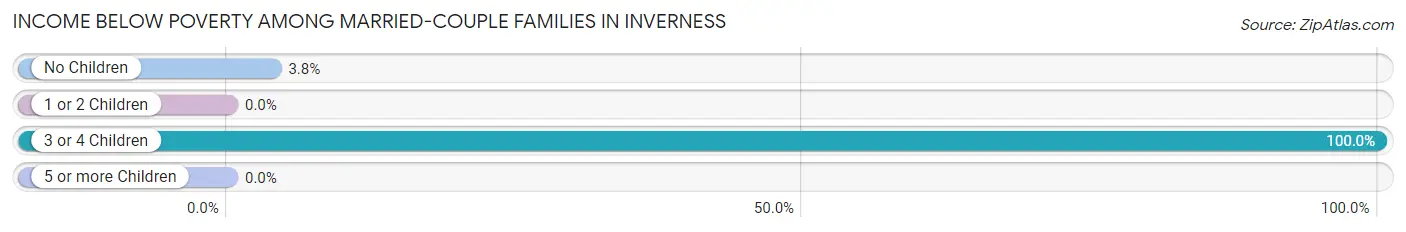
| Children | Above Poverty | Below Poverty |
| No Children | 891 (96.2%) | 35 (3.8%) |
| 1 or 2 Children | 264 (100.0%) | 0 (0.0%) |
| 3 or 4 Children | 0 (0.0%) | 22 (100.0%) |
| 5 or more Children | 0 (0.0%) | 0 (0.0%) |
| Total | 1,155 (95.3%) | 57 (4.7%) |
Income Below Poverty Among Single-Parent Households in Inverness
According to the poverty data in Inverness, 8.4% or 13 single-father households and 23.3% or 72 single-mother households are living below the poverty line. Among single-father households, those with no children have the highest poverty rate, with 13 households (19.7%) experiencing poverty. Likewise, among single-mother households, those with 1 or 2 children have the highest poverty rate, with 42 households (24.8%) falling below the poverty line.
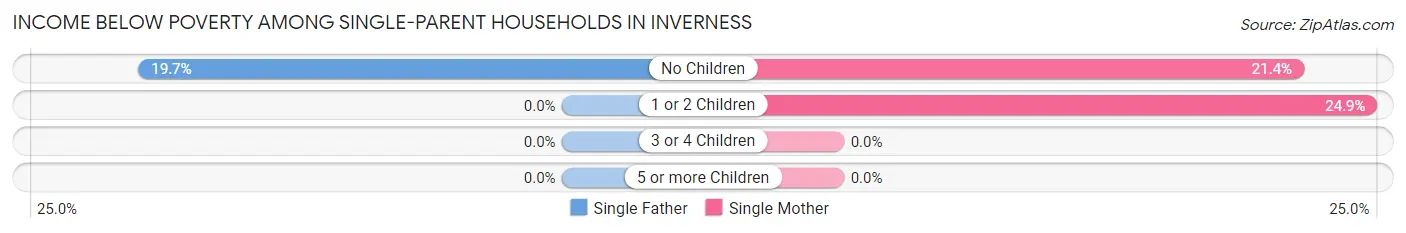
| Children | Single Father | Single Mother |
| No Children | 13 (19.7%) | 30 (21.4%) |
| 1 or 2 Children | 0 (0.0%) | 42 (24.8%) |
| 3 or 4 Children | 0 (0.0%) | 0 (0.0%) |
| 5 or more Children | 0 (0.0%) | 0 (0.0%) |
| Total | 13 (8.4%) | 72 (23.3%) |
Income Below Poverty Among Married-Couple vs Single-Parent Households in Inverness
The poverty data for Inverness shows that 57 of the married-couple family households (4.7%) and 85 of the single-parent households (18.3%) are living below the poverty level. Within the married-couple family households, those with 3 or 4 children have the highest poverty rate, with 22 households (100.0%) falling below the poverty line. Among the single-parent households, those with no children have the highest poverty rate, with 43 household (20.9%) living below poverty.
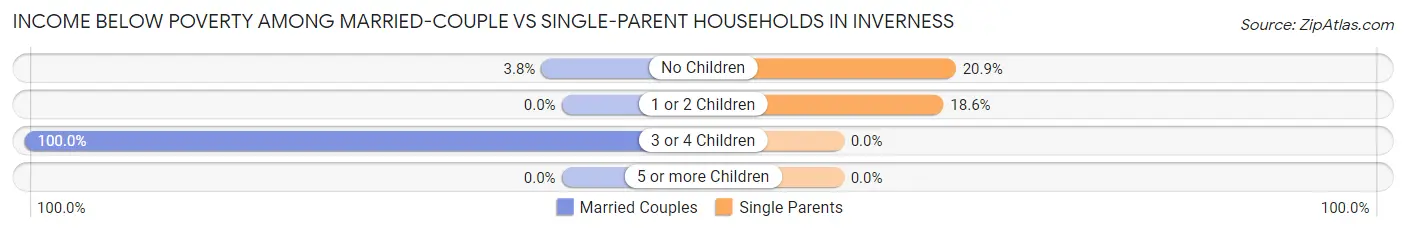
| Children | Married-Couple Families | Single-Parent Households |
| No Children | 35 (3.8%) | 43 (20.9%) |
| 1 or 2 Children | 0 (0.0%) | 42 (18.6%) |
| 3 or 4 Children | 22 (100.0%) | 0 (0.0%) |
| 5 or more Children | 0 (0.0%) | 0 (0.0%) |
| Total | 57 (4.7%) | 85 (18.3%) |
Race in Inverness
The most populous races in Inverness are White / Caucasian (6,802 | 89.5%), Hispanic or Latino (600 | 7.9%), and Asian (292 | 3.8%).
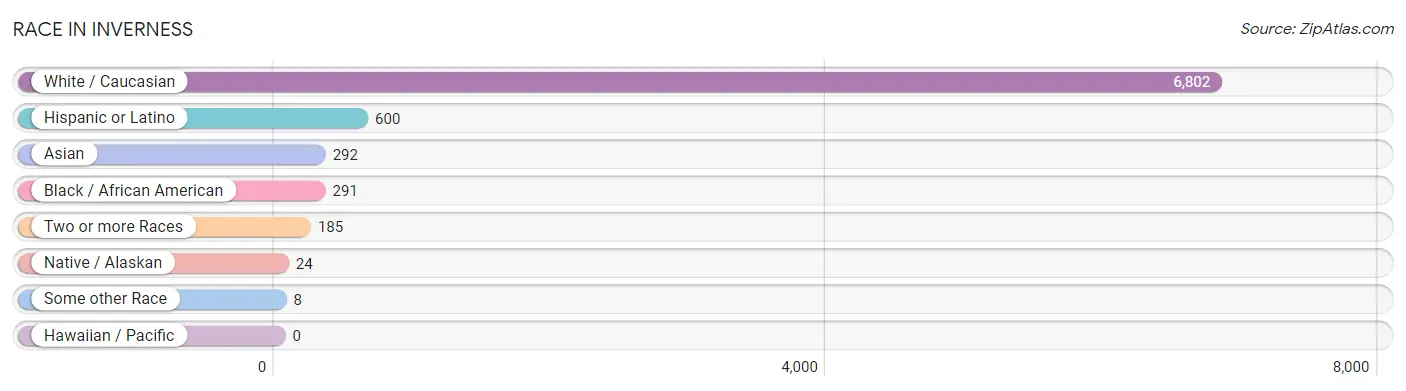
| Race | # Population | % Population |
| Asian | 292 | 3.8% |
| Black / African American | 291 | 3.8% |
| Hawaiian / Pacific | 0 | 0.0% |
| Hispanic or Latino | 600 | 7.9% |
| Native / Alaskan | 24 | 0.3% |
| White / Caucasian | 6,802 | 89.5% |
| Two or more Races | 185 | 2.4% |
| Some other Race | 8 | 0.1% |
| Total | 7,602 | 100.0% |
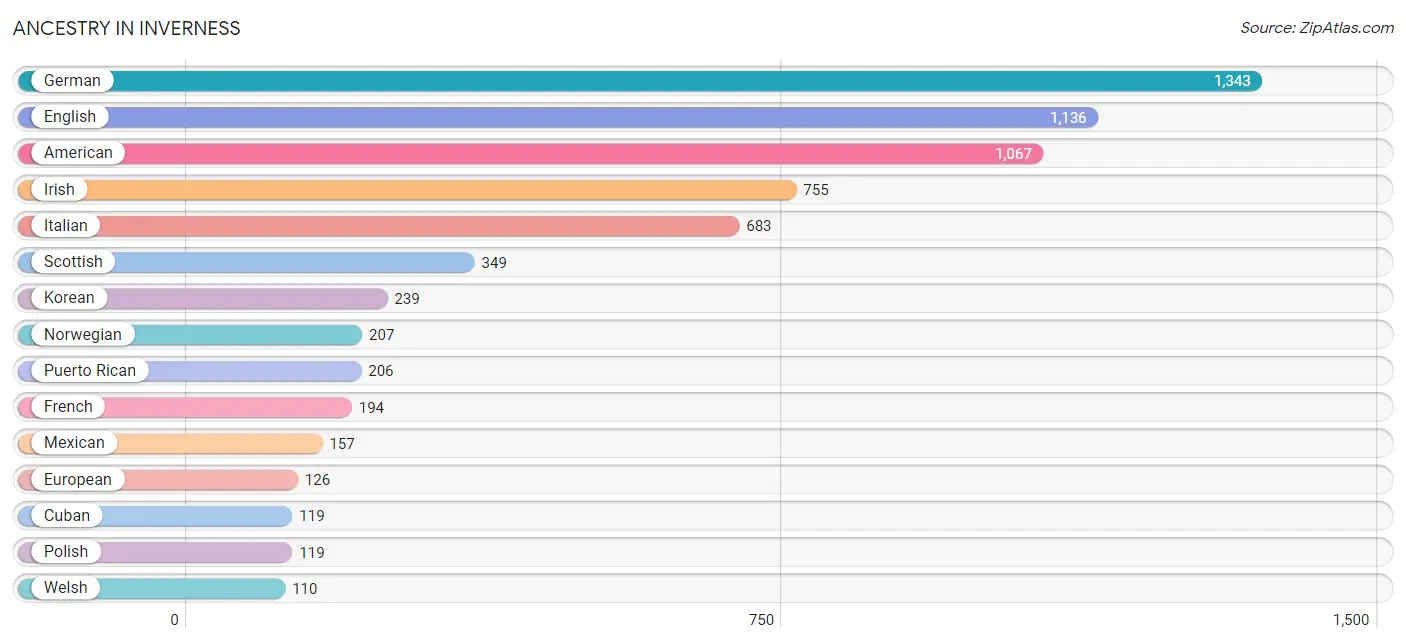
Ancestry in Inverness
The most populous ancestries reported in Inverness are German (1,343 | 17.7%), English (1,136 | 14.9%), American (1,067 | 14.0%), Irish (755 | 9.9%), and Italian (683 | 9.0%), together accounting for 65.6% of all Inverness residents.
| Ancestry | # Population | % Population |
| American | 1,067 | 14.0% |
| Barbadian | 13 | 0.2% |
| Blackfeet | 7 | 0.1% |
| Canadian | 28 | 0.4% |
| Central American | 50 | 0.7% |
| Cherokee | 12 | 0.2% |
| Chippewa | 17 | 0.2% |
| Cuban | 119 | 1.6% |
| Czech | 14 | 0.2% |
| Danish | 46 | 0.6% |
| Dutch | 57 | 0.7% |
| Eastern European | 10 | 0.1% |
| Ecuadorian | 13 | 0.2% |
| English | 1,136 | 14.9% |
| European | 126 | 1.7% |
| Finnish | 3 | 0.0% |
| French | 194 | 2.5% |
| French Canadian | 96 | 1.3% |
| German | 1,343 | 17.7% |
| Greek | 28 | 0.4% |
| Haitian | 43 | 0.6% |
| Hungarian | 36 | 0.5% |
| Irish | 755 | 9.9% |
| Israeli | 59 | 0.8% |
| Italian | 683 | 9.0% |
| Korean | 239 | 3.1% |
| Lithuanian | 28 | 0.4% |
| Mexican | 157 | 2.1% |
| Nicaraguan | 23 | 0.3% |
| Norwegian | 207 | 2.7% |
| Panamanian | 27 | 0.4% |
| Polish | 119 | 1.6% |
| Portuguese | 20 | 0.3% |
| Puerto Rican | 206 | 2.7% |
| Romanian | 28 | 0.4% |
| Russian | 47 | 0.6% |
| Scotch-Irish | 40 | 0.5% |
| Scottish | 349 | 4.6% |
| Serbian | 21 | 0.3% |
| South American | 13 | 0.2% |
| Spaniard | 31 | 0.4% |
| Spanish | 19 | 0.3% |
| Swedish | 17 | 0.2% |
| Swiss | 9 | 0.1% |
| Thai | 53 | 0.7% |
| Ukrainian | 5 | 0.1% |
| Welsh | 110 | 1.5% | View All 47 Rows |
Immigrants in Inverness
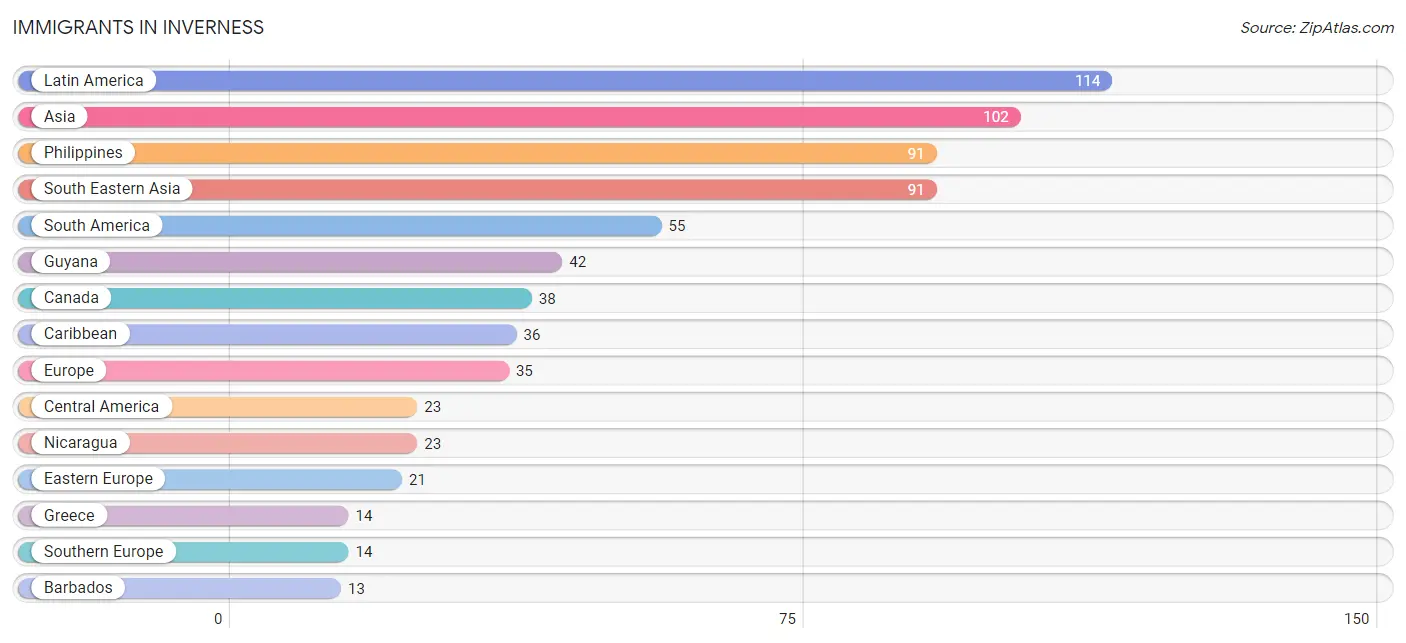
The most numerous immigrant groups reported in Inverness came from Latin America (114 | 1.5%), Asia (102 | 1.3%), Philippines (91 | 1.2%), South Eastern Asia (91 | 1.2%), and South America (55 | 0.7%), together accounting for 6.0% of all Inverness residents.
| Immigration Origin | # Population | % Population |
| Asia | 102 | 1.3% |
| Barbados | 13 | 0.2% |
| Canada | 38 | 0.5% |
| Caribbean | 36 | 0.5% |
| Central America | 23 | 0.3% |
| Cuba | 11 | 0.1% |
| Eastern Europe | 21 | 0.3% |
| Ecuador | 13 | 0.2% |
| Europe | 35 | 0.5% |
| Greece | 14 | 0.2% |
| Guyana | 42 | 0.5% |
| Haiti | 12 | 0.2% |
| India | 11 | 0.1% |
| Latin America | 114 | 1.5% |
| Nicaragua | 23 | 0.3% |
| Philippines | 91 | 1.2% |
| South America | 55 | 0.7% |
| South Central Asia | 11 | 0.1% |
| South Eastern Asia | 91 | 1.2% |
| Southern Europe | 14 | 0.2% | View All 20 Rows |
Sex and Age in Inverness
Sex and Age in Inverness
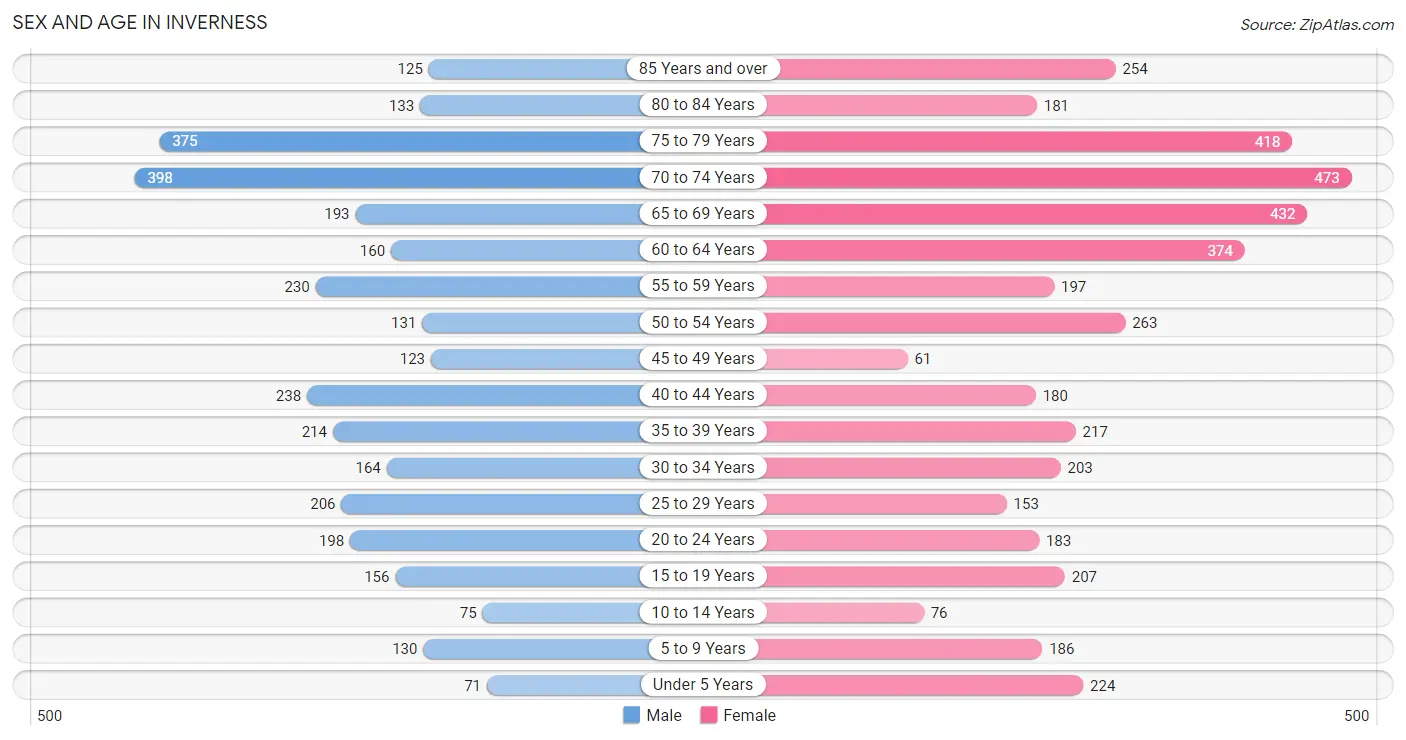
The most populous age groups in Inverness are 70 to 74 Years (398 | 12.0%) for men and 70 to 74 Years (473 | 11.1%) for women.
| Age Bracket | Male | Female |
| Under 5 Years | 71 (2.1%) | 224 (5.2%) |
| 5 to 9 Years | 130 (3.9%) | 186 (4.3%) |
| 10 to 14 Years | 75 (2.3%) | 76 (1.8%) |
| 15 to 19 Years | 156 (4.7%) | 207 (4.8%) |
| 20 to 24 Years | 198 (6.0%) | 183 (4.3%) |
| 25 to 29 Years | 206 (6.2%) | 153 (3.6%) |
| 30 to 34 Years | 164 (4.9%) | 203 (4.7%) |
| 35 to 39 Years | 214 (6.5%) | 217 (5.1%) |
| 40 to 44 Years | 238 (7.2%) | 180 (4.2%) |
| 45 to 49 Years | 123 (3.7%) | 61 (1.4%) |
| 50 to 54 Years | 131 (4.0%) | 263 (6.1%) |
| 55 to 59 Years | 230 (6.9%) | 197 (4.6%) |
| 60 to 64 Years | 160 (4.8%) | 374 (8.7%) |
| 65 to 69 Years | 193 (5.8%) | 432 (10.1%) |
| 70 to 74 Years | 398 (12.0%) | 473 (11.1%) |
| 75 to 79 Years | 375 (11.3%) | 418 (9.8%) |
| 80 to 84 Years | 133 (4.0%) | 181 (4.2%) |
| 85 Years and over | 125 (3.8%) | 254 (5.9%) |
| Total | 3,320 (100.0%) | 4,282 (100.0%) |
Families and Households in Inverness
Median Family Size in Inverness
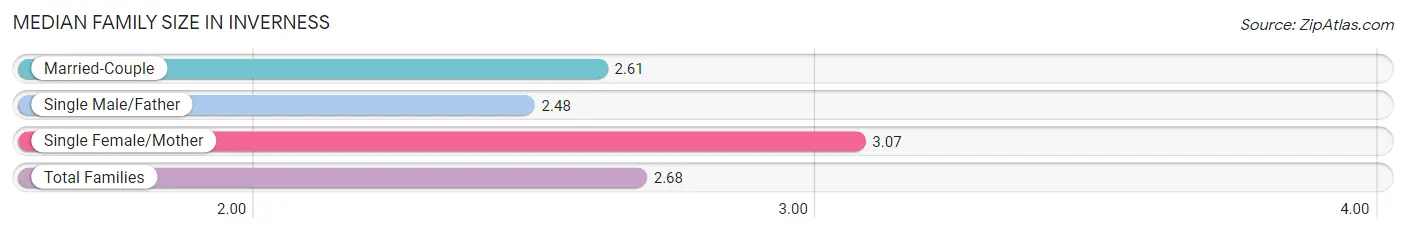
The median family size in Inverness is 2.68 persons per family, with single female/mother families (309 | 18.4%) accounting for the largest median family size of 3.07 persons per family. On the other hand, single male/father families (155 | 9.2%) represent the smallest median family size with 2.48 persons per family.
| Family Type | # Families | Family Size |
| Married-Couple | 1,212 (72.3%) | 2.61 |
| Single Male/Father | 155 (9.2%) | 2.48 |
| Single Female/Mother | 309 (18.4%) | 3.07 |
| Total Families | 1,676 (100.0%) | 2.68 |
Median Household Size in Inverness
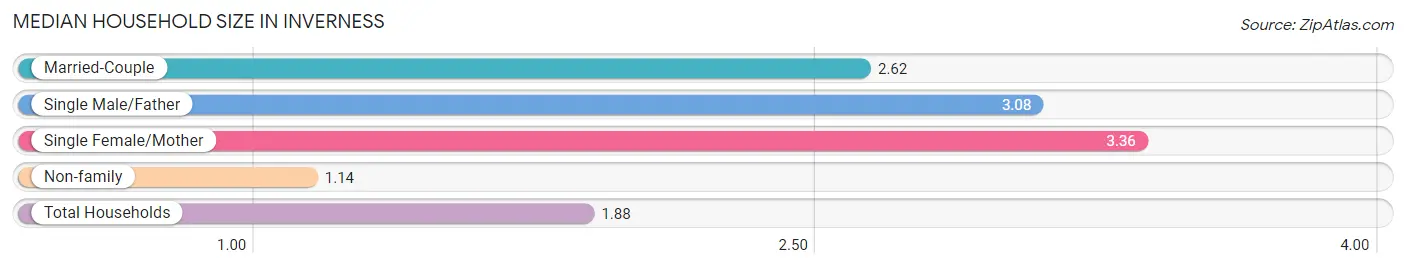
The median household size in Inverness is 1.88 persons per household, with single female/mother households (309 | 8.3%) accounting for the largest median household size of 3.36 persons per household. non-family households (2,068 | 55.2%) represent the smallest median household size with 1.14 persons per household.
| Household Type | # Households | Household Size |
| Married-Couple | 1,212 (32.4%) | 2.62 |
| Single Male/Father | 155 (4.1%) | 3.08 |
| Single Female/Mother | 309 (8.3%) | 3.36 |
| Non-family | 2,068 (55.2%) | 1.14 |
| Total Households | 3,744 (100.0%) | 1.88 |
Household Size by Marriage Status in Inverness
Out of a total of 3,744 households in Inverness, 1,676 (44.8%) are family households, while 2,068 (55.2%) are nonfamily households. The most numerous type of family households are 2-person households, comprising 920, and the most common type of nonfamily households are 1-person households, comprising 1,810.
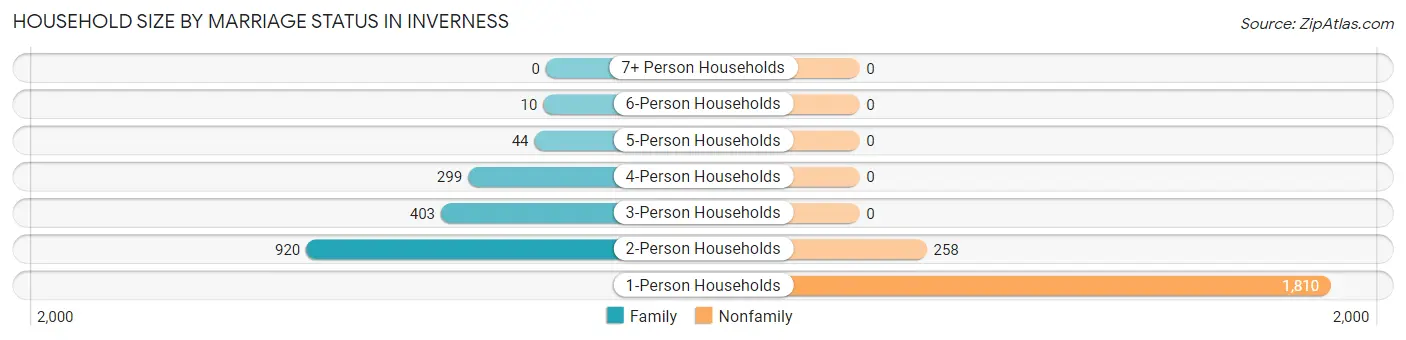
| Household Size | Family Households | Nonfamily Households |
| 1-Person Households | - | 1,810 (48.3%) |
| 2-Person Households | 920 (24.6%) | 258 (6.9%) |
| 3-Person Households | 403 (10.8%) | 0 (0.0%) |
| 4-Person Households | 299 (8.0%) | 0 (0.0%) |
| 5-Person Households | 44 (1.2%) | 0 (0.0%) |
| 6-Person Households | 10 (0.3%) | 0 (0.0%) |
| 7+ Person Households | 0 (0.0%) | 0 (0.0%) |
| Total | 1,676 (44.8%) | 2,068 (55.2%) |
Female Fertility in Inverness
Fertility by Age in Inverness
Average fertility rate in Inverness is 107.0 births per 1,000 women. Women in the age bracket of 20 to 34 years have the highest fertility rate with 223.0 births per 1,000 women. Women in the age bracket of 20 to 34 years acount for 93.0% of all women with births.
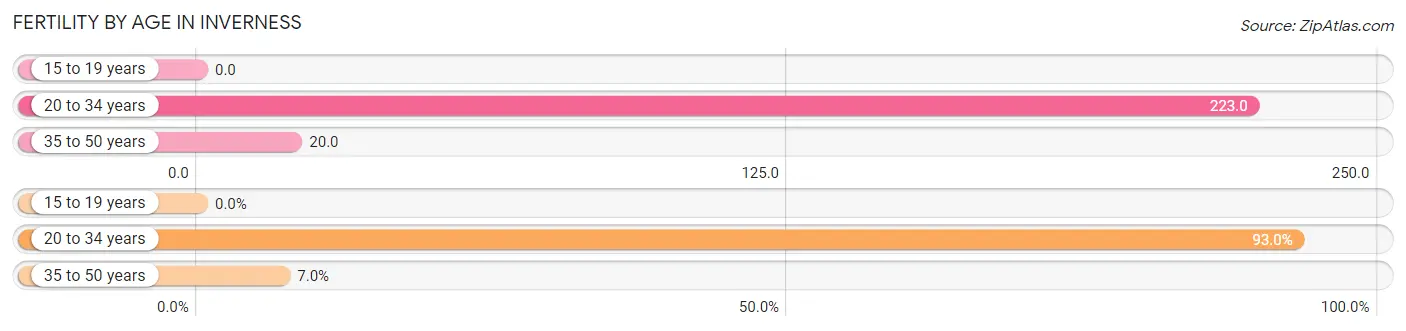
| Age Bracket | Women with Births | Births / 1,000 Women |
| 15 to 19 years | 0 (0.0%) | 0.0 |
| 20 to 34 years | 120 (93.0%) | 223.0 |
| 35 to 50 years | 9 (7.0%) | 20.0 |
| Total | 129 (100.0%) | 107.0 |
Fertility by Age by Marriage Status in Inverness
93.0% of women with births (129) in Inverness are married. The highest percentage of unmarried women with births falls into 35 to 50 years age bracket with 100.0% of them unmarried at the time of birth, while the lowest percentage of unmarried women with births belong to 20 to 34 years age bracket with 0.0% of them unmarried.
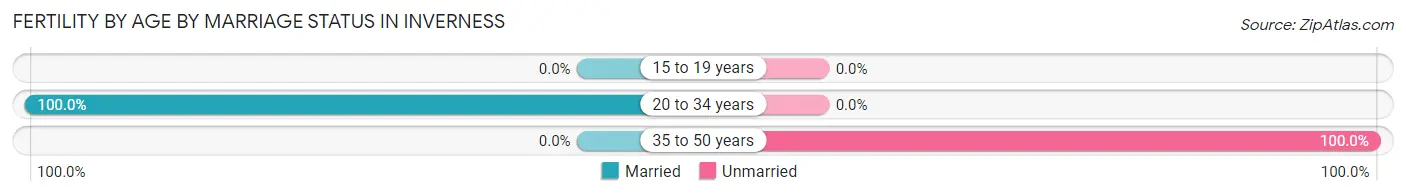
| Age Bracket | Married | Unmarried |
| 15 to 19 years | 0 (0.0%) | 0 (0.0%) |
| 20 to 34 years | 120 (100.0%) | 0 (0.0%) |
| 35 to 50 years | 0 (0.0%) | 9 (100.0%) |
| Total | 120 (93.0%) | 9 (7.0%) |
Fertility by Education in Inverness
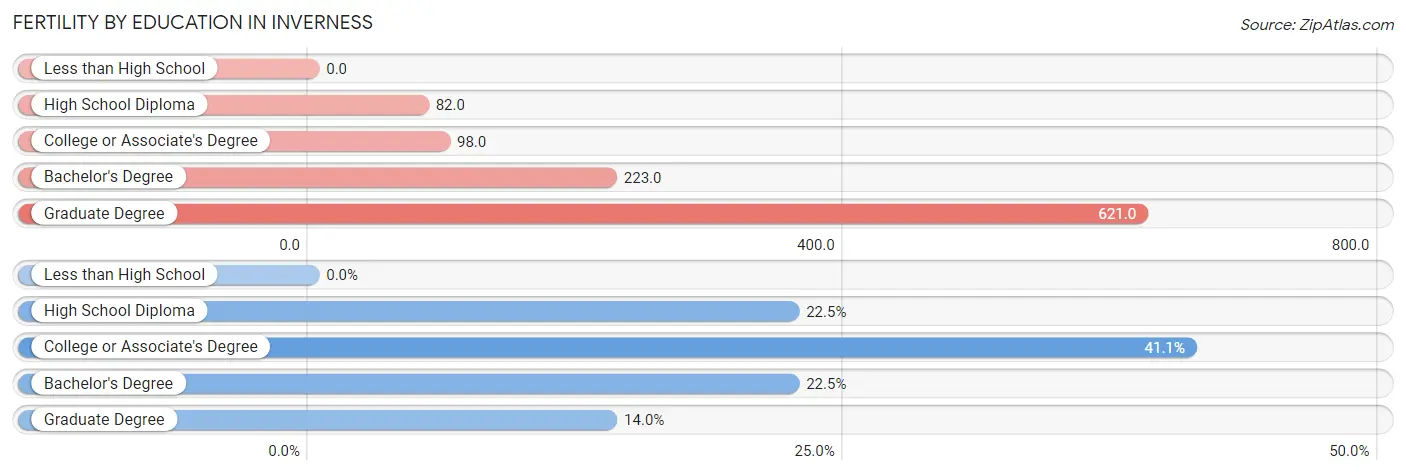
| Educational Attainment | Women with Births | Births / 1,000 Women |
| Less than High School | 0 (0.0%) | 0.0 |
| High School Diploma | 29 (22.5%) | 82.0 |
| College or Associate's Degree | 53 (41.1%) | 98.0 |
| Bachelor's Degree | 29 (22.5%) | 223.0 |
| Graduate Degree | 18 (14.0%) | 621.0 |
| Total | 129 (100.0%) | 107.0 |
Fertility by Education by Marriage Status in Inverness
7.0% of women with births in Inverness are unmarried. Women with the educational attainment of high school diploma are most likely to be married with 100.0% of them married at childbirth, while women with the educational attainment of college or associate's degree are least likely to be married with 17.0% of them unmarried at childbirth.
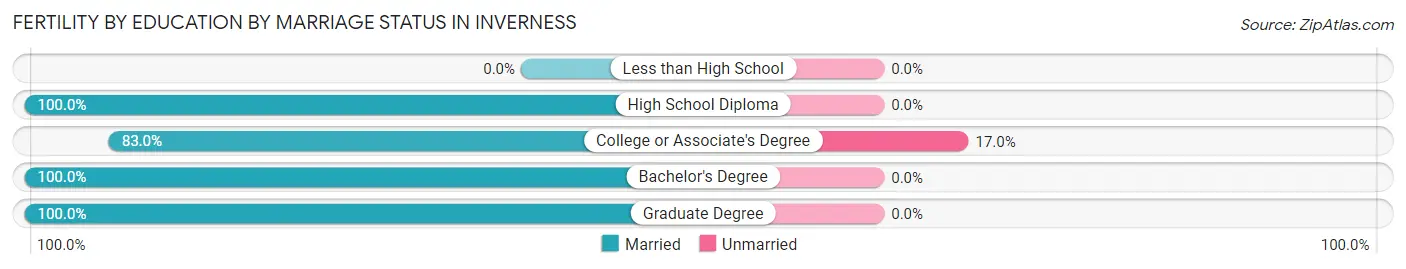
| Educational Attainment | Married | Unmarried |
| Less than High School | 0 (0.0%) | 0 (0.0%) |
| High School Diploma | 29 (100.0%) | 0 (0.0%) |
| College or Associate's Degree | 44 (83.0%) | 9 (17.0%) |
| Bachelor's Degree | 29 (100.0%) | 0 (0.0%) |
| Graduate Degree | 18 (100.0%) | 0 (0.0%) |
| Total | 120 (93.0%) | 9 (7.0%) |
Employment Characteristics in Inverness
Employment by Class of Employer in Inverness
Among the 2,904 employed individuals in Inverness, private company employees (2,096 | 72.2%), not-for-profit organizations (235 | 8.1%), and self-employed (not incorporated) (156 | 5.4%) make up the most common classes of employment.
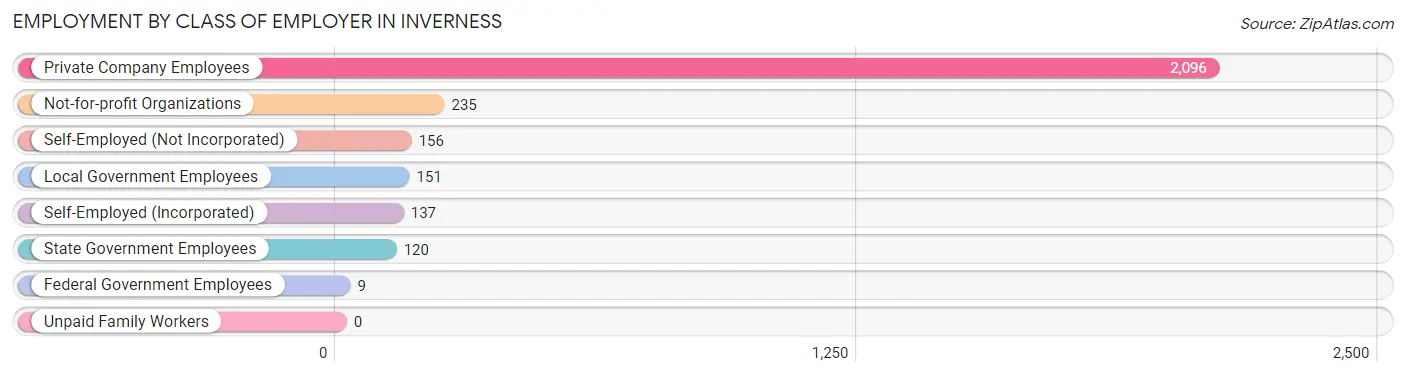
| Employer Class | # Employees | % Employees |
| Private Company Employees | 2,096 | 72.2% |
| Self-Employed (Incorporated) | 137 | 4.7% |
| Self-Employed (Not Incorporated) | 156 | 5.4% |
| Not-for-profit Organizations | 235 | 8.1% |
| Local Government Employees | 151 | 5.2% |
| State Government Employees | 120 | 4.1% |
| Federal Government Employees | 9 | 0.3% |
| Unpaid Family Workers | 0 | 0.0% |
| Total | 2,904 | 100.0% |
Employment Status by Age in Inverness
According to the labor force statistics for Inverness, out of the total population over 16 years of age (6,741), 46.6% or 3,141 individuals are in the labor force, with 7.2% or 226 of them unemployed. The age group with the highest labor force participation rate is 30 to 34 years, with 98.1% or 360 individuals in the labor force. Within the labor force, the 65 to 74 years age range has the highest percentage of unemployed individuals, with 22.5% or 53 of them being unemployed.
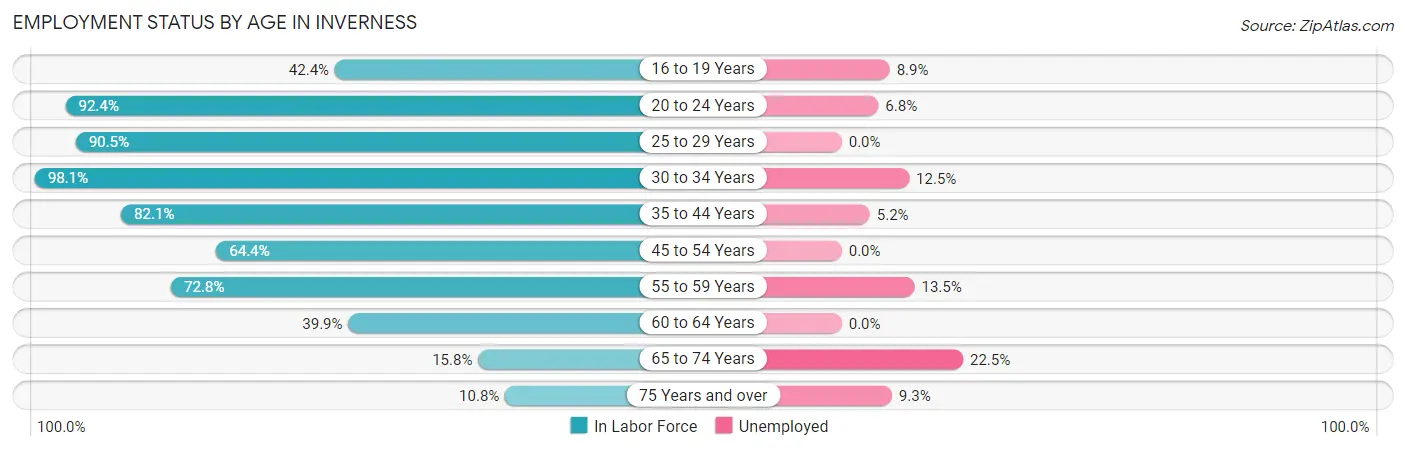
| Age Bracket | In Labor Force | Unemployed |
| 16 to 19 Years | 112 (42.4%) | 10 (8.9%) |
| 20 to 24 Years | 352 (92.4%) | 24 (6.8%) |
| 25 to 29 Years | 325 (90.5%) | 0 (0.0%) |
| 30 to 34 Years | 360 (98.1%) | 45 (12.5%) |
| 35 to 44 Years | 697 (82.1%) | 36 (5.2%) |
| 45 to 54 Years | 372 (64.4%) | 0 (0.0%) |
| 55 to 59 Years | 311 (72.8%) | 42 (13.5%) |
| 60 to 64 Years | 213 (39.9%) | 0 (0.0%) |
| 65 to 74 Years | 236 (15.8%) | 53 (22.5%) |
| 75 Years and over | 160 (10.8%) | 15 (9.3%) |
| Total | 3,141 (46.6%) | 226 (7.2%) |
Employment Status by Educational Attainment in Inverness
According to labor force statistics for Inverness, 73.2% of individuals (2,279) out of the total population between 25 and 64 years of age (3,114) are in the labor force, with 5.4% or 123 of them being unemployed. The group with the highest labor force participation rate are those with the educational attainment of less than high school, with 83.2% or 129 individuals in the labor force. Within the labor force, individuals with bachelor's degree or higher education have the highest percentage of unemployment, with 10.8% or 47 of them being unemployed.
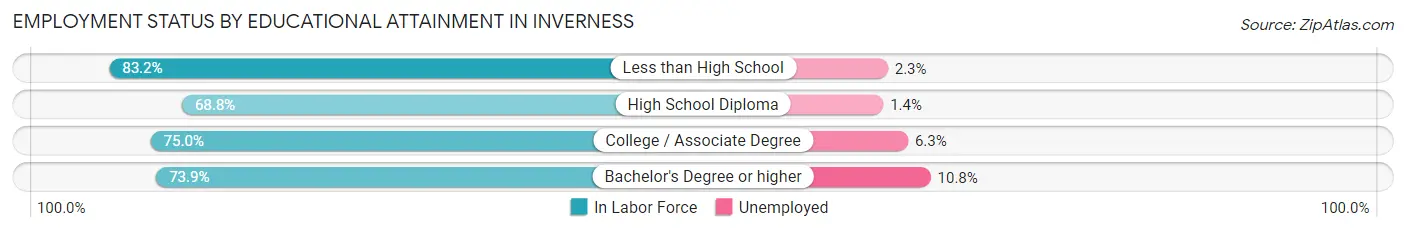
| Educational Attainment | In Labor Force | Unemployed |
| Less than High School | 129 (83.2%) | 4 (2.3%) |
| High School Diploma | 714 (68.8%) | 15 (1.4%) |
| College / Associate Degree | 1,000 (75.0%) | 84 (6.3%) |
| Bachelor's Degree or higher | 434 (73.9%) | 63 (10.8%) |
| Total | 2,279 (73.2%) | 168 (5.4%) |
Employment Occupations by Sex in Inverness
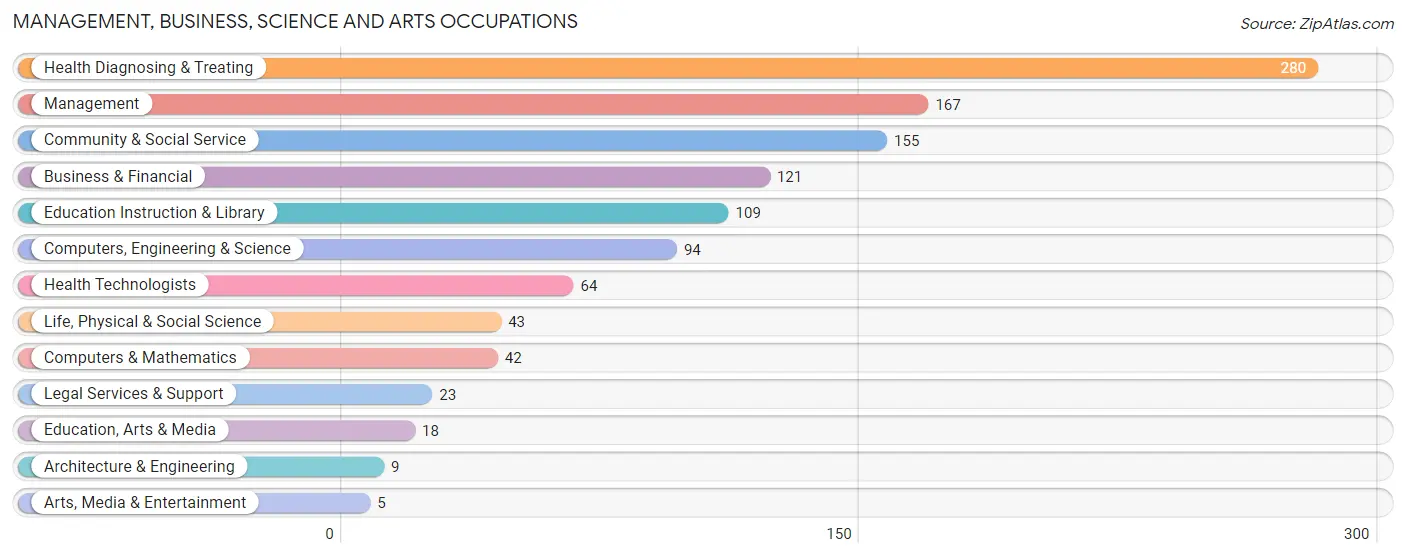
Management, Business, Science and Arts Occupations
The most common Management, Business, Science and Arts occupations in Inverness are Health Diagnosing & Treating (280 | 9.6%), Management (167 | 5.7%), Community & Social Service (155 | 5.3%), Business & Financial (121 | 4.2%), and Education Instruction & Library (109 | 3.7%).
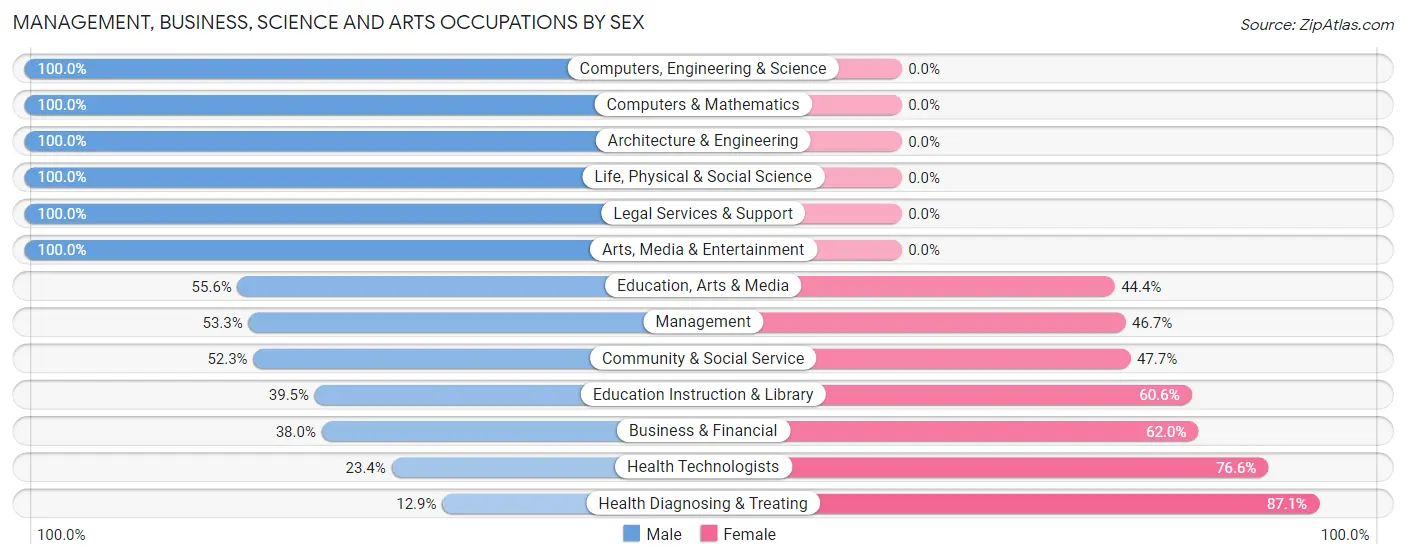
Management, Business, Science and Arts Occupations by Sex
Within the Management, Business, Science and Arts occupations in Inverness, the most male-oriented occupations are Computers, Engineering & Science (100.0%), Computers & Mathematics (100.0%), and Architecture & Engineering (100.0%), while the most female-oriented occupations are Health Diagnosing & Treating (87.1%), Health Technologists (76.6%), and Business & Financial (62.0%).
| Occupation | Male | Female |
| Management | 89 (53.3%) | 78 (46.7%) |
| Business & Financial | 46 (38.0%) | 75 (62.0%) |
| Computers, Engineering & Science | 94 (100.0%) | 0 (0.0%) |
| Computers & Mathematics | 42 (100.0%) | 0 (0.0%) |
| Architecture & Engineering | 9 (100.0%) | 0 (0.0%) |
| Life, Physical & Social Science | 43 (100.0%) | 0 (0.0%) |
| Community & Social Service | 81 (52.3%) | 74 (47.7%) |
| Education, Arts & Media | 10 (55.6%) | 8 (44.4%) |
| Legal Services & Support | 23 (100.0%) | 0 (0.0%) |
| Education Instruction & Library | 43 (39.5%) | 66 (60.6%) |
| Arts, Media & Entertainment | 5 (100.0%) | 0 (0.0%) |
| Health Diagnosing & Treating | 36 (12.9%) | 244 (87.1%) |
| Health Technologists | 15 (23.4%) | 49 (76.6%) |
| Total (Category) | 346 (42.3%) | 471 (57.7%) |
| Total (Overall) | 1,456 (50.0%) | 1,458 (50.0%) |
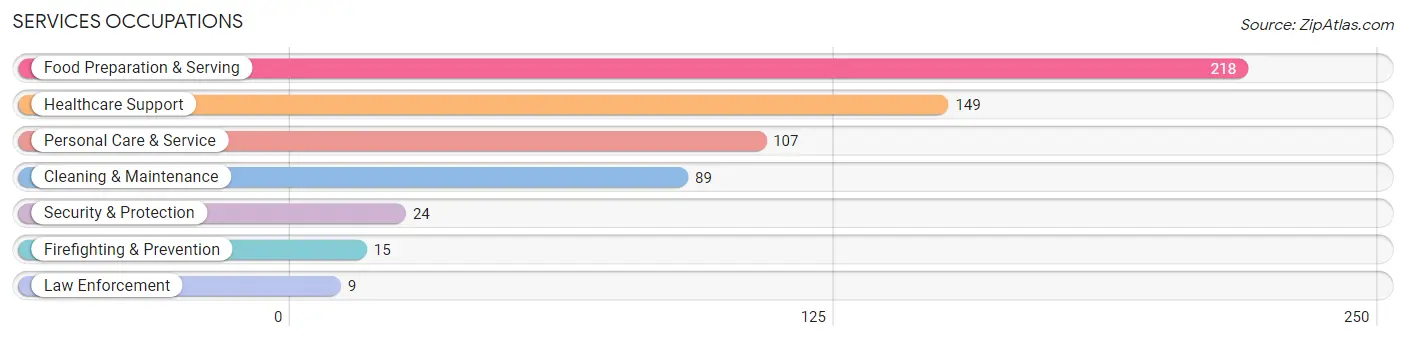
Services Occupations
The most common Services occupations in Inverness are Food Preparation & Serving (218 | 7.5%), Healthcare Support (149 | 5.1%), Personal Care & Service (107 | 3.7%), Cleaning & Maintenance (89 | 3.0%), and Security & Protection (24 | 0.8%).
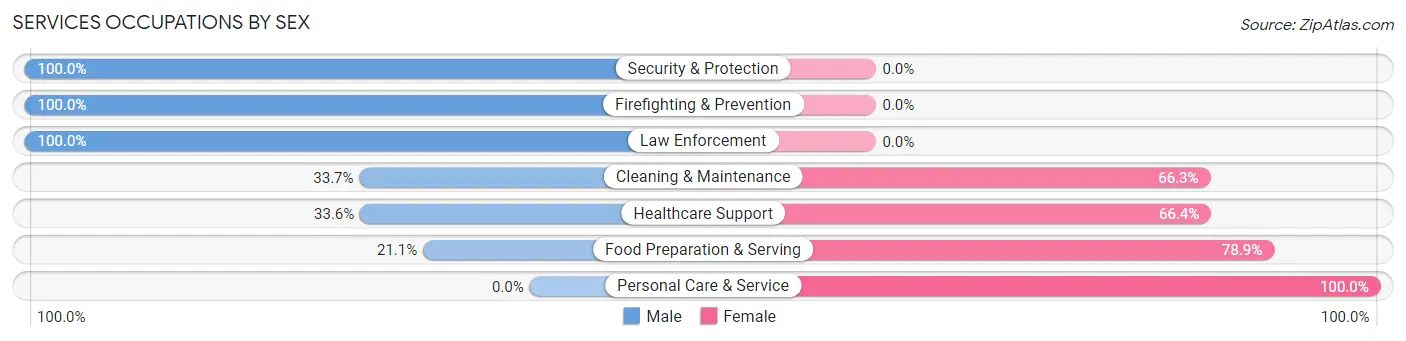
Services Occupations by Sex
Within the Services occupations in Inverness, the most male-oriented occupations are Security & Protection (100.0%), Firefighting & Prevention (100.0%), and Law Enforcement (100.0%), while the most female-oriented occupations are Personal Care & Service (100.0%), Food Preparation & Serving (78.9%), and Healthcare Support (66.4%).
| Occupation | Male | Female |
| Healthcare Support | 50 (33.6%) | 99 (66.4%) |
| Security & Protection | 24 (100.0%) | 0 (0.0%) |
| Firefighting & Prevention | 15 (100.0%) | 0 (0.0%) |
| Law Enforcement | 9 (100.0%) | 0 (0.0%) |
| Food Preparation & Serving | 46 (21.1%) | 172 (78.9%) |
| Cleaning & Maintenance | 30 (33.7%) | 59 (66.3%) |
| Personal Care & Service | 0 (0.0%) | 107 (100.0%) |
| Total (Category) | 150 (25.6%) | 437 (74.5%) |
| Total (Overall) | 1,456 (50.0%) | 1,458 (50.0%) |
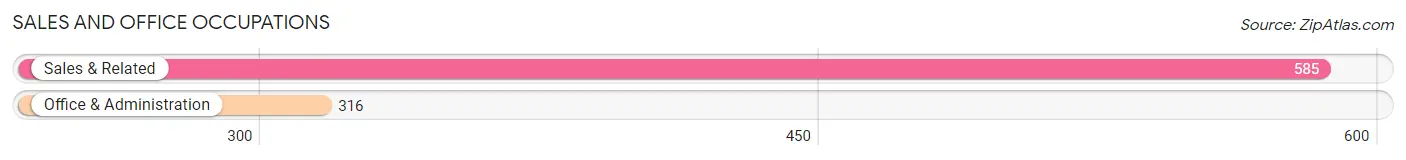
Sales and Office Occupations
The most common Sales and Office occupations in Inverness are Sales & Related (585 | 20.1%), and Office & Administration (316 | 10.8%).
Sales and Office Occupations by Sex
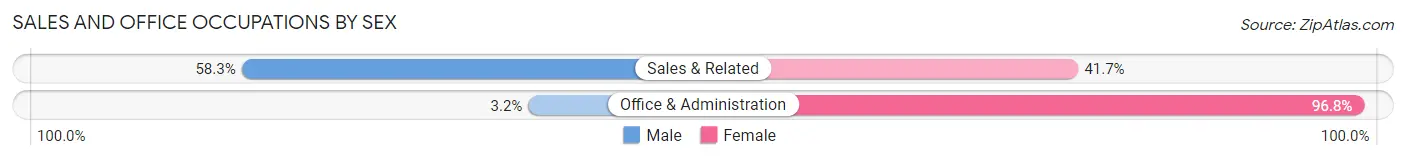
| Occupation | Male | Female |
| Sales & Related | 341 (58.3%) | 244 (41.7%) |
| Office & Administration | 10 (3.2%) | 306 (96.8%) |
| Total (Category) | 351 (39.0%) | 550 (61.0%) |
| Total (Overall) | 1,456 (50.0%) | 1,458 (50.0%) |
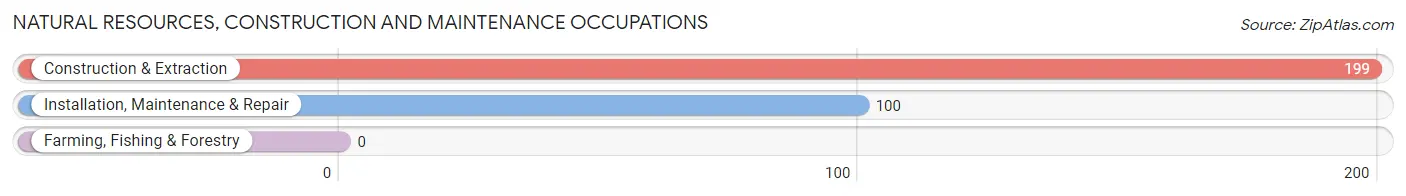
Natural Resources, Construction and Maintenance Occupations
The most common Natural Resources, Construction and Maintenance occupations in Inverness are Construction & Extraction (199 | 6.8%), and Installation, Maintenance & Repair (100 | 3.4%).
Natural Resources, Construction and Maintenance Occupations by Sex
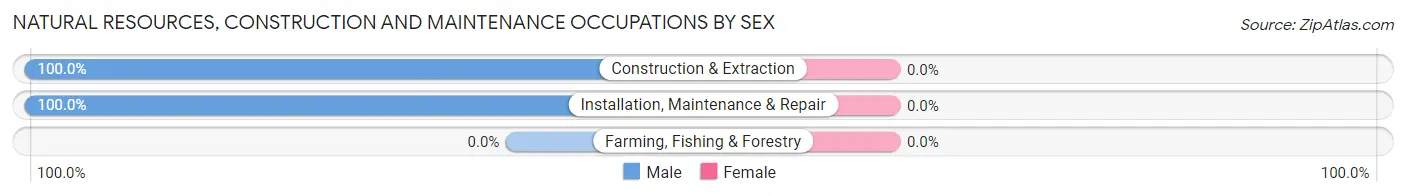
| Occupation | Male | Female |
| Farming, Fishing & Forestry | 0 (0.0%) | 0 (0.0%) |
| Construction & Extraction | 199 (100.0%) | 0 (0.0%) |
| Installation, Maintenance & Repair | 100 (100.0%) | 0 (0.0%) |
| Total (Category) | 299 (100.0%) | 0 (0.0%) |
| Total (Overall) | 1,456 (50.0%) | 1,458 (50.0%) |
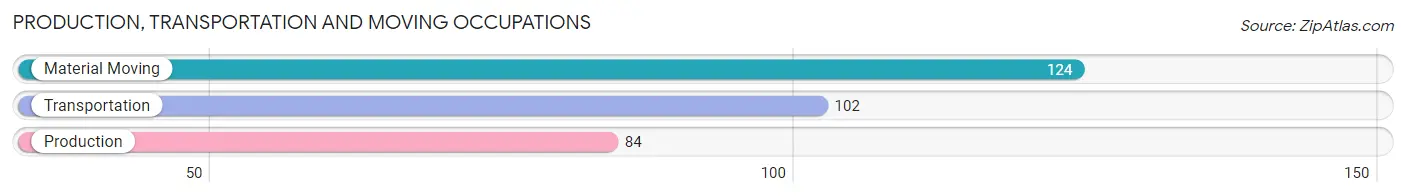
Production, Transportation and Moving Occupations
The most common Production, Transportation and Moving occupations in Inverness are Material Moving (124 | 4.3%), Transportation (102 | 3.5%), and Production (84 | 2.9%).
Production, Transportation and Moving Occupations by Sex
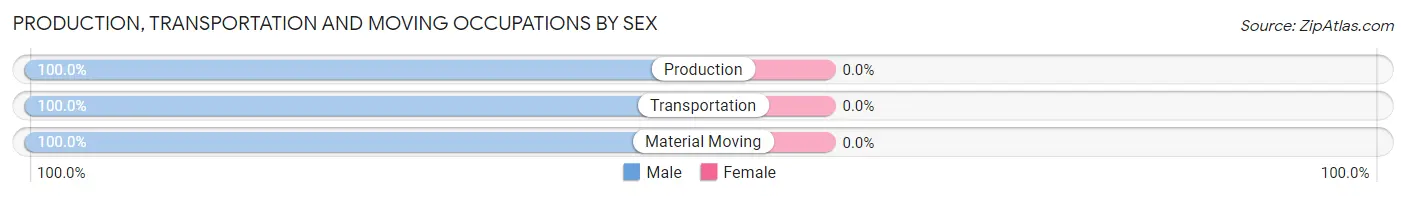
| Occupation | Male | Female |
| Production | 84 (100.0%) | 0 (0.0%) |
| Transportation | 102 (100.0%) | 0 (0.0%) |
| Material Moving | 124 (100.0%) | 0 (0.0%) |
| Total (Category) | 310 (100.0%) | 0 (0.0%) |
| Total (Overall) | 1,456 (50.0%) | 1,458 (50.0%) |
Employment Industries by Sex in Inverness
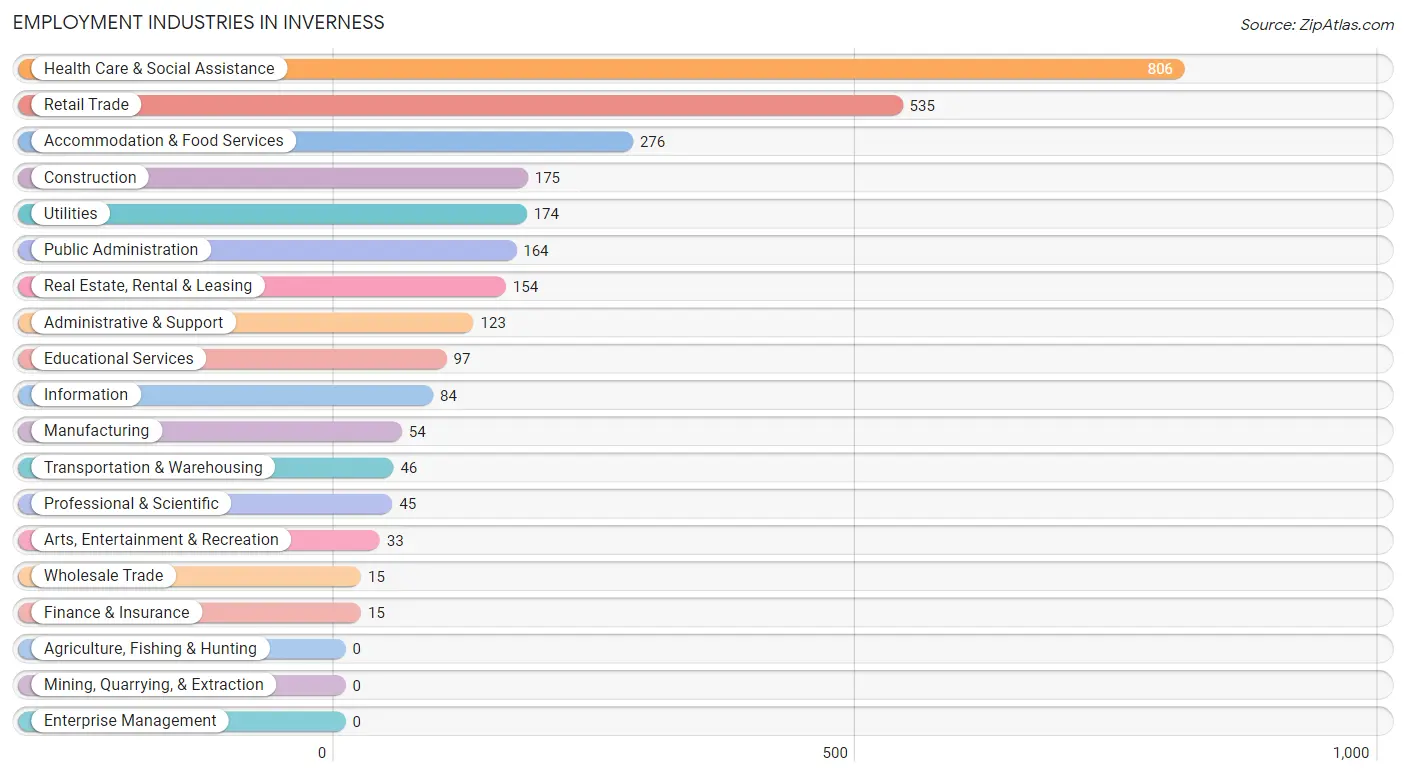
Employment Industries in Inverness
The major employment industries in Inverness include Health Care & Social Assistance (806 | 27.7%), Retail Trade (535 | 18.4%), Accommodation & Food Services (276 | 9.5%), Construction (175 | 6.0%), and Utilities (174 | 6.0%).
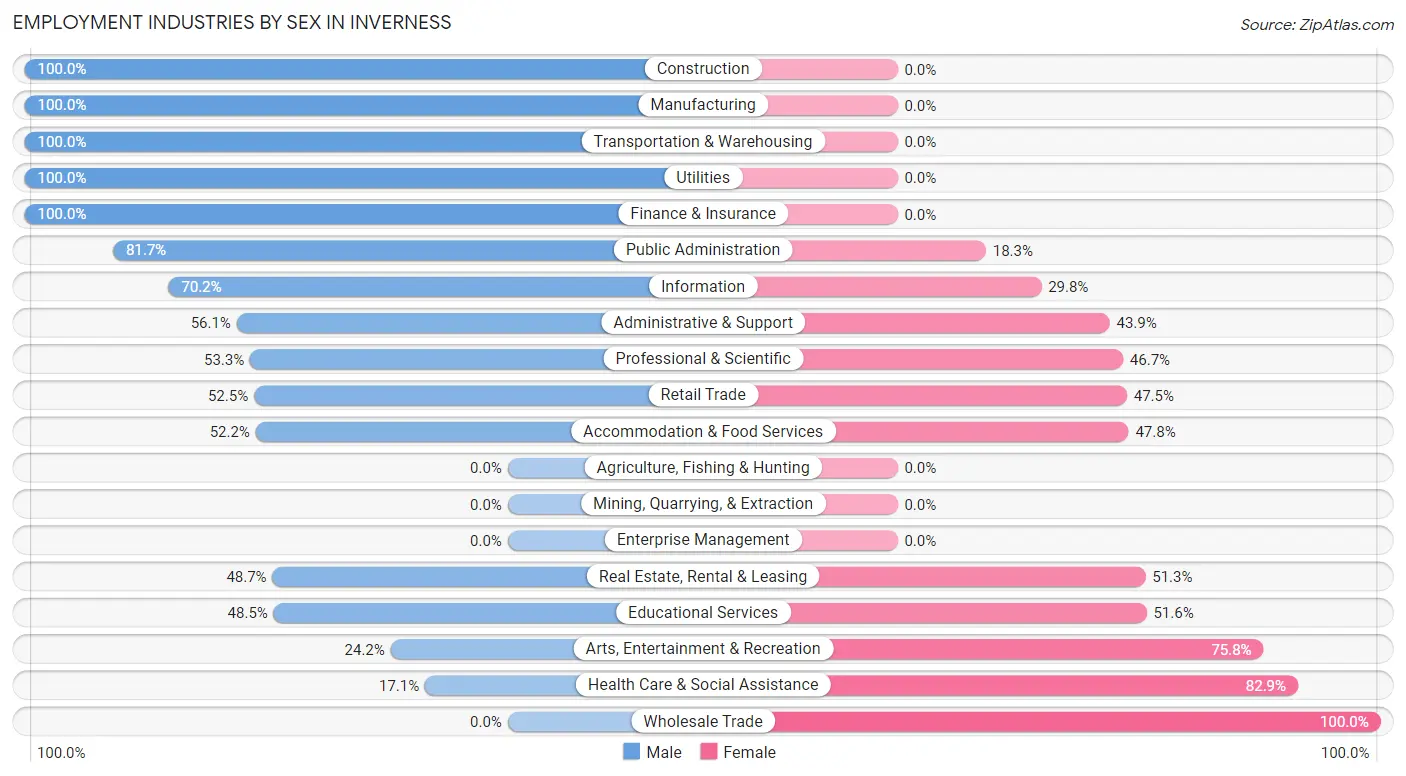
Employment Industries by Sex in Inverness
The Inverness industries that see more men than women are Construction (100.0%), Manufacturing (100.0%), and Transportation & Warehousing (100.0%), whereas the industries that tend to have a higher number of women are Wholesale Trade (100.0%), Health Care & Social Assistance (82.9%), and Arts, Entertainment & Recreation (75.8%).
| Industry | Male | Female |
| Agriculture, Fishing & Hunting | 0 (0.0%) | 0 (0.0%) |
| Mining, Quarrying, & Extraction | 0 (0.0%) | 0 (0.0%) |
| Construction | 175 (100.0%) | 0 (0.0%) |
| Manufacturing | 54 (100.0%) | 0 (0.0%) |
| Wholesale Trade | 0 (0.0%) | 15 (100.0%) |
| Retail Trade | 281 (52.5%) | 254 (47.5%) |
| Transportation & Warehousing | 46 (100.0%) | 0 (0.0%) |
| Utilities | 174 (100.0%) | 0 (0.0%) |
| Information | 59 (70.2%) | 25 (29.8%) |
| Finance & Insurance | 15 (100.0%) | 0 (0.0%) |
| Real Estate, Rental & Leasing | 75 (48.7%) | 79 (51.3%) |
| Professional & Scientific | 24 (53.3%) | 21 (46.7%) |
| Enterprise Management | 0 (0.0%) | 0 (0.0%) |
| Administrative & Support | 69 (56.1%) | 54 (43.9%) |
| Educational Services | 47 (48.4%) | 50 (51.5%) |
| Health Care & Social Assistance | 138 (17.1%) | 668 (82.9%) |
| Arts, Entertainment & Recreation | 8 (24.2%) | 25 (75.8%) |
| Accommodation & Food Services | 144 (52.2%) | 132 (47.8%) |
| Public Administration | 134 (81.7%) | 30 (18.3%) |
| Total | 1,456 (50.0%) | 1,458 (50.0%) |
Education in Inverness
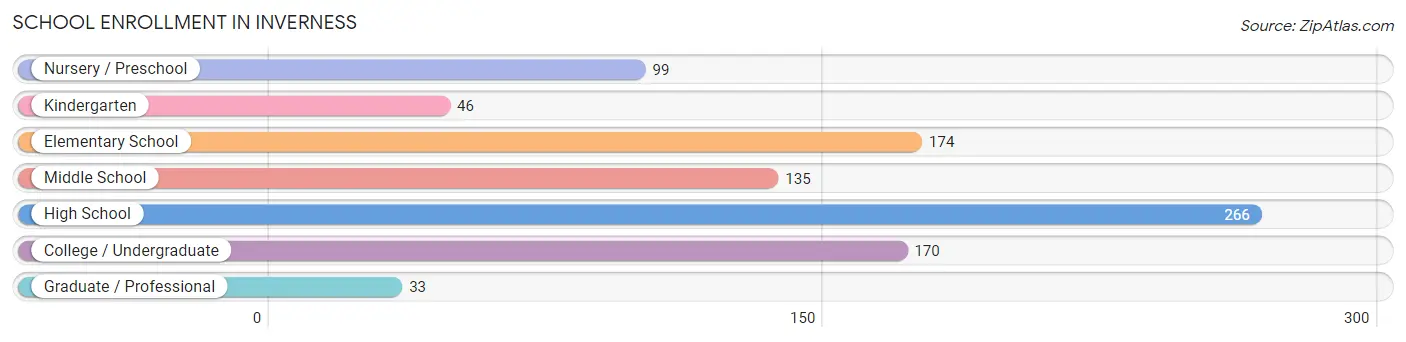
School Enrollment in Inverness
The most common levels of schooling among the 923 students in Inverness are high school (266 | 28.8%), elementary school (174 | 18.9%), and college / undergraduate (170 | 18.4%).
| School Level | # Students | % Students |
| Nursery / Preschool | 99 | 10.7% |
| Kindergarten | 46 | 5.0% |
| Elementary School | 174 | 18.9% |
| Middle School | 135 | 14.6% |
| High School | 266 | 28.8% |
| College / Undergraduate | 170 | 18.4% |
| Graduate / Professional | 33 | 3.6% |
| Total | 923 | 100.0% |
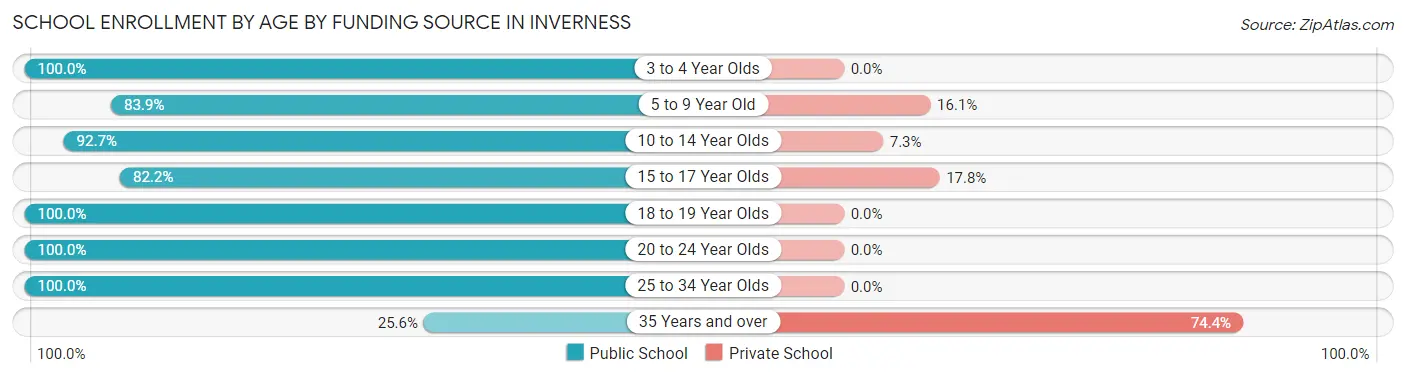
School Enrollment by Age by Funding Source in Inverness
Out of a total of 923 students who are enrolled in schools in Inverness, 103 (11.2%) attend a private institution, while the remaining 820 (88.8%) are enrolled in public schools. The age group of 35 years and over has the highest likelihood of being enrolled in private schools, with 29 (74.4% in the age bracket) enrolled. Conversely, the age group of 3 to 4 year olds has the lowest likelihood of being enrolled in a private school, with 99 (100.0% in the age bracket) attending a public institution.
| Age Bracket | Public School | Private School |
| 3 to 4 Year Olds | 99 (100.0%) | 0 (0.0%) |
| 5 to 9 Year Old | 177 (83.9%) | 34 (16.1%) |
| 10 to 14 Year Olds | 140 (92.7%) | 11 (7.3%) |
| 15 to 17 Year Olds | 134 (82.2%) | 29 (17.8%) |
| 18 to 19 Year Olds | 126 (100.0%) | 0 (0.0%) |
| 20 to 24 Year Olds | 70 (100.0%) | 0 (0.0%) |
| 25 to 34 Year Olds | 64 (100.0%) | 0 (0.0%) |
| 35 Years and over | 10 (25.6%) | 29 (74.4%) |
| Total | 820 (88.8%) | 103 (11.2%) |
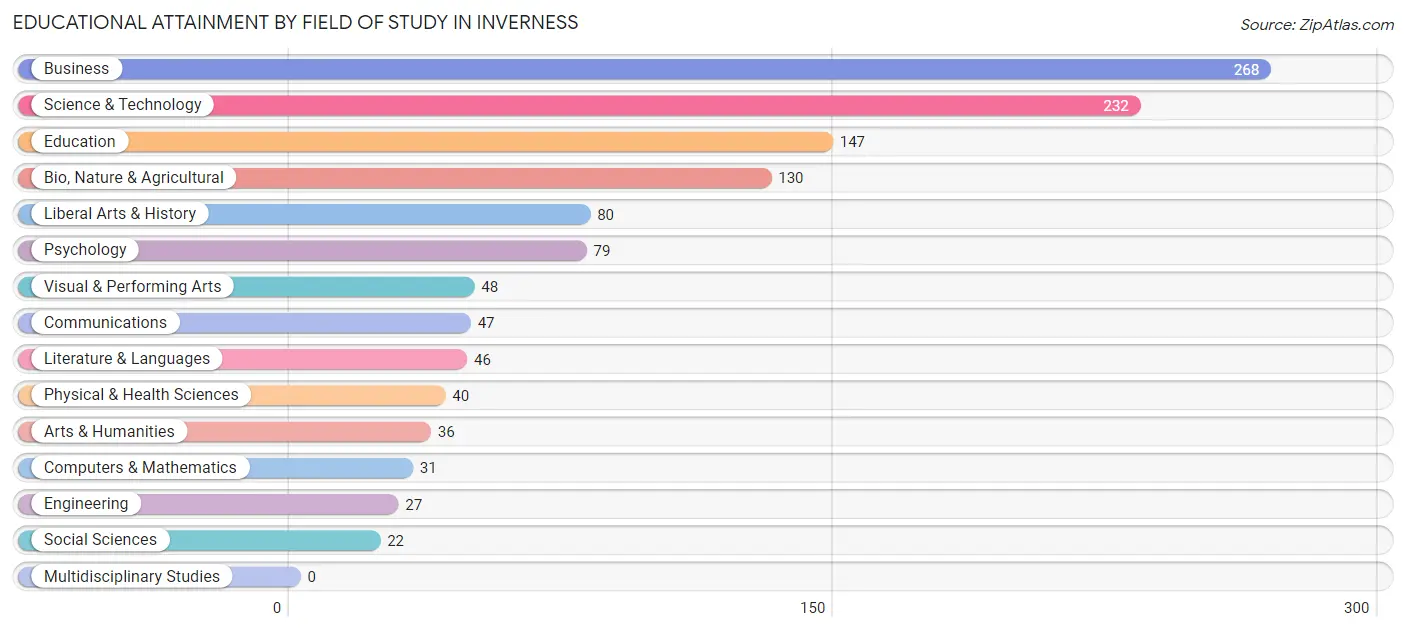
Educational Attainment by Field of Study in Inverness
Business (268 | 21.7%), science & technology (232 | 18.8%), education (147 | 11.9%), bio, nature & agricultural (130 | 10.5%), and liberal arts & history (80 | 6.5%) are the most common fields of study among 1,233 individuals in Inverness who have obtained a bachelor's degree or higher.
| Field of Study | # Graduates | % Graduates |
| Computers & Mathematics | 31 | 2.5% |
| Bio, Nature & Agricultural | 130 | 10.5% |
| Physical & Health Sciences | 40 | 3.2% |
| Psychology | 79 | 6.4% |
| Social Sciences | 22 | 1.8% |
| Engineering | 27 | 2.2% |
| Multidisciplinary Studies | 0 | 0.0% |
| Science & Technology | 232 | 18.8% |
| Business | 268 | 21.7% |
| Education | 147 | 11.9% |
| Literature & Languages | 46 | 3.7% |
| Liberal Arts & History | 80 | 6.5% |
| Visual & Performing Arts | 48 | 3.9% |
| Communications | 47 | 3.8% |
| Arts & Humanities | 36 | 2.9% |
| Total | 1,233 | 100.0% |
Transportation & Commute in Inverness
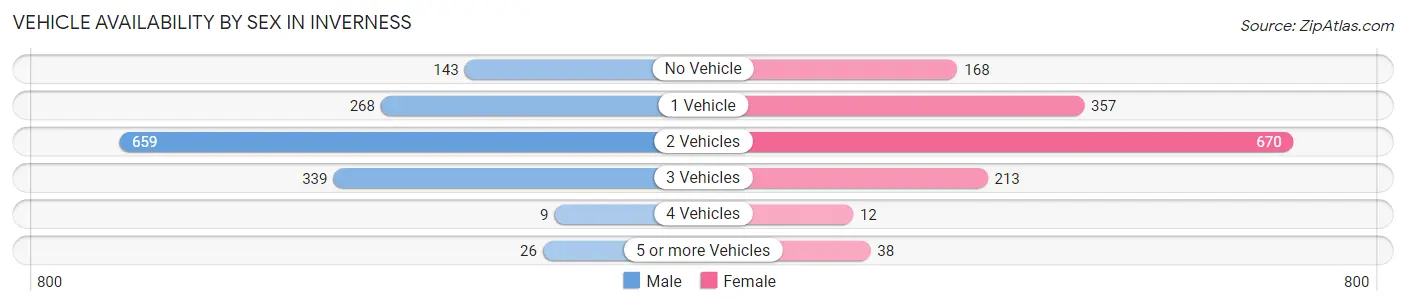
Vehicle Availability by Sex in Inverness
The most prevalent vehicle ownership categories in Inverness are males with 2 vehicles (659, accounting for 45.6%) and females with 2 vehicles (670, making up 45.2%).
| Vehicles Available | Male | Female |
| No Vehicle | 143 (9.9%) | 168 (11.5%) |
| 1 Vehicle | 268 (18.6%) | 357 (24.5%) |
| 2 Vehicles | 659 (45.6%) | 670 (46.0%) |
| 3 Vehicles | 339 (23.5%) | 213 (14.6%) |
| 4 Vehicles | 9 (0.6%) | 12 (0.8%) |
| 5 or more Vehicles | 26 (1.8%) | 38 (2.6%) |
| Total | 1,444 (100.0%) | 1,458 (100.0%) |
Commute Time in Inverness
The most frequently occuring commute durations in Inverness are 10 to 14 minutes (495 commuters, 19.1%), 5 to 9 minutes (401 commuters, 15.5%), and 15 to 19 minutes (291 commuters, 11.2%).
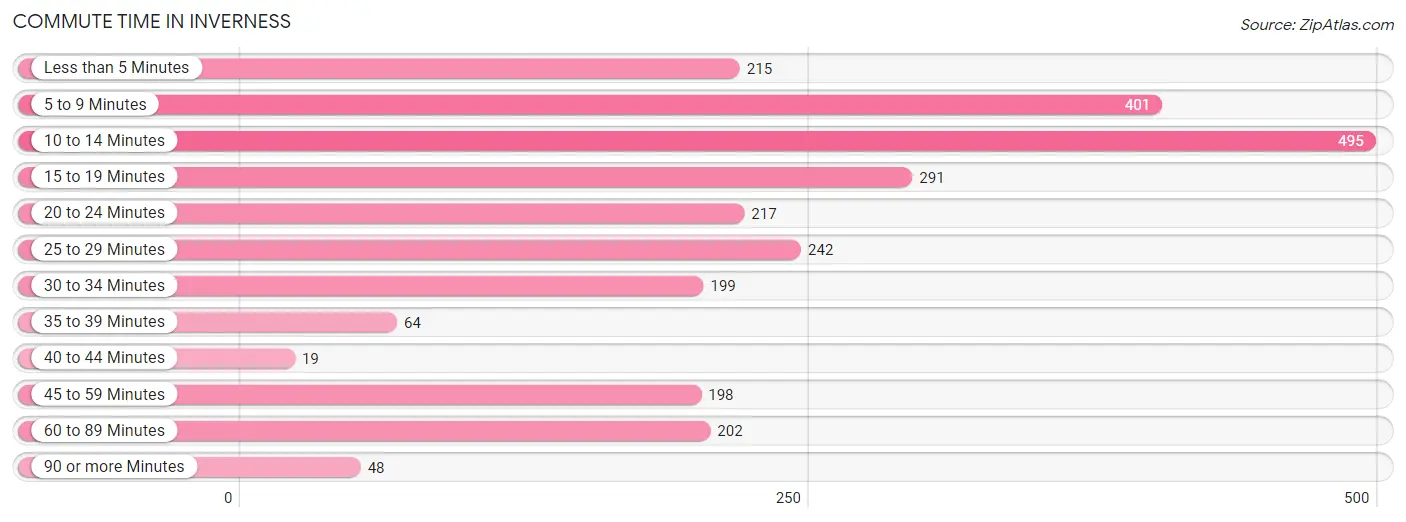
| Commute Time | # Commuters | % Commuters |
| Less than 5 Minutes | 215 | 8.3% |
| 5 to 9 Minutes | 401 | 15.5% |
| 10 to 14 Minutes | 495 | 19.1% |
| 15 to 19 Minutes | 291 | 11.2% |
| 20 to 24 Minutes | 217 | 8.4% |
| 25 to 29 Minutes | 242 | 9.3% |
| 30 to 34 Minutes | 199 | 7.7% |
| 35 to 39 Minutes | 64 | 2.5% |
| 40 to 44 Minutes | 19 | 0.7% |
| 45 to 59 Minutes | 198 | 7.6% |
| 60 to 89 Minutes | 202 | 7.8% |
| 90 or more Minutes | 48 | 1.8% |
Commute Time by Sex in Inverness
The most common commute times in Inverness are 60 to 89 minutes (202 commuters, 15.5%) for males and 10 to 14 minutes (392 commuters, 30.5%) for females.
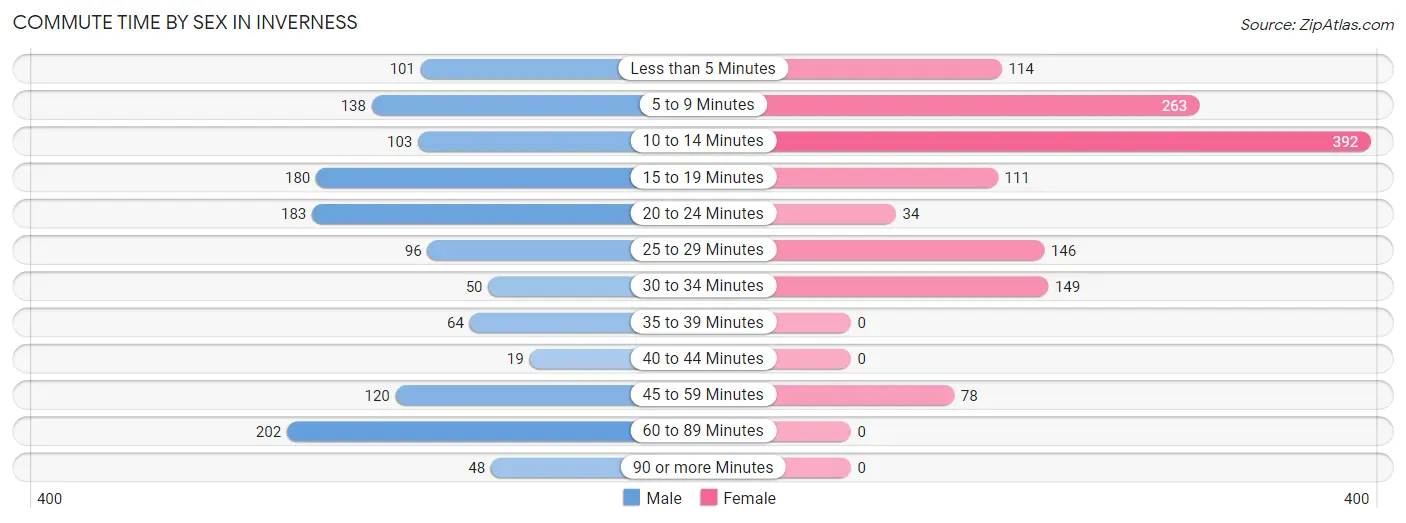
| Commute Time | Male | Female |
| Less than 5 Minutes | 101 (7.7%) | 114 (8.9%) |
| 5 to 9 Minutes | 138 (10.6%) | 263 (20.4%) |
| 10 to 14 Minutes | 103 (7.9%) | 392 (30.5%) |
| 15 to 19 Minutes | 180 (13.8%) | 111 (8.6%) |
| 20 to 24 Minutes | 183 (14.0%) | 34 (2.6%) |
| 25 to 29 Minutes | 96 (7.4%) | 146 (11.3%) |
| 30 to 34 Minutes | 50 (3.8%) | 149 (11.6%) |
| 35 to 39 Minutes | 64 (4.9%) | 0 (0.0%) |
| 40 to 44 Minutes | 19 (1.5%) | 0 (0.0%) |
| 45 to 59 Minutes | 120 (9.2%) | 78 (6.1%) |
| 60 to 89 Minutes | 202 (15.5%) | 0 (0.0%) |
| 90 or more Minutes | 48 (3.7%) | 0 (0.0%) |
Time of Departure to Work by Sex in Inverness
The most frequent times of departure to work in Inverness are 5:00 AM to 5:29 AM (192, 14.7%) for males and 8:00 AM to 8:29 AM (213, 16.6%) for females.
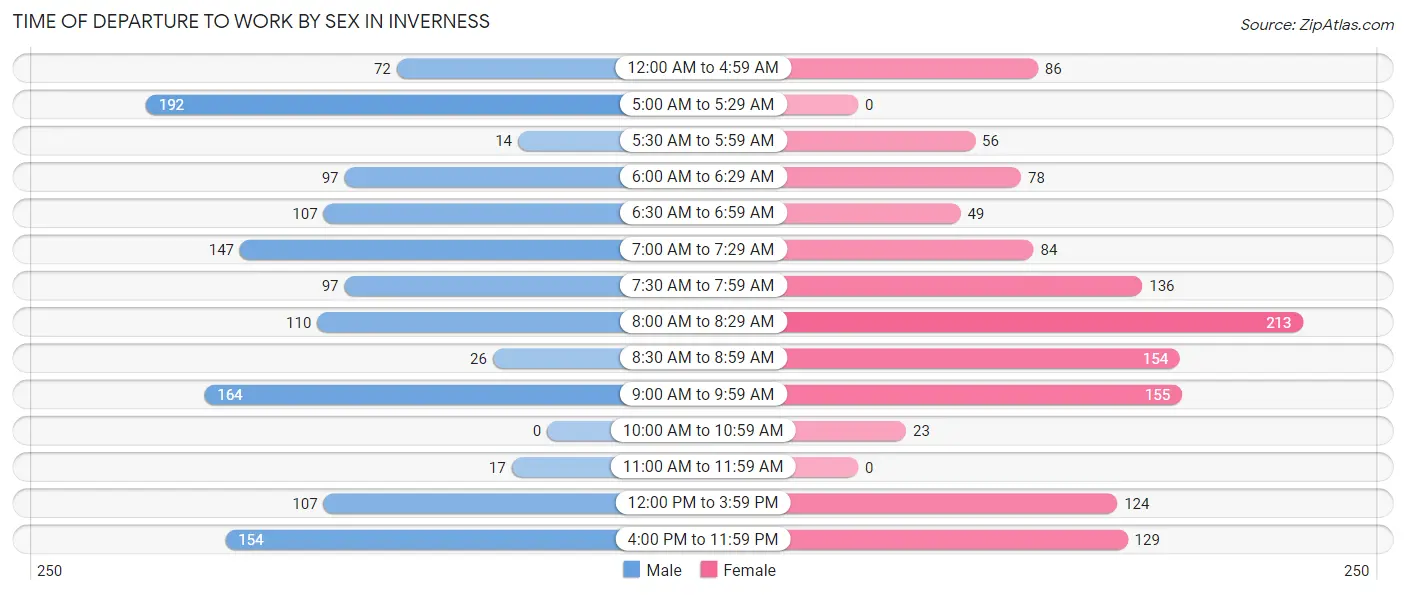
| Time of Departure | Male | Female |
| 12:00 AM to 4:59 AM | 72 (5.5%) | 86 (6.7%) |
| 5:00 AM to 5:29 AM | 192 (14.7%) | 0 (0.0%) |
| 5:30 AM to 5:59 AM | 14 (1.1%) | 56 (4.3%) |
| 6:00 AM to 6:29 AM | 97 (7.4%) | 78 (6.1%) |
| 6:30 AM to 6:59 AM | 107 (8.2%) | 49 (3.8%) |
| 7:00 AM to 7:29 AM | 147 (11.3%) | 84 (6.5%) |
| 7:30 AM to 7:59 AM | 97 (7.4%) | 136 (10.6%) |
| 8:00 AM to 8:29 AM | 110 (8.4%) | 213 (16.6%) |
| 8:30 AM to 8:59 AM | 26 (2.0%) | 154 (12.0%) |
| 9:00 AM to 9:59 AM | 164 (12.6%) | 155 (12.0%) |
| 10:00 AM to 10:59 AM | 0 (0.0%) | 23 (1.8%) |
| 11:00 AM to 11:59 AM | 17 (1.3%) | 0 (0.0%) |
| 12:00 PM to 3:59 PM | 107 (8.2%) | 124 (9.6%) |
| 4:00 PM to 11:59 PM | 154 (11.8%) | 129 (10.0%) |
| Total | 1,304 (100.0%) | 1,287 (100.0%) |
Housing Occupancy in Inverness
Occupancy by Ownership in Inverness
Of the total 3,744 dwellings in Inverness, owner-occupied units account for 2,588 (69.1%), while renter-occupied units make up 1,156 (30.9%).
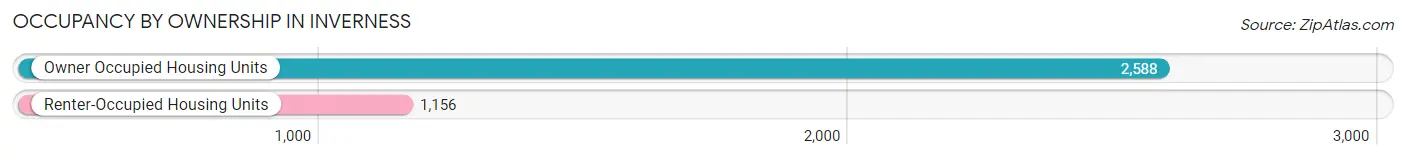
| Occupancy | # Housing Units | % Housing Units |
| Owner Occupied Housing Units | 2,588 | 69.1% |
| Renter-Occupied Housing Units | 1,156 | 30.9% |
| Total Occupied Housing Units | 3,744 | 100.0% |
Occupancy by Household Size in Inverness
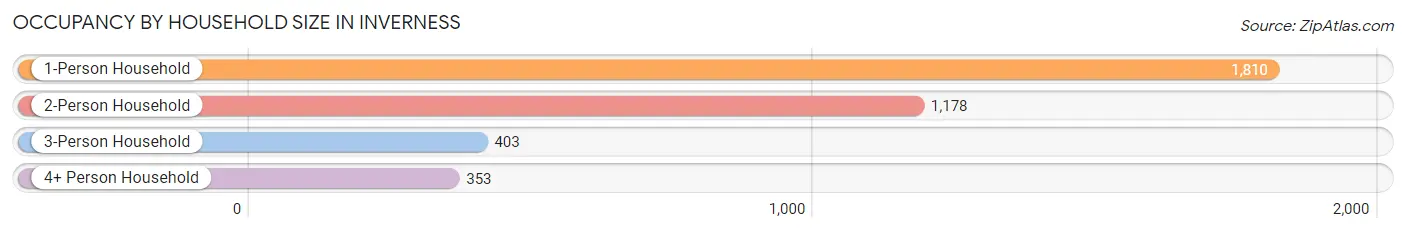
| Household Size | # Housing Units | % Housing Units |
| 1-Person Household | 1,810 | 48.3% |
| 2-Person Household | 1,178 | 31.5% |
| 3-Person Household | 403 | 10.8% |
| 4+ Person Household | 353 | 9.4% |
| Total Housing Units | 3,744 | 100.0% |
Occupancy by Ownership by Household Size in Inverness
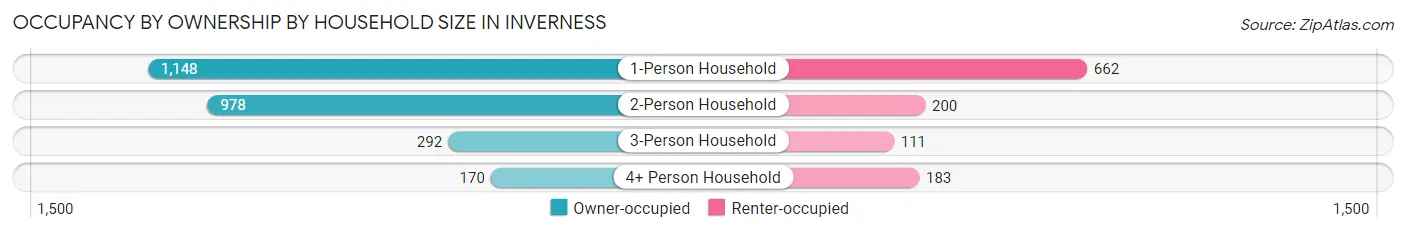
| Household Size | Owner-occupied | Renter-occupied |
| 1-Person Household | 1,148 (63.4%) | 662 (36.6%) |
| 2-Person Household | 978 (83.0%) | 200 (17.0%) |
| 3-Person Household | 292 (72.5%) | 111 (27.5%) |
| 4+ Person Household | 170 (48.2%) | 183 (51.8%) |
| Total Housing Units | 2,588 (69.1%) | 1,156 (30.9%) |
Occupancy by Educational Attainment in Inverness
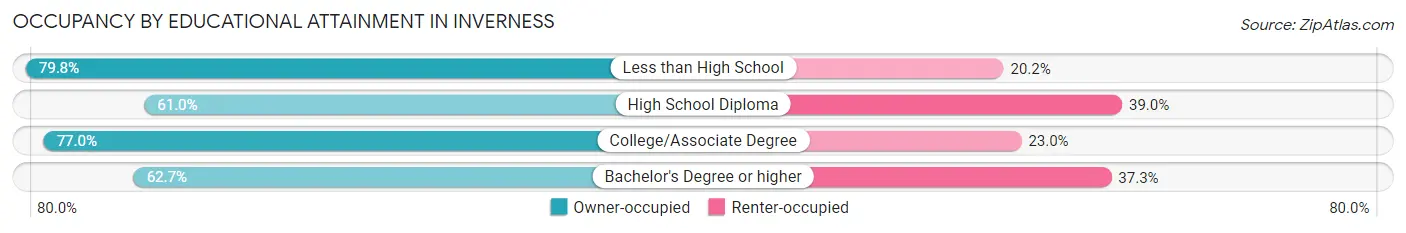
| Household Size | Owner-occupied | Renter-occupied |
| Less than High School | 154 (79.8%) | 39 (20.2%) |
| High School Diploma | 721 (61.0%) | 461 (39.0%) |
| College/Associate Degree | 1,229 (77.0%) | 368 (23.0%) |
| Bachelor's Degree or higher | 484 (62.7%) | 288 (37.3%) |
Occupancy by Age of Householder in Inverness
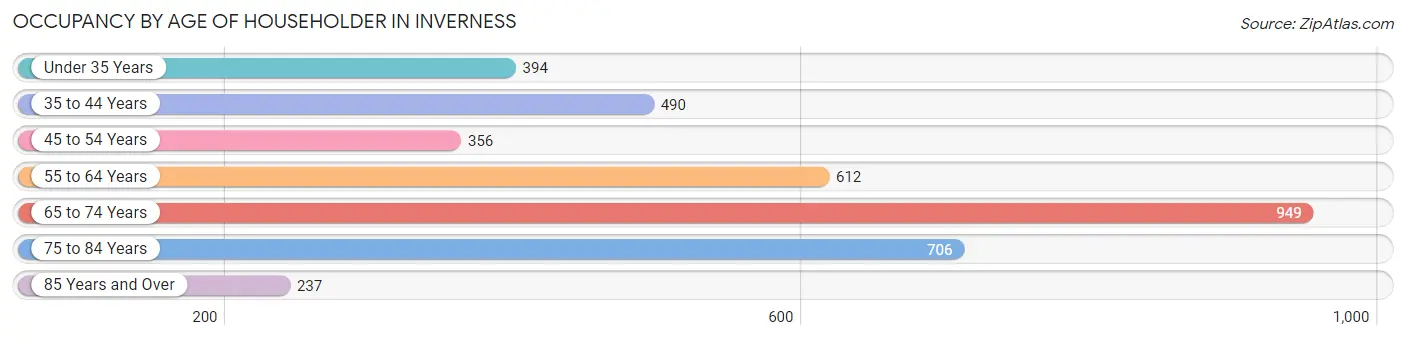
| Age Bracket | # Households | % Households |
| Under 35 Years | 394 | 10.5% |
| 35 to 44 Years | 490 | 13.1% |
| 45 to 54 Years | 356 | 9.5% |
| 55 to 64 Years | 612 | 16.4% |
| 65 to 74 Years | 949 | 25.4% |
| 75 to 84 Years | 706 | 18.9% |
| 85 Years and Over | 237 | 6.3% |
| Total | 3,744 | 100.0% |
Housing Finances in Inverness
Median Income by Occupancy in Inverness
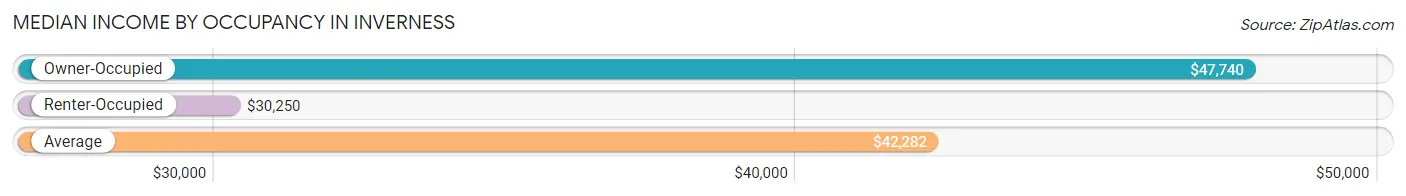
| Occupancy Type | # Households | Median Income |
| Owner-Occupied | 2,588 (69.1%) | $47,740 |
| Renter-Occupied | 1,156 (30.9%) | $30,250 |
| Average | 3,744 (100.0%) | $42,282 |
Occupancy by Householder Income Bracket in Inverness
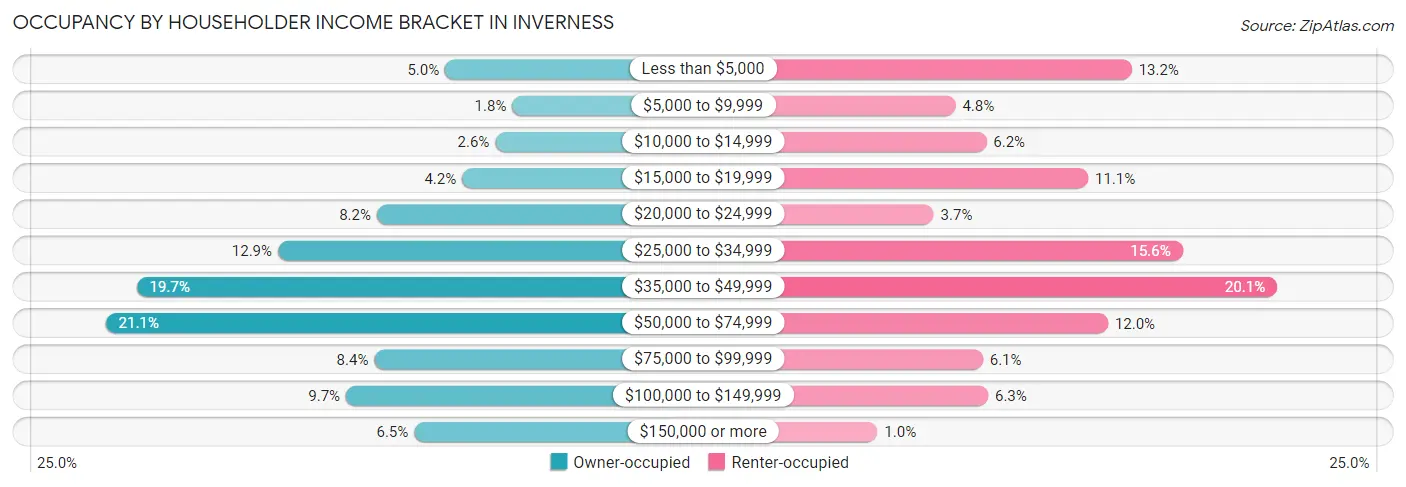
| Income Bracket | Owner-occupied | Renter-occupied |
| Less than $5,000 | 129 (5.0%) | 152 (13.2%) |
| $5,000 to $9,999 | 46 (1.8%) | 55 (4.8%) |
| $10,000 to $14,999 | 67 (2.6%) | 72 (6.2%) |
| $15,000 to $19,999 | 108 (4.2%) | 128 (11.1%) |
| $20,000 to $24,999 | 213 (8.2%) | 43 (3.7%) |
| $25,000 to $34,999 | 335 (12.9%) | 180 (15.6%) |
| $35,000 to $49,999 | 509 (19.7%) | 232 (20.1%) |
| $50,000 to $74,999 | 547 (21.1%) | 139 (12.0%) |
| $75,000 to $99,999 | 216 (8.4%) | 70 (6.1%) |
| $100,000 to $149,999 | 251 (9.7%) | 73 (6.3%) |
| $150,000 or more | 167 (6.5%) | 12 (1.0%) |
| Total | 2,588 (100.0%) | 1,156 (100.0%) |
Monthly Housing Cost Tiers in Inverness
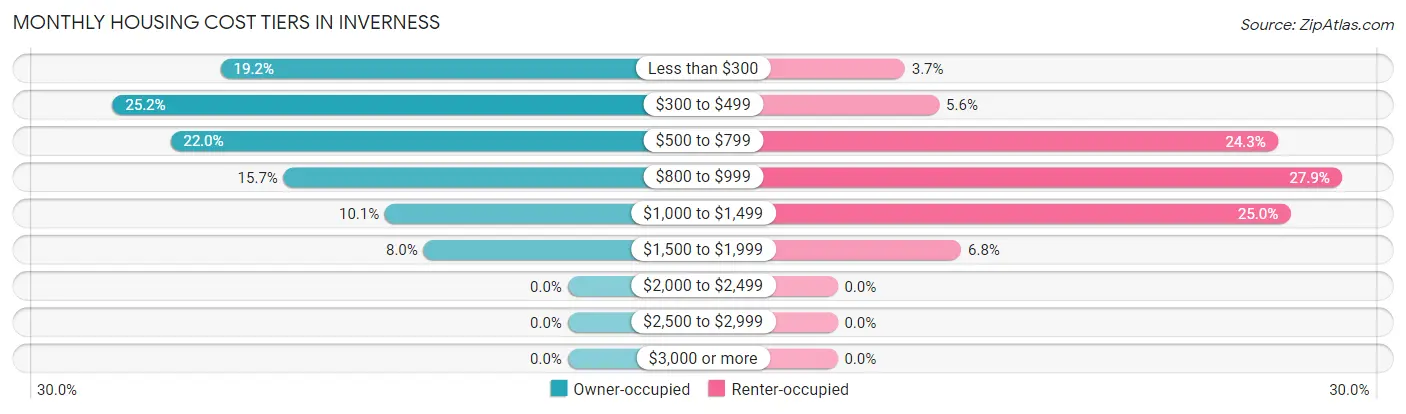
| Monthly Cost | Owner-occupied | Renter-occupied |
| Less than $300 | 496 (19.2%) | 43 (3.7%) |
| $300 to $499 | 651 (25.2%) | 65 (5.6%) |
| $500 to $799 | 568 (22.0%) | 281 (24.3%) |
| $800 to $999 | 406 (15.7%) | 322 (27.9%) |
| $1,000 to $1,499 | 261 (10.1%) | 289 (25.0%) |
| $1,500 to $1,999 | 206 (8.0%) | 79 (6.8%) |
| $2,000 to $2,499 | 0 (0.0%) | 0 (0.0%) |
| $2,500 to $2,999 | 0 (0.0%) | 0 (0.0%) |
| $3,000 or more | 0 (0.0%) | 0 (0.0%) |
| Total | 2,588 (100.0%) | 1,156 (100.0%) |
Physical Housing Characteristics in Inverness
Housing Structures in Inverness
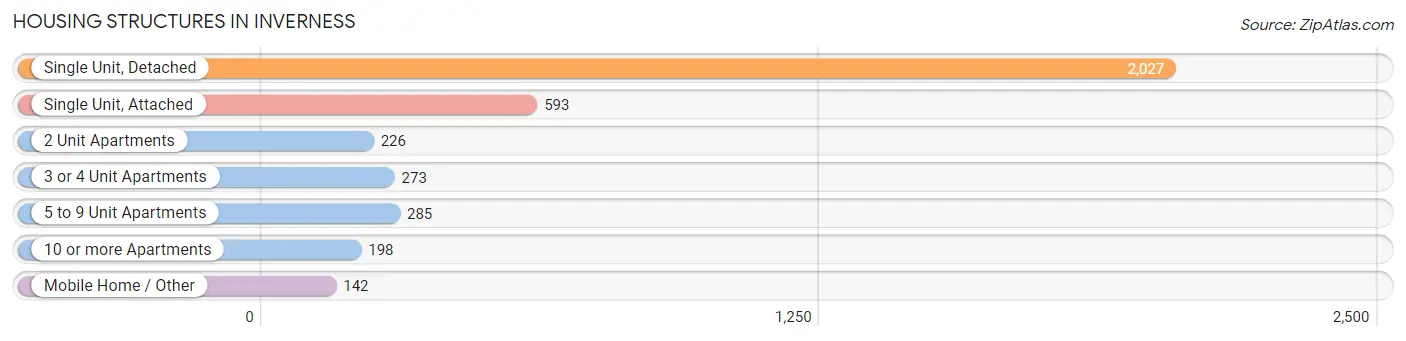
| Structure Type | # Housing Units | % Housing Units |
| Single Unit, Detached | 2,027 | 54.1% |
| Single Unit, Attached | 593 | 15.8% |
| 2 Unit Apartments | 226 | 6.0% |
| 3 or 4 Unit Apartments | 273 | 7.3% |
| 5 to 9 Unit Apartments | 285 | 7.6% |
| 10 or more Apartments | 198 | 5.3% |
| Mobile Home / Other | 142 | 3.8% |
| Total | 3,744 | 100.0% |
Housing Structures by Occupancy in Inverness
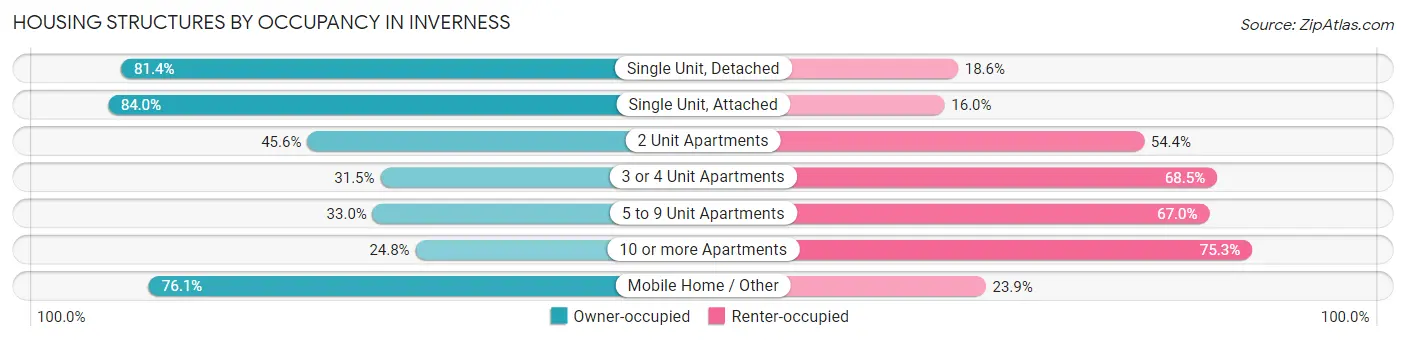
| Structure Type | Owner-occupied | Renter-occupied |
| Single Unit, Detached | 1,650 (81.4%) | 377 (18.6%) |
| Single Unit, Attached | 498 (84.0%) | 95 (16.0%) |
| 2 Unit Apartments | 103 (45.6%) | 123 (54.4%) |
| 3 or 4 Unit Apartments | 86 (31.5%) | 187 (68.5%) |
| 5 to 9 Unit Apartments | 94 (33.0%) | 191 (67.0%) |
| 10 or more Apartments | 49 (24.7%) | 149 (75.2%) |
| Mobile Home / Other | 108 (76.1%) | 34 (23.9%) |
| Total | 2,588 (69.1%) | 1,156 (30.9%) |
Housing Structures by Number of Rooms in Inverness
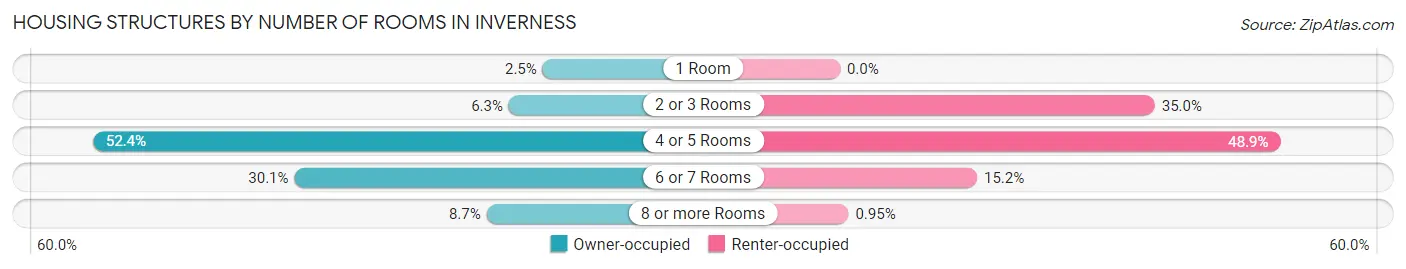
| Number of Rooms | Owner-occupied | Renter-occupied |
| 1 Room | 65 (2.5%) | 0 (0.0%) |
| 2 or 3 Rooms | 162 (6.3%) | 404 (34.9%) |
| 4 or 5 Rooms | 1,357 (52.4%) | 565 (48.9%) |
| 6 or 7 Rooms | 778 (30.1%) | 176 (15.2%) |
| 8 or more Rooms | 226 (8.7%) | 11 (0.9%) |
| Total | 2,588 (100.0%) | 1,156 (100.0%) |
Housing Structure by Heating Type in Inverness
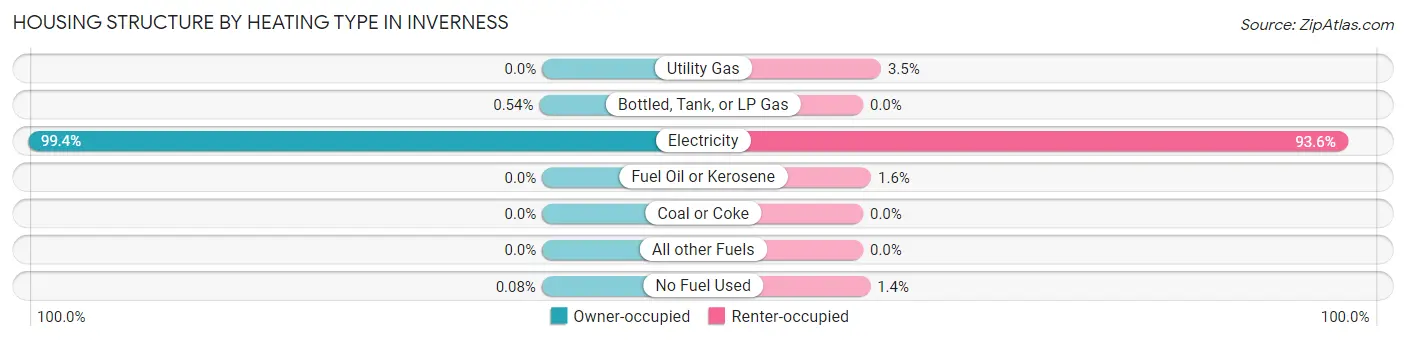
| Heating Type | Owner-occupied | Renter-occupied |
| Utility Gas | 0 (0.0%) | 40 (3.5%) |
| Bottled, Tank, or LP Gas | 14 (0.5%) | 0 (0.0%) |
| Electricity | 2,572 (99.4%) | 1,082 (93.6%) |
| Fuel Oil or Kerosene | 0 (0.0%) | 18 (1.6%) |
| Coal or Coke | 0 (0.0%) | 0 (0.0%) |
| All other Fuels | 0 (0.0%) | 0 (0.0%) |
| No Fuel Used | 2 (0.1%) | 16 (1.4%) |
| Total | 2,588 (100.0%) | 1,156 (100.0%) |
Household Vehicle Usage in Inverness
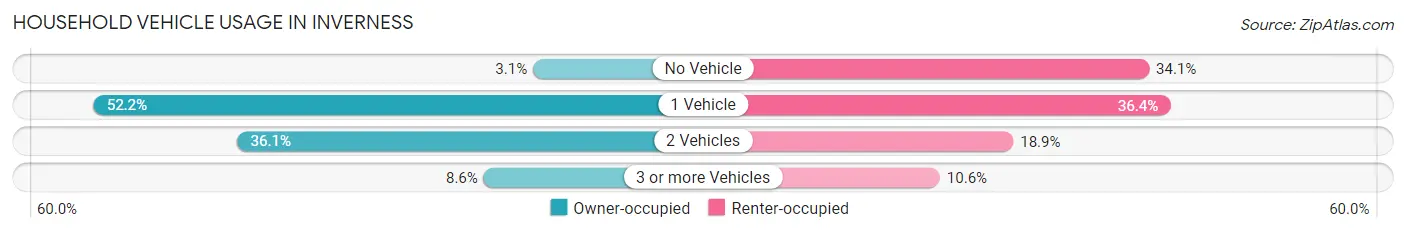
| Vehicles per Household | Owner-occupied | Renter-occupied |
| No Vehicle | 79 (3.0%) | 394 (34.1%) |
| 1 Vehicle | 1,352 (52.2%) | 421 (36.4%) |
| 2 Vehicles | 935 (36.1%) | 218 (18.9%) |
| 3 or more Vehicles | 222 (8.6%) | 123 (10.6%) |
| Total | 2,588 (100.0%) | 1,156 (100.0%) |
Real Estate & Mortgages in Inverness
Real Estate and Mortgage Overview in Inverness
| Characteristic | Without Mortgage | With Mortgage |
| Housing Units | 1,516 | 1,072 |
| Median Property Value | $144,400 | $152,200 |
| Median Household Income | $46,875 | $91 |
| Monthly Housing Costs | $366 | $0 |
| Real Estate Taxes | $1,075 | $42 |
Property Value by Mortgage Status in Inverness
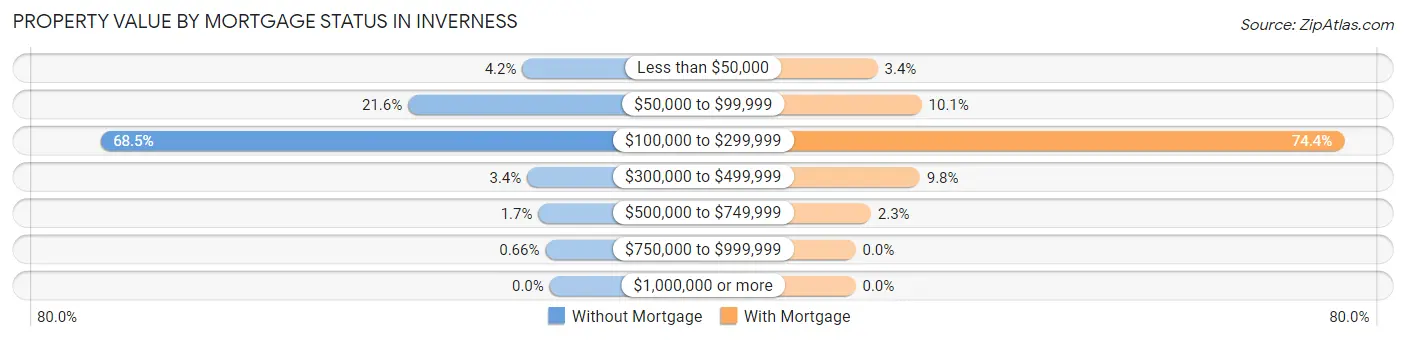
| Property Value | Without Mortgage | With Mortgage |
| Less than $50,000 | 63 (4.2%) | 36 (3.4%) |
| $50,000 to $99,999 | 327 (21.6%) | 108 (10.1%) |
| $100,000 to $299,999 | 1,038 (68.5%) | 798 (74.4%) |
| $300,000 to $499,999 | 52 (3.4%) | 105 (9.8%) |
| $500,000 to $749,999 | 26 (1.7%) | 25 (2.3%) |
| $750,000 to $999,999 | 10 (0.7%) | 0 (0.0%) |
| $1,000,000 or more | 0 (0.0%) | 0 (0.0%) |
| Total | 1,516 (100.0%) | 1,072 (100.0%) |
Household Income by Mortgage Status in Inverness
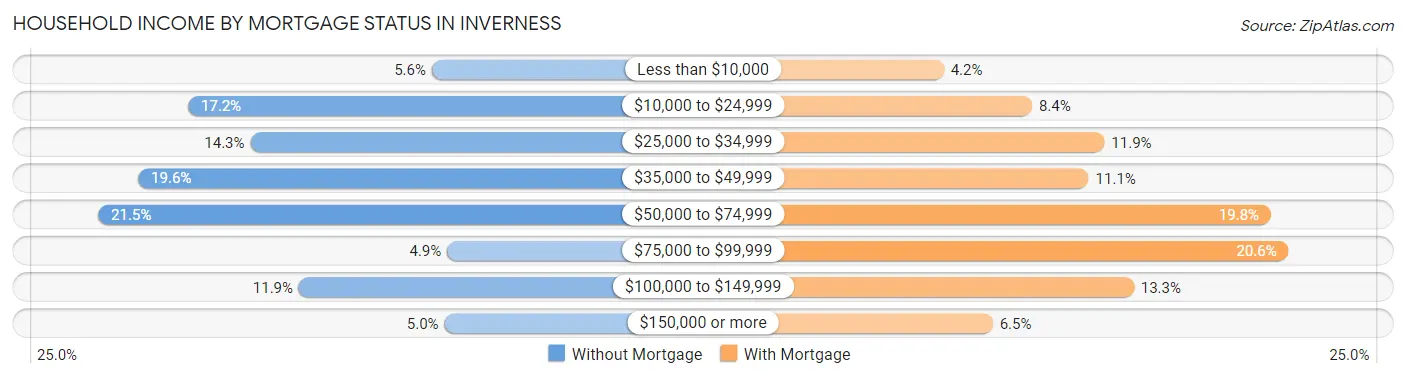
| Household Income | Without Mortgage | With Mortgage |
| Less than $10,000 | 85 (5.6%) | 45 (4.2%) |
| $10,000 to $24,999 | 261 (17.2%) | 90 (8.4%) |
| $25,000 to $34,999 | 216 (14.2%) | 127 (11.8%) |
| $35,000 to $49,999 | 297 (19.6%) | 119 (11.1%) |
| $50,000 to $74,999 | 326 (21.5%) | 212 (19.8%) |
| $75,000 to $99,999 | 74 (4.9%) | 221 (20.6%) |
| $100,000 to $149,999 | 181 (11.9%) | 142 (13.3%) |
| $150,000 or more | 76 (5.0%) | 70 (6.5%) |
| Total | 1,516 (100.0%) | 1,072 (100.0%) |
Property Value to Household Income Ratio in Inverness
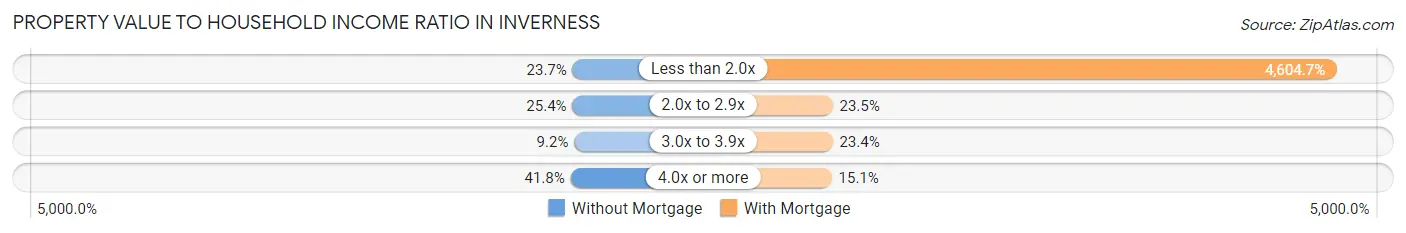
| Value-to-Income Ratio | Without Mortgage | With Mortgage |
| Less than 2.0x | 359 (23.7%) | 49,362 (4,604.7%) |
| 2.0x to 2.9x | 385 (25.4%) | 252 (23.5%) |
| 3.0x to 3.9x | 139 (9.2%) | 251 (23.4%) |
| 4.0x or more | 633 (41.7%) | 162 (15.1%) |
| Total | 1,516 (100.0%) | 1,072 (100.0%) |
Real Estate Taxes by Mortgage Status in Inverness
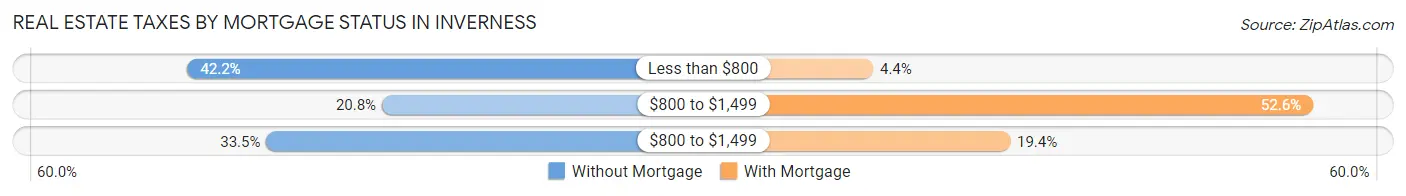
| Property Taxes | Without Mortgage | With Mortgage |
| Less than $800 | 639 (42.1%) | 47 (4.4%) |
| $800 to $1,499 | 316 (20.8%) | 564 (52.6%) |
| $800 to $1,499 | 508 (33.5%) | 208 (19.4%) |
| Total | 1,516 (100.0%) | 1,072 (100.0%) |
Health & Disability in Inverness
Health Insurance Coverage by Age in Inverness
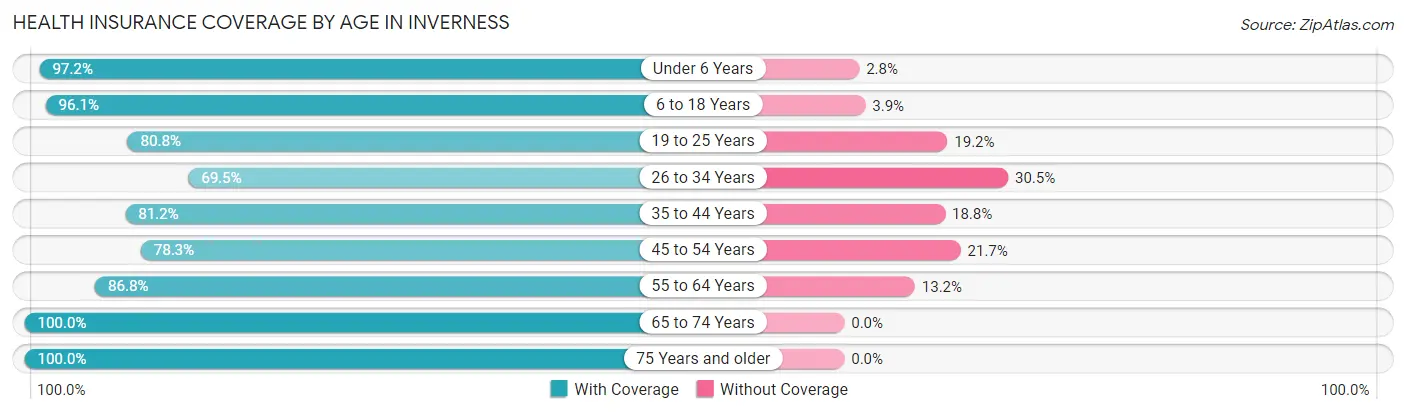
| Age Bracket | With Coverage | Without Coverage |
| Under 6 Years | 384 (97.2%) | 11 (2.8%) |
| 6 to 18 Years | 611 (96.1%) | 25 (3.9%) |
| 19 to 25 Years | 416 (80.8%) | 99 (19.2%) |
| 26 to 34 Years | 471 (69.5%) | 207 (30.5%) |
| 35 to 44 Years | 687 (81.2%) | 159 (18.8%) |
| 45 to 54 Years | 426 (78.3%) | 118 (21.7%) |
| 55 to 64 Years | 792 (86.8%) | 120 (13.2%) |
| 65 to 74 Years | 1,385 (100.0%) | 0 (0.0%) |
| 75 Years and older | 1,211 (100.0%) | 0 (0.0%) |
| Total | 6,383 (89.6%) | 739 (10.4%) |
Health Insurance Coverage by Citizenship Status in Inverness
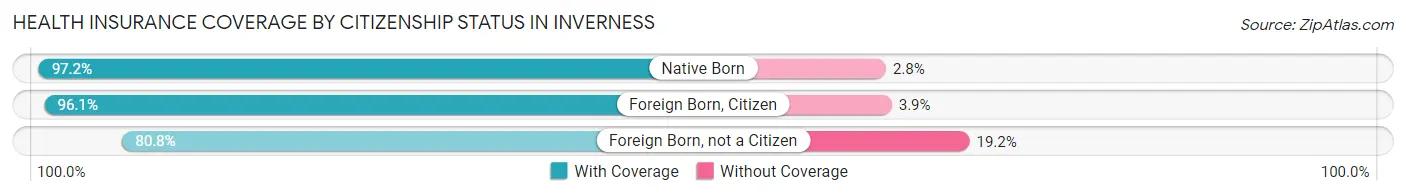
| Citizenship Status | With Coverage | Without Coverage |
| Native Born | 384 (97.2%) | 11 (2.8%) |
| Foreign Born, Citizen | 611 (96.1%) | 25 (3.9%) |
| Foreign Born, not a Citizen | 416 (80.8%) | 99 (19.2%) |
Health Insurance Coverage by Household Income in Inverness
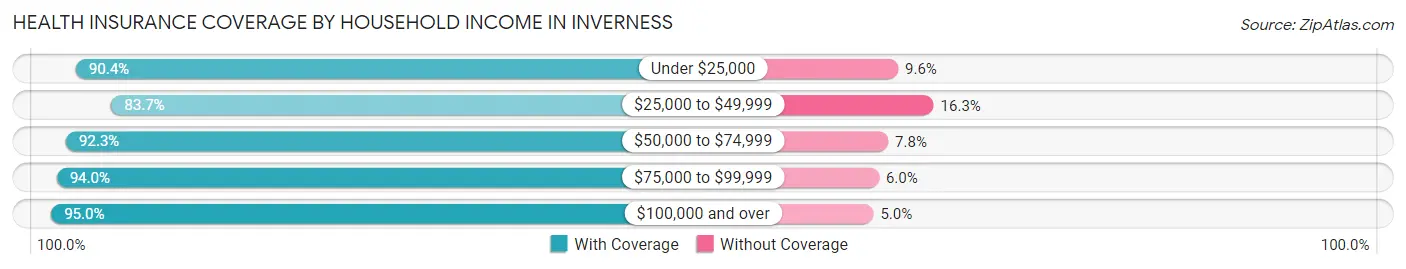
| Household Income | With Coverage | Without Coverage |
| Under $25,000 | 1,268 (90.4%) | 135 (9.6%) |
| $25,000 to $49,999 | 1,899 (83.7%) | 369 (16.3%) |
| $50,000 to $74,999 | 1,333 (92.2%) | 112 (7.7%) |
| $75,000 to $99,999 | 624 (94.0%) | 40 (6.0%) |
| $100,000 and over | 1,197 (95.0%) | 63 (5.0%) |
Public vs Private Health Insurance Coverage by Age in Inverness
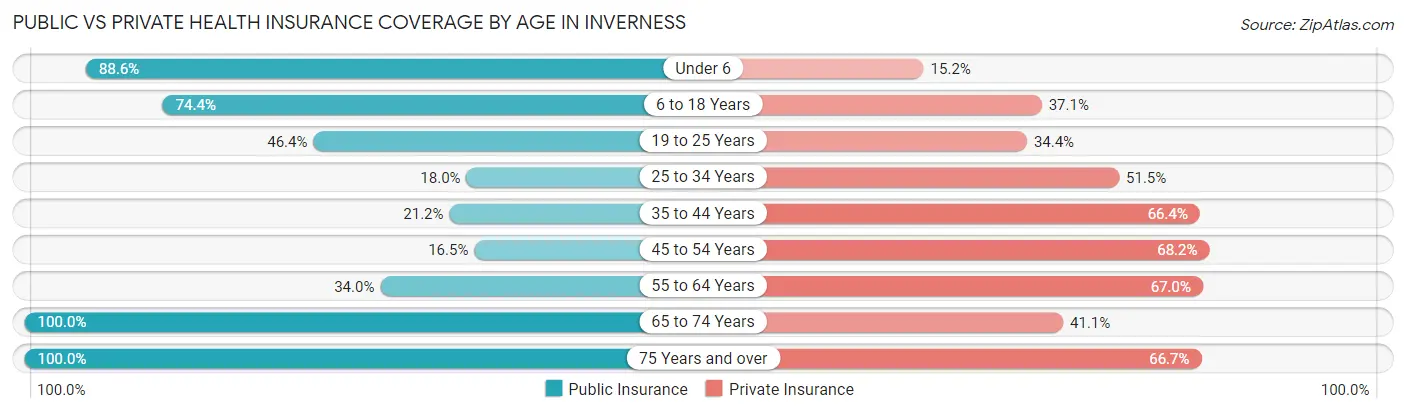
| Age Bracket | Public Insurance | Private Insurance |
| Under 6 | 350 (88.6%) | 60 (15.2%) |
| 6 to 18 Years | 473 (74.4%) | 236 (37.1%) |
| 19 to 25 Years | 239 (46.4%) | 177 (34.4%) |
| 25 to 34 Years | 122 (18.0%) | 349 (51.5%) |
| 35 to 44 Years | 179 (21.2%) | 562 (66.4%) |
| 45 to 54 Years | 90 (16.5%) | 371 (68.2%) |
| 55 to 64 Years | 310 (34.0%) | 611 (67.0%) |
| 65 to 74 Years | 1,385 (100.0%) | 569 (41.1%) |
| 75 Years and over | 1,211 (100.0%) | 808 (66.7%) |
| Total | 4,359 (61.2%) | 3,743 (52.6%) |
Disability Status by Sex by Age in Inverness
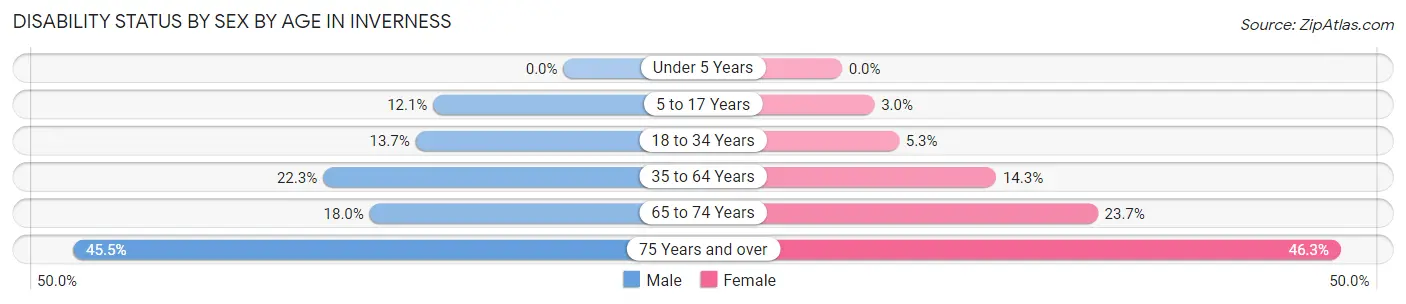
| Age Bracket | Male | Female |
| Under 5 Years | 0 (0.0%) | 0 (0.0%) |
| 5 to 17 Years | 32 (12.1%) | 11 (3.0%) |
| 18 to 34 Years | 90 (13.7%) | 34 (5.3%) |
| 35 to 64 Years | 236 (22.3%) | 178 (14.3%) |
| 65 to 74 Years | 96 (18.0%) | 202 (23.7%) |
| 75 Years and over | 212 (45.5%) | 345 (46.3%) |
Disability Class by Sex by Age in Inverness
Disability Class: Hearing Difficulty
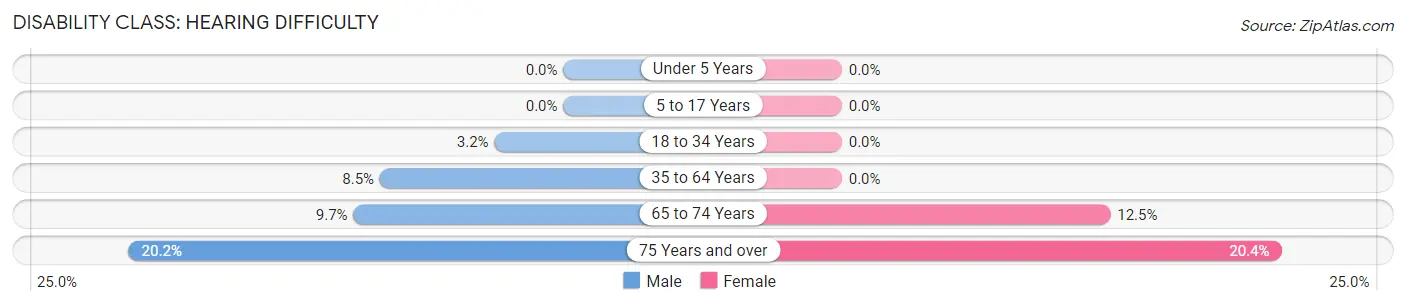
| Age Bracket | Male | Female |
| Under 5 Years | 0 (0.0%) | 0 (0.0%) |
| 5 to 17 Years | 0 (0.0%) | 0 (0.0%) |
| 18 to 34 Years | 21 (3.2%) | 0 (0.0%) |
| 35 to 64 Years | 90 (8.5%) | 0 (0.0%) |
| 65 to 74 Years | 52 (9.7%) | 106 (12.5%) |
| 75 Years and over | 94 (20.2%) | 152 (20.4%) |
Disability Class: Vision Difficulty
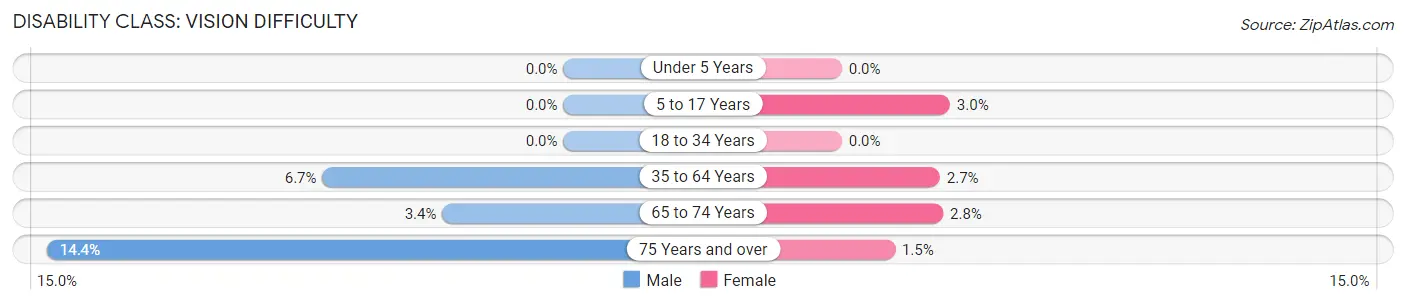
| Age Bracket | Male | Female |
| Under 5 Years | 0 (0.0%) | 0 (0.0%) |
| 5 to 17 Years | 0 (0.0%) | 11 (3.0%) |
| 18 to 34 Years | 0 (0.0%) | 0 (0.0%) |
| 35 to 64 Years | 71 (6.7%) | 34 (2.7%) |
| 65 to 74 Years | 18 (3.4%) | 24 (2.8%) |
| 75 Years and over | 67 (14.4%) | 11 (1.5%) |
Disability Class: Cognitive Difficulty
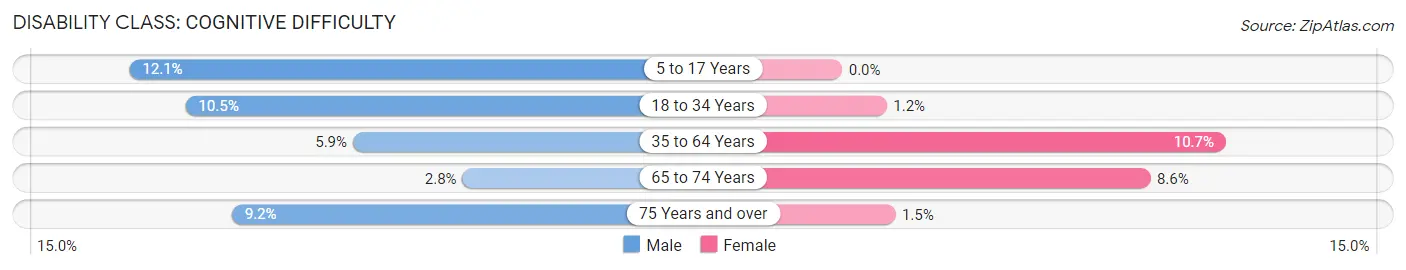
| Age Bracket | Male | Female |
| 5 to 17 Years | 32 (12.1%) | 0 (0.0%) |
| 18 to 34 Years | 69 (10.5%) | 8 (1.2%) |
| 35 to 64 Years | 62 (5.9%) | 133 (10.7%) |
| 65 to 74 Years | 15 (2.8%) | 73 (8.6%) |
| 75 Years and over | 43 (9.2%) | 11 (1.5%) |
Disability Class: Ambulatory Difficulty
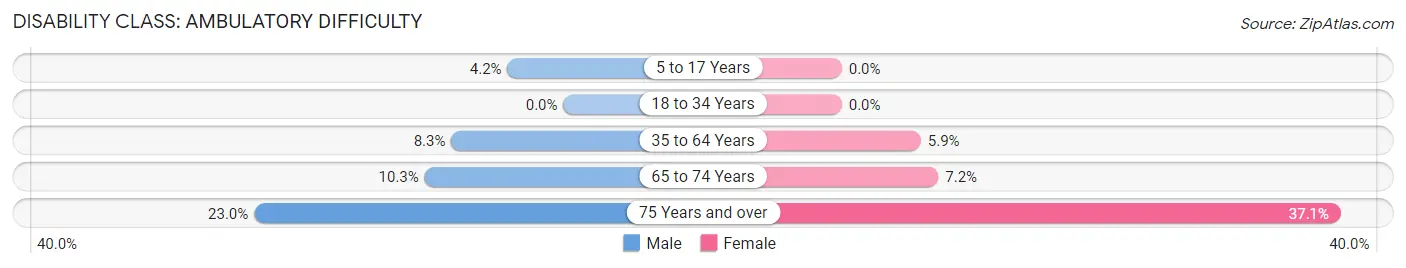
| Age Bracket | Male | Female |
| 5 to 17 Years | 11 (4.2%) | 0 (0.0%) |
| 18 to 34 Years | 0 (0.0%) | 0 (0.0%) |
| 35 to 64 Years | 88 (8.3%) | 73 (5.9%) |
| 65 to 74 Years | 55 (10.3%) | 61 (7.2%) |
| 75 Years and over | 107 (23.0%) | 276 (37.0%) |
Disability Class: Self-Care Difficulty
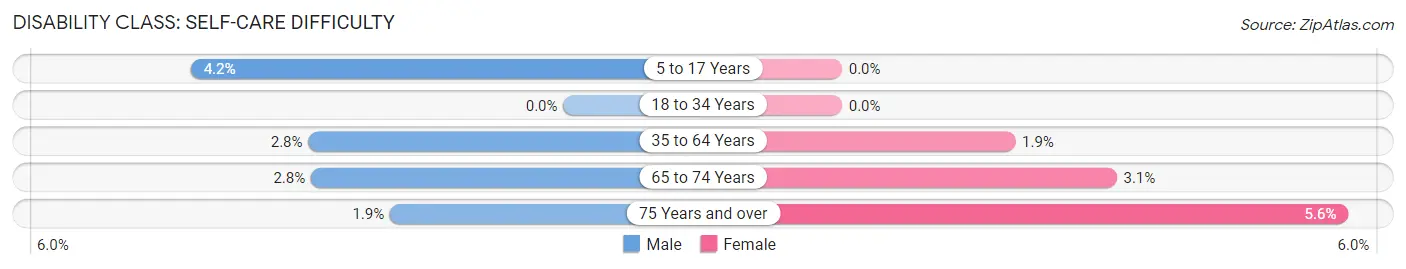
| Age Bracket | Male | Female |
| 5 to 17 Years | 11 (4.2%) | 0 (0.0%) |
| 18 to 34 Years | 0 (0.0%) | 0 (0.0%) |
| 35 to 64 Years | 30 (2.8%) | 24 (1.9%) |
| 65 to 74 Years | 15 (2.8%) | 26 (3.1%) |
| 75 Years and over | 9 (1.9%) | 42 (5.6%) |
Technology Access in Inverness
Computing Device Access in Inverness
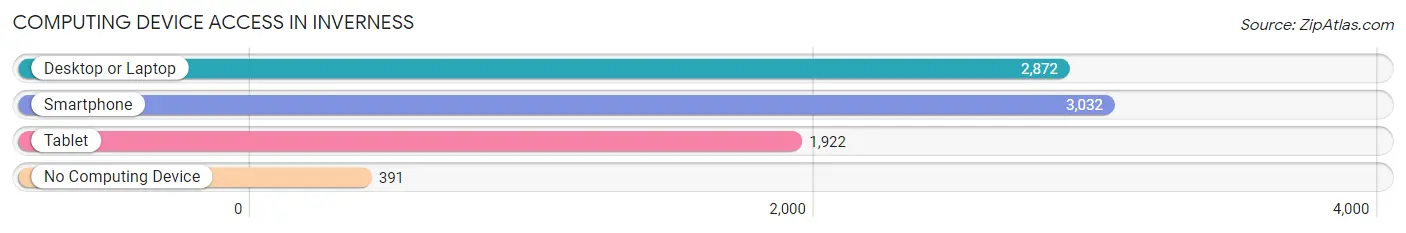
| Device Type | # Households | % Households |
| Desktop or Laptop | 2,872 | 76.7% |
| Smartphone | 3,032 | 81.0% |
| Tablet | 1,922 | 51.3% |
| No Computing Device | 391 | 10.4% |
| Total | 3,744 | 100.0% |
Internet Access in Inverness
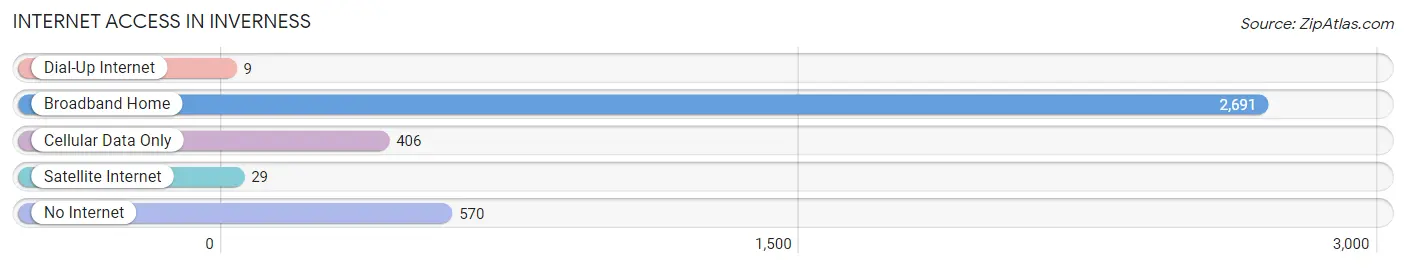
| Internet Type | # Households | % Households |
| Dial-Up Internet | 9 | 0.2% |
| Broadband Home | 2,691 | 71.9% |
| Cellular Data Only | 406 | 10.8% |
| Satellite Internet | 29 | 0.8% |
| No Internet | 570 | 15.2% |
| Total | 3,744 | 100.0% |
Inverness Summary
Inverness is a city located in Citrus County, Florida, United States. It is the county seat of Citrus County and is located in the heart of the Nature Coast region of Florida. The city is situated on the banks of the Tsala Apopka Lake chain, which is part of the Withlacoochee River system. Inverness is known for its natural beauty, outdoor recreation, and historic downtown.
History
Inverness was first settled in 1845 by David and Sarah Ann Maloney, who moved to the area from South Carolina. The Maloney’s built a log cabin and began farming the land. In 1887, the Florida Legislature created Citrus County and Inverness was chosen as the county seat. The city was officially incorporated in 1888 and was named after Inverness, Scotland.
In the early 1900s, Inverness was a small farming community with a population of just over 500 people. The city began to grow in the 1920s when the Florida Land Boom brought new residents and businesses to the area. The city continued to grow throughout the 20th century and by 2000, the population had grown to over 7,000 people.
Geography
Inverness is located in the center of Citrus County, Florida. The city is situated on the banks of the Tsala Apopka Lake chain, which is part of the Withlacoochee River system. The city is surrounded by rolling hills and is home to several natural springs. The city is located approximately 70 miles north of Tampa and 50 miles west of Ocala.
The climate in Inverness is subtropical and humid. The average temperature in the summer is around 90 degrees Fahrenheit and the average temperature in the winter is around 60 degrees Fahrenheit. The city receives an average of 54 inches of rain per year.
Economy
Inverness is a small city with a population of just over 7,000 people. The city’s economy is largely based on tourism and agriculture. The city is home to several tourist attractions, including the Citrus County Historical Museum, the Withlacoochee State Trail, and the Citrus County Speedway. The city is also home to several agricultural businesses, including citrus groves, cattle ranches, and vegetable farms.
Inverness is also home to several manufacturing and industrial businesses. The city is home to several manufacturing plants, including a paper mill, a plastics plant, and a metal fabrication plant. The city is also home to several industrial businesses, including a power plant and a wastewater treatment plant.
Demographics
In 2000, the population of Inverness was 7,092 people. The population was spread out with 24.2% under the age of 18, 8.2% from 18 to 24, 28.2% from 25 to 44, 24.2% from 45 to 64, and 15.2% who were 65 years of age or older. The median age was 38 years.
The racial makeup of the city was 92.2% White, 4.2% African American, 0.3% Native American, 0.7% Asian, 0.1% Pacific Islander, 1.2% from other races, and 1.3% from two or more races. Hispanic or Latino of any race were 4.2% of the population.
The median income for a household in the city was $30,938, and the median income for a family was $37,813. Males had a median income of $30,938 versus $21,944 for females. The per capita income for the city was $17,845. About 11.2% of families and 14.2% of the population were below the poverty line, including 19.2% of those under age 18 and 8.2% of those age 65 or over.
Common Questions
What is Per Capita Income in Inverness?
Per Capita income in Inverness is $27,752.
What is the Median Family Income in Inverness?
Median Family Income in Inverness is $55,971.
What is the Median Household income in Inverness?
Median Household Income in Inverness is $42,282.
What is Income or Wage Gap in Inverness?
Income or Wage Gap in Inverness is 24.8%.
Women in Inverness earn 75.2 cents for every dollar earned by a man.
What is Inequality or Gini Index in Inverness?
Inequality or Gini Index in Inverness is 0.42.
What is the Total Population of Inverness?
Total Population of Inverness is 7,602.
What is the Total Male Population of Inverness?
Total Male Population of Inverness is 3,320.
What is the Total Female Population of Inverness?
Total Female Population of Inverness is 4,282.
What is the Ratio of Males per 100 Females in Inverness?
There are 77.53 Males per 100 Females in Inverness.
What is the Ratio of Females per 100 Males in Inverness?
There are 128.98 Females per 100 Males in Inverness.
What is the Median Population Age in Inverness?
Median Population Age in Inverness is 56.7 Years.
What is the Average Family Size in Inverness
Average Family Size in Inverness is 2.7 People.
What is the Average Household Size in Inverness
Average Household Size in Inverness is 1.9 People.
How Large is the Labor Force in Inverness?
There are 3,141 People in the Labor Forcein in Inverness.
What is the Percentage of People in the Labor Force in Inverness?
46.6% of People are in the Labor Force in Inverness.
What is the Unemployment Rate in Inverness?
Unemployment Rate in Inverness is 7.2%.