Homosassa, FL Map & Demographics
Homosassa Map
Homosassa Overview
$45,481
PER CAPITA INCOME
$82,105
AVG FAMILY INCOME
$55,112
AVG HOUSEHOLD INCOME
0.47
INEQUALITY / GINI INDEX
2,016
TOTAL POPULATION
932
MALE POPULATION
1,084
FEMALE POPULATION
85.98
MALES / 100 FEMALES
116.31
FEMALES / 100 MALES
64.5
MEDIAN AGE
2.4
AVG FAMILY SIZE
1.7
AVG HOUSEHOLD SIZE
829
LABOR FORCE [ PEOPLE ]
41.1%
PERCENT IN LABOR FORCE
2.5%
UNEMPLOYMENT RATE
Homosassa Area Codes
Income in Homosassa
Income Overview in Homosassa
Per Capita Income in Homosassa is $45,481, while median incomes of families and households are $82,105 and $55,112 respectively.
| Characteristic | Number | Measure |
| Per Capita Income | 2,016 | $45,481 |
| Median Family Income | 522 | $82,105 |
| Mean Family Income | 522 | $114,544 |
| Median Household Income | 1,163 | $55,112 |
| Mean Household Income | 1,163 | $79,426 |
| Income Deficit | 522 | $0 |
| Wage / Income Gap (%) | 2,016 | 0.00% |
| Wage / Income Gap ($) | 2,016 | 100.00¢ per $1 |
| Gini / Inequality Index | 2,016 | 0.47 |
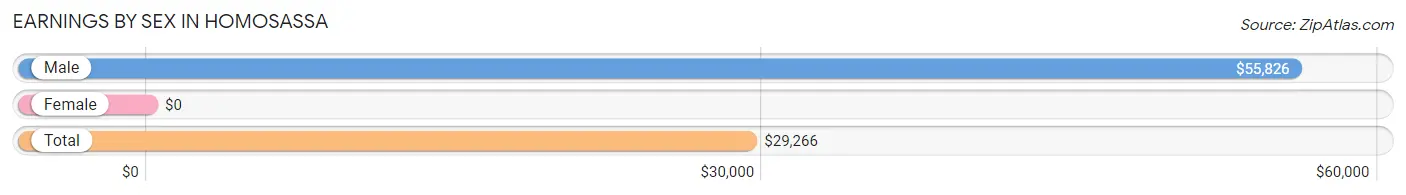
Earnings by Sex in Homosassa
| Sex | Number | Average Earnings |
| Male | 521 (59.3%) | $55,826 |
| Female | 357 (40.7%) | $0 |
| Total | 878 (100.0%) | $29,266 |
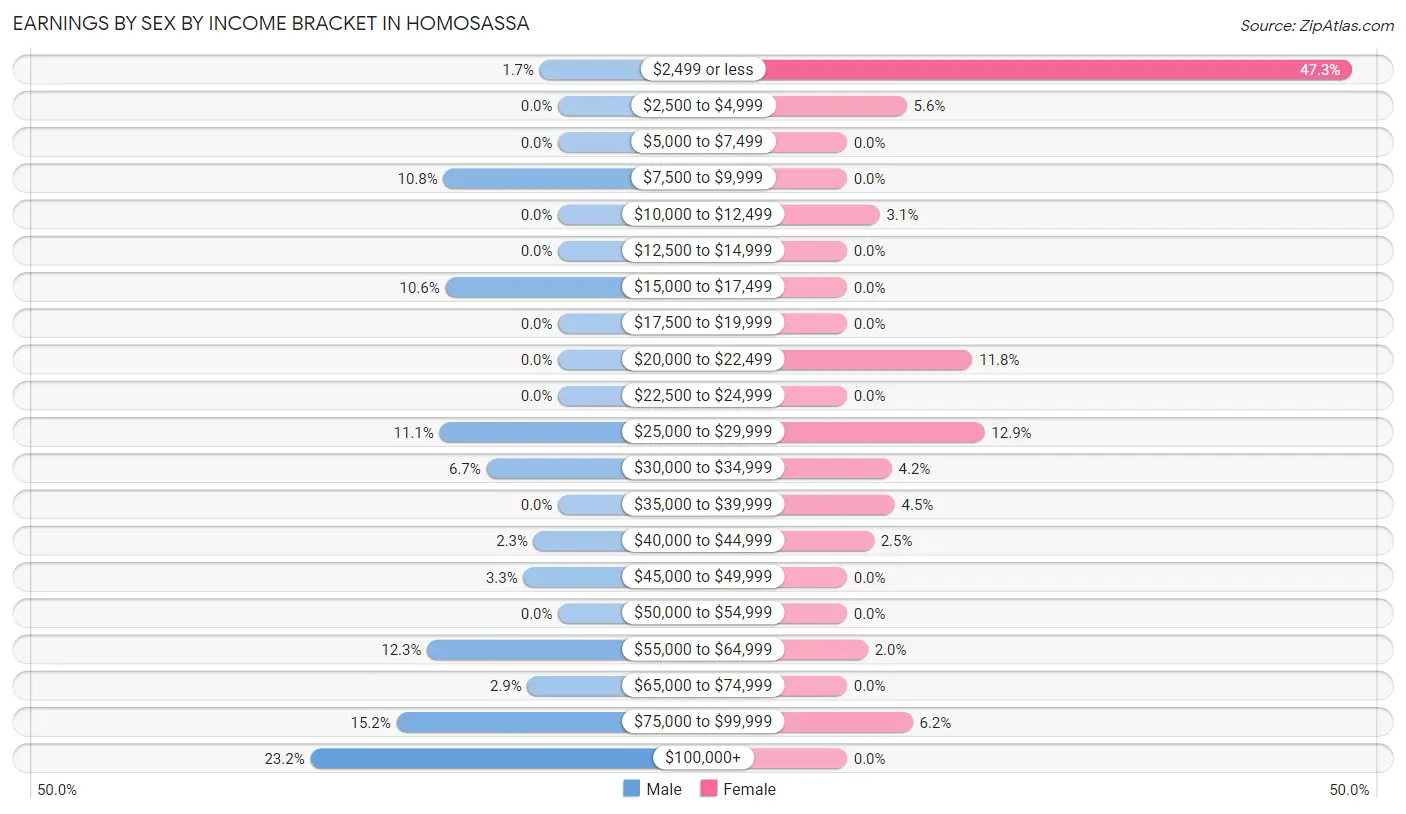
Earnings by Sex by Income Bracket in Homosassa
The most common earnings brackets in Homosassa are $100,000+ for men (121 | 23.2%) and $2,499 or less for women (169 | 47.3%).
| Income | Male | Female |
| $2,499 or less | 9 (1.7%) | 169 (47.3%) |
| $2,500 to $4,999 | 0 (0.0%) | 20 (5.6%) |
| $5,000 to $7,499 | 0 (0.0%) | 0 (0.0%) |
| $7,500 to $9,999 | 56 (10.7%) | 0 (0.0%) |
| $10,000 to $12,499 | 0 (0.0%) | 11 (3.1%) |
| $12,500 to $14,999 | 0 (0.0%) | 0 (0.0%) |
| $15,000 to $17,499 | 55 (10.6%) | 0 (0.0%) |
| $17,500 to $19,999 | 0 (0.0%) | 0 (0.0%) |
| $20,000 to $22,499 | 0 (0.0%) | 42 (11.8%) |
| $22,500 to $24,999 | 0 (0.0%) | 0 (0.0%) |
| $25,000 to $29,999 | 58 (11.1%) | 46 (12.9%) |
| $30,000 to $34,999 | 35 (6.7%) | 15 (4.2%) |
| $35,000 to $39,999 | 0 (0.0%) | 16 (4.5%) |
| $40,000 to $44,999 | 12 (2.3%) | 9 (2.5%) |
| $45,000 to $49,999 | 17 (3.3%) | 0 (0.0%) |
| $50,000 to $54,999 | 0 (0.0%) | 0 (0.0%) |
| $55,000 to $64,999 | 64 (12.3%) | 7 (2.0%) |
| $65,000 to $74,999 | 15 (2.9%) | 0 (0.0%) |
| $75,000 to $99,999 | 79 (15.2%) | 22 (6.2%) |
| $100,000+ | 121 (23.2%) | 0 (0.0%) |
| Total | 521 (100.0%) | 357 (100.0%) |
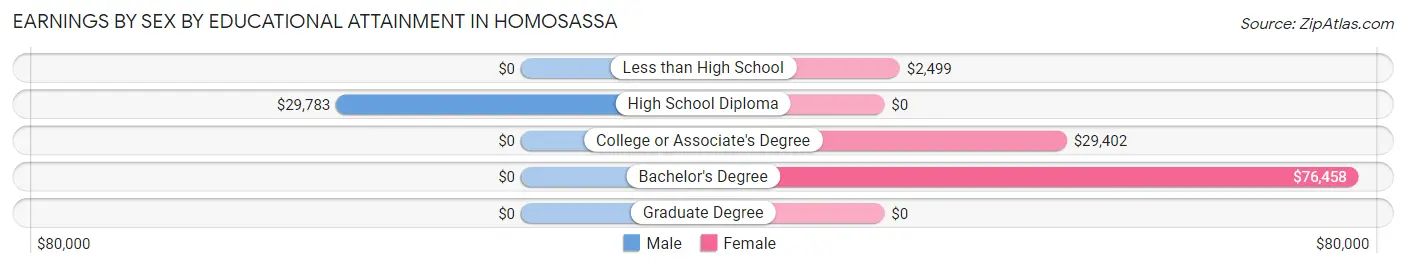
Earnings by Sex by Educational Attainment in Homosassa
| Educational Attainment | Male Income | Female Income |
| Less than High School | - | - |
| High School Diploma | $29,783 | $0 |
| College or Associate's Degree | - | - |
| Bachelor's Degree | - | - |
| Graduate Degree | - | - |
| Total | $55,826 | $0 |
Family Income in Homosassa
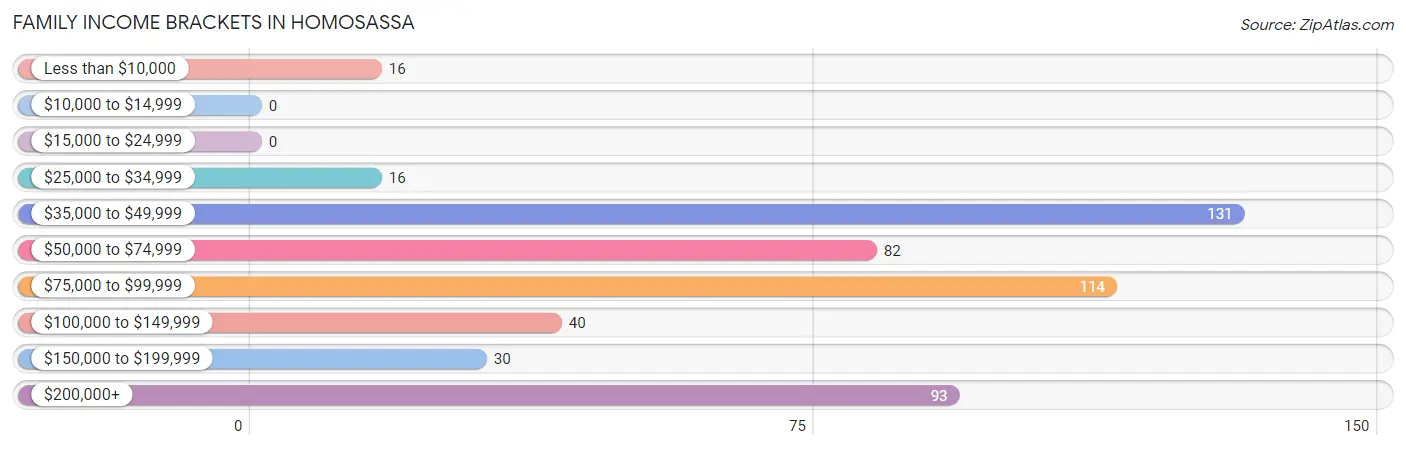
Family Income Brackets in Homosassa
According to the Homosassa family income data, there are 131 families falling into the $35,000 to $49,999 income range, which is the most common income bracket and makes up 25.1% of all families.
| Income Bracket | # Families | % Families |
| Less than $10,000 | 16 | 3.1% |
| $10,000 to $14,999 | 0 | 0.0% |
| $15,000 to $24,999 | 0 | 0.0% |
| $25,000 to $34,999 | 16 | 3.1% |
| $35,000 to $49,999 | 131 | 25.1% |
| $50,000 to $74,999 | 82 | 15.7% |
| $75,000 to $99,999 | 114 | 21.8% |
| $100,000 to $149,999 | 40 | 7.7% |
| $150,000 to $199,999 | 30 | 5.7% |
| $200,000+ | 93 | 17.8% |
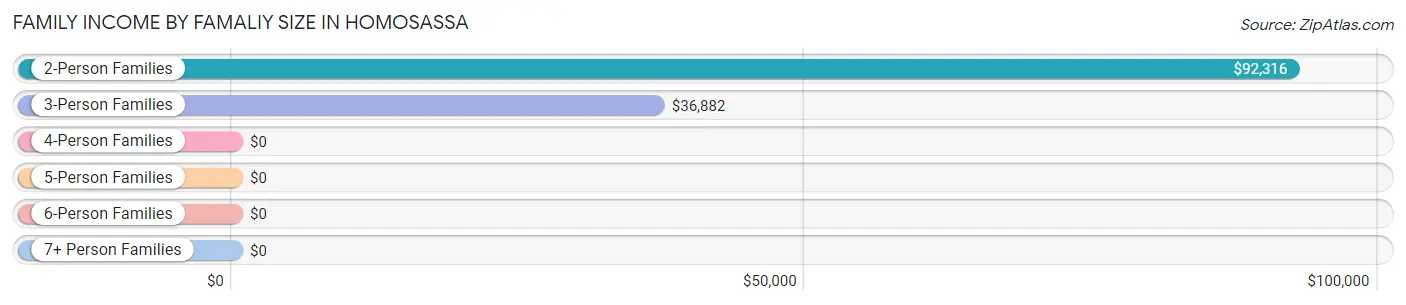
Family Income by Famaliy Size in Homosassa
2-person families (379 | 72.6%) account for the highest median family income in Homosassa with $92,316 per family, while 2-person families (379 | 72.6%) have the highest median income of $46,158 per family member.
| Income Bracket | # Families | Median Income |
| 2-Person Families | 379 (72.6%) | $92,316 |
| 3-Person Families | 134 (25.7%) | $36,882 |
| 4-Person Families | 9 (1.7%) | $0 |
| 5-Person Families | 0 (0.0%) | $0 |
| 6-Person Families | 0 (0.0%) | $0 |
| 7+ Person Families | 0 (0.0%) | $0 |
| Total | 522 (100.0%) | $82,105 |
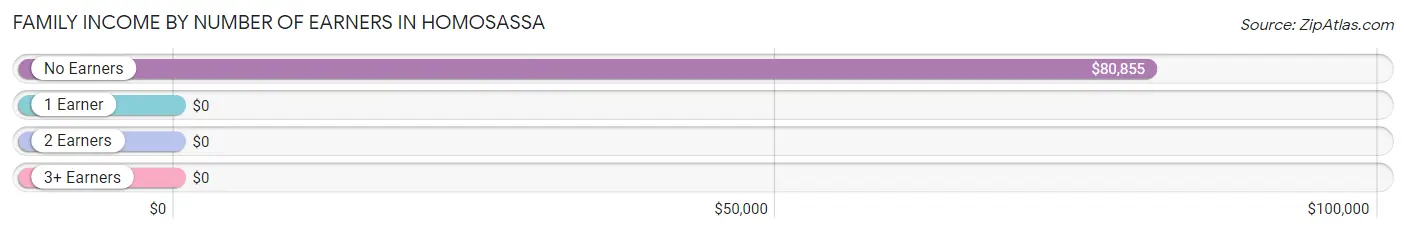
Family Income by Number of Earners in Homosassa
| Number of Earners | # Families | Median Income |
| No Earners | 217 (41.6%) | $80,855 |
| 1 Earner | 226 (43.3%) | $0 |
| 2 Earners | 44 (8.4%) | $0 |
| 3+ Earners | 35 (6.7%) | $0 |
| Total | 522 (100.0%) | $82,105 |
Household Income in Homosassa
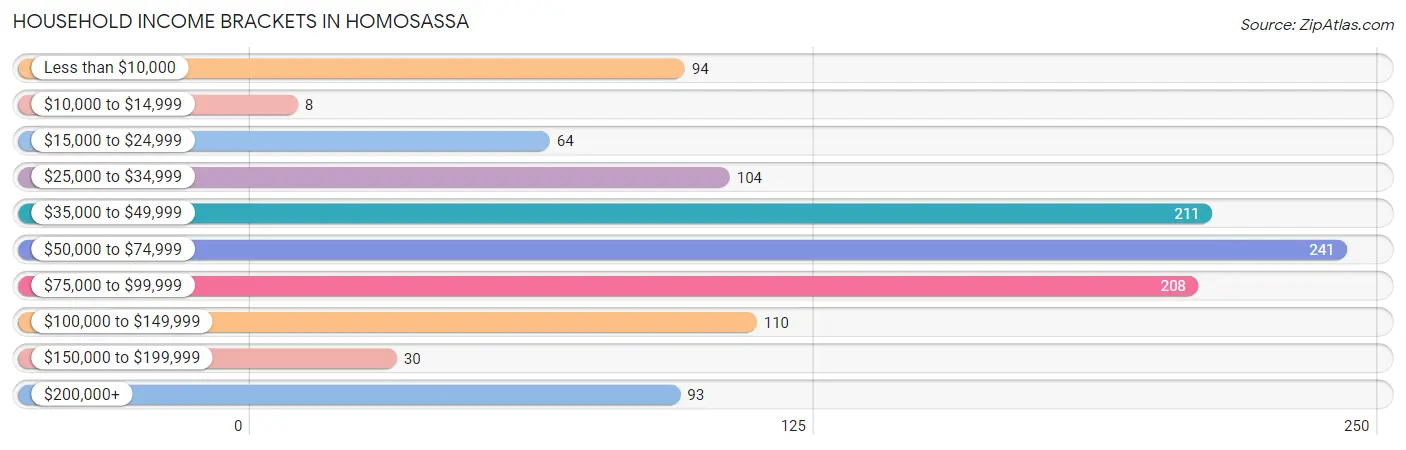
Household Income Brackets in Homosassa
With 241 households falling in the category, the $50,000 to $74,999 income range is the most frequent in Homosassa, accounting for 20.7% of all households. In contrast, only 8 households (0.7%) fall into the $10,000 to $14,999 income bracket, making it the least populous group.
| Income Bracket | # Households | % Households |
| Less than $10,000 | 94 | 8.1% |
| $10,000 to $14,999 | 8 | 0.7% |
| $15,000 to $24,999 | 64 | 5.5% |
| $25,000 to $34,999 | 104 | 8.9% |
| $35,000 to $49,999 | 211 | 18.1% |
| $50,000 to $74,999 | 241 | 20.7% |
| $75,000 to $99,999 | 208 | 17.9% |
| $100,000 to $149,999 | 110 | 9.5% |
| $150,000 to $199,999 | 30 | 2.6% |
| $200,000+ | 93 | 8.0% |
Household Income by Householder Age in Homosassa
The median household income in Homosassa is $55,112, with the highest median household income of $57,857 found in the 45 to 64 years age bracket for the primary householder. A total of 354 households (30.4%) fall into this category.
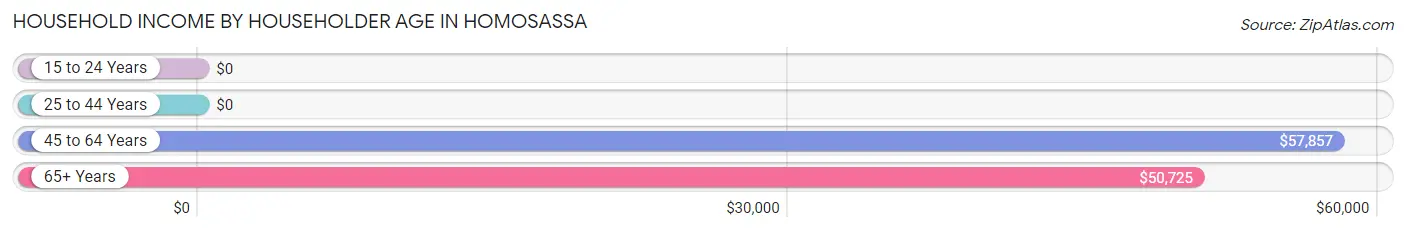
| Income Bracket | # Households | Median Income |
| 15 to 24 Years | 0 (0.0%) | $0 |
| 25 to 44 Years | 110 (9.5%) | $0 |
| 45 to 64 Years | 354 (30.4%) | $57,857 |
| 65+ Years | 699 (60.1%) | $50,725 |
| Total | 1,163 (100.0%) | $55,112 |
Poverty in Homosassa
Income Below Poverty by Sex and Age in Homosassa
With 11.5% poverty level for males and 12.1% for females among the residents of Homosassa, 75 year old and over males and 45 to 54 year old females are the most vulnerable to poverty, with 71 males (38.2%) and 28 females (32.6%) in their respective age groups living below the poverty level.
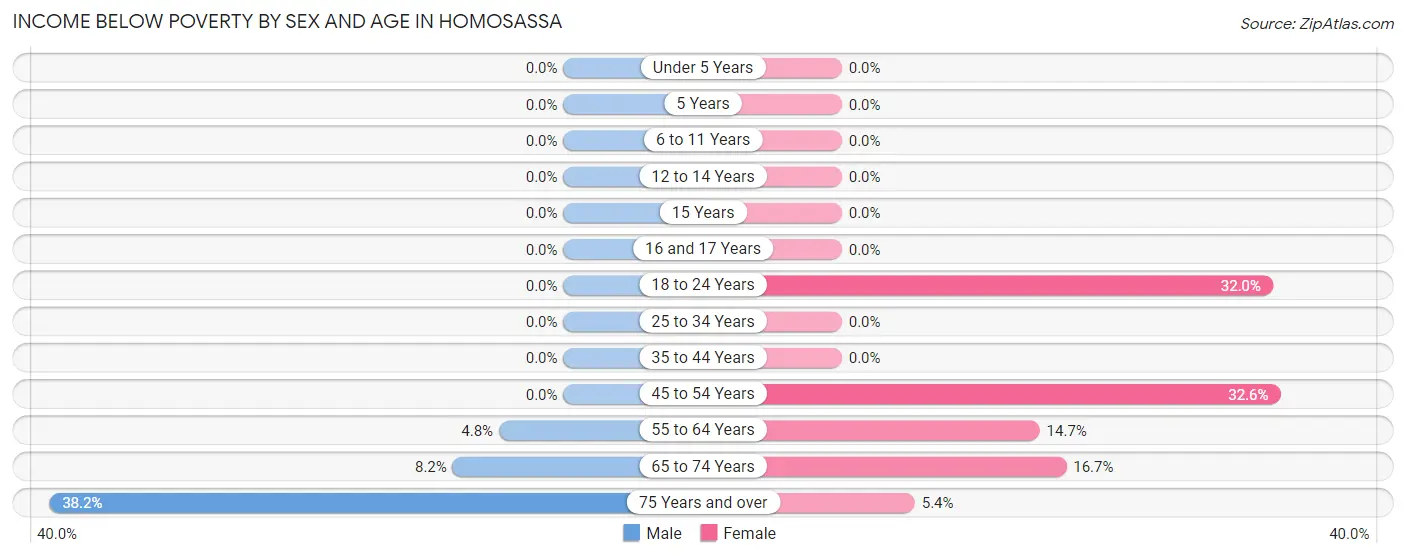
| Age Bracket | Male | Female |
| Under 5 Years | 0 (0.0%) | 0 (0.0%) |
| 5 Years | 0 (0.0%) | 0 (0.0%) |
| 6 to 11 Years | 0 (0.0%) | 0 (0.0%) |
| 12 to 14 Years | 0 (0.0%) | 0 (0.0%) |
| 15 Years | 0 (0.0%) | 0 (0.0%) |
| 16 and 17 Years | 0 (0.0%) | 0 (0.0%) |
| 18 to 24 Years | 0 (0.0%) | 16 (32.0%) |
| 25 to 34 Years | 0 (0.0%) | 0 (0.0%) |
| 35 to 44 Years | 0 (0.0%) | 0 (0.0%) |
| 45 to 54 Years | 0 (0.0%) | 28 (32.6%) |
| 55 to 64 Years | 11 (4.8%) | 26 (14.7%) |
| 65 to 74 Years | 25 (8.2%) | 52 (16.7%) |
| 75 Years and over | 71 (38.2%) | 9 (5.4%) |
| Total | 107 (11.5%) | 131 (12.1%) |
Income Above Poverty by Sex and Age in Homosassa
According to the poverty statistics in Homosassa, males aged 35 to 44 years and females aged 16 and 17 years are the age groups that are most secure financially, with 100.0% of males and 100.0% of females in these age groups living above the poverty line.
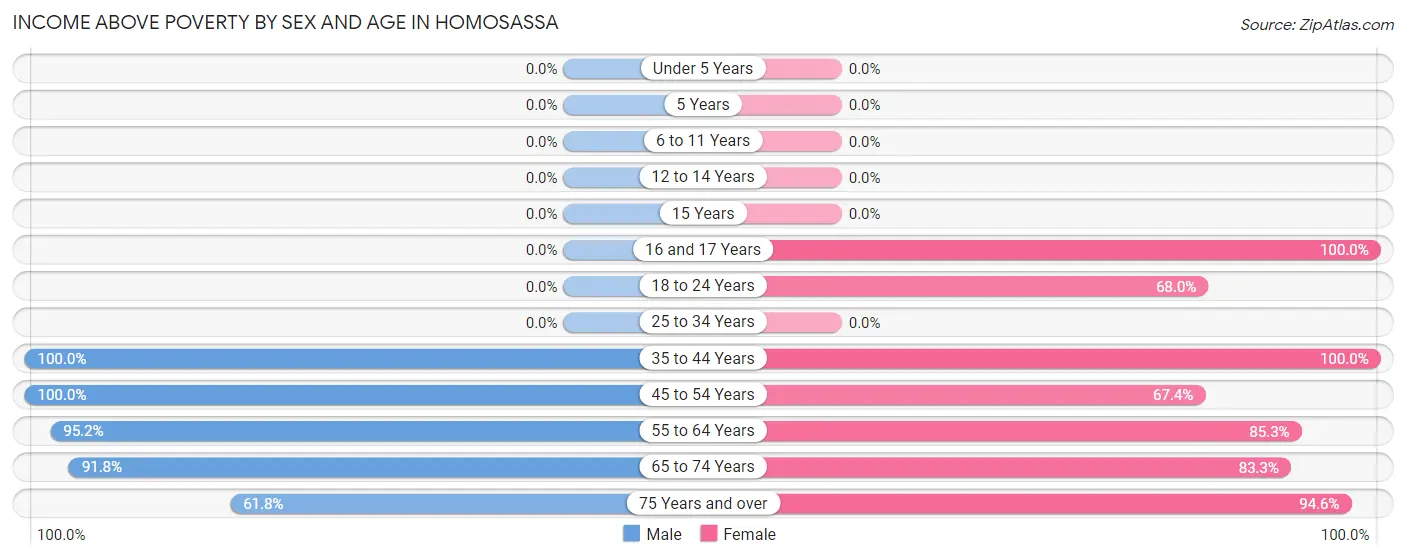
| Age Bracket | Male | Female |
| Under 5 Years | 0 (0.0%) | 0 (0.0%) |
| 5 Years | 0 (0.0%) | 0 (0.0%) |
| 6 to 11 Years | 0 (0.0%) | 0 (0.0%) |
| 12 to 14 Years | 0 (0.0%) | 0 (0.0%) |
| 15 Years | 0 (0.0%) | 0 (0.0%) |
| 16 and 17 Years | 0 (0.0%) | 114 (100.0%) |
| 18 to 24 Years | 0 (0.0%) | 34 (68.0%) |
| 25 to 34 Years | 0 (0.0%) | 0 (0.0%) |
| 35 to 44 Years | 110 (100.0%) | 179 (100.0%) |
| 45 to 54 Years | 102 (100.0%) | 58 (67.4%) |
| 55 to 64 Years | 219 (95.2%) | 151 (85.3%) |
| 65 to 74 Years | 279 (91.8%) | 260 (83.3%) |
| 75 Years and over | 115 (61.8%) | 157 (94.6%) |
| Total | 825 (88.5%) | 953 (87.9%) |
Income Below Poverty Among Married-Couple Families in Homosassa
The poverty statistics for married-couple families in Homosassa show that 5.9% or 25 of the total 426 families live below the poverty line. Families with no children have the highest poverty rate of 5.9%, comprising of 25 families. On the other hand, families with no children have the lowest poverty rate of 5.9%, which includes 25 families.
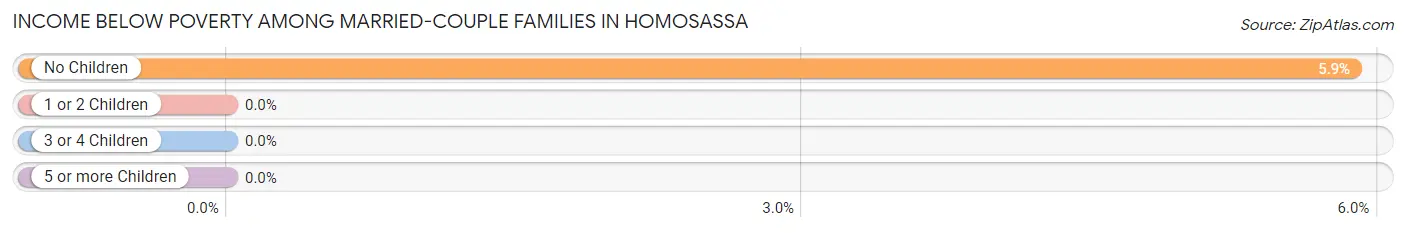
| Children | Above Poverty | Below Poverty |
| No Children | 401 (94.1%) | 25 (5.9%) |
| 1 or 2 Children | 0 (0.0%) | 0 (0.0%) |
| 3 or 4 Children | 0 (0.0%) | 0 (0.0%) |
| 5 or more Children | 0 (0.0%) | 0 (0.0%) |
| Total | 401 (94.1%) | 25 (5.9%) |
Income Below Poverty Among Single-Parent Households in Homosassa
| Children | Single Father | Single Mother |
| No Children | 0 (0.0%) | 0 (0.0%) |
| 1 or 2 Children | 0 (0.0%) | 0 (0.0%) |
| 3 or 4 Children | 0 (0.0%) | 0 (0.0%) |
| 5 or more Children | 0 (0.0%) | 0 (0.0%) |
| Total | 0 (0.0%) | 0 (0.0%) |
Income Below Poverty Among Married-Couple vs Single-Parent Households in Homosassa
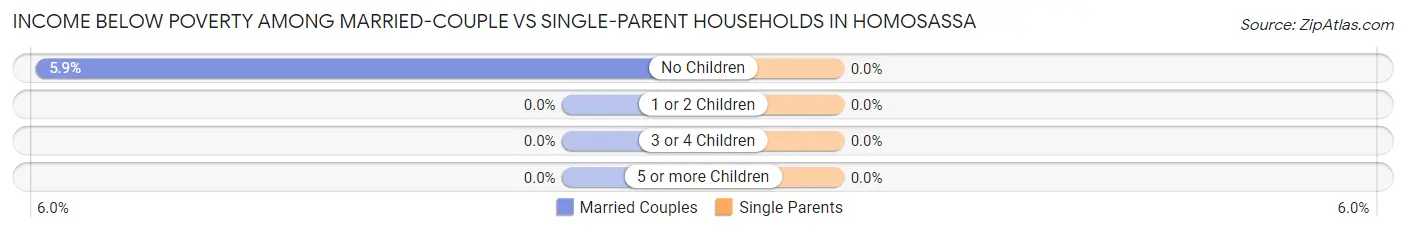
| Children | Married-Couple Families | Single-Parent Households |
| No Children | 25 (5.9%) | 0 (0.0%) |
| 1 or 2 Children | 0 (0.0%) | 0 (0.0%) |
| 3 or 4 Children | 0 (0.0%) | 0 (0.0%) |
| 5 or more Children | 0 (0.0%) | 0 (0.0%) |
| Total | 25 (5.9%) | 0 (0.0%) |
Race in Homosassa
The most populous races in Homosassa are White / Caucasian (1,960 | 97.2%), Some other Race (22 | 1.1%), and Two or more Races (20 | 1.0%).
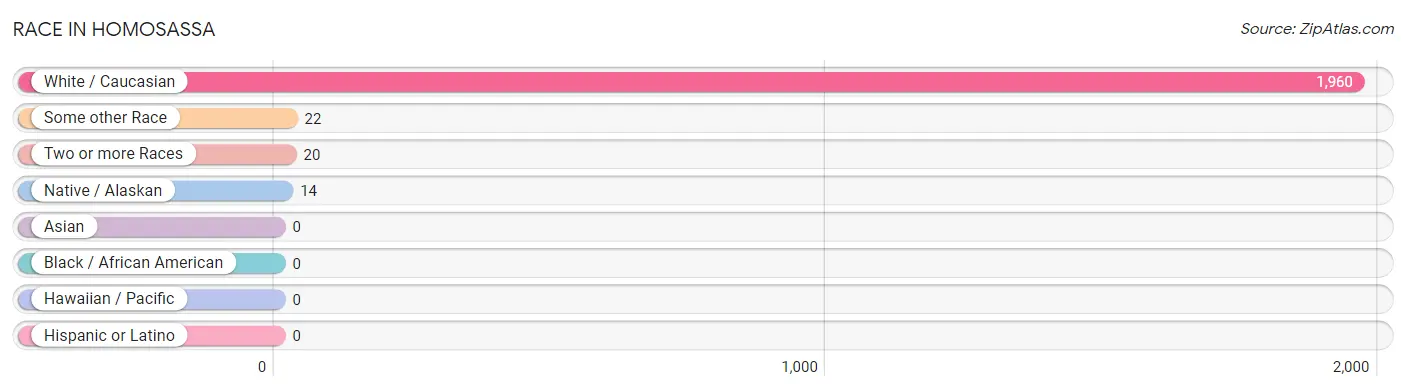
| Race | # Population | % Population |
| Asian | 0 | 0.0% |
| Black / African American | 0 | 0.0% |
| Hawaiian / Pacific | 0 | 0.0% |
| Hispanic or Latino | 0 | 0.0% |
| Native / Alaskan | 14 | 0.7% |
| White / Caucasian | 1,960 | 97.2% |
| Two or more Races | 20 | 1.0% |
| Some other Race | 22 | 1.1% |
| Total | 2,016 | 100.0% |
Ancestry in Homosassa
The most populous ancestries reported in Homosassa are American (595 | 29.5%), German (364 | 18.1%), English (345 | 17.1%), Irish (278 | 13.8%), and French (84 | 4.2%), together accounting for 82.6% of all Homosassa residents.
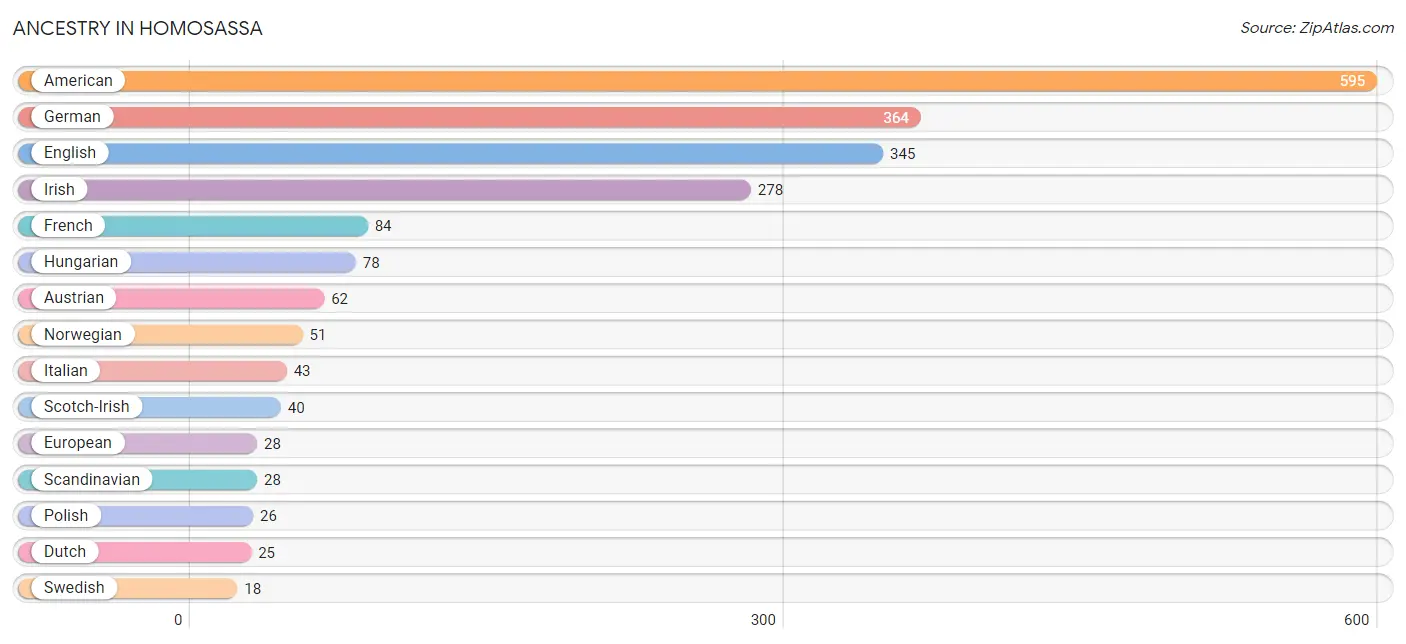
| Ancestry | # Population | % Population |
| American | 595 | 29.5% |
| Arab | 17 | 0.8% |
| Austrian | 62 | 3.1% |
| Belgian | 10 | 0.5% |
| British | 10 | 0.5% |
| Czechoslovakian | 13 | 0.6% |
| Danish | 17 | 0.8% |
| Dutch | 25 | 1.2% |
| English | 345 | 17.1% |
| European | 28 | 1.4% |
| French | 84 | 4.2% |
| German | 364 | 18.1% |
| Hungarian | 78 | 3.9% |
| Irish | 278 | 13.8% |
| Italian | 43 | 2.1% |
| Lebanese | 17 | 0.8% |
| Norwegian | 51 | 2.5% |
| Polish | 26 | 1.3% |
| Scandinavian | 28 | 1.4% |
| Scotch-Irish | 40 | 2.0% |
| Swedish | 18 | 0.9% | View All 21 Rows |
Immigrants in Homosassa
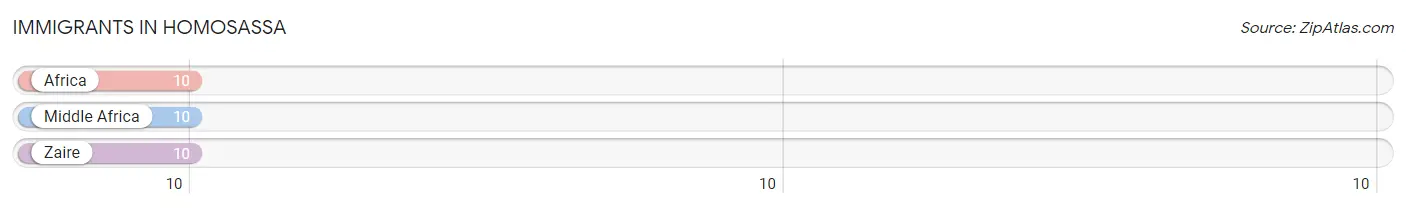
The most numerous immigrant groups reported in Homosassa came from Africa (10 | 0.5%), Middle Africa (10 | 0.5%), and Zaire (10 | 0.5%), together accounting for 1.5% of all Homosassa residents.
| Immigration Origin | # Population | % Population |
| Africa | 10 | 0.5% |
| Middle Africa | 10 | 0.5% |
| Zaire | 10 | 0.5% | View All 3 Rows |
Sex and Age in Homosassa
Sex and Age in Homosassa
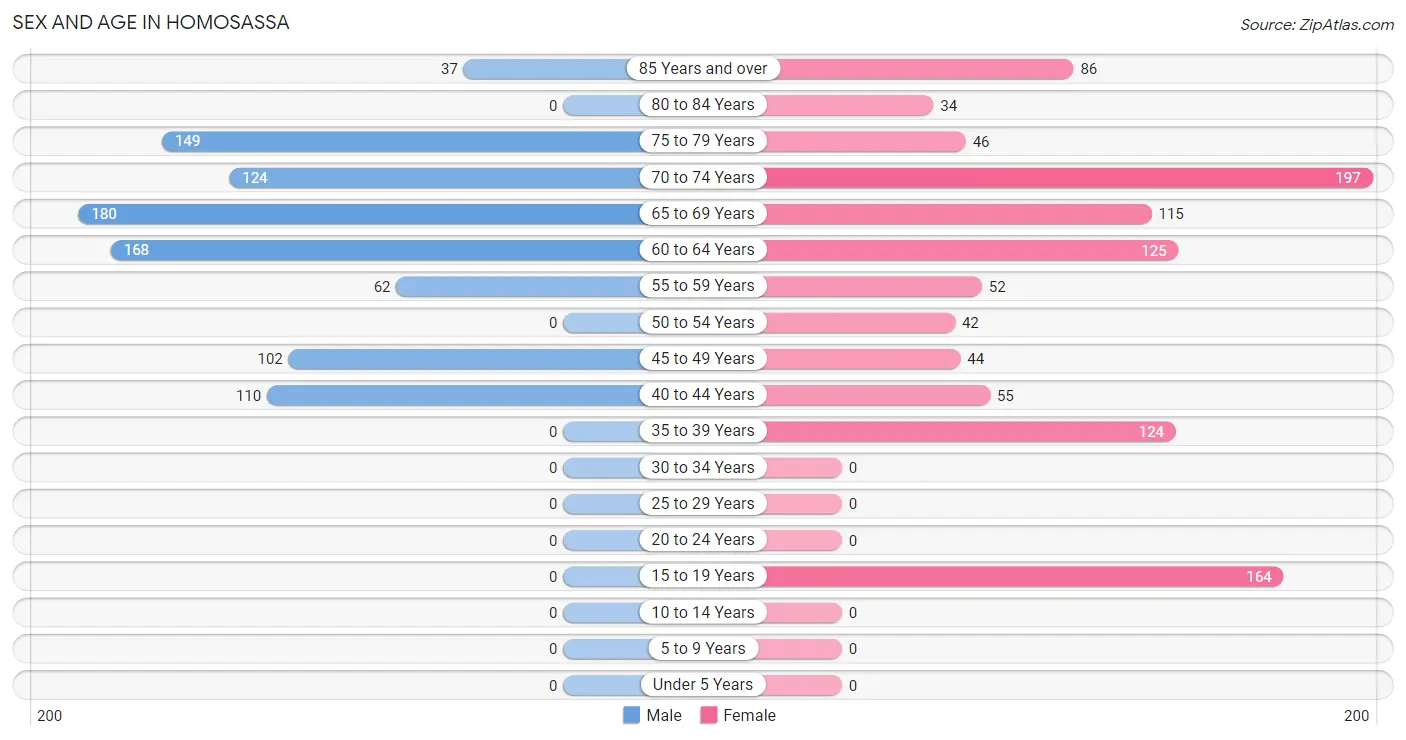
The most populous age groups in Homosassa are 65 to 69 Years (180 | 19.3%) for men and 70 to 74 Years (197 | 18.2%) for women.
| Age Bracket | Male | Female |
| Under 5 Years | 0 (0.0%) | 0 (0.0%) |
| 5 to 9 Years | 0 (0.0%) | 0 (0.0%) |
| 10 to 14 Years | 0 (0.0%) | 0 (0.0%) |
| 15 to 19 Years | 0 (0.0%) | 164 (15.1%) |
| 20 to 24 Years | 0 (0.0%) | 0 (0.0%) |
| 25 to 29 Years | 0 (0.0%) | 0 (0.0%) |
| 30 to 34 Years | 0 (0.0%) | 0 (0.0%) |
| 35 to 39 Years | 0 (0.0%) | 124 (11.4%) |
| 40 to 44 Years | 110 (11.8%) | 55 (5.1%) |
| 45 to 49 Years | 102 (10.9%) | 44 (4.1%) |
| 50 to 54 Years | 0 (0.0%) | 42 (3.9%) |
| 55 to 59 Years | 62 (6.7%) | 52 (4.8%) |
| 60 to 64 Years | 168 (18.0%) | 125 (11.5%) |
| 65 to 69 Years | 180 (19.3%) | 115 (10.6%) |
| 70 to 74 Years | 124 (13.3%) | 197 (18.2%) |
| 75 to 79 Years | 149 (16.0%) | 46 (4.2%) |
| 80 to 84 Years | 0 (0.0%) | 34 (3.1%) |
| 85 Years and over | 37 (4.0%) | 86 (7.9%) |
| Total | 932 (100.0%) | 1,084 (100.0%) |
Families and Households in Homosassa
Median Family Size in Homosassa
| Family Type | # Families | Family Size |
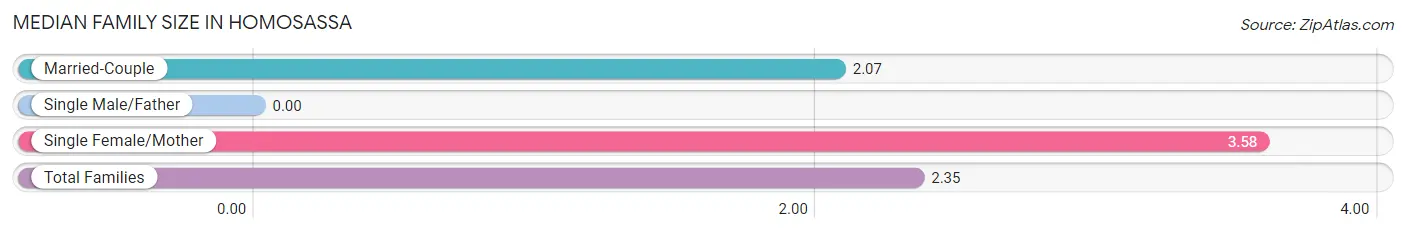
| Married-Couple | 426 (81.6%) | 2.07 |
| Single Male/Father | 0 (0.0%) | - |
| Single Female/Mother | 96 (18.4%) | 3.58 |
| Total Families | 522 (100.0%) | 2.35 |
Median Household Size in Homosassa
| Household Type | # Households | Household Size |
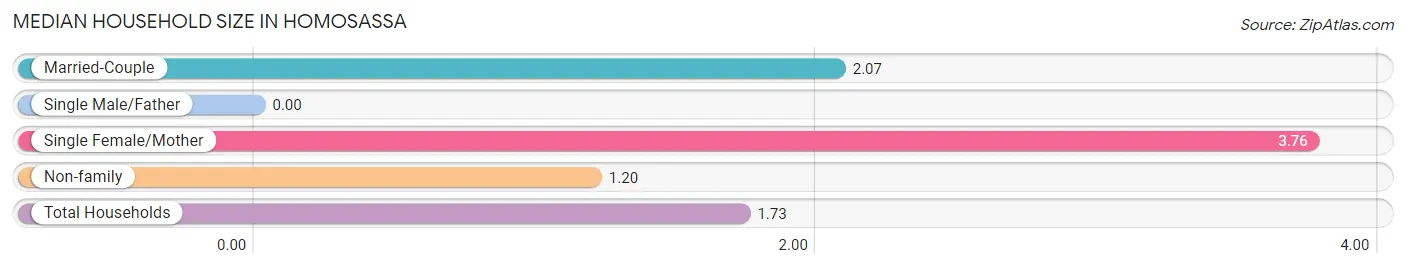
| Married-Couple | 426 (36.6%) | 2.07 |
| Single Male/Father | 0 (0.0%) | - |
| Single Female/Mother | 96 (8.3%) | 3.76 |
| Non-family | 641 (55.1%) | 1.20 |
| Total Households | 1,163 (100.0%) | 1.73 |
Household Size by Marriage Status in Homosassa
Out of a total of 1,163 households in Homosassa, 522 (44.9%) are family households, while 641 (55.1%) are nonfamily households. The most numerous type of family households are 2-person households, comprising 372, and the most common type of nonfamily households are 1-person households, comprising 538.
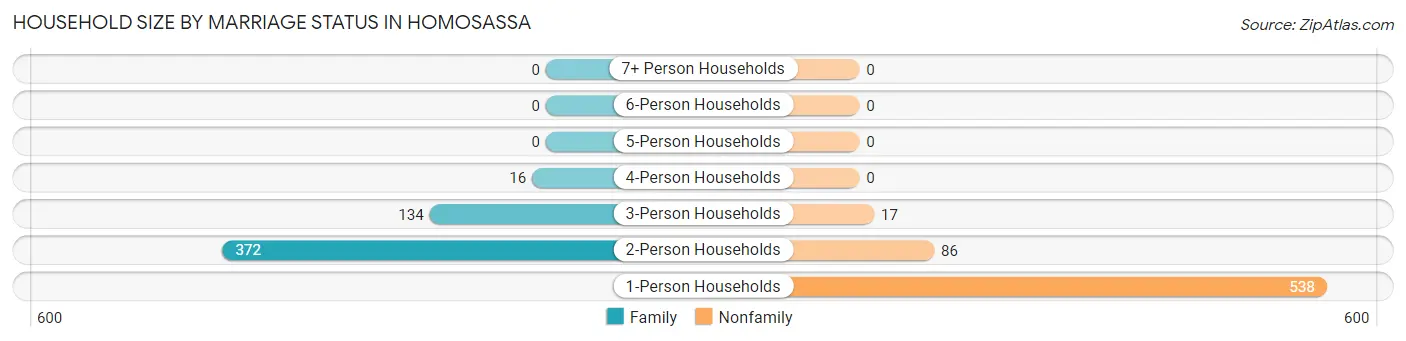
| Household Size | Family Households | Nonfamily Households |
| 1-Person Households | - | 538 (46.3%) |
| 2-Person Households | 372 (32.0%) | 86 (7.4%) |
| 3-Person Households | 134 (11.5%) | 17 (1.5%) |
| 4-Person Households | 16 (1.4%) | 0 (0.0%) |
| 5-Person Households | 0 (0.0%) | 0 (0.0%) |
| 6-Person Households | 0 (0.0%) | 0 (0.0%) |
| 7+ Person Households | 0 (0.0%) | 0 (0.0%) |
| Total | 522 (44.9%) | 641 (55.1%) |
Female Fertility in Homosassa
Fertility by Age in Homosassa
| Age Bracket | Women with Births | Births / 1,000 Women |
| 15 to 19 years | 0 (0.0%) | 0.0 |
| 20 to 34 years | 0 (0.0%) | 0.0 |
| 35 to 50 years | 0 (0.0%) | 0.0 |
| Total | 0 (0.0%) | 0.0 |
Fertility by Age by Marriage Status in Homosassa
| Age Bracket | Married | Unmarried |
| 15 to 19 years | 0 (0.0%) | 0 (0.0%) |
| 20 to 34 years | 0 (0.0%) | 0 (0.0%) |
| 35 to 50 years | 0 (0.0%) | 0 (0.0%) |
| Total | 0 (0.0%) | 0 (0.0%) |
Fertility by Education in Homosassa
| Educational Attainment | Women with Births | Births / 1,000 Women |
| Less than High School | 0 (0.0%) | 0.0 |
| High School Diploma | 0 (0.0%) | 0.0 |
| College or Associate's Degree | 0 (0.0%) | 0.0 |
| Bachelor's Degree | 0 (0.0%) | 0.0 |
| Graduate Degree | 0 (0.0%) | 0.0 |
| Total | 0 (0.0%) | 0.0 |
Fertility by Education by Marriage Status in Homosassa
| Educational Attainment | Married | Unmarried |
| Less than High School | 0 (0.0%) | 0 (0.0%) |
| High School Diploma | 0 (0.0%) | 0 (0.0%) |
| College or Associate's Degree | 0 (0.0%) | 0 (0.0%) |
| Bachelor's Degree | 0 (0.0%) | 0 (0.0%) |
| Graduate Degree | 0 (0.0%) | 0 (0.0%) |
| Total | 0 (0.0%) | 0 (0.0%) |
Employment Characteristics in Homosassa
Employment by Class of Employer in Homosassa
Among the 762 employed individuals in Homosassa, private company employees (440 | 57.7%), self-employed (incorporated) (217 | 28.5%), and not-for-profit organizations (56 | 7.3%) make up the most common classes of employment.
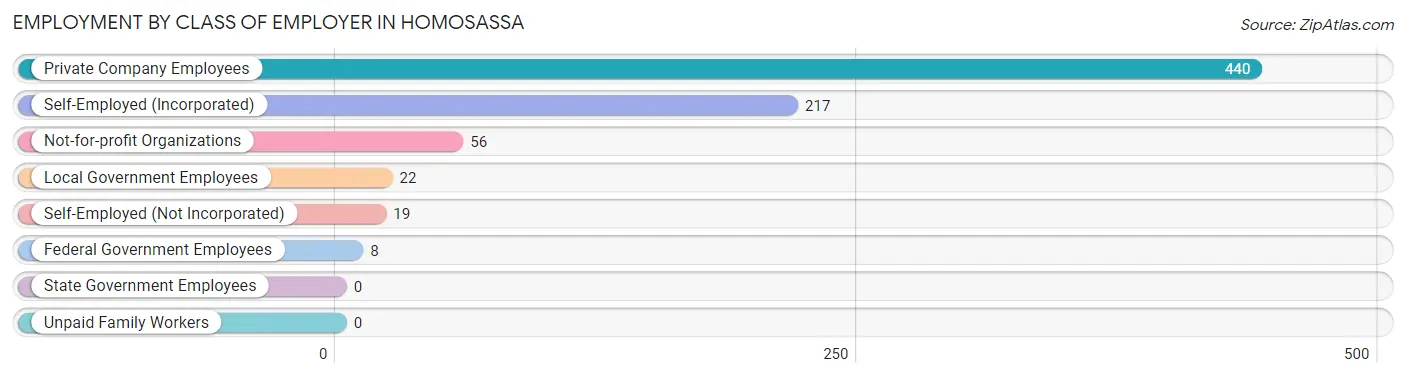
| Employer Class | # Employees | % Employees |
| Private Company Employees | 440 | 57.7% |
| Self-Employed (Incorporated) | 217 | 28.5% |
| Self-Employed (Not Incorporated) | 19 | 2.5% |
| Not-for-profit Organizations | 56 | 7.3% |
| Local Government Employees | 22 | 2.9% |
| State Government Employees | 0 | 0.0% |
| Federal Government Employees | 8 | 1.1% |
| Unpaid Family Workers | 0 | 0.0% |
| Total | 762 | 100.0% |
Employment Status by Age in Homosassa
According to the labor force statistics for Homosassa, out of the total population over 16 years of age (2,016), 41.1% or 829 individuals are in the labor force, with 2.5% or 21 of them unemployed. The age group with the highest labor force participation rate is 35 to 44 years, with 81.0% or 234 individuals in the labor force. Within the labor force, the 65 to 74 years age range has the highest percentage of unemployed individuals, with 12.5% or 21 of them being unemployed.
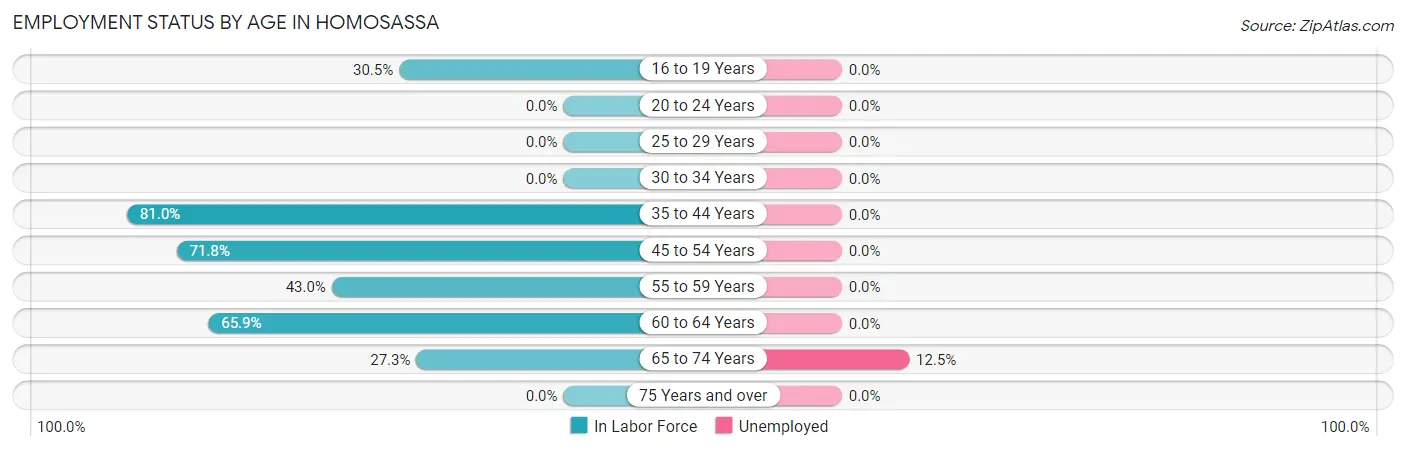
| Age Bracket | In Labor Force | Unemployed |
| 16 to 19 Years | 50 (30.5%) | 0 (0.0%) |
| 20 to 24 Years | 0 (0.0%) | 0 (0.0%) |
| 25 to 29 Years | 0 (0.0%) | 0 (0.0%) |
| 30 to 34 Years | 0 (0.0%) | 0 (0.0%) |
| 35 to 44 Years | 234 (81.0%) | 0 (0.0%) |
| 45 to 54 Years | 135 (71.8%) | 0 (0.0%) |
| 55 to 59 Years | 49 (43.0%) | 0 (0.0%) |
| 60 to 64 Years | 193 (65.9%) | 0 (0.0%) |
| 65 to 74 Years | 168 (27.3%) | 21 (12.5%) |
| 75 Years and over | 0 (0.0%) | 0 (0.0%) |
| Total | 829 (41.1%) | 21 (2.5%) |
Employment Status by Educational Attainment in Homosassa
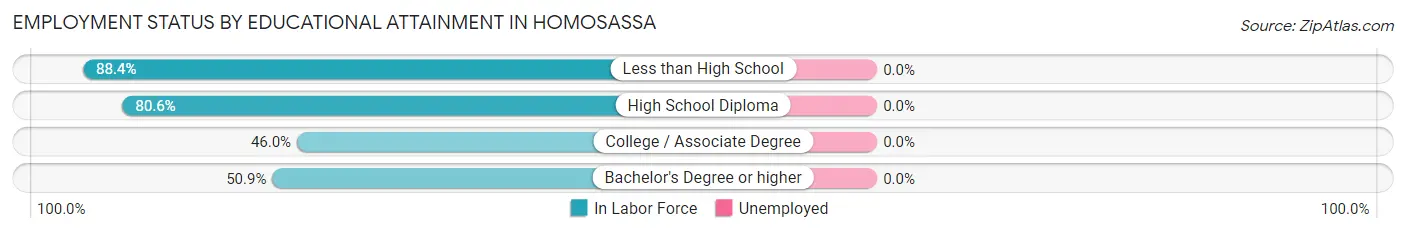
| Educational Attainment | In Labor Force | Unemployed |
| Less than High School | 153 (88.4%) | 0 (0.0%) |
| High School Diploma | 274 (80.6%) | 0 (0.0%) |
| College / Associate Degree | 46 (46.0%) | 0 (0.0%) |
| Bachelor's Degree or higher | 138 (50.9%) | 0 (0.0%) |
| Total | 611 (69.1%) | 0 (0.0%) |
Employment Occupations by Sex in Homosassa
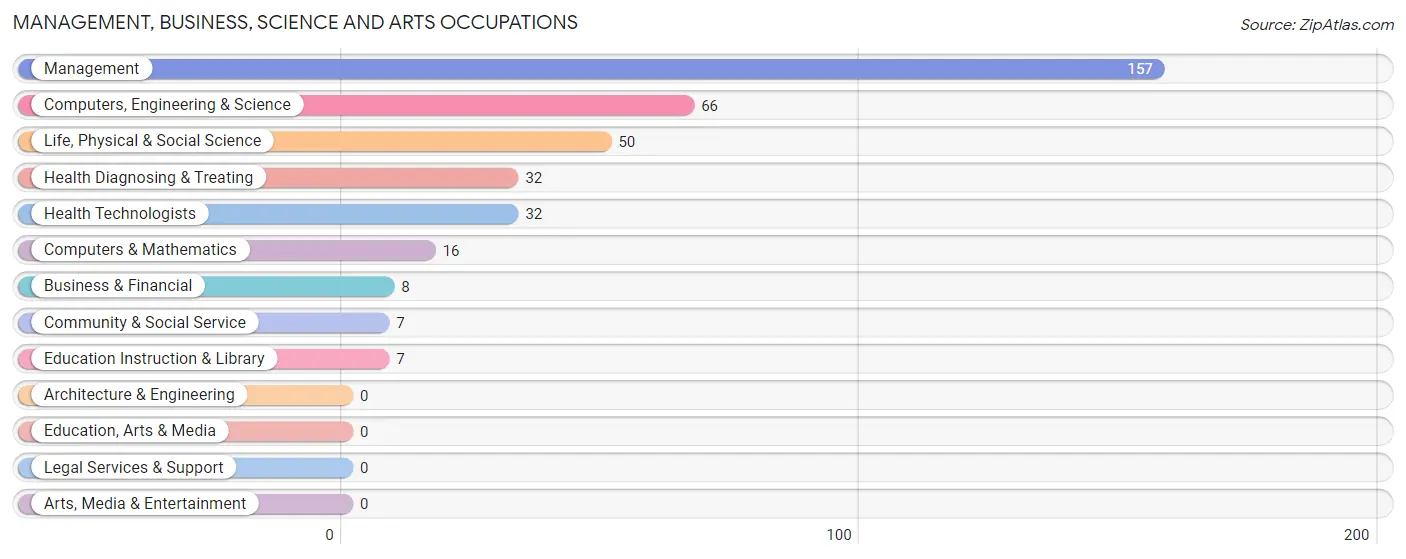
Management, Business, Science and Arts Occupations
The most common Management, Business, Science and Arts occupations in Homosassa are Management (157 | 19.4%), Computers, Engineering & Science (66 | 8.2%), Life, Physical & Social Science (50 | 6.2%), Health Diagnosing & Treating (32 | 4.0%), and Health Technologists (32 | 4.0%).
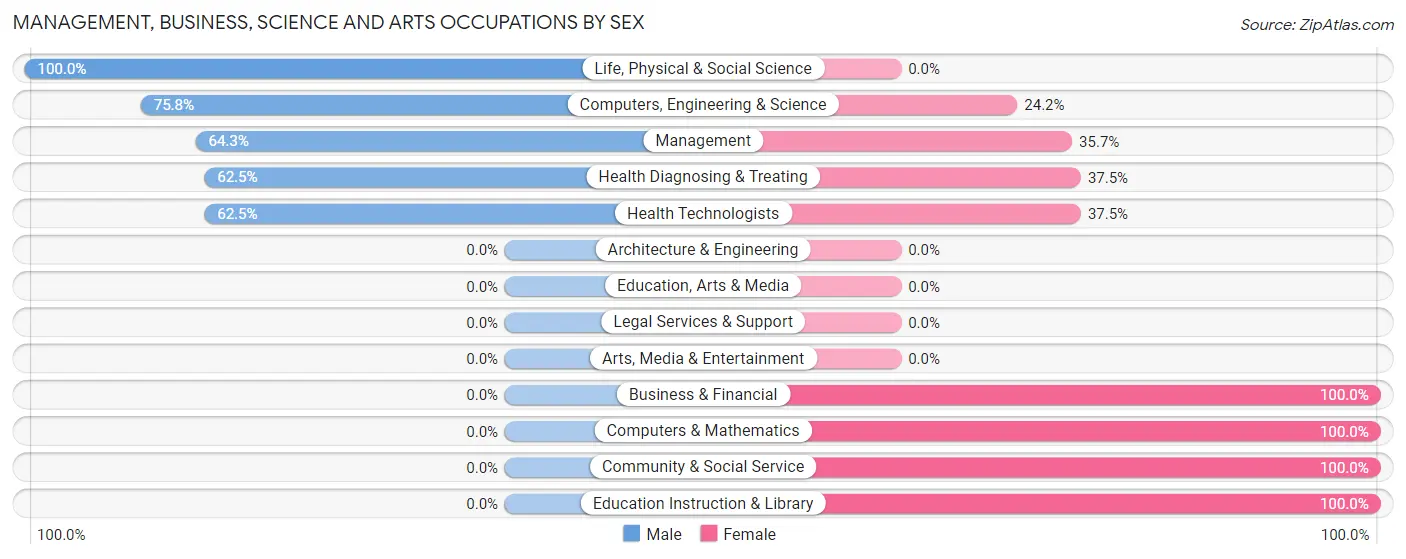
Management, Business, Science and Arts Occupations by Sex
Within the Management, Business, Science and Arts occupations in Homosassa, the most male-oriented occupations are Life, Physical & Social Science (100.0%), Computers, Engineering & Science (75.8%), and Management (64.3%), while the most female-oriented occupations are Business & Financial (100.0%), Computers & Mathematics (100.0%), and Community & Social Service (100.0%).
| Occupation | Male | Female |
| Management | 101 (64.3%) | 56 (35.7%) |
| Business & Financial | 0 (0.0%) | 8 (100.0%) |
| Computers, Engineering & Science | 50 (75.8%) | 16 (24.2%) |
| Computers & Mathematics | 0 (0.0%) | 16 (100.0%) |
| Architecture & Engineering | 0 (0.0%) | 0 (0.0%) |
| Life, Physical & Social Science | 50 (100.0%) | 0 (0.0%) |
| Community & Social Service | 0 (0.0%) | 7 (100.0%) |
| Education, Arts & Media | 0 (0.0%) | 0 (0.0%) |
| Legal Services & Support | 0 (0.0%) | 0 (0.0%) |
| Education Instruction & Library | 0 (0.0%) | 7 (100.0%) |
| Arts, Media & Entertainment | 0 (0.0%) | 0 (0.0%) |
| Health Diagnosing & Treating | 20 (62.5%) | 12 (37.5%) |
| Health Technologists | 20 (62.5%) | 12 (37.5%) |
| Total (Category) | 171 (63.3%) | 99 (36.7%) |
| Total (Overall) | 471 (58.3%) | 337 (41.7%) |
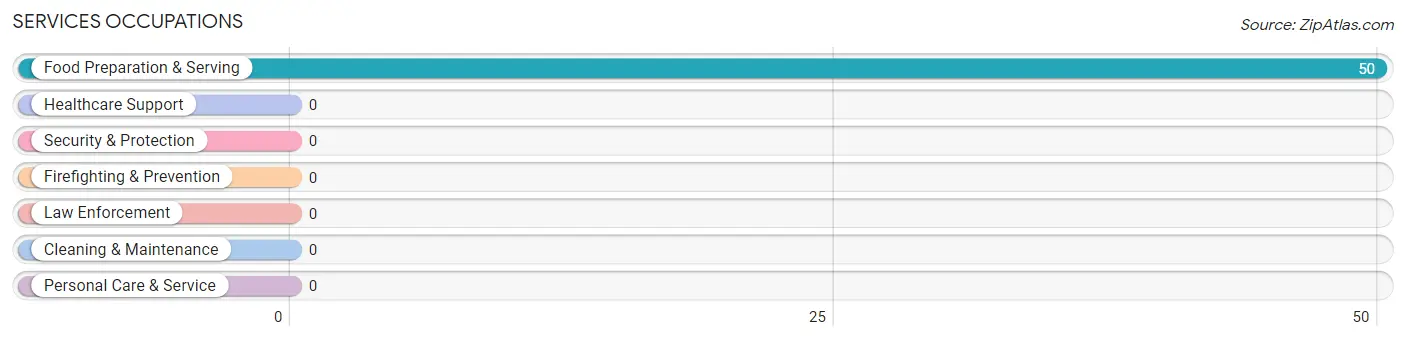
Services Occupations
The most common Services occupations in Homosassa are , and Food Preparation & Serving (50 | 6.2%).
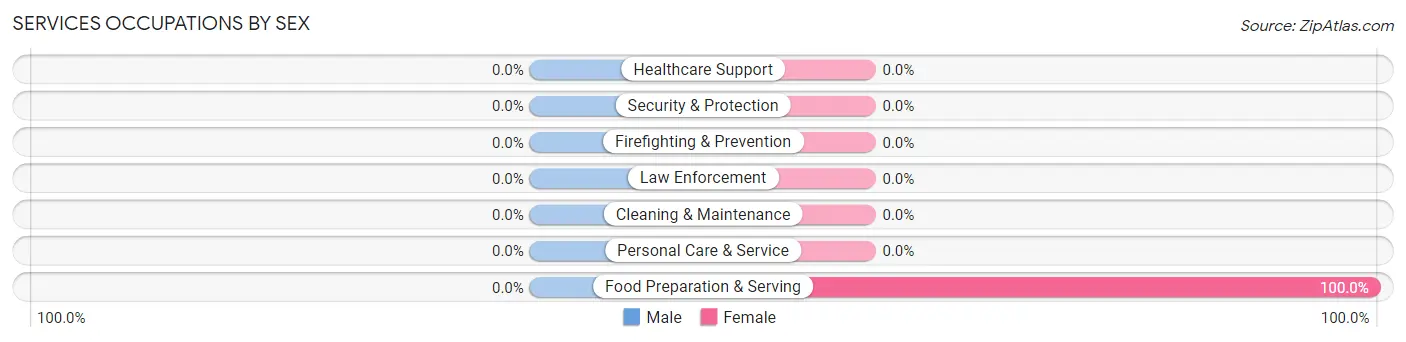
Services Occupations by Sex
| Occupation | Male | Female |
| Healthcare Support | 0 (0.0%) | 0 (0.0%) |
| Security & Protection | 0 (0.0%) | 0 (0.0%) |
| Firefighting & Prevention | 0 (0.0%) | 0 (0.0%) |
| Law Enforcement | 0 (0.0%) | 0 (0.0%) |
| Food Preparation & Serving | 0 (0.0%) | 50 (100.0%) |
| Cleaning & Maintenance | 0 (0.0%) | 0 (0.0%) |
| Personal Care & Service | 0 (0.0%) | 0 (0.0%) |
| Total (Category) | 0 (0.0%) | 50 (100.0%) |
| Total (Overall) | 471 (58.3%) | 337 (41.7%) |
Sales and Office Occupations
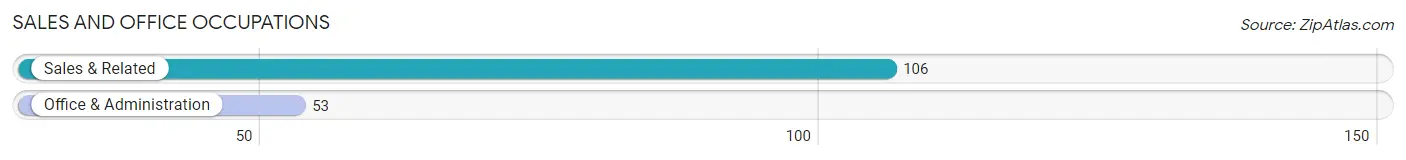
The most common Sales and Office occupations in Homosassa are Sales & Related (106 | 13.1%), and Office & Administration (53 | 6.6%).
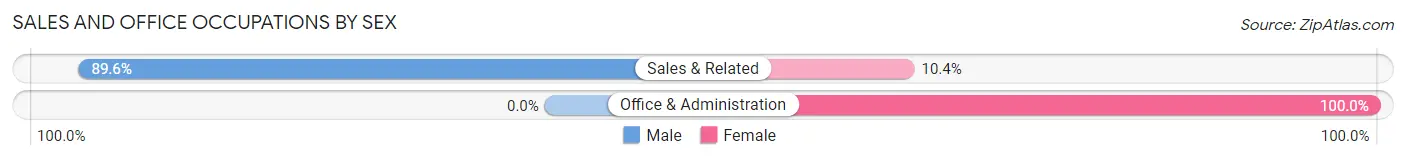
Sales and Office Occupations by Sex
| Occupation | Male | Female |
| Sales & Related | 95 (89.6%) | 11 (10.4%) |
| Office & Administration | 0 (0.0%) | 53 (100.0%) |
| Total (Category) | 95 (59.8%) | 64 (40.3%) |
| Total (Overall) | 471 (58.3%) | 337 (41.7%) |
Natural Resources, Construction and Maintenance Occupations
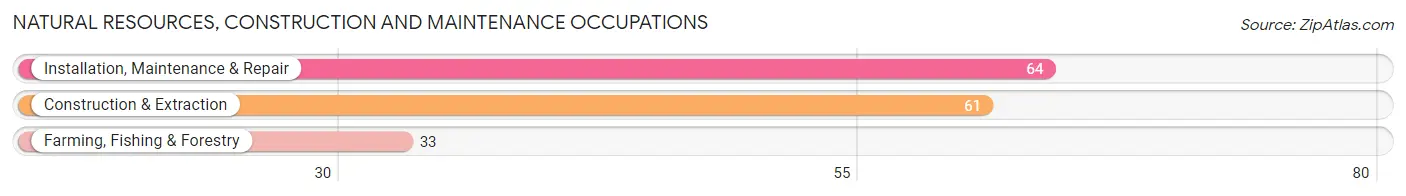
The most common Natural Resources, Construction and Maintenance occupations in Homosassa are Installation, Maintenance & Repair (64 | 7.9%), Construction & Extraction (61 | 7.5%), and Farming, Fishing & Forestry (33 | 4.1%).
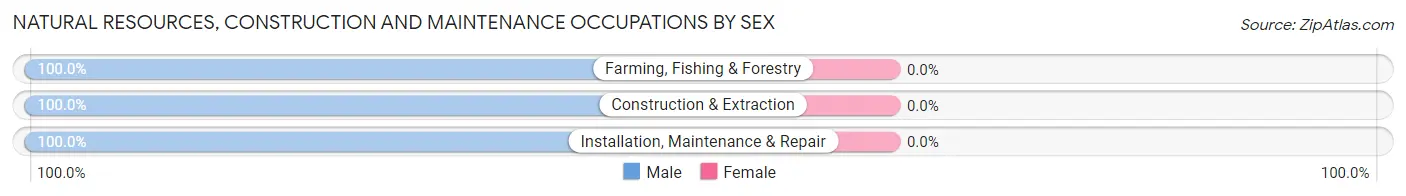
Natural Resources, Construction and Maintenance Occupations by Sex
| Occupation | Male | Female |
| Farming, Fishing & Forestry | 33 (100.0%) | 0 (0.0%) |
| Construction & Extraction | 61 (100.0%) | 0 (0.0%) |
| Installation, Maintenance & Repair | 64 (100.0%) | 0 (0.0%) |
| Total (Category) | 158 (100.0%) | 0 (0.0%) |
| Total (Overall) | 471 (58.3%) | 337 (41.7%) |
Production, Transportation and Moving Occupations
The most common Production, Transportation and Moving occupations in Homosassa are Material Moving (136 | 16.8%), and Transportation (35 | 4.3%).
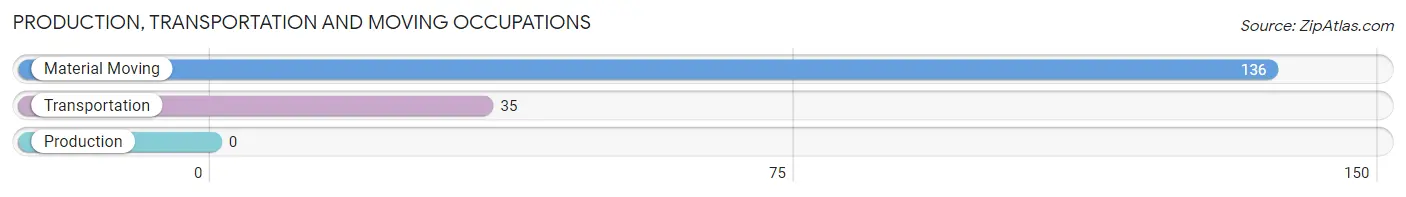
Production, Transportation and Moving Occupations by Sex
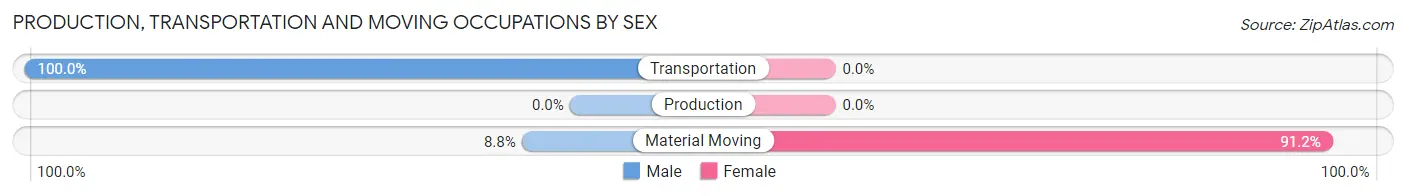
| Occupation | Male | Female |
| Production | 0 (0.0%) | 0 (0.0%) |
| Transportation | 35 (100.0%) | 0 (0.0%) |
| Material Moving | 12 (8.8%) | 124 (91.2%) |
| Total (Category) | 47 (27.5%) | 124 (72.5%) |
| Total (Overall) | 471 (58.3%) | 337 (41.7%) |
Employment Industries by Sex in Homosassa
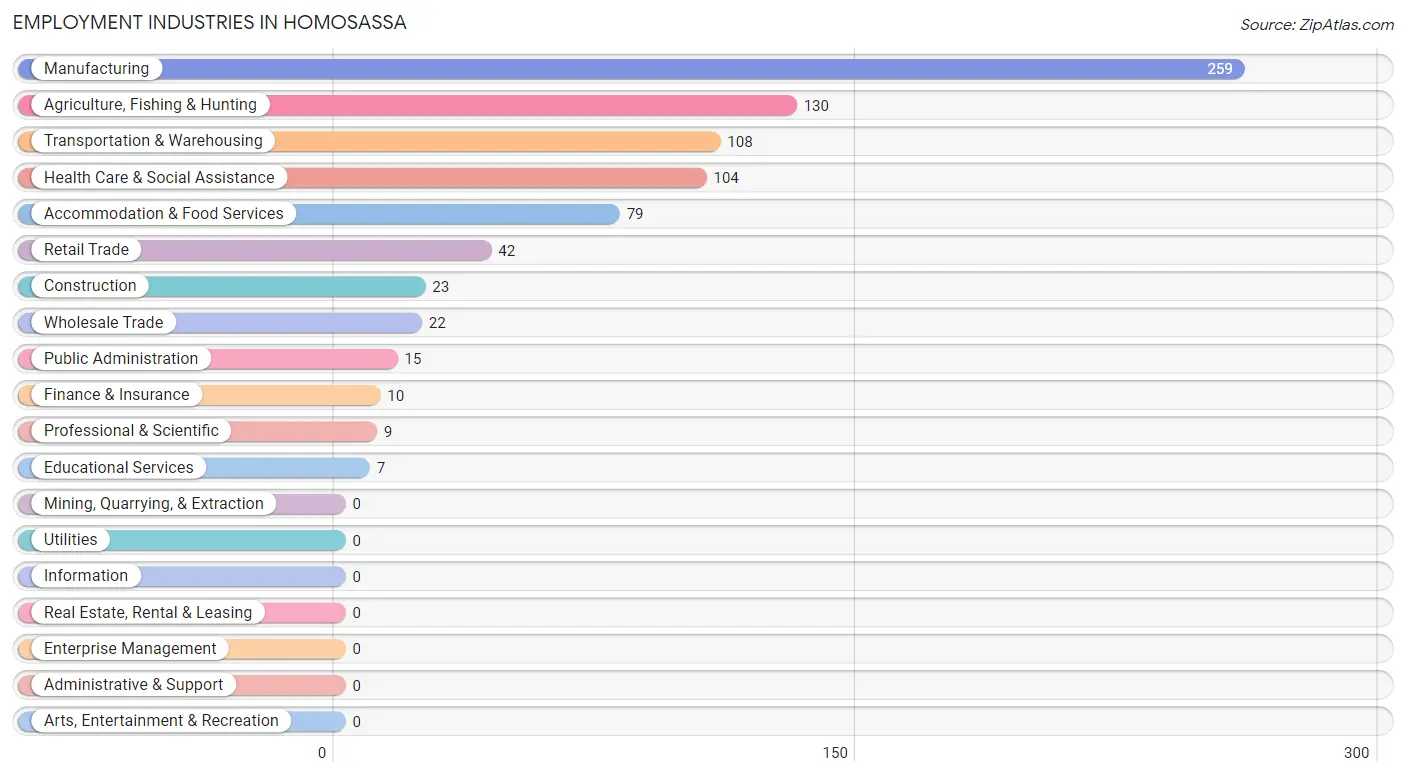
Employment Industries in Homosassa
The major employment industries in Homosassa include Manufacturing (259 | 32.1%), Agriculture, Fishing & Hunting (130 | 16.1%), Transportation & Warehousing (108 | 13.4%), Health Care & Social Assistance (104 | 12.9%), and Accommodation & Food Services (79 | 9.8%).
Employment Industries by Sex in Homosassa
The Homosassa industries that see more men than women are Agriculture, Fishing & Hunting (100.0%), Wholesale Trade (100.0%), and Transportation & Warehousing (100.0%), whereas the industries that tend to have a higher number of women are Professional & Scientific (100.0%), Educational Services (100.0%), and Accommodation & Food Services (100.0%).
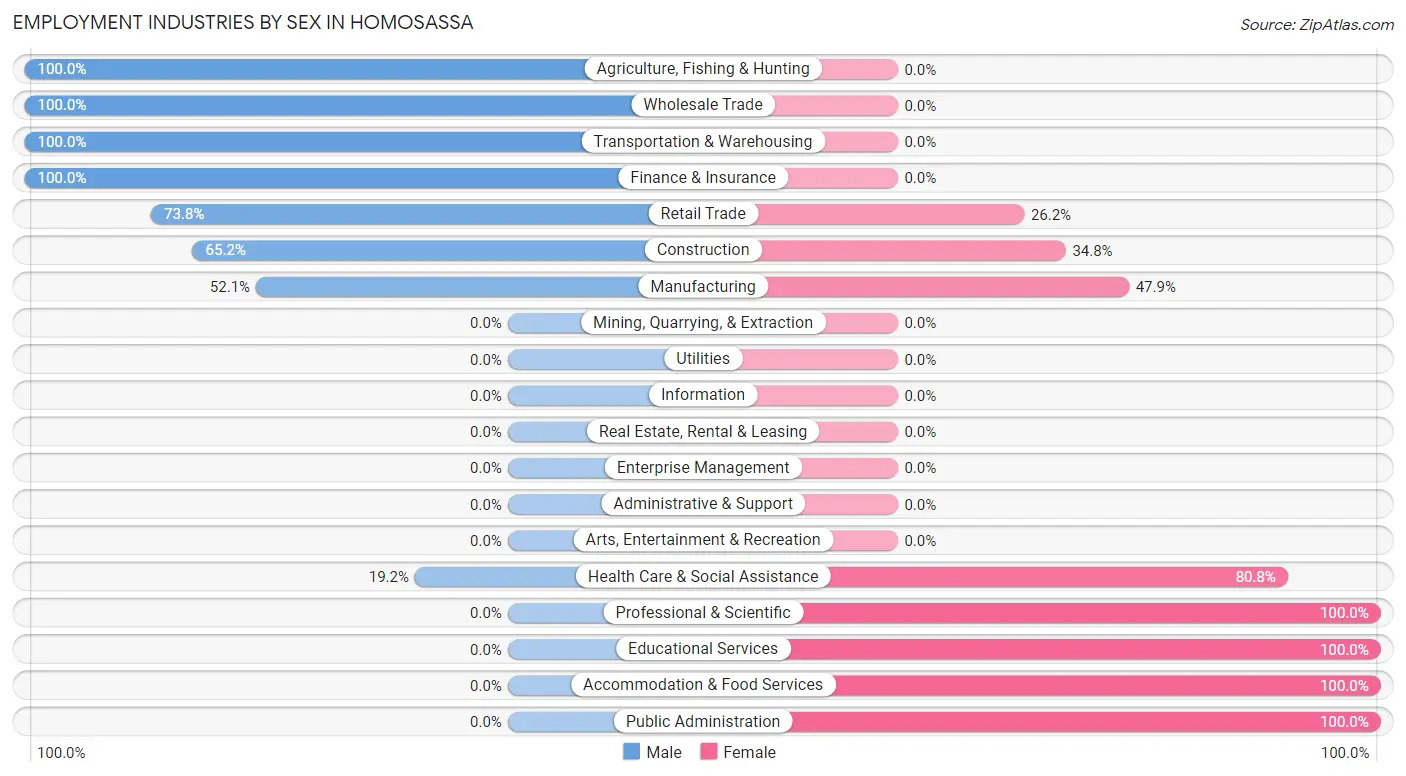
| Industry | Male | Female |
| Agriculture, Fishing & Hunting | 130 (100.0%) | 0 (0.0%) |
| Mining, Quarrying, & Extraction | 0 (0.0%) | 0 (0.0%) |
| Construction | 15 (65.2%) | 8 (34.8%) |
| Manufacturing | 135 (52.1%) | 124 (47.9%) |
| Wholesale Trade | 22 (100.0%) | 0 (0.0%) |
| Retail Trade | 31 (73.8%) | 11 (26.2%) |
| Transportation & Warehousing | 108 (100.0%) | 0 (0.0%) |
| Utilities | 0 (0.0%) | 0 (0.0%) |
| Information | 0 (0.0%) | 0 (0.0%) |
| Finance & Insurance | 10 (100.0%) | 0 (0.0%) |
| Real Estate, Rental & Leasing | 0 (0.0%) | 0 (0.0%) |
| Professional & Scientific | 0 (0.0%) | 9 (100.0%) |
| Enterprise Management | 0 (0.0%) | 0 (0.0%) |
| Administrative & Support | 0 (0.0%) | 0 (0.0%) |
| Educational Services | 0 (0.0%) | 7 (100.0%) |
| Health Care & Social Assistance | 20 (19.2%) | 84 (80.8%) |
| Arts, Entertainment & Recreation | 0 (0.0%) | 0 (0.0%) |
| Accommodation & Food Services | 0 (0.0%) | 79 (100.0%) |
| Public Administration | 0 (0.0%) | 15 (100.0%) |
| Total | 471 (58.3%) | 337 (41.7%) |
Education in Homosassa
School Enrollment in Homosassa
The most common levels of schooling among the 197 students in Homosassa are high school (130 | 66.0%), and college / undergraduate (67 | 34.0%).
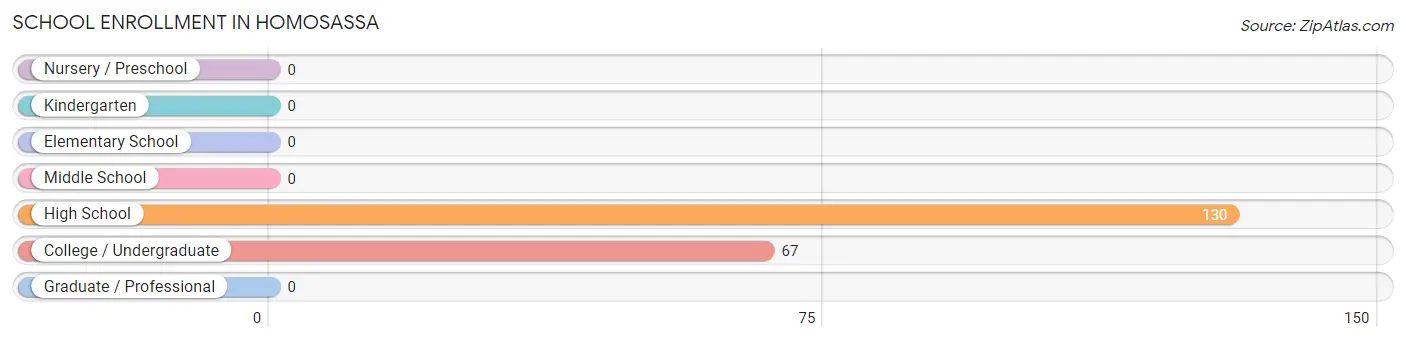
| School Level | # Students | % Students |
| Nursery / Preschool | 0 | 0.0% |
| Kindergarten | 0 | 0.0% |
| Elementary School | 0 | 0.0% |
| Middle School | 0 | 0.0% |
| High School | 130 | 66.0% |
| College / Undergraduate | 67 | 34.0% |
| Graduate / Professional | 0 | 0.0% |
| Total | 197 | 100.0% |
School Enrollment by Age by Funding Source in Homosassa
Out of a total of 197 students who are enrolled in schools in Homosassa, 114 (57.9%) attend a private institution, while the remaining 83 (42.1%) are enrolled in public schools. The age group of 15 to 17 year olds has the highest likelihood of being enrolled in private schools, with 114 (100.0% in the age bracket) enrolled. Conversely, the age group of 18 to 19 year olds has the lowest likelihood of being enrolled in a private school, with 50 (100.0% in the age bracket) attending a public institution.
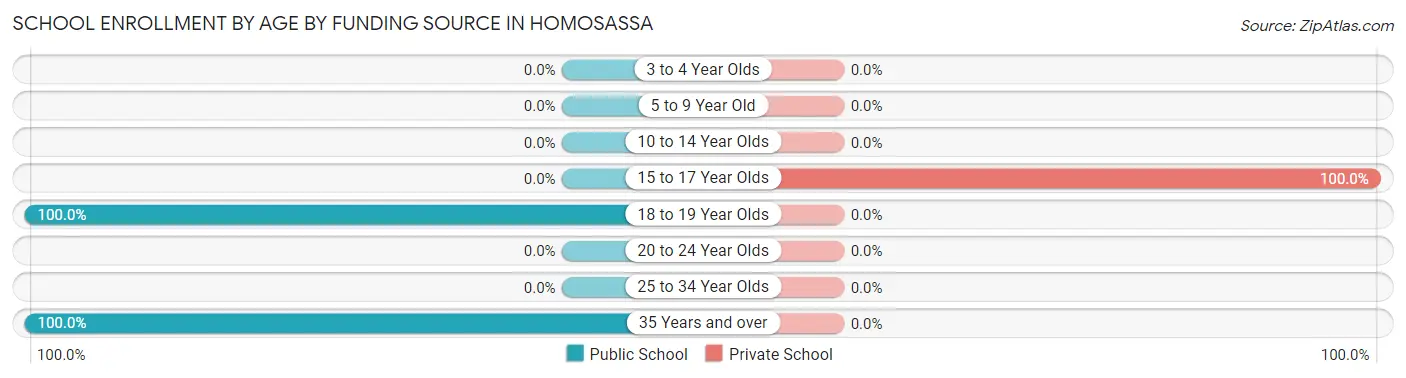
| Age Bracket | Public School | Private School |
| 3 to 4 Year Olds | 0 (0.0%) | 0 (0.0%) |
| 5 to 9 Year Old | 0 (0.0%) | 0 (0.0%) |
| 10 to 14 Year Olds | 0 (0.0%) | 0 (0.0%) |
| 15 to 17 Year Olds | 0 (0.0%) | 114 (100.0%) |
| 18 to 19 Year Olds | 50 (100.0%) | 0 (0.0%) |
| 20 to 24 Year Olds | 0 (0.0%) | 0 (0.0%) |
| 25 to 34 Year Olds | 0 (0.0%) | 0 (0.0%) |
| 35 Years and over | 33 (100.0%) | 0 (0.0%) |
| Total | 83 (42.1%) | 114 (57.9%) |
Educational Attainment by Field of Study in Homosassa
Bio, nature & agricultural (113 | 20.1%), business (103 | 18.4%), engineering (95 | 16.9%), literature & languages (79 | 14.1%), and arts & humanities (72 | 12.8%) are the most common fields of study among 561 individuals in Homosassa who have obtained a bachelor's degree or higher.
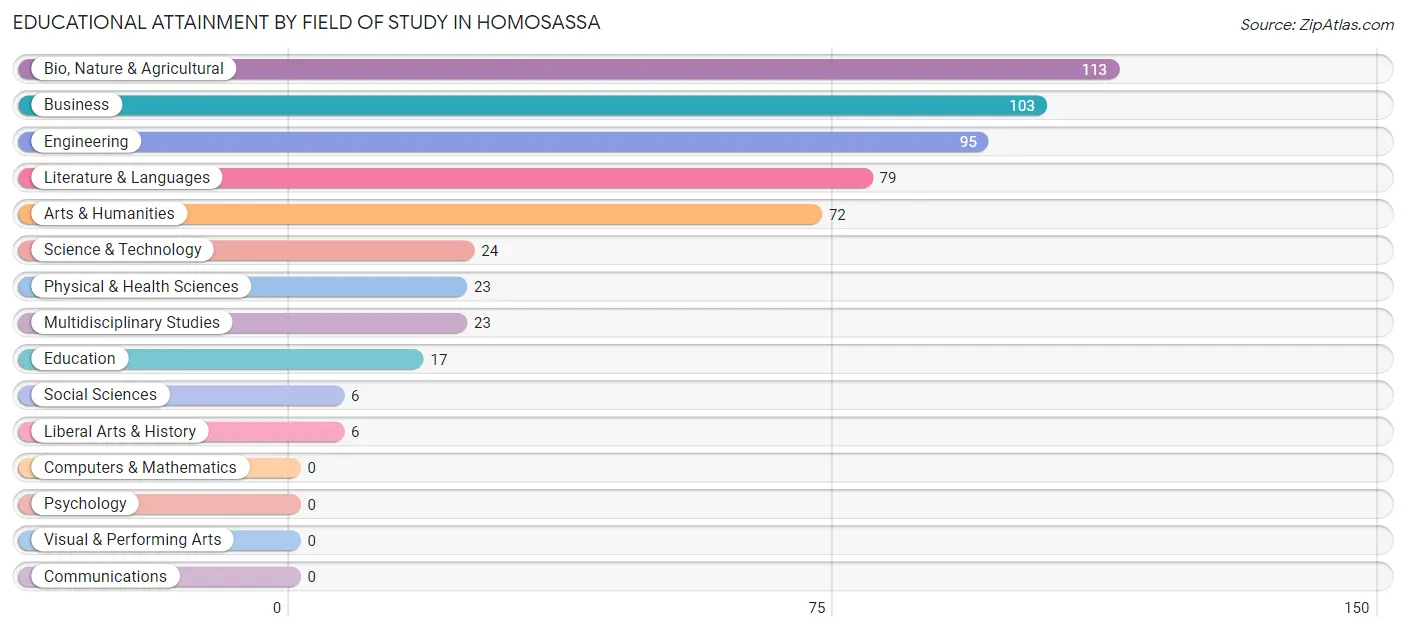
| Field of Study | # Graduates | % Graduates |
| Computers & Mathematics | 0 | 0.0% |
| Bio, Nature & Agricultural | 113 | 20.1% |
| Physical & Health Sciences | 23 | 4.1% |
| Psychology | 0 | 0.0% |
| Social Sciences | 6 | 1.1% |
| Engineering | 95 | 16.9% |
| Multidisciplinary Studies | 23 | 4.1% |
| Science & Technology | 24 | 4.3% |
| Business | 103 | 18.4% |
| Education | 17 | 3.0% |
| Literature & Languages | 79 | 14.1% |
| Liberal Arts & History | 6 | 1.1% |
| Visual & Performing Arts | 0 | 0.0% |
| Communications | 0 | 0.0% |
| Arts & Humanities | 72 | 12.8% |
| Total | 561 | 100.0% |
Transportation & Commute in Homosassa
Vehicle Availability by Sex in Homosassa
The most prevalent vehicle ownership categories in Homosassa are males with 2 vehicles (262, accounting for 61.7%) and females with 2 vehicles (174, making up 77.7%).
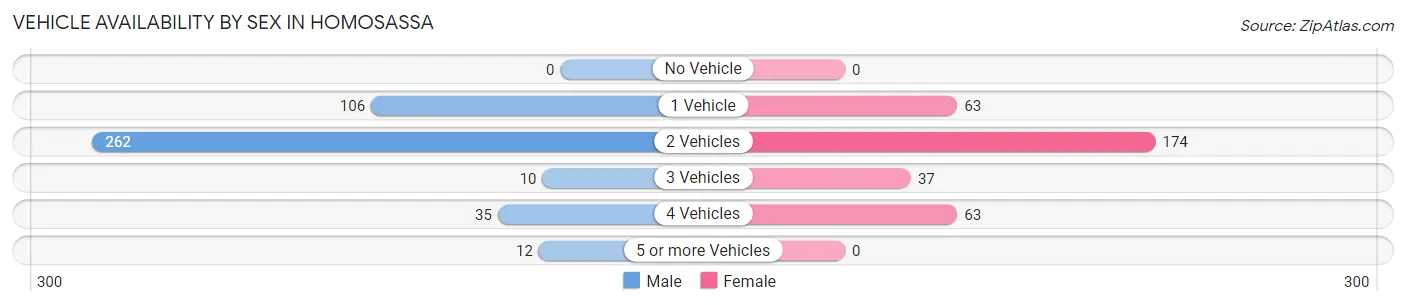
| Vehicles Available | Male | Female |
| No Vehicle | 0 (0.0%) | 0 (0.0%) |
| 1 Vehicle | 106 (24.9%) | 63 (18.7%) |
| 2 Vehicles | 262 (61.7%) | 174 (51.6%) |
| 3 Vehicles | 10 (2.4%) | 37 (11.0%) |
| 4 Vehicles | 35 (8.2%) | 63 (18.7%) |
| 5 or more Vehicles | 12 (2.8%) | 0 (0.0%) |
| Total | 425 (100.0%) | 337 (100.0%) |
Commute Time in Homosassa
The most frequently occuring commute durations in Homosassa are 5 to 9 minutes (244 commuters, 36.5%), 45 to 59 minutes (123 commuters, 18.4%), and 20 to 24 minutes (98 commuters, 14.7%).
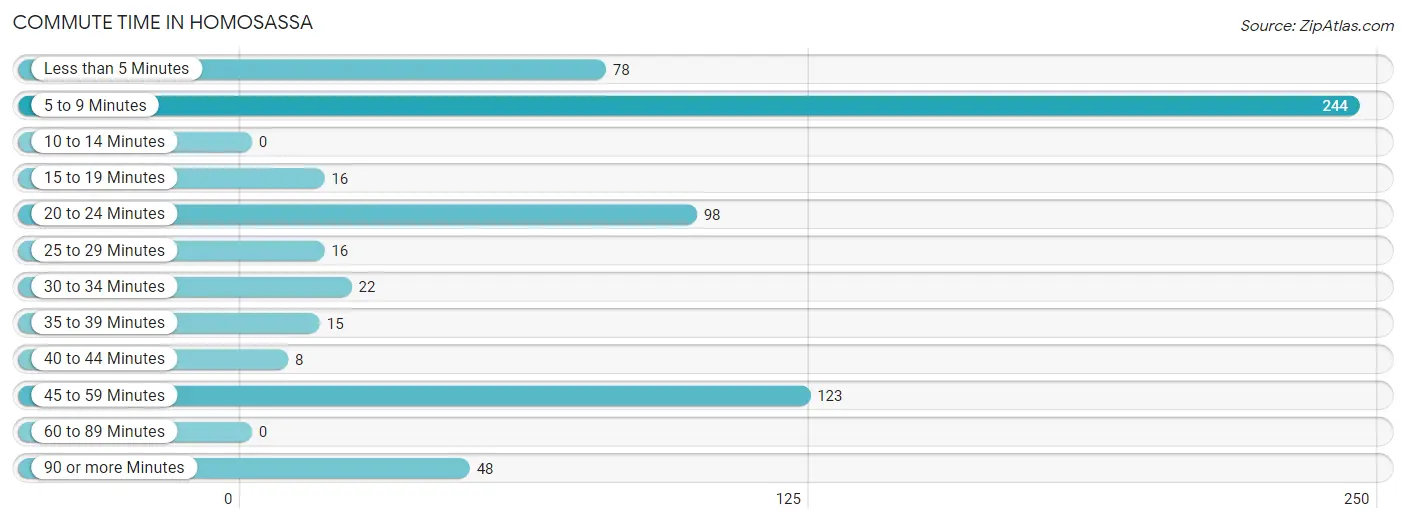
| Commute Time | # Commuters | % Commuters |
| Less than 5 Minutes | 78 | 11.7% |
| 5 to 9 Minutes | 244 | 36.5% |
| 10 to 14 Minutes | 0 | 0.0% |
| 15 to 19 Minutes | 16 | 2.4% |
| 20 to 24 Minutes | 98 | 14.7% |
| 25 to 29 Minutes | 16 | 2.4% |
| 30 to 34 Minutes | 22 | 3.3% |
| 35 to 39 Minutes | 15 | 2.2% |
| 40 to 44 Minutes | 8 | 1.2% |
| 45 to 59 Minutes | 123 | 18.4% |
| 60 to 89 Minutes | 0 | 0.0% |
| 90 or more Minutes | 48 | 7.2% |
Commute Time by Sex in Homosassa
The most common commute times in Homosassa are 5 to 9 minutes (109 commuters, 30.9%) for males and 5 to 9 minutes (135 commuters, 42.9%) for females.
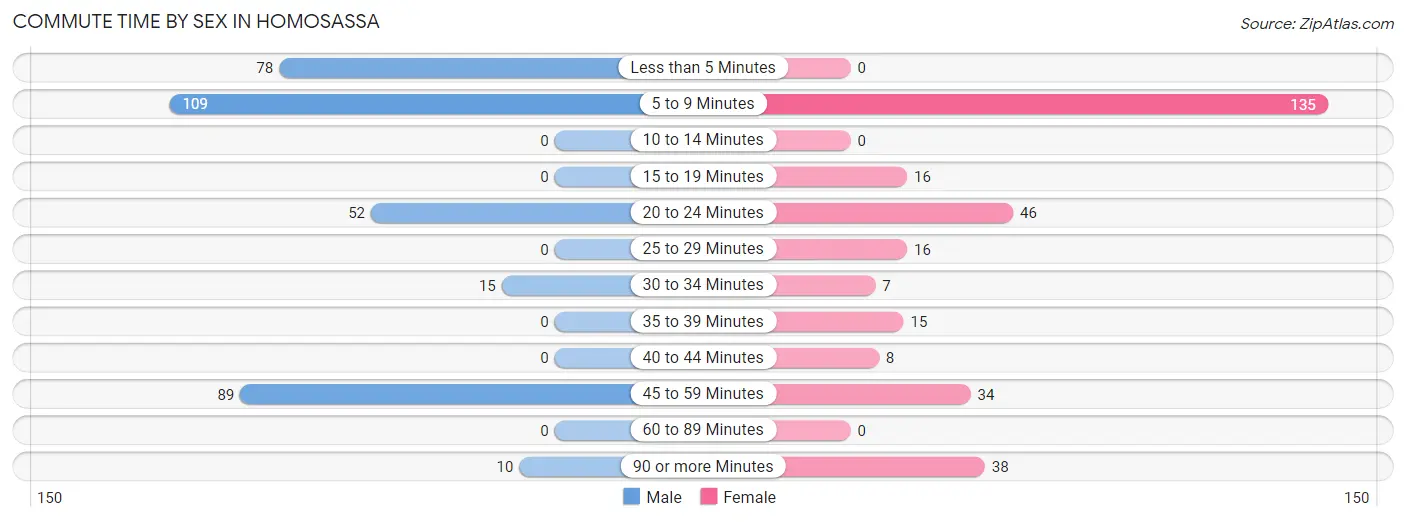
| Commute Time | Male | Female |
| Less than 5 Minutes | 78 (22.1%) | 0 (0.0%) |
| 5 to 9 Minutes | 109 (30.9%) | 135 (42.9%) |
| 10 to 14 Minutes | 0 (0.0%) | 0 (0.0%) |
| 15 to 19 Minutes | 0 (0.0%) | 16 (5.1%) |
| 20 to 24 Minutes | 52 (14.7%) | 46 (14.6%) |
| 25 to 29 Minutes | 0 (0.0%) | 16 (5.1%) |
| 30 to 34 Minutes | 15 (4.3%) | 7 (2.2%) |
| 35 to 39 Minutes | 0 (0.0%) | 15 (4.8%) |
| 40 to 44 Minutes | 0 (0.0%) | 8 (2.5%) |
| 45 to 59 Minutes | 89 (25.2%) | 34 (10.8%) |
| 60 to 89 Minutes | 0 (0.0%) | 0 (0.0%) |
| 90 or more Minutes | 10 (2.8%) | 38 (12.1%) |
Time of Departure to Work by Sex in Homosassa
The most frequent times of departure to work in Homosassa are 8:30 AM to 8:59 AM (66, 18.7%) for males and 7:30 AM to 7:59 AM (133, 42.2%) for females.
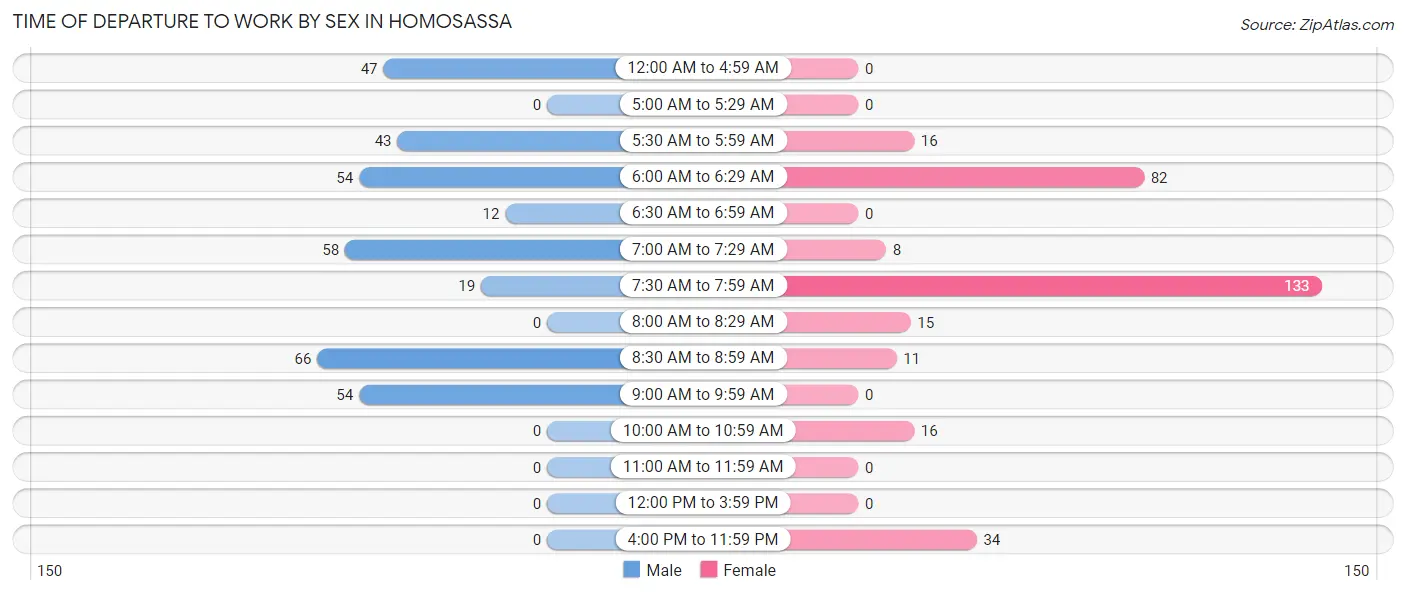
| Time of Departure | Male | Female |
| 12:00 AM to 4:59 AM | 47 (13.3%) | 0 (0.0%) |
| 5:00 AM to 5:29 AM | 0 (0.0%) | 0 (0.0%) |
| 5:30 AM to 5:59 AM | 43 (12.2%) | 16 (5.1%) |
| 6:00 AM to 6:29 AM | 54 (15.3%) | 82 (26.0%) |
| 6:30 AM to 6:59 AM | 12 (3.4%) | 0 (0.0%) |
| 7:00 AM to 7:29 AM | 58 (16.4%) | 8 (2.5%) |
| 7:30 AM to 7:59 AM | 19 (5.4%) | 133 (42.2%) |
| 8:00 AM to 8:29 AM | 0 (0.0%) | 15 (4.8%) |
| 8:30 AM to 8:59 AM | 66 (18.7%) | 11 (3.5%) |
| 9:00 AM to 9:59 AM | 54 (15.3%) | 0 (0.0%) |
| 10:00 AM to 10:59 AM | 0 (0.0%) | 16 (5.1%) |
| 11:00 AM to 11:59 AM | 0 (0.0%) | 0 (0.0%) |
| 12:00 PM to 3:59 PM | 0 (0.0%) | 0 (0.0%) |
| 4:00 PM to 11:59 PM | 0 (0.0%) | 34 (10.8%) |
| Total | 353 (100.0%) | 315 (100.0%) |
Housing Occupancy in Homosassa
Occupancy by Ownership in Homosassa
Of the total 1,163 dwellings in Homosassa, owner-occupied units account for 1,072 (92.2%), while renter-occupied units make up 91 (7.8%).
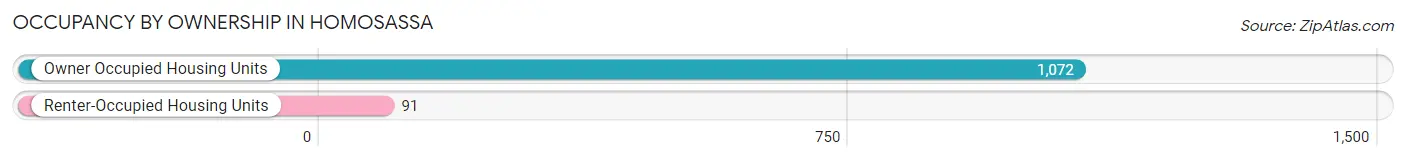
| Occupancy | # Housing Units | % Housing Units |
| Owner Occupied Housing Units | 1,072 | 92.2% |
| Renter-Occupied Housing Units | 91 | 7.8% |
| Total Occupied Housing Units | 1,163 | 100.0% |
Occupancy by Household Size in Homosassa
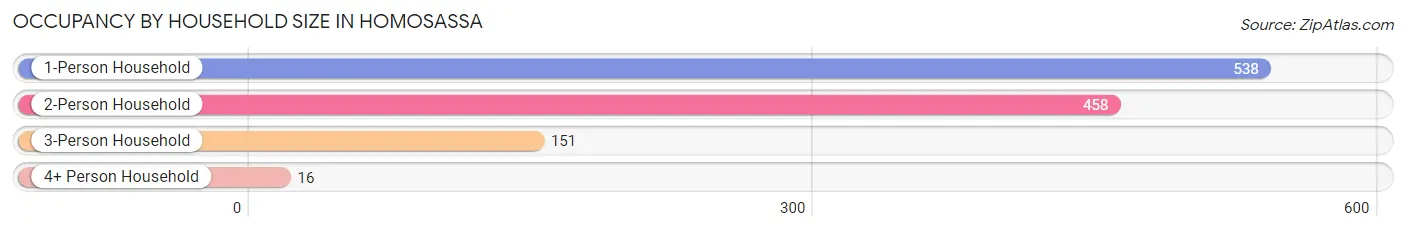
| Household Size | # Housing Units | % Housing Units |
| 1-Person Household | 538 | 46.3% |
| 2-Person Household | 458 | 39.4% |
| 3-Person Household | 151 | 13.0% |
| 4+ Person Household | 16 | 1.4% |
| Total Housing Units | 1,163 | 100.0% |
Occupancy by Ownership by Household Size in Homosassa
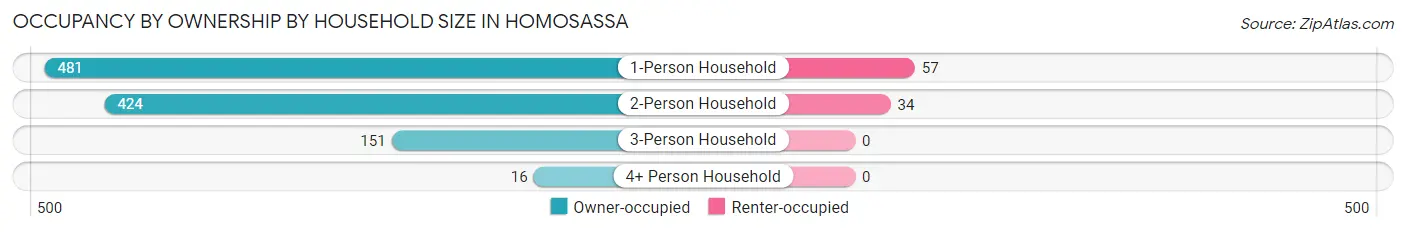
| Household Size | Owner-occupied | Renter-occupied |
| 1-Person Household | 481 (89.4%) | 57 (10.6%) |
| 2-Person Household | 424 (92.6%) | 34 (7.4%) |
| 3-Person Household | 151 (100.0%) | 0 (0.0%) |
| 4+ Person Household | 16 (100.0%) | 0 (0.0%) |
| Total Housing Units | 1,072 (92.2%) | 91 (7.8%) |
Occupancy by Educational Attainment in Homosassa
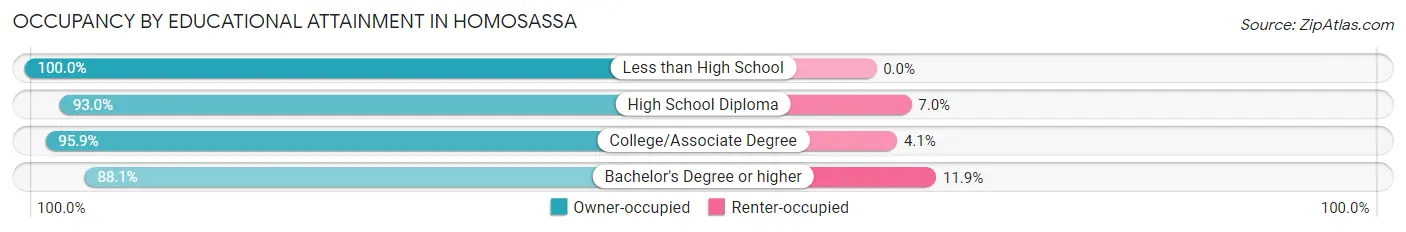
| Household Size | Owner-occupied | Renter-occupied |
| Less than High School | 37 (100.0%) | 0 (0.0%) |
| High School Diploma | 453 (93.0%) | 34 (7.0%) |
| College/Associate Degree | 233 (95.9%) | 10 (4.1%) |
| Bachelor's Degree or higher | 349 (88.1%) | 47 (11.9%) |
Occupancy by Age of Householder in Homosassa
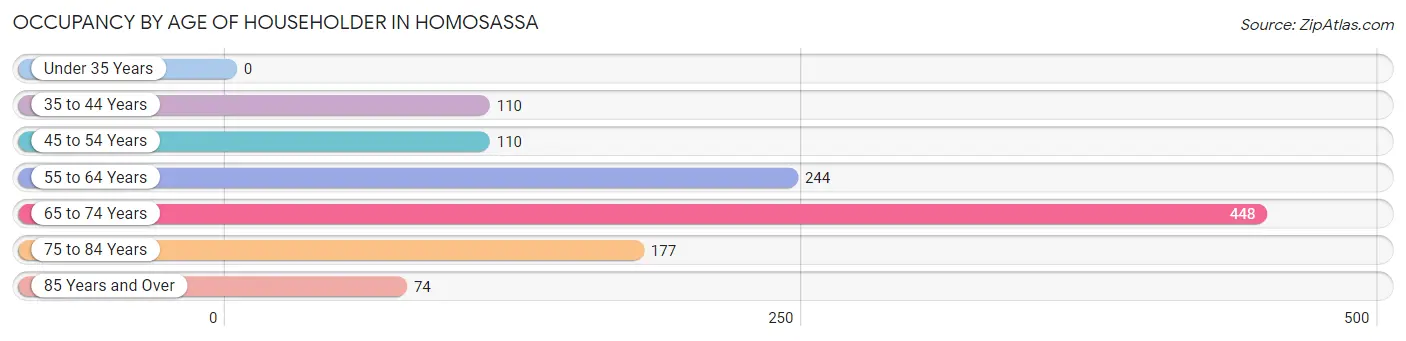
| Age Bracket | # Households | % Households |
| Under 35 Years | 0 | 0.0% |
| 35 to 44 Years | 110 | 9.5% |
| 45 to 54 Years | 110 | 9.5% |
| 55 to 64 Years | 244 | 21.0% |
| 65 to 74 Years | 448 | 38.5% |
| 75 to 84 Years | 177 | 15.2% |
| 85 Years and Over | 74 | 6.4% |
| Total | 1,163 | 100.0% |
Housing Finances in Homosassa
Median Income by Occupancy in Homosassa
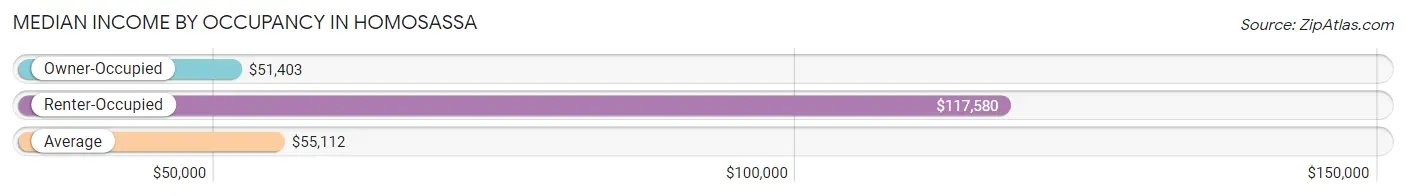
| Occupancy Type | # Households | Median Income |
| Owner-Occupied | 1,072 (92.2%) | $51,403 |
| Renter-Occupied | 91 (7.8%) | $117,580 |
| Average | 1,163 (100.0%) | $55,112 |
Occupancy by Householder Income Bracket in Homosassa
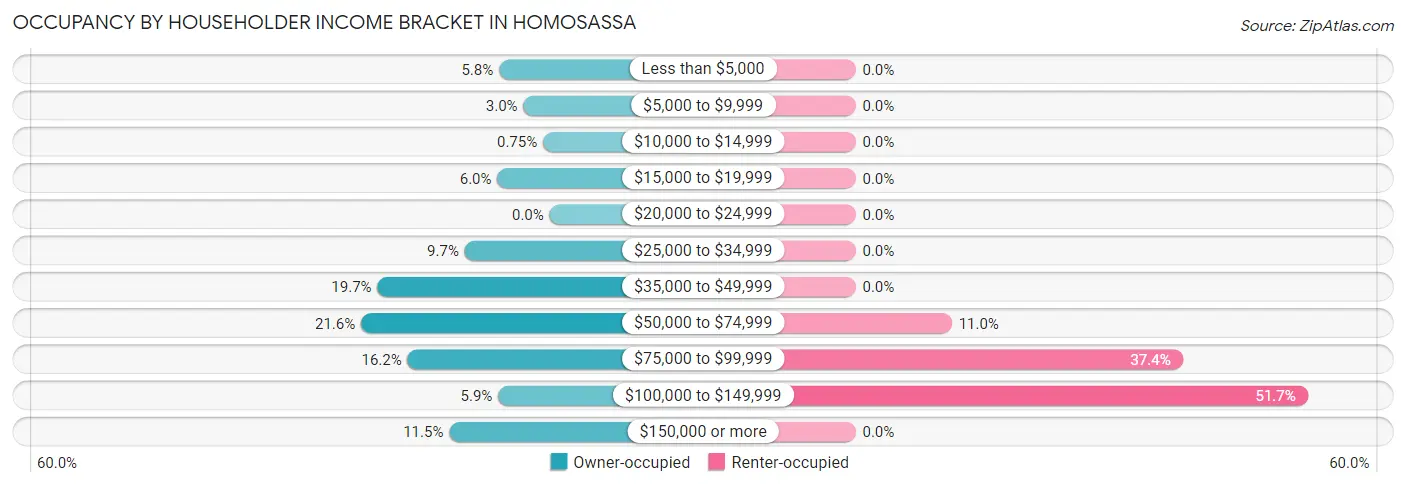
| Income Bracket | Owner-occupied | Renter-occupied |
| Less than $5,000 | 62 (5.8%) | 0 (0.0%) |
| $5,000 to $9,999 | 32 (3.0%) | 0 (0.0%) |
| $10,000 to $14,999 | 8 (0.7%) | 0 (0.0%) |
| $15,000 to $19,999 | 64 (6.0%) | 0 (0.0%) |
| $20,000 to $24,999 | 0 (0.0%) | 0 (0.0%) |
| $25,000 to $34,999 | 104 (9.7%) | 0 (0.0%) |
| $35,000 to $49,999 | 211 (19.7%) | 0 (0.0%) |
| $50,000 to $74,999 | 231 (21.5%) | 10 (11.0%) |
| $75,000 to $99,999 | 174 (16.2%) | 34 (37.4%) |
| $100,000 to $149,999 | 63 (5.9%) | 47 (51.6%) |
| $150,000 or more | 123 (11.5%) | 0 (0.0%) |
| Total | 1,072 (100.0%) | 91 (100.0%) |
Monthly Housing Cost Tiers in Homosassa
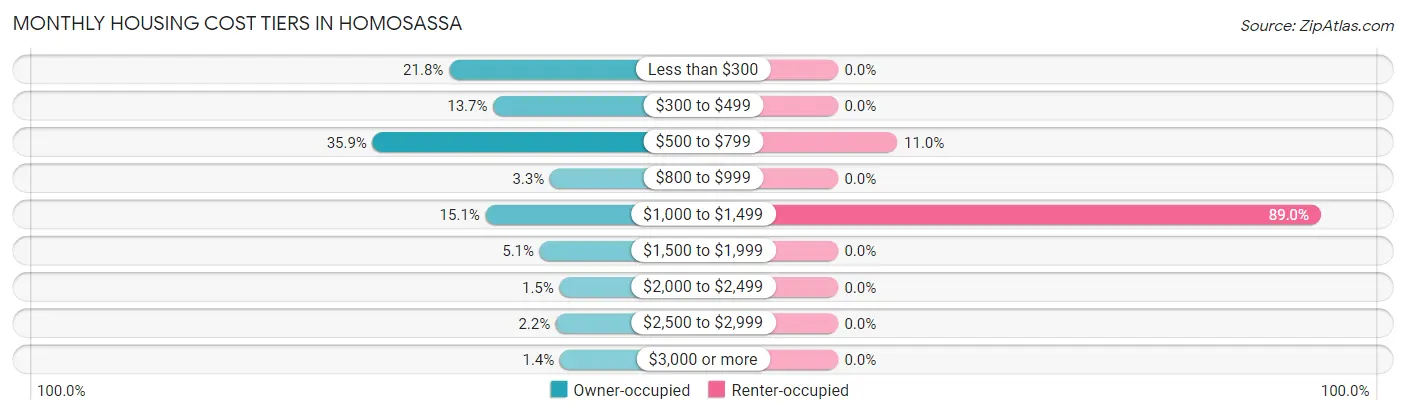
| Monthly Cost | Owner-occupied | Renter-occupied |
| Less than $300 | 234 (21.8%) | 0 (0.0%) |
| $300 to $499 | 147 (13.7%) | 0 (0.0%) |
| $500 to $799 | 385 (35.9%) | 10 (11.0%) |
| $800 to $999 | 35 (3.3%) | 0 (0.0%) |
| $1,000 to $1,499 | 162 (15.1%) | 81 (89.0%) |
| $1,500 to $1,999 | 55 (5.1%) | 0 (0.0%) |
| $2,000 to $2,499 | 16 (1.5%) | 0 (0.0%) |
| $2,500 to $2,999 | 23 (2.1%) | 0 (0.0%) |
| $3,000 or more | 15 (1.4%) | 0 (0.0%) |
| Total | 1,072 (100.0%) | 91 (100.0%) |
Physical Housing Characteristics in Homosassa
Housing Structures in Homosassa
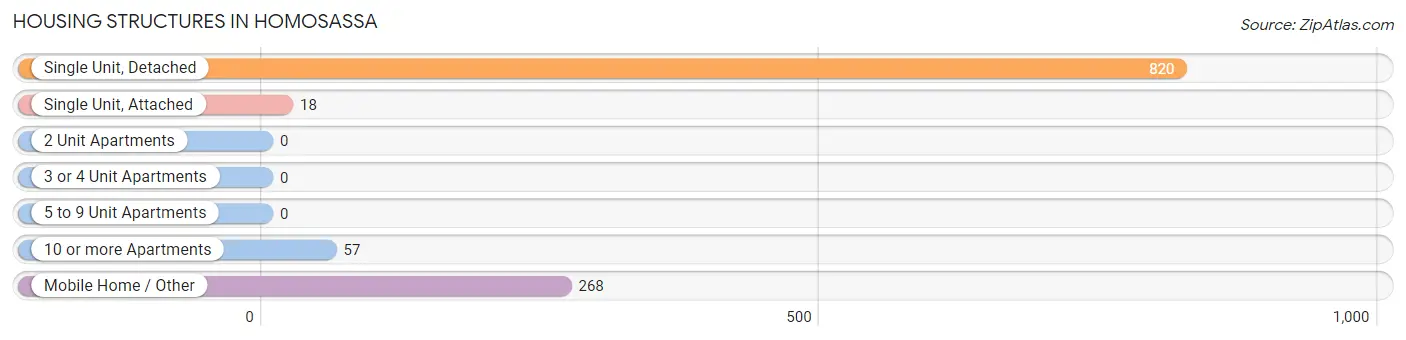
| Structure Type | # Housing Units | % Housing Units |
| Single Unit, Detached | 820 | 70.5% |
| Single Unit, Attached | 18 | 1.5% |
| 2 Unit Apartments | 0 | 0.0% |
| 3 or 4 Unit Apartments | 0 | 0.0% |
| 5 to 9 Unit Apartments | 0 | 0.0% |
| 10 or more Apartments | 57 | 4.9% |
| Mobile Home / Other | 268 | 23.0% |
| Total | 1,163 | 100.0% |
Housing Structures by Occupancy in Homosassa
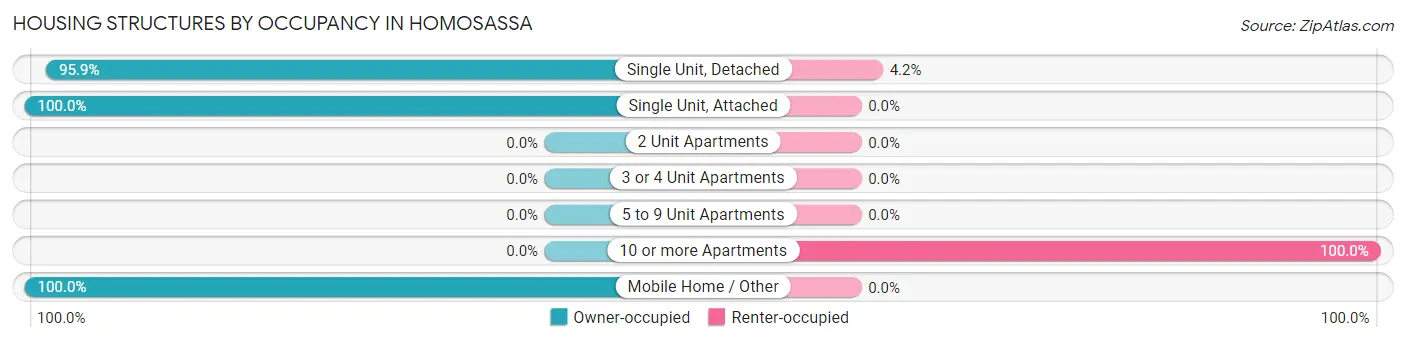
| Structure Type | Owner-occupied | Renter-occupied |
| Single Unit, Detached | 786 (95.9%) | 34 (4.2%) |
| Single Unit, Attached | 18 (100.0%) | 0 (0.0%) |
| 2 Unit Apartments | 0 (0.0%) | 0 (0.0%) |
| 3 or 4 Unit Apartments | 0 (0.0%) | 0 (0.0%) |
| 5 to 9 Unit Apartments | 0 (0.0%) | 0 (0.0%) |
| 10 or more Apartments | 0 (0.0%) | 57 (100.0%) |
| Mobile Home / Other | 268 (100.0%) | 0 (0.0%) |
| Total | 1,072 (92.2%) | 91 (7.8%) |
Housing Structures by Number of Rooms in Homosassa
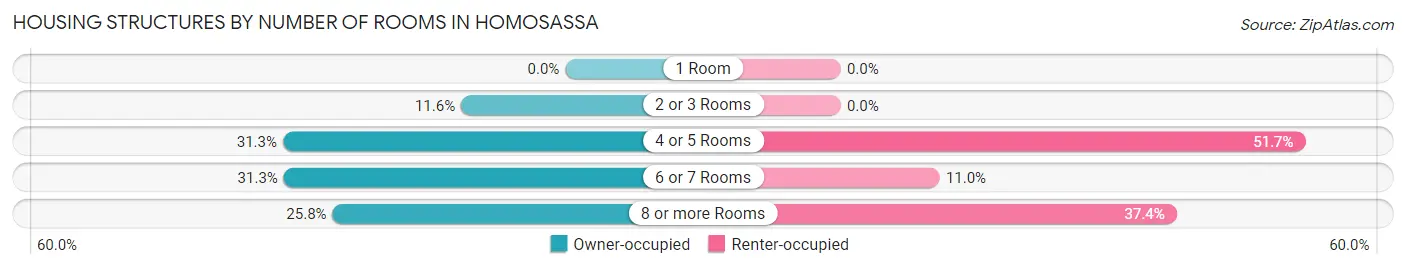
| Number of Rooms | Owner-occupied | Renter-occupied |
| 1 Room | 0 (0.0%) | 0 (0.0%) |
| 2 or 3 Rooms | 124 (11.6%) | 0 (0.0%) |
| 4 or 5 Rooms | 336 (31.3%) | 47 (51.6%) |
| 6 or 7 Rooms | 335 (31.2%) | 10 (11.0%) |
| 8 or more Rooms | 277 (25.8%) | 34 (37.4%) |
| Total | 1,072 (100.0%) | 91 (100.0%) |
Housing Structure by Heating Type in Homosassa
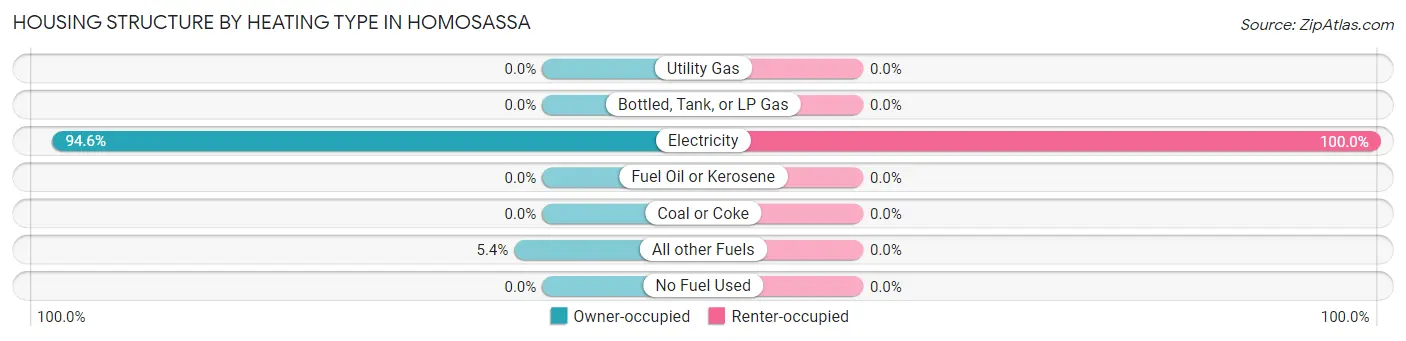
| Heating Type | Owner-occupied | Renter-occupied |
| Utility Gas | 0 (0.0%) | 0 (0.0%) |
| Bottled, Tank, or LP Gas | 0 (0.0%) | 0 (0.0%) |
| Electricity | 1,014 (94.6%) | 91 (100.0%) |
| Fuel Oil or Kerosene | 0 (0.0%) | 0 (0.0%) |
| Coal or Coke | 0 (0.0%) | 0 (0.0%) |
| All other Fuels | 58 (5.4%) | 0 (0.0%) |
| No Fuel Used | 0 (0.0%) | 0 (0.0%) |
| Total | 1,072 (100.0%) | 91 (100.0%) |
Household Vehicle Usage in Homosassa
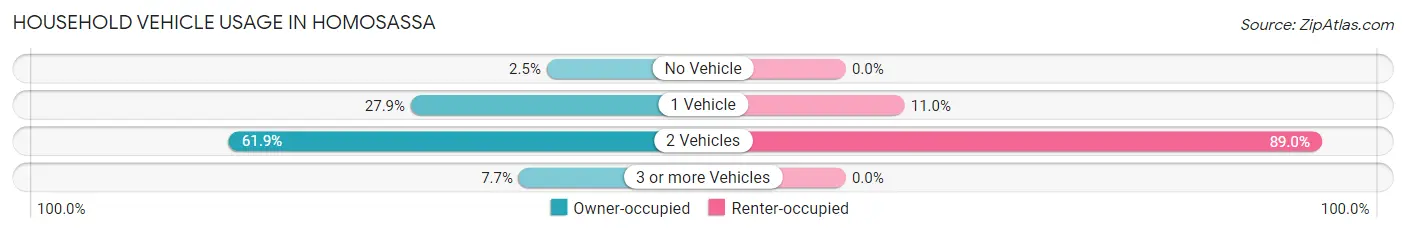
| Vehicles per Household | Owner-occupied | Renter-occupied |
| No Vehicle | 27 (2.5%) | 0 (0.0%) |
| 1 Vehicle | 299 (27.9%) | 10 (11.0%) |
| 2 Vehicles | 663 (61.9%) | 81 (89.0%) |
| 3 or more Vehicles | 83 (7.7%) | 0 (0.0%) |
| Total | 1,072 (100.0%) | 91 (100.0%) |
Real Estate & Mortgages in Homosassa
Real Estate and Mortgage Overview in Homosassa
| Characteristic | Without Mortgage | With Mortgage |
| Housing Units | 877 | 195 |
| Median Property Value | $209,400 | $348,300 |
| Median Household Income | $50,982 | $39 |
| Monthly Housing Costs | $537 | $15 |
| Real Estate Taxes | $1,294 | $0 |
Property Value by Mortgage Status in Homosassa
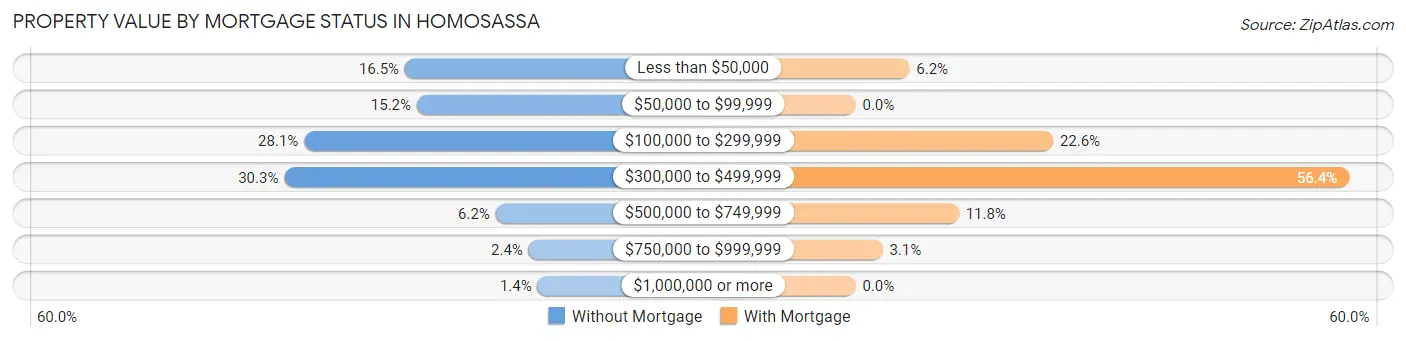
| Property Value | Without Mortgage | With Mortgage |
| Less than $50,000 | 145 (16.5%) | 12 (6.1%) |
| $50,000 to $99,999 | 133 (15.2%) | 0 (0.0%) |
| $100,000 to $299,999 | 246 (28.1%) | 44 (22.6%) |
| $300,000 to $499,999 | 266 (30.3%) | 110 (56.4%) |
| $500,000 to $749,999 | 54 (6.2%) | 23 (11.8%) |
| $750,000 to $999,999 | 21 (2.4%) | 6 (3.1%) |
| $1,000,000 or more | 12 (1.4%) | 0 (0.0%) |
| Total | 877 (100.0%) | 195 (100.0%) |
Household Income by Mortgage Status in Homosassa
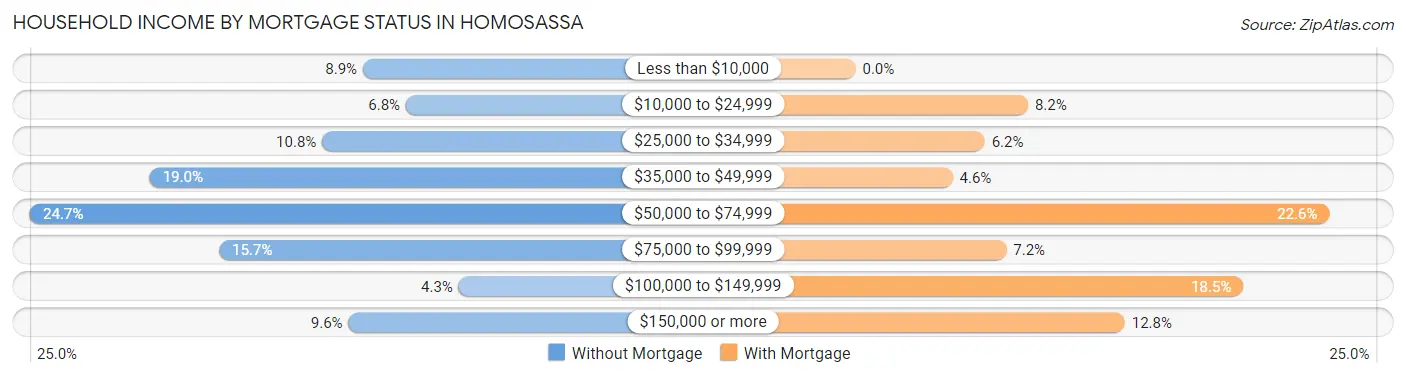
| Household Income | Without Mortgage | With Mortgage |
| Less than $10,000 | 78 (8.9%) | 0 (0.0%) |
| $10,000 to $24,999 | 60 (6.8%) | 16 (8.2%) |
| $25,000 to $34,999 | 95 (10.8%) | 12 (6.1%) |
| $35,000 to $49,999 | 167 (19.0%) | 9 (4.6%) |
| $50,000 to $74,999 | 217 (24.7%) | 44 (22.6%) |
| $75,000 to $99,999 | 138 (15.7%) | 14 (7.2%) |
| $100,000 to $149,999 | 38 (4.3%) | 36 (18.5%) |
| $150,000 or more | 84 (9.6%) | 25 (12.8%) |
| Total | 877 (100.0%) | 195 (100.0%) |
Property Value to Household Income Ratio in Homosassa
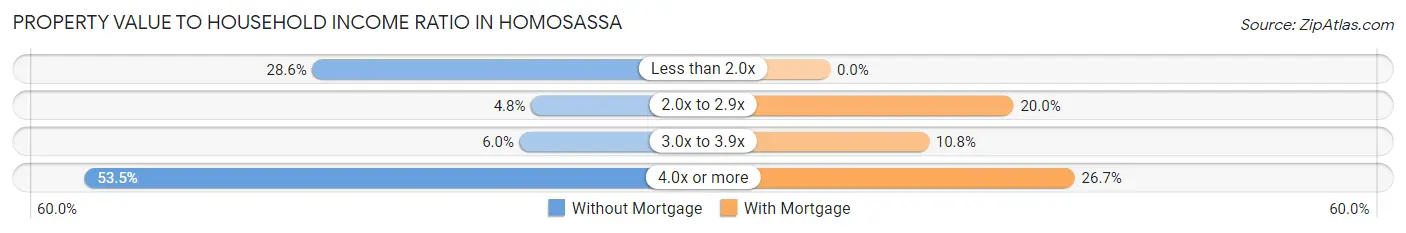
| Value-to-Income Ratio | Without Mortgage | With Mortgage |
| Less than 2.0x | 251 (28.6%) | 0 (0.0%) |
| 2.0x to 2.9x | 42 (4.8%) | 39 (20.0%) |
| 3.0x to 3.9x | 53 (6.0%) | 21 (10.8%) |
| 4.0x or more | 469 (53.5%) | 52 (26.7%) |
| Total | 877 (100.0%) | 195 (100.0%) |
Real Estate Taxes by Mortgage Status in Homosassa
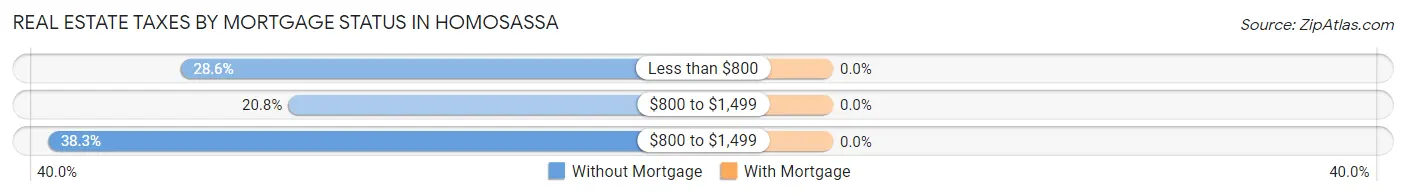
| Property Taxes | Without Mortgage | With Mortgage |
| Less than $800 | 251 (28.6%) | 0 (0.0%) |
| $800 to $1,499 | 182 (20.7%) | 0 (0.0%) |
| $800 to $1,499 | 336 (38.3%) | 0 (0.0%) |
| Total | 877 (100.0%) | 195 (100.0%) |
Health & Disability in Homosassa
Health Insurance Coverage by Age in Homosassa
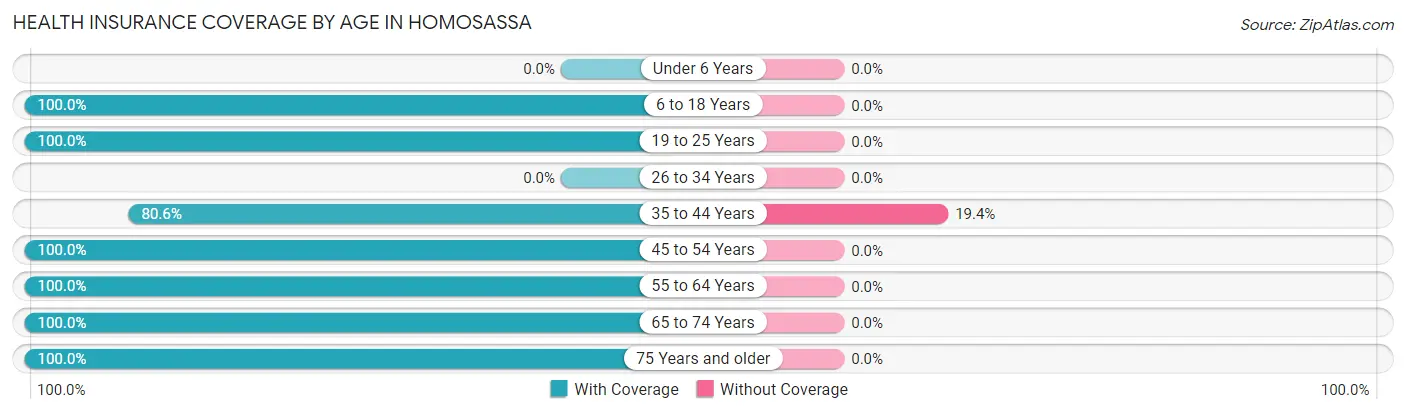
| Age Bracket | With Coverage | Without Coverage |
| Under 6 Years | 0 (0.0%) | 0 (0.0%) |
| 6 to 18 Years | 130 (100.0%) | 0 (0.0%) |
| 19 to 25 Years | 34 (100.0%) | 0 (0.0%) |
| 26 to 34 Years | 0 (0.0%) | 0 (0.0%) |
| 35 to 44 Years | 233 (80.6%) | 56 (19.4%) |
| 45 to 54 Years | 188 (100.0%) | 0 (0.0%) |
| 55 to 64 Years | 407 (100.0%) | 0 (0.0%) |
| 65 to 74 Years | 616 (100.0%) | 0 (0.0%) |
| 75 Years and older | 352 (100.0%) | 0 (0.0%) |
| Total | 1,960 (97.2%) | 56 (2.8%) |
Health Insurance Coverage by Citizenship Status in Homosassa
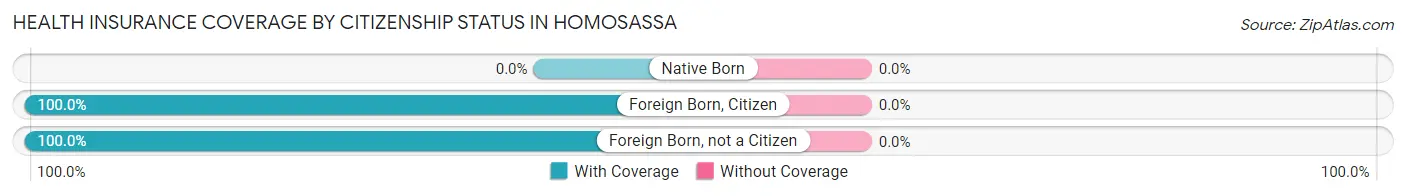
| Citizenship Status | With Coverage | Without Coverage |
| Native Born | 0 (0.0%) | 0 (0.0%) |
| Foreign Born, Citizen | 130 (100.0%) | 0 (0.0%) |
| Foreign Born, not a Citizen | 34 (100.0%) | 0 (0.0%) |
Health Insurance Coverage by Household Income in Homosassa
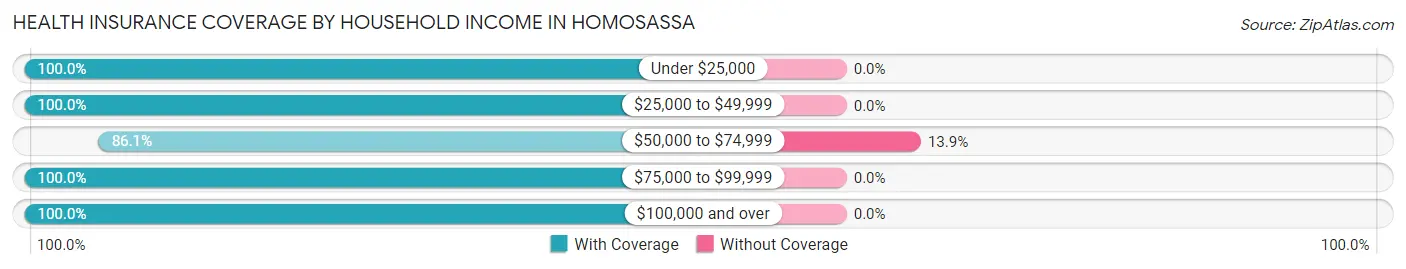
| Household Income | With Coverage | Without Coverage |
| Under $25,000 | 181 (100.0%) | 0 (0.0%) |
| $25,000 to $49,999 | 643 (100.0%) | 0 (0.0%) |
| $50,000 to $74,999 | 347 (86.1%) | 56 (13.9%) |
| $75,000 to $99,999 | 354 (100.0%) | 0 (0.0%) |
| $100,000 and over | 435 (100.0%) | 0 (0.0%) |
Public vs Private Health Insurance Coverage by Age in Homosassa
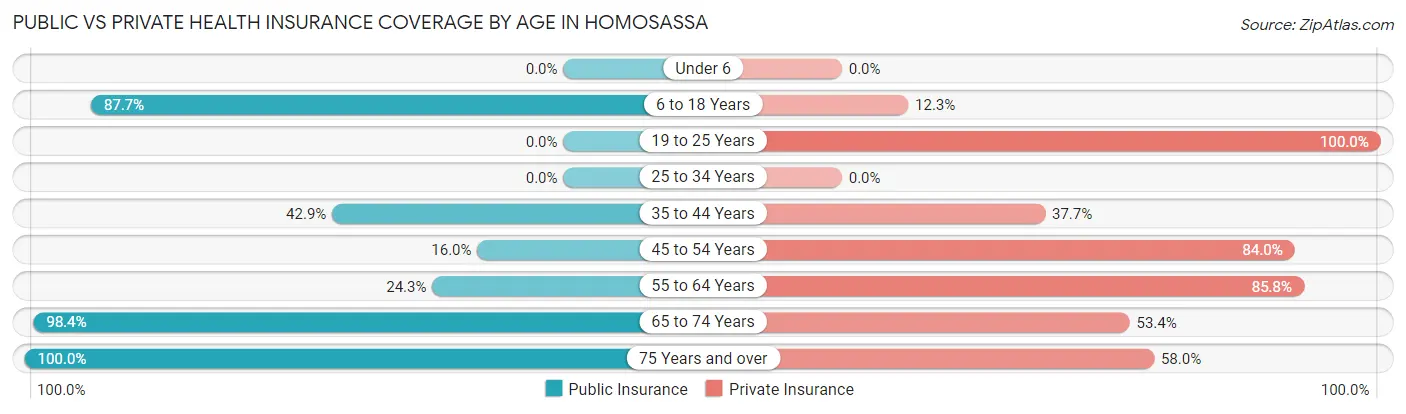
| Age Bracket | Public Insurance | Private Insurance |
| Under 6 | 0 (0.0%) | 0 (0.0%) |
| 6 to 18 Years | 114 (87.7%) | 16 (12.3%) |
| 19 to 25 Years | 0 (0.0%) | 34 (100.0%) |
| 25 to 34 Years | 0 (0.0%) | 0 (0.0%) |
| 35 to 44 Years | 124 (42.9%) | 109 (37.7%) |
| 45 to 54 Years | 30 (16.0%) | 158 (84.0%) |
| 55 to 64 Years | 99 (24.3%) | 349 (85.8%) |
| 65 to 74 Years | 606 (98.4%) | 329 (53.4%) |
| 75 Years and over | 352 (100.0%) | 204 (58.0%) |
| Total | 1,325 (65.7%) | 1,199 (59.5%) |
Disability Status by Sex by Age in Homosassa
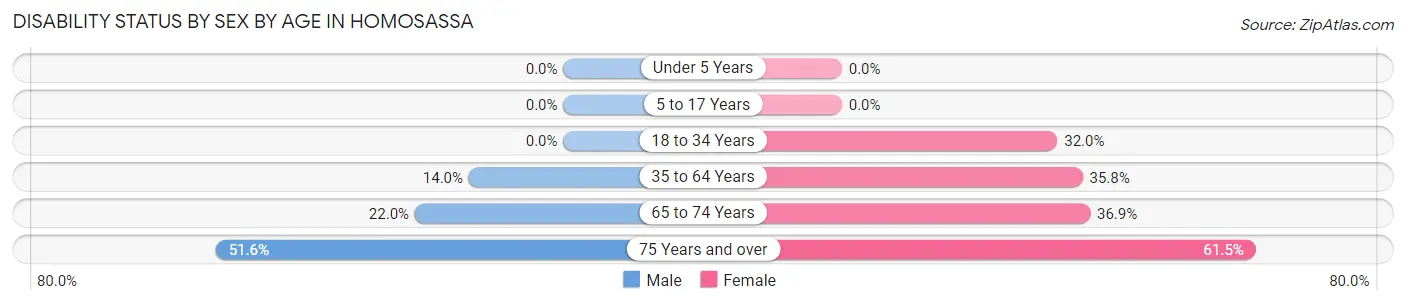
| Age Bracket | Male | Female |
| Under 5 Years | 0 (0.0%) | 0 (0.0%) |
| 5 to 17 Years | 0 (0.0%) | 0 (0.0%) |
| 18 to 34 Years | 0 (0.0%) | 16 (32.0%) |
| 35 to 64 Years | 62 (14.0%) | 158 (35.7%) |
| 65 to 74 Years | 67 (22.0%) | 115 (36.9%) |
| 75 Years and over | 96 (51.6%) | 102 (61.5%) |
Disability Class by Sex by Age in Homosassa
Disability Class: Hearing Difficulty
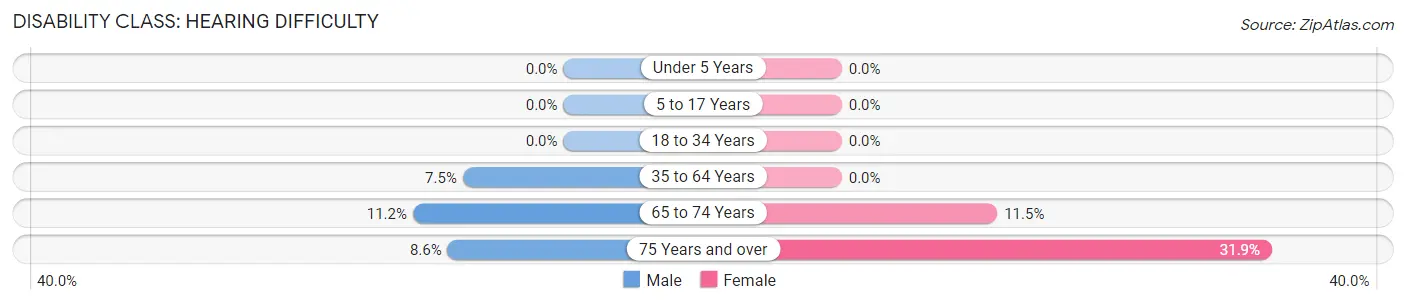
| Age Bracket | Male | Female |
| Under 5 Years | 0 (0.0%) | 0 (0.0%) |
| 5 to 17 Years | 0 (0.0%) | 0 (0.0%) |
| 18 to 34 Years | 0 (0.0%) | 0 (0.0%) |
| 35 to 64 Years | 33 (7.5%) | 0 (0.0%) |
| 65 to 74 Years | 34 (11.2%) | 36 (11.5%) |
| 75 Years and over | 16 (8.6%) | 53 (31.9%) |
Disability Class: Vision Difficulty
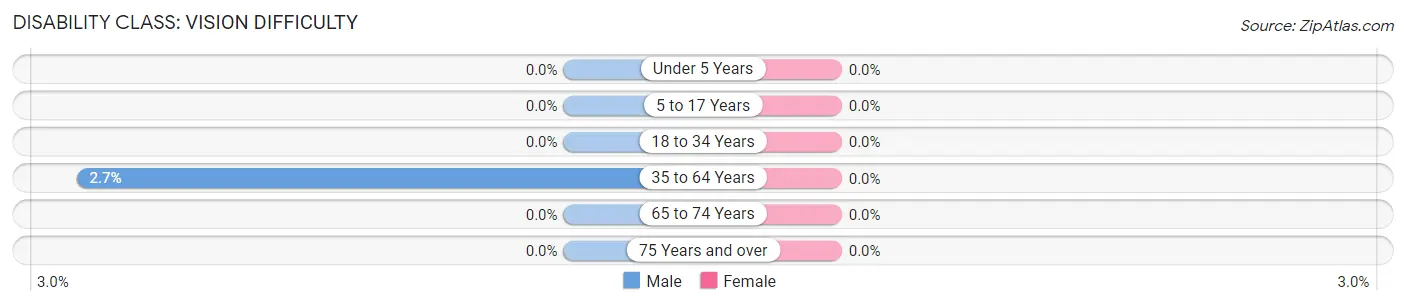
| Age Bracket | Male | Female |
| Under 5 Years | 0 (0.0%) | 0 (0.0%) |
| 5 to 17 Years | 0 (0.0%) | 0 (0.0%) |
| 18 to 34 Years | 0 (0.0%) | 0 (0.0%) |
| 35 to 64 Years | 12 (2.7%) | 0 (0.0%) |
| 65 to 74 Years | 0 (0.0%) | 0 (0.0%) |
| 75 Years and over | 0 (0.0%) | 0 (0.0%) |
Disability Class: Cognitive Difficulty
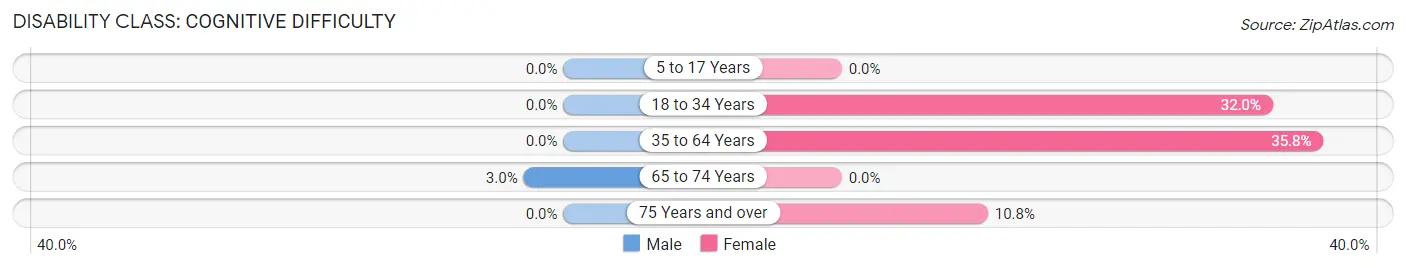
| Age Bracket | Male | Female |
| 5 to 17 Years | 0 (0.0%) | 0 (0.0%) |
| 18 to 34 Years | 0 (0.0%) | 16 (32.0%) |
| 35 to 64 Years | 0 (0.0%) | 158 (35.7%) |
| 65 to 74 Years | 9 (3.0%) | 0 (0.0%) |
| 75 Years and over | 0 (0.0%) | 18 (10.8%) |
Disability Class: Ambulatory Difficulty
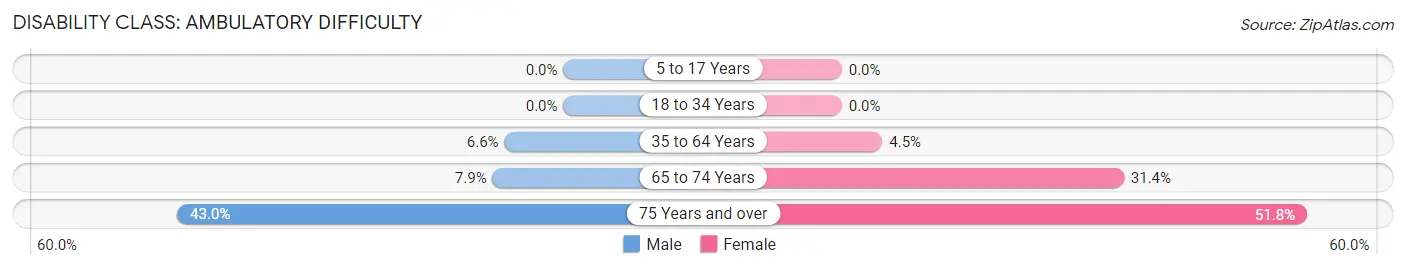
| Age Bracket | Male | Female |
| 5 to 17 Years | 0 (0.0%) | 0 (0.0%) |
| 18 to 34 Years | 0 (0.0%) | 0 (0.0%) |
| 35 to 64 Years | 29 (6.6%) | 20 (4.5%) |
| 65 to 74 Years | 24 (7.9%) | 98 (31.4%) |
| 75 Years and over | 80 (43.0%) | 86 (51.8%) |
Disability Class: Self-Care Difficulty
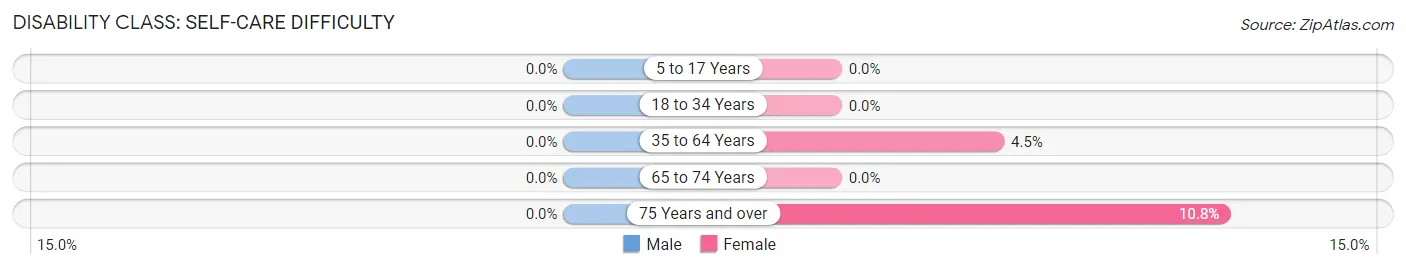
| Age Bracket | Male | Female |
| 5 to 17 Years | 0 (0.0%) | 0 (0.0%) |
| 18 to 34 Years | 0 (0.0%) | 0 (0.0%) |
| 35 to 64 Years | 0 (0.0%) | 20 (4.5%) |
| 65 to 74 Years | 0 (0.0%) | 0 (0.0%) |
| 75 Years and over | 0 (0.0%) | 18 (10.8%) |
Technology Access in Homosassa
Computing Device Access in Homosassa
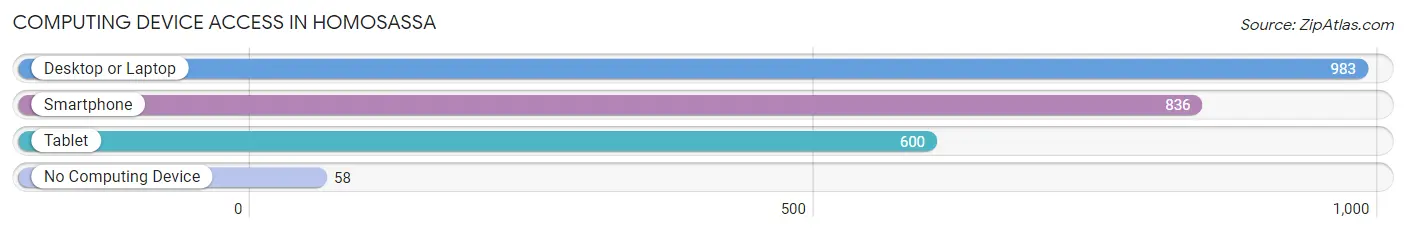
| Device Type | # Households | % Households |
| Desktop or Laptop | 983 | 84.5% |
| Smartphone | 836 | 71.9% |
| Tablet | 600 | 51.6% |
| No Computing Device | 58 | 5.0% |
| Total | 1,163 | 100.0% |
Internet Access in Homosassa
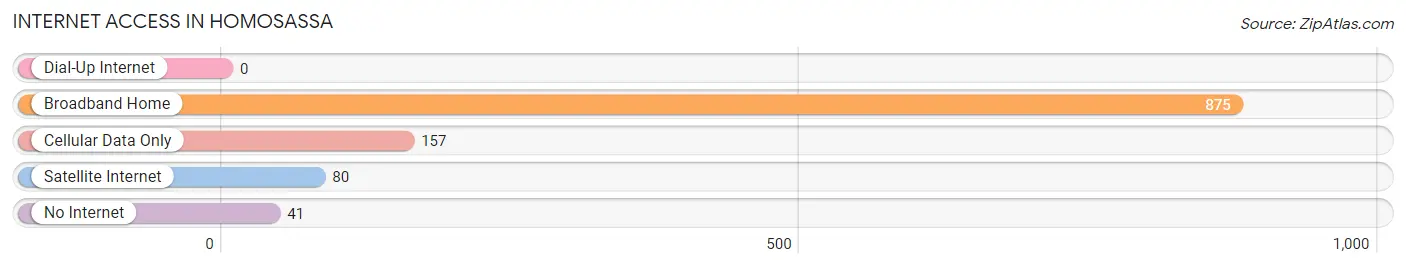
| Internet Type | # Households | % Households |
| Dial-Up Internet | 0 | 0.0% |
| Broadband Home | 875 | 75.2% |
| Cellular Data Only | 157 | 13.5% |
| Satellite Internet | 80 | 6.9% |
| No Internet | 41 | 3.5% |
| Total | 1,163 | 100.0% |
Homosassa Summary
Homosassa, Florida is a small town located in Citrus County, Florida. It is situated on the Gulf of Mexico, about 80 miles north of Tampa. The town has a population of about 3,000 people and is known for its fishing, boating, and wildlife.
History
The area that is now Homosassa was first inhabited by the Timucua Indians. The first European settlers arrived in the area in the early 1800s. The town was originally known as Chocochatti, which means “big water” in the Timucua language. The town was renamed Homosassa in 1842, after the Homosassa River.
The town was a popular fishing destination in the late 1800s and early 1900s. It was also a popular tourist destination, with many visitors coming to see the area’s natural beauty. In the early 1900s, the town was home to a number of resorts, including the Homosassa Hotel and the Homosassa Springs Hotel.
In the 1950s, the town began to decline as the fishing industry declined and tourism decreased. The town was revitalized in the 1970s with the opening of the Homosassa Springs Wildlife State Park. The park is home to a variety of wildlife, including manatees, alligators, and birds.
Geography
Homosassa is located in Citrus County, Florida. It is situated on the Gulf of Mexico, about 80 miles north of Tampa. The town is located on the Homosassa River, which flows into the Gulf of Mexico. The town is surrounded by a number of natural areas, including the Chassahowitzka National Wildlife Refuge and the Homosassa Springs Wildlife State Park.
The town has a humid subtropical climate, with hot, humid summers and mild winters. The average temperature in the summer is around 90 degrees Fahrenheit, and the average temperature in the winter is around 60 degrees Fahrenheit.
Economy
The economy of Homosassa is largely based on tourism and fishing. The town is home to a number of resorts, including the Homosassa Springs Wildlife State Park. The park is a popular tourist destination, with visitors coming to see the area’s natural beauty and wildlife.
The town is also home to a number of fishing charters, which offer deep-sea fishing trips. The town is also home to a number of marinas, which offer boat rentals and other services.
Demographics
As of the 2010 census, the population of Homosassa was 3,019. The population is largely white (90.2%), with a small percentage of African Americans (3.2%) and Hispanics (2.7%). The median household income is $37,917, and the median age is 47.
The town is home to a number of churches, including the First Baptist Church of Homosassa and the Church of the Nazarene. The town is also home to a number of schools, including the Homosassa Elementary School and the Homosassa Middle School.
Conclusion
Homosassa, Florida is a small town located in Citrus County, Florida. It is situated on the Gulf of Mexico, about 80 miles north of Tampa. The town has a population of about 3,000 people and is known for its fishing, boating, and wildlife. The economy of the town is largely based on tourism and fishing, and the town is home to a number of resorts, marinas, and fishing charters. The population is largely white, with a small percentage of African Americans and Hispanics. The town is home to a number of churches and schools, and is a popular tourist destination.
Common Questions
What is Per Capita Income in Homosassa?
Per Capita income in Homosassa is $45,481.
What is the Median Family Income in Homosassa?
Median Family Income in Homosassa is $82,105.
What is the Median Household income in Homosassa?
Median Household Income in Homosassa is $55,112.
What is Inequality or Gini Index in Homosassa?
Inequality or Gini Index in Homosassa is 0.47.
What is the Total Population of Homosassa?
Total Population of Homosassa is 2,016.
What is the Total Male Population of Homosassa?
Total Male Population of Homosassa is 932.
What is the Total Female Population of Homosassa?
Total Female Population of Homosassa is 1,084.
What is the Ratio of Males per 100 Females in Homosassa?
There are 85.98 Males per 100 Females in Homosassa.
What is the Ratio of Females per 100 Males in Homosassa?
There are 116.31 Females per 100 Males in Homosassa.
What is the Median Population Age in Homosassa?
Median Population Age in Homosassa is 64.5 Years.
What is the Average Family Size in Homosassa
Average Family Size in Homosassa is 2.4 People.
What is the Average Household Size in Homosassa
Average Household Size in Homosassa is 1.7 People.
How Large is the Labor Force in Homosassa?
There are 829 People in the Labor Forcein in Homosassa.
What is the Percentage of People in the Labor Force in Homosassa?
41.1% of People are in the Labor Force in Homosassa.
What is the Unemployment Rate in Homosassa?
Unemployment Rate in Homosassa is 2.5%.