Zip Codes with the Highest Percentage of Population Walking to Work in Englewood, FL
On this page
RELATED REPORTS & OPTIONS
Walk to Work
Population
Highest PopulationHighest Population DensityLowest Population DensityMale / Female RatioFemale / Male RatioOldest PopulationOldest Population | MaleOldest Population | FemaleYoungest PopulationYoungest Population | MaleYoungest Population | Female
Families and Households
Largest Family SizeLargest Household SizeMost Single FathersMost Single MothersFewest Single FathersFewest Single MothersSmallest Family SizeSmallest Household Size
Female Fertility
Highest Birth Rate | All WomenHighest Birth Rate | Women 35+Highest Birth Rate | Below PovertyHighest Birth Rate | Public IncomeHighest Birth Rate | In Labor ForceLowest Birth Rate | All WomenLowest Birth Rate | Women 35+Lowest Birth Rate | Below PovertyLowest Birth Rate | Public IncomeLowest Birth Rate | In Labor Force
Female Fertility (Unmarried)
Highest Illegitimacy | All WomenHighest Illegitimacy | Women 35+Lowest Illegitimacy | All WomenLowest Illegitimacy | Women 35+
Race (Community Size)
Race (Percentage)
Ancestry (Community Size)
AmericanAustrianBelgianBhutaneseBrazilianBritishCanadianCentral AmericanCherokeeColombianCubanCzechDanishDutchEastern EuropeanEnglishEuropeanFinnishFrenchFrench CanadianGermanGreekHungarianIndian (Asian)IrishItalianKoreanLithuanianMexicanNorwegianPennsylvania GermanPolishPortuguesePuerto RicanRomanianRussianSalvadoranScandinavianScotch-IrishScottishSeminoleSlovakSouth AmericanSpanishSwedishSwissUkrainianWelsh
Ancestry (Percentage)
AmericanAustrianBelgianBhutaneseBrazilianBritishCanadianCentral AmericanCherokeeColombianCubanCzechDanishDutchEastern EuropeanEnglishEuropeanFinnishFrenchFrench CanadianGermanGreekHungarianIndian (Asian)IrishItalianKoreanLithuanianMexicanNorwegianPennsylvania GermanPolishPortuguesePuerto RicanRomanianRussianSalvadoranScandinavianScotch-IrishScottishSeminoleSlovakSouth AmericanSpanishSwedishSwissUkrainianWelsh
Immigrant Origin (Total)
AfricaAsiaAustriaBrazilCanadaCaribbeanCentral AmericaChinaColombiaCubaEastern AsiaEastern EuropeEnglandEuropeGermanyHungaryItalyJapanLatin AmericaMexicoNorthern EuropePhilippinesRussiaSouth AmericaSouth Eastern AsiaSouthern EuropeSwedenUkraineWestern Europe
Immigrant Origin (Percentage)
AfricaAsiaAustriaBrazilCanadaCaribbeanCentral AmericaChinaColombiaCubaEastern AsiaEastern EuropeEnglandEuropeGermanyHungaryItalyJapanLatin AmericaMexicoNorthern EuropePhilippinesRussiaSouth AmericaSouth Eastern AsiaSouthern EuropeSwedenUkraineWestern Europe
Income
Highest Per Capita IncomeHighest Earnings | MaleHighest Earnings | FemaleHighest Wage/Income Gap ($)Highest Wage/Income Gap (%)Highest Inequality / Gini IndexLowest Per Capita IncomeLowest Earnings | MaleLowest Earnings | FemaleLowest Wage/Income Gap ($)Lowest Wage/Income Gap (%)Lowest Inequality / Gini Index
Income (Families)
Highest Family IncomeLowest Family IncomeFamily Income | $0-10kFamily Income | $100k+Family Income | $200k+
Income (Households)
Highest Household IncomeLowest Household IncomeHousehold Income | $0-10kHousehold Income | $200k+Household Income | $100k+
Poverty
Highest PovertyHighest Poverty | MaleHighest Poverty | FemaleHighest Poverty | Female 18-24Highest Poverty | Child 0-5Highest Poverty | Child 0-16Highest Poverty | Boys 0-16Highest Poverty | Girls 0-16Highest Poverty | Seniors 65+Highest Poverty | Seniors 75+ Lowest PovertyLowest Poverty | MaleLowest Poverty | FemaleLowest Poverty | Child 0-5Lowest Poverty | Child 0-16Lowest Poverty | Boys 0-16Lowest Poverty | Girls 0-16Lowest Poverty | Seniors 65+Lowest Poverty | Seniors 75+
Poverty (Families)
Highest Family PovertyHighest Poverty | Married CoupleHighest Poverty | Single MaleHighest Poverty | Single FemaleHighest Poverty | Single MotherLowest Family PovertyLowest Poverty | Married CoupleLowest Poverty | Single MaleLowest Poverty | Single FemaleLowest Poverty | Single Mother
Unemployment
Highest UnemploymentHighest Unemployment | MaleHighest Unemployment | FemaleHighest Unemployment | Senior > 65Lowest UnemploymentLowest Unemployment | MaleLowest Unemployment | FemaleLowest Unemployment | Senior > 65
Employment Occupations
Architecture & EngineeringArts, Media & EntertainmentBusiness & FinancialCleaning & MaintenanceCommunity & Social Service Computer & MathematicsComputer, Engineering & ScienceConstruction & ExtractionEducation Instruction & LibraryEducation, Arts & MediaFirefighting & PreventionFood Preparation & ServingHealth Diagnosing & TreatingHealth TechnologistsHealthcare SupportInstallation, Maintenance & RepairLaw EnforcementLegal Services & SupportLife, Physical & Social ScienceManagementMaterial MovingOffice & AdministrationPersonal Care and ServiceProductionSales & RelatedSecurity & ProtectionTransportation
Employment Industries
Accommodation & Food ServicesAdministrative & Support ServicesArts, Entertainment & RecreationConstructionEducational ServicesFinance & InsuranceHealth Care & Social AssistanceInformation & TechnologyManufacturingProfessional & Scientific ServicesPublic AdministrationReal Estate, Rental & LeasingRetail TradeTransportation & WarehousingWholesale Trade
Employer Class
Private Company EmployeesSelf-Employed / IncorporatedSelf-Employed / Not IncorporatedNot-for-profit OrganizationsLocal Government EmployeesState Government EmployeesFederal Government Employees
Commute Time
Longest CommuteLongest Commute | MaleLongest Commute | FemaleShortest CommuteShortest Commute | MaleShortest Commute | Female
Commute Means
School Enrollment
Education by Degree Field
Computers and MathematicsBio, Nature & AgriculturalPhysical and Health SciencesPsychologySocial SciencesEngineeringScience and EngineeringBusinessEducationLiterature and LanguagesLiberal Arts and HistoryVisual and Performing ArtsCommunicationsArts and Humanities
Occupancy
Finances
Highest Median Housing CostsHighest Property PricesHighest Owner Housing CostsHighest Renter Housing CostsHighest Housing Costs / IncomeLowest Median Housing CostsLowest Property PricesLowest Owner Housing CostsLowest Renter Housing CostsLowest Housing Costs / Income
Physical Characteristics
Englewood
States
AlabamaAlaskaArizonaArkansasCaliforniaColoradoConnecticutDelawareDistrict Of ColumbiaFloridaGeorgiaHawaiiIdahoIllinoisIndianaIowaKansasKentuckyLouisianaMaineMarylandMassachusettsMichiganMinnesotaMississippiMissouriMontanaNebraskaNevadaNew HampshireNew JerseyNew MexicoNew YorkNorth CarolinaNorth DakotaOhioOklahomaOregonPennsylvaniaPuerto RicoRhode IslandSouth CarolinaSouth DakotaTennesseeTexasUtahVermontVirginiaWashingtonWest VirginiaWisconsinWyoming
Florida Cities
Altamonte SpringsApopkaBoca RatonBonita SpringsBoynton BeachBradentonBrandonBrooksvilleCape CoralCasselberryClearwaterClermontCocoaCoral SpringsCrestviewDade CityDavenportDaytona BeachDefuniak SpringsDelandDelray BeachEnglewoodFort LauderdaleFort MyersFort PierceFort Walton BeachGainesvilleGulf BreezeHialeahHollywoodHomesteadJacksonvilleJupiterKissimmeeLake CityLake WalesLake WorthLakelandLand O LakesLargoLeesburgLive OakLutzMelbourneMiamiMiami BeachMiltonNaplesNew Port RicheyNew Smyrna BeachNorth Fort MyersOcalaOkeechobeeOpa LockaOrange ParkOrlandoOrmond BeachOviedoPalm BayPalm Beach GardensPalm CoastPanama CityPanama City BeachPensacolaPlant CityPompano BeachPort CharlottePort OrangePort Saint LuciePunta GordaRiverviewSaint AugustineSaint CloudSaint PetersburgSanfordSarasotaSebringSeminoleSpring HillStuartTallahasseeTampaTitusvilleVeniceVero BeachWesley ChapelWest Palm BeachWinter HavenWinter ParkZephyrhills
Compare Zip Codes
Comparison Subject
Compare StatesCompare CitiesCompare Zip Codes
Map of Zip Codes with the Highest Percentage of Population Walking to Work in Englewood
49.6%
58.8%
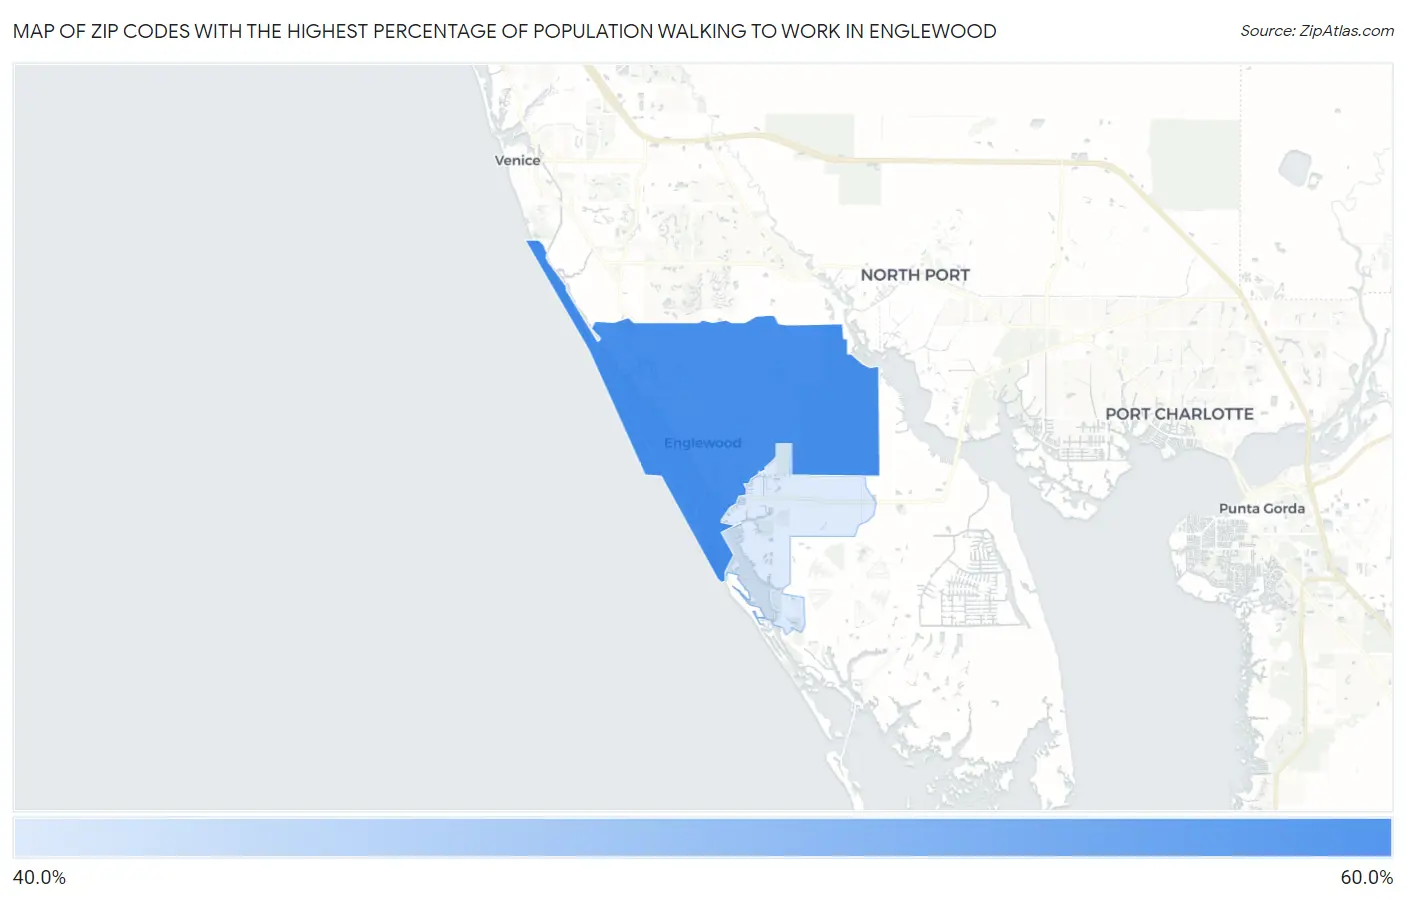
Zip Codes with the Highest Percentage of Population Walking to Work in Englewood, FL
| Zip Code | % Walk to Work | vs State | vs National | |
| 1. | 34223 | 58.8% | 36.4%(+22.4)#69 | 33.4%(+25.4)#1,725 |
| 2. | 34224 | 49.6% | 36.4%(+13.2)#177 | 33.4%(+16.2)#4,690 |
1
Common Questions
What are the Top Zip Codes with the Highest Percentage of Population Walking to Work in Englewood, FL?
Top Zip Codes with the Highest Percentage of Population Walking to Work in Englewood, FL are:
What zip code has the Highest Percentage of Population Walking to Work in Englewood, FL?
34223 has the Highest Percentage of Population Walking to Work in Englewood, FL with 58.8%.
What is the Percentage of Population Walking to Work in Englewood, FL?
Percentage of Population Walking to Work in Englewood is 65.2%.
What is the Percentage of Population Walking to Work in Florida?
Percentage of Population Walking to Work in Florida is 36.4%.
What is the Percentage of Population Walking to Work in the United States?
Percentage of Population Walking to Work in the United States is 33.4%.