Dunedin, FL Map & Demographics
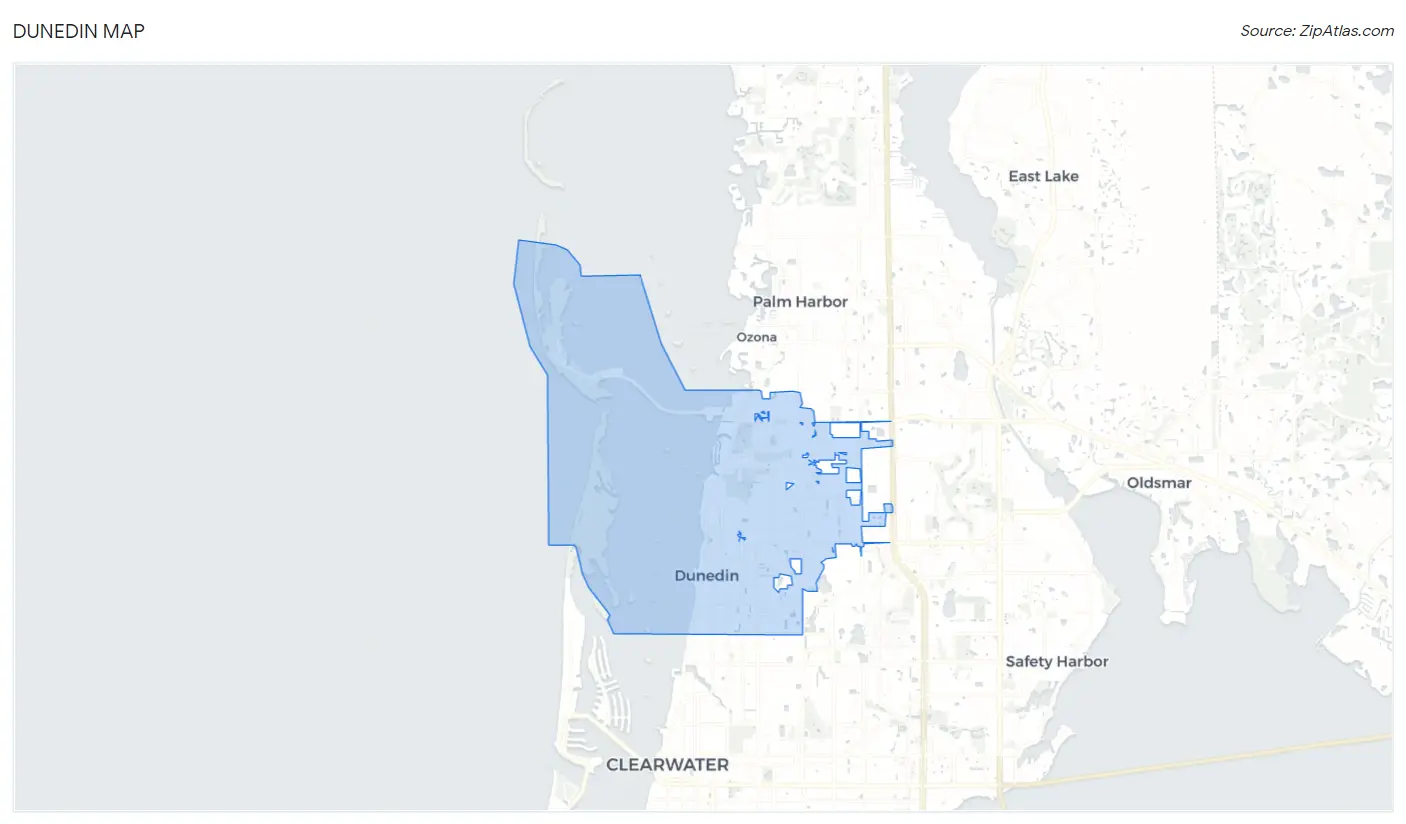
Dunedin Map
Dunedin Overview
$43,463
PER CAPITA INCOME
$89,167
AVG FAMILY INCOME
$63,824
AVG HOUSEHOLD INCOME
14.5%
WAGE / INCOME GAP [ % ]
85.5¢/ $1
WAGE / INCOME GAP [ $ ]
0.46
INEQUALITY / GINI INDEX
36,089
TOTAL POPULATION
16,924
MALE POPULATION
19,165
FEMALE POPULATION
88.31
MALES / 100 FEMALES
113.24
FEMALES / 100 MALES
57.8
MEDIAN AGE
2.7
AVG FAMILY SIZE
2.0
AVG HOUSEHOLD SIZE
16,956
LABOR FORCE [ PEOPLE ]
52.7%
PERCENT IN LABOR FORCE
4.7%
UNEMPLOYMENT RATE
Dunedin Zip Codes
Dunedin Area Codes
Income in Dunedin
Income Overview in Dunedin
Per Capita Income in Dunedin is $43,463, while median incomes of families and households are $89,167 and $63,824 respectively.
| Characteristic | Number | Measure |
| Per Capita Income | 36,089 | $43,463 |
| Median Family Income | 9,558 | $89,167 |
| Mean Family Income | 9,558 | $110,152 |
| Median Household Income | 17,506 | $63,824 |
| Mean Household Income | 17,506 | $86,547 |
| Income Deficit | 9,558 | $0 |
| Wage / Income Gap (%) | 36,089 | 14.51% |
| Wage / Income Gap ($) | 36,089 | 85.49¢ per $1 |
| Gini / Inequality Index | 36,089 | 0.46 |
Earnings by Sex in Dunedin
Average Earnings in Dunedin are $41,332, $45,245 for men and $38,679 for women, a difference of 14.5%.
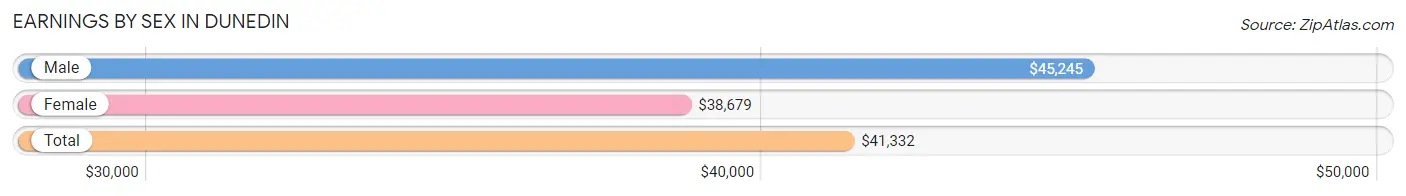
| Sex | Number | Average Earnings |
| Male | 8,969 (50.8%) | $45,245 |
| Female | 8,693 (49.2%) | $38,679 |
| Total | 17,662 (100.0%) | $41,332 |
Earnings by Sex by Income Bracket in Dunedin
The most common earnings brackets in Dunedin are $100,000+ for men (1,347 | 15.0%) and $100,000+ for women (1,040 | 12.0%).
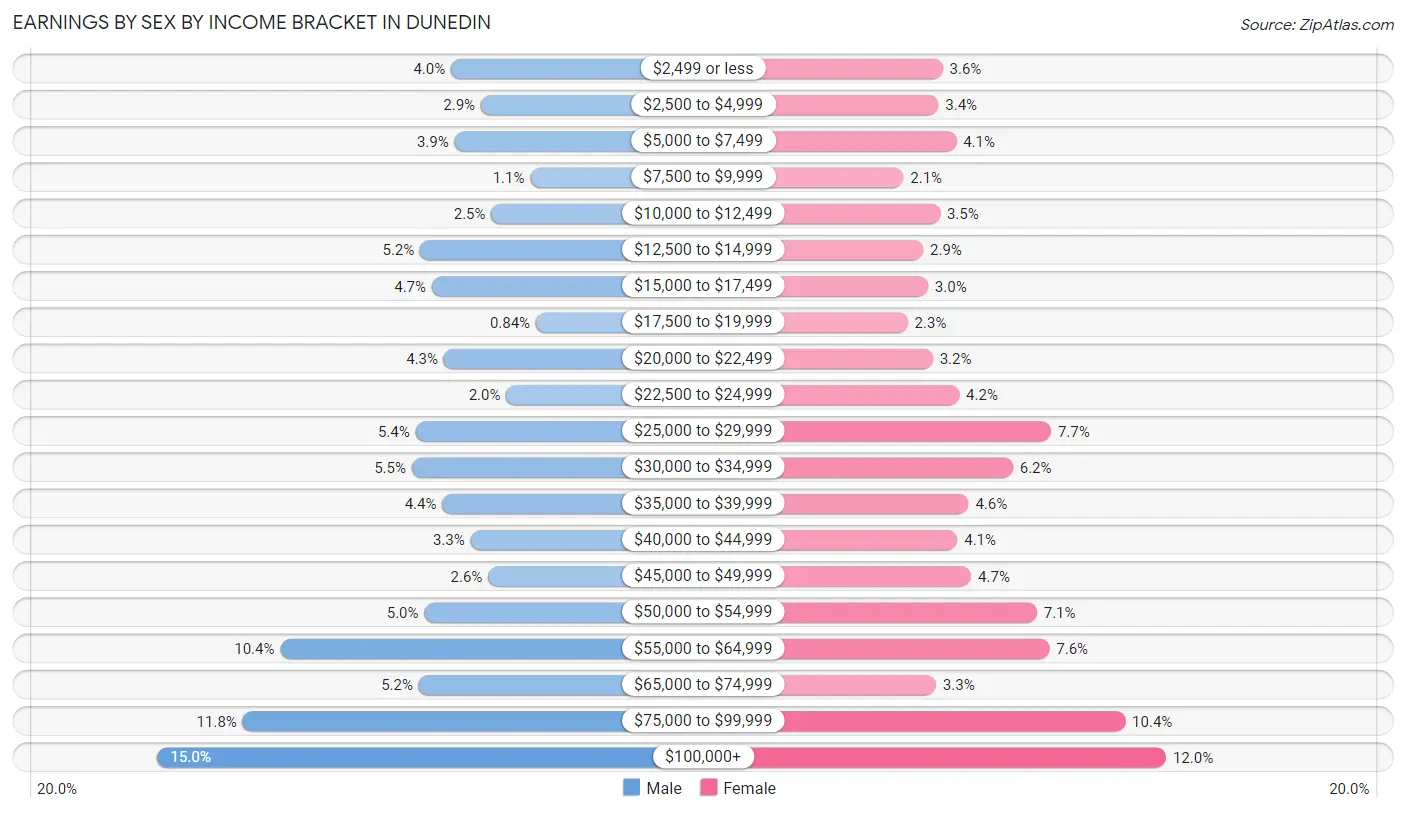
| Income | Male | Female |
| $2,499 or less | 361 (4.0%) | 312 (3.6%) |
| $2,500 to $4,999 | 260 (2.9%) | 298 (3.4%) |
| $5,000 to $7,499 | 349 (3.9%) | 356 (4.1%) |
| $7,500 to $9,999 | 94 (1.1%) | 184 (2.1%) |
| $10,000 to $12,499 | 225 (2.5%) | 303 (3.5%) |
| $12,500 to $14,999 | 465 (5.2%) | 249 (2.9%) |
| $15,000 to $17,499 | 425 (4.7%) | 264 (3.0%) |
| $17,500 to $19,999 | 75 (0.8%) | 198 (2.3%) |
| $20,000 to $22,499 | 385 (4.3%) | 280 (3.2%) |
| $22,500 to $24,999 | 175 (1.9%) | 366 (4.2%) |
| $25,000 to $29,999 | 480 (5.3%) | 665 (7.6%) |
| $30,000 to $34,999 | 492 (5.5%) | 541 (6.2%) |
| $35,000 to $39,999 | 390 (4.3%) | 396 (4.6%) |
| $40,000 to $44,999 | 295 (3.3%) | 360 (4.1%) |
| $45,000 to $49,999 | 236 (2.6%) | 405 (4.7%) |
| $50,000 to $54,999 | 450 (5.0%) | 619 (7.1%) |
| $55,000 to $64,999 | 935 (10.4%) | 660 (7.6%) |
| $65,000 to $74,999 | 469 (5.2%) | 290 (3.3%) |
| $75,000 to $99,999 | 1,061 (11.8%) | 907 (10.4%) |
| $100,000+ | 1,347 (15.0%) | 1,040 (12.0%) |
| Total | 8,969 (100.0%) | 8,693 (100.0%) |
Earnings by Sex by Educational Attainment in Dunedin
Average earnings in Dunedin are $49,663 for men and $41,988 for women, a difference of 15.4%. Men with an educational attainment of bachelor's degree enjoy the highest average annual earnings of $62,283, while those with less than high school education earn the least with $16,103. Women with an educational attainment of graduate degree earn the most with the average annual earnings of $70,114, while those with less than high school education have the smallest earnings of $23,516.
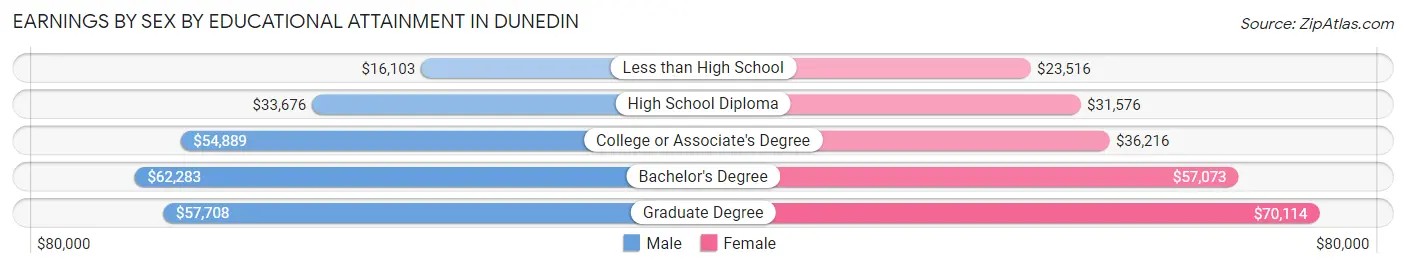
| Educational Attainment | Male Income | Female Income |
| Less than High School | $16,103 | $23,516 |
| High School Diploma | $33,676 | $31,576 |
| College or Associate's Degree | $54,889 | $36,216 |
| Bachelor's Degree | $62,283 | $57,073 |
| Graduate Degree | $57,708 | $70,114 |
| Total | $49,663 | $41,988 |
Family Income in Dunedin
Family Income Brackets in Dunedin
According to the Dunedin family income data, there are 2,122 families falling into the $100,000 to $149,999 income range, which is the most common income bracket and makes up 22.2% of all families. Conversely, the $10,000 to $14,999 income bracket is the least frequent group with only 10 families (0.1%) belonging to this category.
| Income Bracket | # Families | % Families |
| Less than $10,000 | 373 | 3.9% |
| $10,000 to $14,999 | 10 | 0.1% |
| $15,000 to $24,999 | 612 | 6.4% |
| $25,000 to $34,999 | 296 | 3.1% |
| $35,000 to $49,999 | 889 | 9.3% |
| $50,000 to $74,999 | 1,778 | 18.6% |
| $75,000 to $99,999 | 1,395 | 14.6% |
| $100,000 to $149,999 | 2,122 | 22.2% |
| $150,000 to $199,999 | 1,042 | 10.9% |
| $200,000+ | 1,051 | 11.0% |
Family Income by Famaliy Size in Dunedin
4-person families (1,024 | 10.7%) account for the highest median family income in Dunedin with $126,250 per family, while 2-person families (6,576 | 68.8%) have the highest median income of $40,186 per family member.
| Income Bracket | # Families | Median Income |
| 2-Person Families | 6,576 (68.8%) | $80,372 |
| 3-Person Families | 1,642 (17.2%) | $100,729 |
| 4-Person Families | 1,024 (10.7%) | $126,250 |
| 5-Person Families | 225 (2.4%) | $90,260 |
| 6-Person Families | 84 (0.9%) | $52,333 |
| 7+ Person Families | 7 (0.1%) | $0 |
| Total | 9,558 (100.0%) | $89,167 |
Family Income by Number of Earners in Dunedin
The median family income in Dunedin is $89,167, with families comprising 3+ earners (564) having the highest median family income of $142,381, while families with no earners (2,423) have the lowest median family income of $58,605, accounting for 5.9% and 25.4% of families, respectively.
| Number of Earners | # Families | Median Income |
| No Earners | 2,423 (25.4%) | $58,605 |
| 1 Earner | 3,063 (32.1%) | $65,893 |
| 2 Earners | 3,508 (36.7%) | $124,739 |
| 3+ Earners | 564 (5.9%) | $142,381 |
| Total | 9,558 (100.0%) | $89,167 |
Household Income in Dunedin
Household Income Brackets in Dunedin
With 3,011 households falling in the category, the $50,000 to $74,999 income range is the most frequent in Dunedin, accounting for 17.2% of all households. In contrast, only 718 households (4.1%) fall into the $10,000 to $14,999 income bracket, making it the least populous group.
| Income Bracket | # Households | % Households |
| Less than $10,000 | 770 | 4.4% |
| $10,000 to $14,999 | 718 | 4.1% |
| $15,000 to $24,999 | 1,926 | 11.0% |
| $25,000 to $34,999 | 1,646 | 9.4% |
| $35,000 to $49,999 | 1,926 | 11.0% |
| $50,000 to $74,999 | 3,011 | 17.2% |
| $75,000 to $99,999 | 2,101 | 12.0% |
| $100,000 to $149,999 | 2,818 | 16.1% |
| $150,000 to $199,999 | 1,348 | 7.7% |
| $200,000+ | 1,243 | 7.1% |
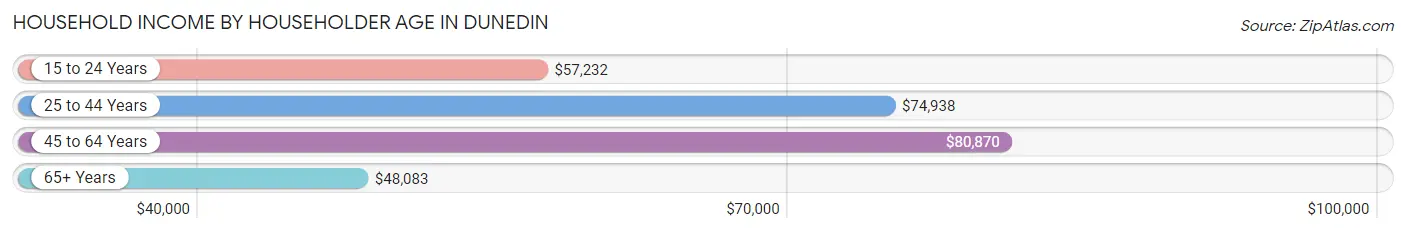
Household Income by Householder Age in Dunedin
The median household income in Dunedin is $63,824, with the highest median household income of $80,870 found in the 45 to 64 years age bracket for the primary householder. A total of 6,360 households (36.3%) fall into this category. Meanwhile, the 65+ years age bracket for the primary householder has the lowest median household income of $48,083, with 8,091 households (46.2%) in this group.
| Income Bracket | # Households | Median Income |
| 15 to 24 Years | 202 (1.1%) | $57,232 |
| 25 to 44 Years | 2,853 (16.3%) | $74,938 |
| 45 to 64 Years | 6,360 (36.3%) | $80,870 |
| 65+ Years | 8,091 (46.2%) | $48,083 |
| Total | 17,506 (100.0%) | $63,824 |
Poverty in Dunedin
Income Below Poverty by Sex and Age in Dunedin
With 8.1% poverty level for males and 8.6% for females among the residents of Dunedin, 75 year old and over males and under 5 year old females are the most vulnerable to poverty, with 281 males (13.5%) and 111 females (13.8%) in their respective age groups living below the poverty level.
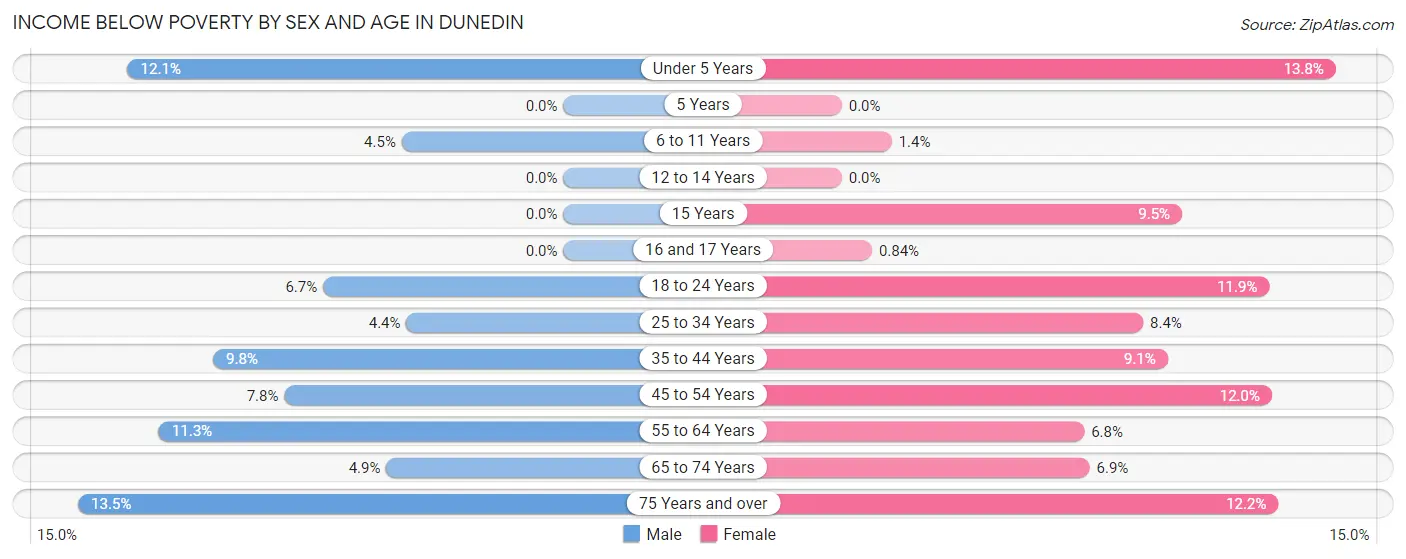
| Age Bracket | Male | Female |
| Under 5 Years | 57 (12.1%) | 111 (13.8%) |
| 5 Years | 0 (0.0%) | 0 (0.0%) |
| 6 to 11 Years | 29 (4.5%) | 12 (1.4%) |
| 12 to 14 Years | 0 (0.0%) | 0 (0.0%) |
| 15 Years | 0 (0.0%) | 18 (9.5%) |
| 16 and 17 Years | 0 (0.0%) | 2 (0.8%) |
| 18 to 24 Years | 71 (6.7%) | 80 (11.9%) |
| 25 to 34 Years | 71 (4.4%) | 115 (8.4%) |
| 35 to 44 Years | 134 (9.8%) | 173 (9.1%) |
| 45 to 54 Years | 181 (7.8%) | 236 (12.0%) |
| 55 to 64 Years | 364 (11.3%) | 238 (6.8%) |
| 65 to 74 Years | 160 (4.9%) | 277 (6.9%) |
| 75 Years and over | 281 (13.5%) | 349 (12.1%) |
| Total | 1,348 (8.1%) | 1,611 (8.6%) |
Income Above Poverty by Sex and Age in Dunedin
According to the poverty statistics in Dunedin, males aged 5 years and females aged 5 years are the age groups that are most secure financially, with 100.0% of males and 100.0% of females in these age groups living above the poverty line.
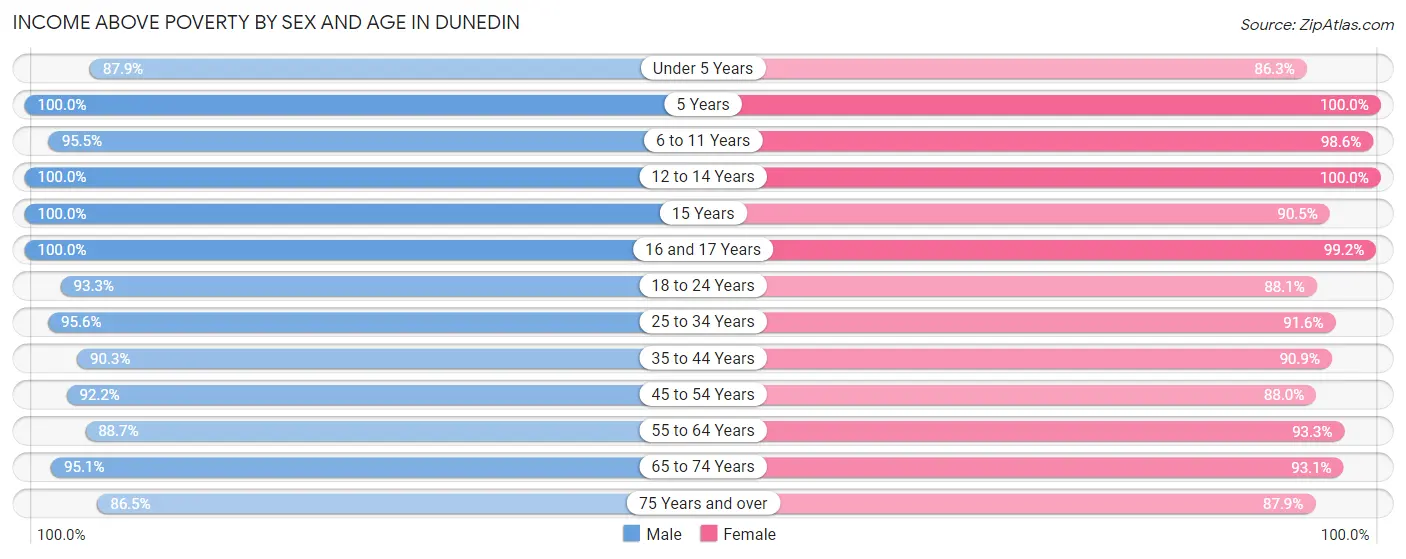
| Age Bracket | Male | Female |
| Under 5 Years | 413 (87.9%) | 696 (86.3%) |
| 5 Years | 77 (100.0%) | 57 (100.0%) |
| 6 to 11 Years | 615 (95.5%) | 850 (98.6%) |
| 12 to 14 Years | 266 (100.0%) | 321 (100.0%) |
| 15 Years | 192 (100.0%) | 172 (90.5%) |
| 16 and 17 Years | 97 (100.0%) | 235 (99.2%) |
| 18 to 24 Years | 991 (93.3%) | 592 (88.1%) |
| 25 to 34 Years | 1,555 (95.6%) | 1,256 (91.6%) |
| 35 to 44 Years | 1,241 (90.2%) | 1,734 (90.9%) |
| 45 to 54 Years | 2,148 (92.2%) | 1,736 (88.0%) |
| 55 to 64 Years | 2,870 (88.7%) | 3,287 (93.2%) |
| 65 to 74 Years | 3,088 (95.1%) | 3,738 (93.1%) |
| 75 Years and over | 1,799 (86.5%) | 2,524 (87.8%) |
| Total | 15,352 (91.9%) | 17,198 (91.4%) |
Income Below Poverty Among Married-Couple Families in Dunedin
The poverty statistics for married-couple families in Dunedin show that 4.1% or 321 of the total 7,783 families live below the poverty line. Families with no children have the highest poverty rate of 4.6%, comprising of 283 families. On the other hand, families with 3 or 4 children have the lowest poverty rate of 0.0%, which includes 0 families.
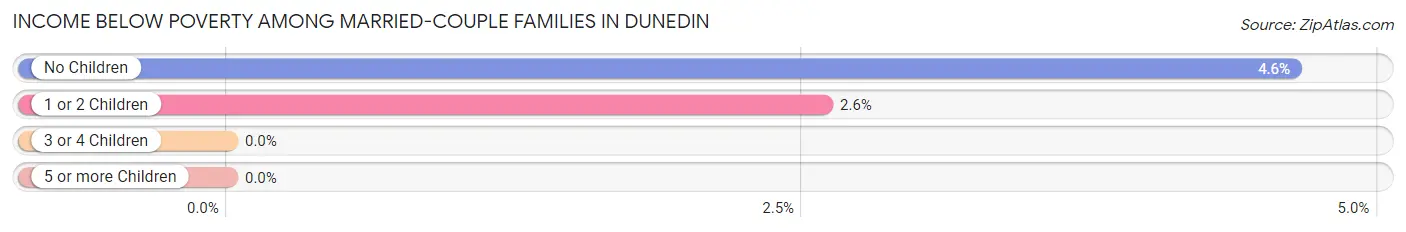
| Children | Above Poverty | Below Poverty |
| No Children | 5,829 (95.4%) | 283 (4.6%) |
| 1 or 2 Children | 1,432 (97.4%) | 38 (2.6%) |
| 3 or 4 Children | 194 (100.0%) | 0 (0.0%) |
| 5 or more Children | 7 (100.0%) | 0 (0.0%) |
| Total | 7,462 (95.9%) | 321 (4.1%) |
Income Below Poverty Among Single-Parent Households in Dunedin
According to the poverty data in Dunedin, 8.6% or 55 single-father households and 14.0% or 159 single-mother households are living below the poverty line. Among single-father households, those with no children have the highest poverty rate, with 55 households (28.3%) experiencing poverty. Likewise, among single-mother households, those with 1 or 2 children have the highest poverty rate, with 143 households (43.9%) falling below the poverty line.
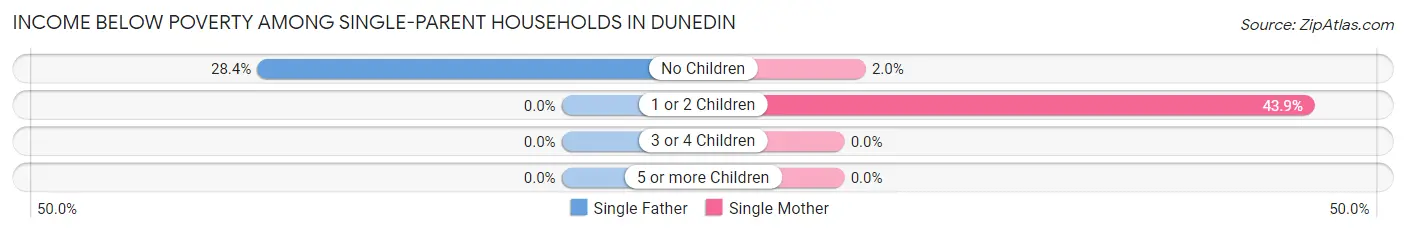
| Children | Single Father | Single Mother |
| No Children | 55 (28.3%) | 16 (2.0%) |
| 1 or 2 Children | 0 (0.0%) | 143 (43.9%) |
| 3 or 4 Children | 0 (0.0%) | 0 (0.0%) |
| 5 or more Children | 0 (0.0%) | 0 (0.0%) |
| Total | 55 (8.6%) | 159 (14.0%) |
Income Below Poverty Among Married-Couple vs Single-Parent Households in Dunedin
The poverty data for Dunedin shows that 321 of the married-couple family households (4.1%) and 214 of the single-parent households (12.1%) are living below the poverty level. Within the married-couple family households, those with no children have the highest poverty rate, with 283 households (4.6%) falling below the poverty line. Among the single-parent households, those with 1 or 2 children have the highest poverty rate, with 143 household (18.8%) living below poverty.
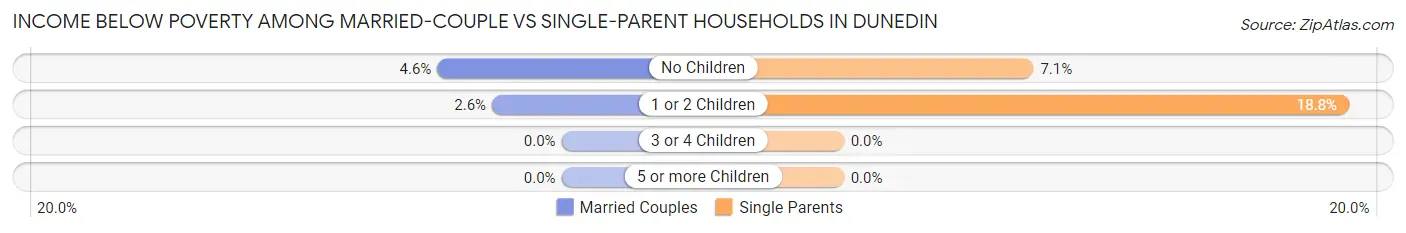
| Children | Married-Couple Families | Single-Parent Households |
| No Children | 283 (4.6%) | 71 (7.1%) |
| 1 or 2 Children | 38 (2.6%) | 143 (18.8%) |
| 3 or 4 Children | 0 (0.0%) | 0 (0.0%) |
| 5 or more Children | 0 (0.0%) | 0 (0.0%) |
| Total | 321 (4.1%) | 214 (12.1%) |
Race in Dunedin
The most populous races in Dunedin are White / Caucasian (31,503 | 87.3%), Hispanic or Latino (2,219 | 6.1%), and Two or more Races (2,171 | 6.0%).
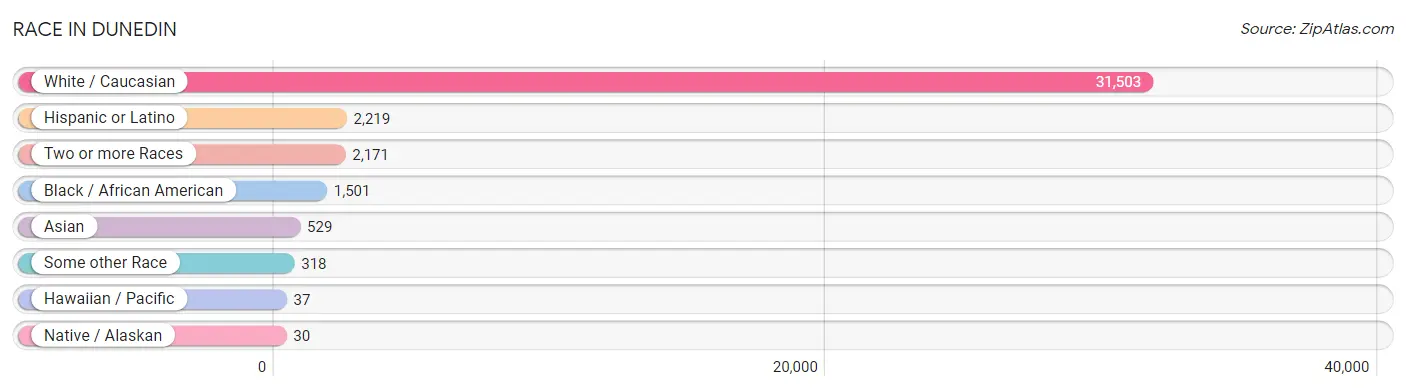
| Race | # Population | % Population |
| Asian | 529 | 1.5% |
| Black / African American | 1,501 | 4.2% |
| Hawaiian / Pacific | 37 | 0.1% |
| Hispanic or Latino | 2,219 | 6.1% |
| Native / Alaskan | 30 | 0.1% |
| White / Caucasian | 31,503 | 87.3% |
| Two or more Races | 2,171 | 6.0% |
| Some other Race | 318 | 0.9% |
| Total | 36,089 | 100.0% |
Ancestry in Dunedin
The most populous ancestries reported in Dunedin are German (6,980 | 19.3%), English (5,166 | 14.3%), Irish (4,999 | 13.9%), Italian (3,941 | 10.9%), and American (2,357 | 6.5%), together accounting for 65.0% of all Dunedin residents.
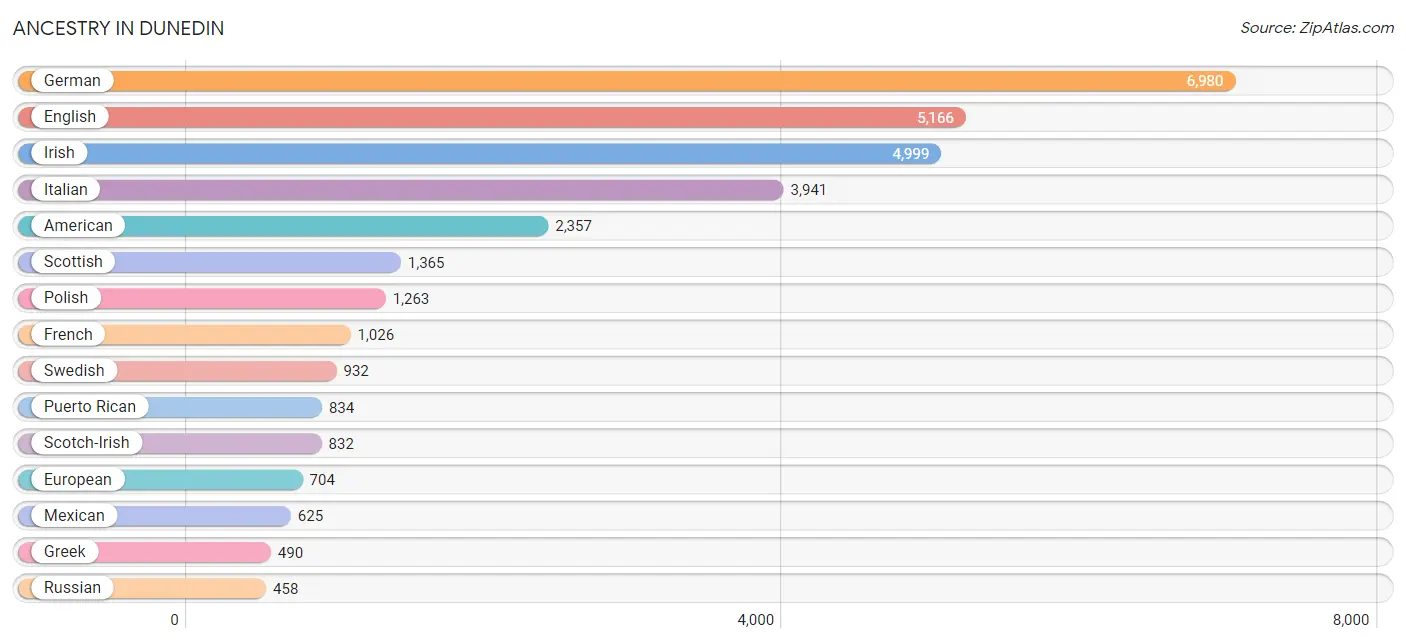
| Ancestry | # Population | % Population |
| African | 144 | 0.4% |
| Albanian | 159 | 0.4% |
| American | 2,357 | 6.5% |
| Arab | 131 | 0.4% |
| Armenian | 35 | 0.1% |
| Assyrian / Chaldean / Syriac | 33 | 0.1% |
| Australian | 199 | 0.5% |
| Austrian | 47 | 0.1% |
| Belgian | 249 | 0.7% |
| Belizean | 33 | 0.1% |
| Bhutanese | 65 | 0.2% |
| Brazilian | 14 | 0.0% |
| British | 455 | 1.3% |
| British West Indian | 15 | 0.0% |
| Burmese | 229 | 0.6% |
| Canadian | 114 | 0.3% |
| Celtic | 17 | 0.1% |
| Central American | 229 | 0.6% |
| Central American Indian | 98 | 0.3% |
| Cherokee | 148 | 0.4% |
| Chilean | 41 | 0.1% |
| Colombian | 95 | 0.3% |
| Costa Rican | 53 | 0.2% |
| Creek | 4 | 0.0% |
| Croatian | 102 | 0.3% |
| Cuban | 156 | 0.4% |
| Czech | 36 | 0.1% |
| Czechoslovakian | 169 | 0.5% |
| Danish | 220 | 0.6% |
| Dutch | 137 | 0.4% |
| Eastern European | 132 | 0.4% |
| Ecuadorian | 31 | 0.1% |
| Egyptian | 47 | 0.1% |
| English | 5,166 | 14.3% |
| European | 704 | 1.9% |
| Finnish | 67 | 0.2% |
| French | 1,026 | 2.8% |
| French Canadian | 260 | 0.7% |
| German | 6,980 | 19.3% |
| Greek | 490 | 1.4% |
| Guamanian / Chamorro | 14 | 0.0% |
| Guatemalan | 98 | 0.3% |
| Honduran | 78 | 0.2% |
| Hungarian | 218 | 0.6% |
| Indian (Asian) | 136 | 0.4% |
| Iranian | 22 | 0.1% |
| Irish | 4,999 | 13.9% |
| Italian | 3,941 | 10.9% |
| Korean | 313 | 0.9% |
| Lebanese | 54 | 0.2% |
| Lithuanian | 203 | 0.6% |
| Macedonian | 10 | 0.0% |
| Mexican | 625 | 1.7% |
| Northern European | 9 | 0.0% |
| Norwegian | 393 | 1.1% |
| Pennsylvania German | 12 | 0.0% |
| Polish | 1,263 | 3.5% |
| Portuguese | 380 | 1.1% |
| Puerto Rican | 834 | 2.3% |
| Romanian | 106 | 0.3% |
| Russian | 458 | 1.3% |
| Scandinavian | 161 | 0.4% |
| Scotch-Irish | 832 | 2.3% |
| Scottish | 1,365 | 3.8% |
| Serbian | 57 | 0.2% |
| Slovak | 210 | 0.6% |
| South American | 183 | 0.5% |
| Spaniard | 35 | 0.1% |
| Spanish | 71 | 0.2% |
| Sri Lankan | 37 | 0.1% |
| Subsaharan African | 144 | 0.4% |
| Swedish | 932 | 2.6% |
| Swiss | 136 | 0.4% |
| Thai | 100 | 0.3% |
| Tongan | 34 | 0.1% |
| Ukrainian | 98 | 0.3% |
| Venezuelan | 16 | 0.0% |
| Welsh | 309 | 0.9% |
| West Indian | 15 | 0.0% |
| Yugoslavian | 157 | 0.4% | View All 80 Rows |
Immigrants in Dunedin
The most numerous immigrant groups reported in Dunedin came from Europe (1,437 | 4.0%), Latin America (780 | 2.2%), Canada (625 | 1.7%), Eastern Europe (569 | 1.6%), and Asia (517 | 1.4%), together accounting for 10.9% of all Dunedin residents.
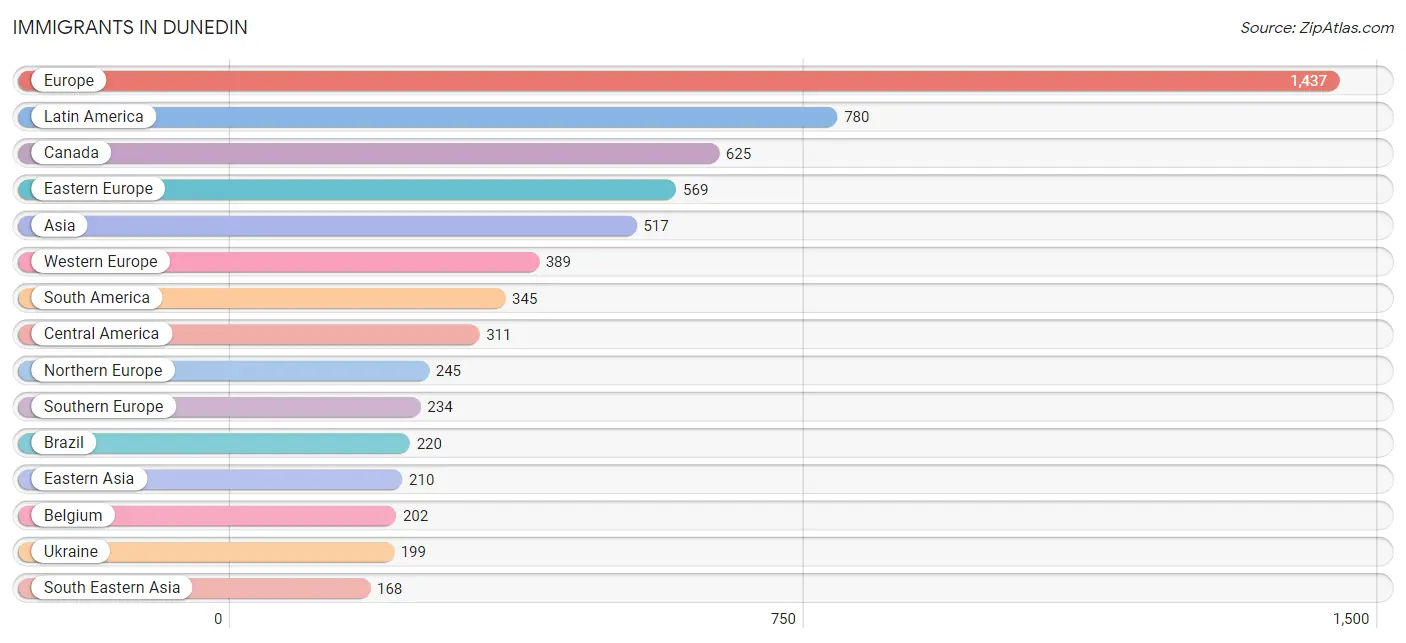
| Immigration Origin | # Population | % Population |
| Africa | 47 | 0.1% |
| Albania | 132 | 0.4% |
| Asia | 517 | 1.4% |
| Austria | 9 | 0.0% |
| Belgium | 202 | 0.6% |
| Belize | 33 | 0.1% |
| Bolivia | 13 | 0.0% |
| Bosnia and Herzegovina | 55 | 0.2% |
| Brazil | 220 | 0.6% |
| Canada | 625 | 1.7% |
| Caribbean | 124 | 0.3% |
| Central America | 311 | 0.9% |
| Chile | 13 | 0.0% |
| China | 60 | 0.2% |
| Colombia | 83 | 0.2% |
| Costa Rica | 53 | 0.2% |
| Cuba | 109 | 0.3% |
| Czechoslovakia | 44 | 0.1% |
| Denmark | 12 | 0.0% |
| Eastern Asia | 210 | 0.6% |
| Eastern Europe | 569 | 1.6% |
| Egypt | 47 | 0.1% |
| England | 38 | 0.1% |
| Europe | 1,437 | 4.0% |
| France | 4 | 0.0% |
| Germany | 147 | 0.4% |
| Greece | 131 | 0.4% |
| Honduras | 55 | 0.2% |
| Hong Kong | 53 | 0.2% |
| India | 102 | 0.3% |
| Iran | 17 | 0.1% |
| Ireland | 6 | 0.0% |
| Italy | 94 | 0.3% |
| Korea | 150 | 0.4% |
| Latin America | 780 | 2.2% |
| Lebanon | 9 | 0.0% |
| Lithuania | 15 | 0.0% |
| Malaysia | 18 | 0.1% |
| Mexico | 115 | 0.3% |
| Netherlands | 25 | 0.1% |
| North Macedonia | 17 | 0.1% |
| Northern Africa | 47 | 0.1% |
| Northern Europe | 245 | 0.7% |
| Panama | 55 | 0.2% |
| Philippines | 113 | 0.3% |
| Poland | 30 | 0.1% |
| Portugal | 9 | 0.0% |
| Russia | 67 | 0.2% |
| Scotland | 9 | 0.0% |
| South America | 345 | 1.0% |
| South Central Asia | 119 | 0.3% |
| South Eastern Asia | 168 | 0.5% |
| Southern Europe | 234 | 0.6% |
| Switzerland | 2 | 0.0% |
| Trinidad and Tobago | 15 | 0.0% |
| Ukraine | 199 | 0.5% |
| Venezuela | 16 | 0.0% |
| Vietnam | 25 | 0.1% |
| Western Asia | 20 | 0.1% |
| Western Europe | 389 | 1.1% | View All 60 Rows |
Sex and Age in Dunedin
Sex and Age in Dunedin
The most populous age groups in Dunedin are 70 to 74 Years (1,697 | 10.0%) for men and 65 to 69 Years (2,145 | 11.2%) for women.
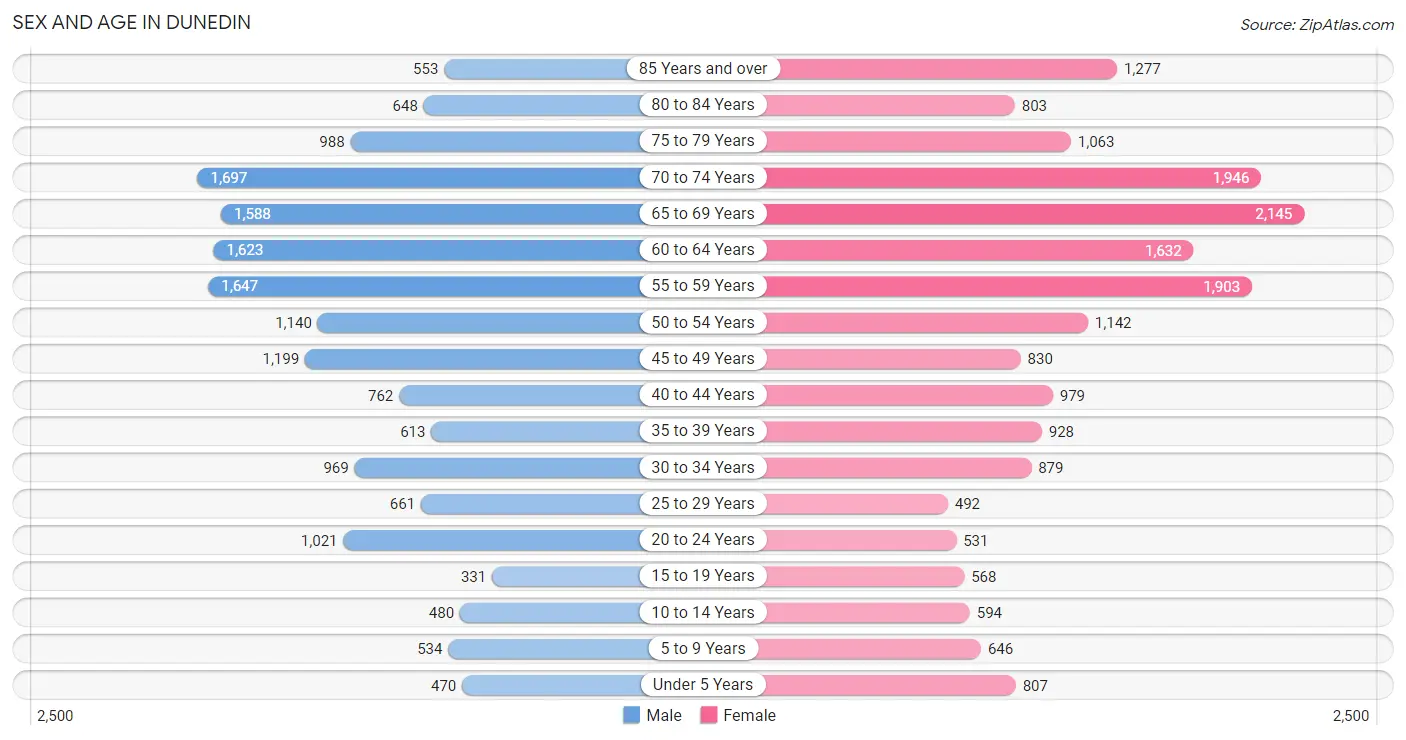
| Age Bracket | Male | Female |
| Under 5 Years | 470 (2.8%) | 807 (4.2%) |
| 5 to 9 Years | 534 (3.2%) | 646 (3.4%) |
| 10 to 14 Years | 480 (2.8%) | 594 (3.1%) |
| 15 to 19 Years | 331 (2.0%) | 568 (3.0%) |
| 20 to 24 Years | 1,021 (6.0%) | 531 (2.8%) |
| 25 to 29 Years | 661 (3.9%) | 492 (2.6%) |
| 30 to 34 Years | 969 (5.7%) | 879 (4.6%) |
| 35 to 39 Years | 613 (3.6%) | 928 (4.8%) |
| 40 to 44 Years | 762 (4.5%) | 979 (5.1%) |
| 45 to 49 Years | 1,199 (7.1%) | 830 (4.3%) |
| 50 to 54 Years | 1,140 (6.7%) | 1,142 (6.0%) |
| 55 to 59 Years | 1,647 (9.7%) | 1,903 (9.9%) |
| 60 to 64 Years | 1,623 (9.6%) | 1,632 (8.5%) |
| 65 to 69 Years | 1,588 (9.4%) | 2,145 (11.2%) |
| 70 to 74 Years | 1,697 (10.0%) | 1,946 (10.2%) |
| 75 to 79 Years | 988 (5.8%) | 1,063 (5.6%) |
| 80 to 84 Years | 648 (3.8%) | 803 (4.2%) |
| 85 Years and over | 553 (3.3%) | 1,277 (6.7%) |
| Total | 16,924 (100.0%) | 19,165 (100.0%) |
Families and Households in Dunedin
Median Family Size in Dunedin
The median family size in Dunedin is 2.66 persons per family, with single female/mother families (1,136 | 11.9%) accounting for the largest median family size of 2.79 persons per family. On the other hand, married-couple families (7,783 | 81.4%) represent the smallest median family size with 2.64 persons per family.
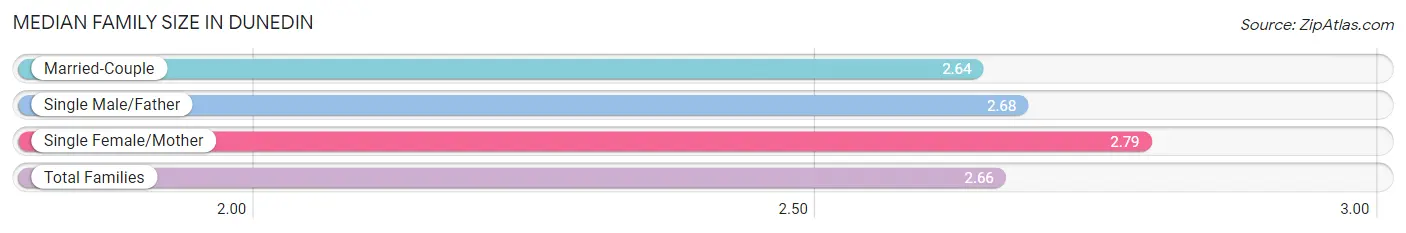
| Family Type | # Families | Family Size |
| Married-Couple | 7,783 (81.4%) | 2.64 |
| Single Male/Father | 639 (6.7%) | 2.68 |
| Single Female/Mother | 1,136 (11.9%) | 2.79 |
| Total Families | 9,558 (100.0%) | 2.66 |
Median Household Size in Dunedin
The median household size in Dunedin is 2.02 persons per household, with single male/father households (639 | 3.6%) accounting for the largest median household size of 3.26 persons per household. non-family households (7,948 | 45.4%) represent the smallest median household size with 1.15 persons per household.
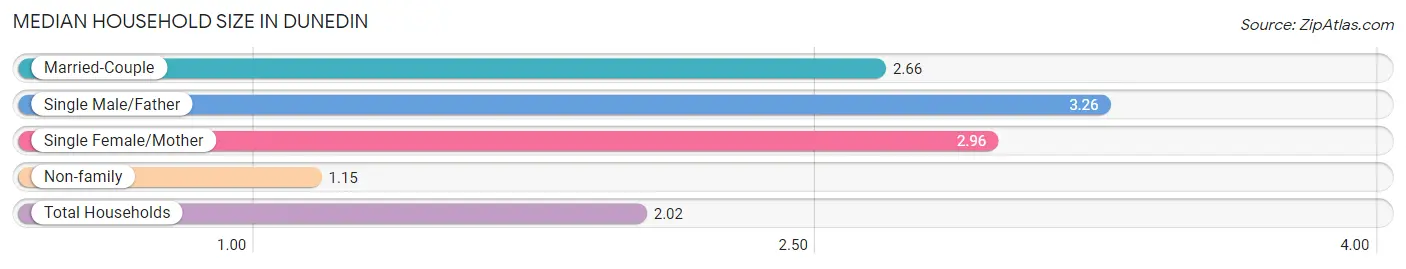
| Household Type | # Households | Household Size |
| Married-Couple | 7,783 (44.5%) | 2.66 |
| Single Male/Father | 639 (3.6%) | 3.26 |
| Single Female/Mother | 1,136 (6.5%) | 2.96 |
| Non-family | 7,948 (45.4%) | 1.15 |
| Total Households | 17,506 (100.0%) | 2.02 |
Household Size by Marriage Status in Dunedin
Out of a total of 17,506 households in Dunedin, 9,558 (54.6%) are family households, while 7,948 (45.4%) are nonfamily households. The most numerous type of family households are 2-person households, comprising 6,291, and the most common type of nonfamily households are 1-person households, comprising 6,888.
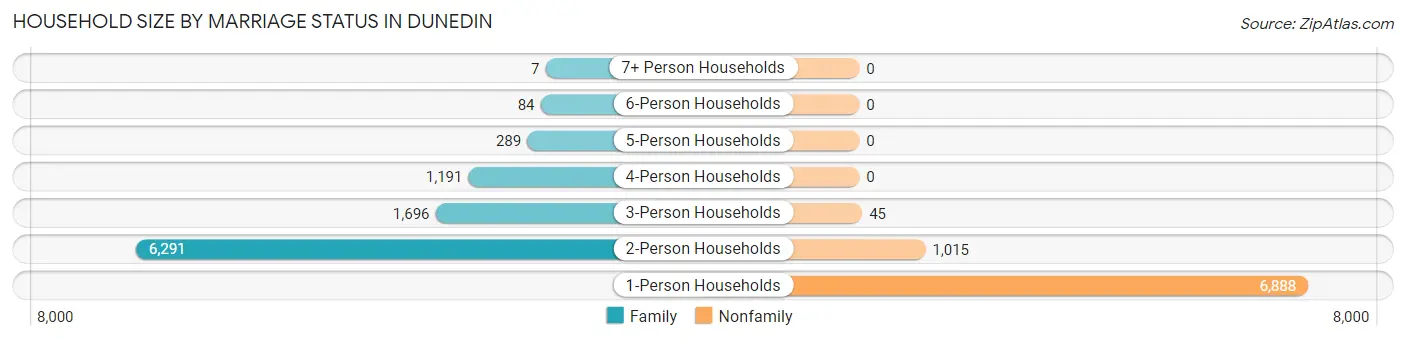
| Household Size | Family Households | Nonfamily Households |
| 1-Person Households | - | 6,888 (39.4%) |
| 2-Person Households | 6,291 (35.9%) | 1,015 (5.8%) |
| 3-Person Households | 1,696 (9.7%) | 45 (0.3%) |
| 4-Person Households | 1,191 (6.8%) | 0 (0.0%) |
| 5-Person Households | 289 (1.7%) | 0 (0.0%) |
| 6-Person Households | 84 (0.5%) | 0 (0.0%) |
| 7+ Person Households | 7 (0.0%) | 0 (0.0%) |
| Total | 9,558 (54.6%) | 7,948 (45.4%) |
Female Fertility in Dunedin
Fertility by Age in Dunedin
Average fertility rate in Dunedin is 28.0 births per 1,000 women. Women in the age bracket of 20 to 34 years have the highest fertility rate with 58.0 births per 1,000 women. Women in the age bracket of 20 to 34 years acount for 71.2% of all women with births.
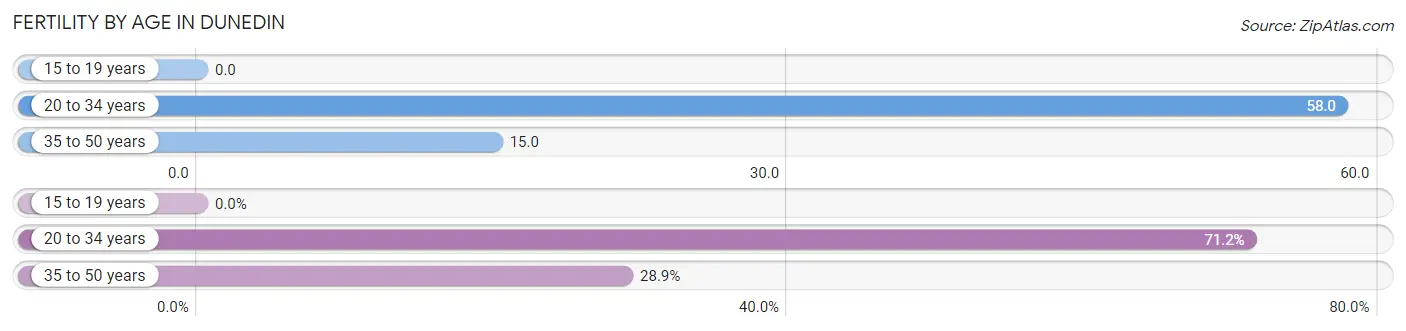
| Age Bracket | Women with Births | Births / 1,000 Women |
| 15 to 19 years | 0 (0.0%) | 0.0 |
| 20 to 34 years | 111 (71.2%) | 58.0 |
| 35 to 50 years | 45 (28.8%) | 15.0 |
| Total | 156 (100.0%) | 28.0 |
Fertility by Age by Marriage Status in Dunedin
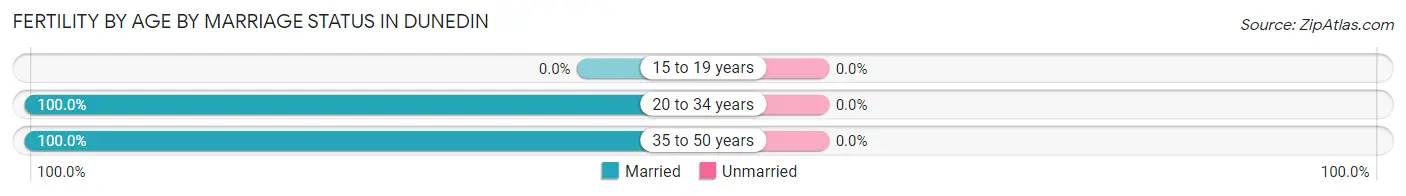
| Age Bracket | Married | Unmarried |
| 15 to 19 years | 0 (0.0%) | 0 (0.0%) |
| 20 to 34 years | 111 (100.0%) | 0 (0.0%) |
| 35 to 50 years | 45 (100.0%) | 0 (0.0%) |
| Total | 156 (100.0%) | 0 (0.0%) |
Fertility by Education in Dunedin
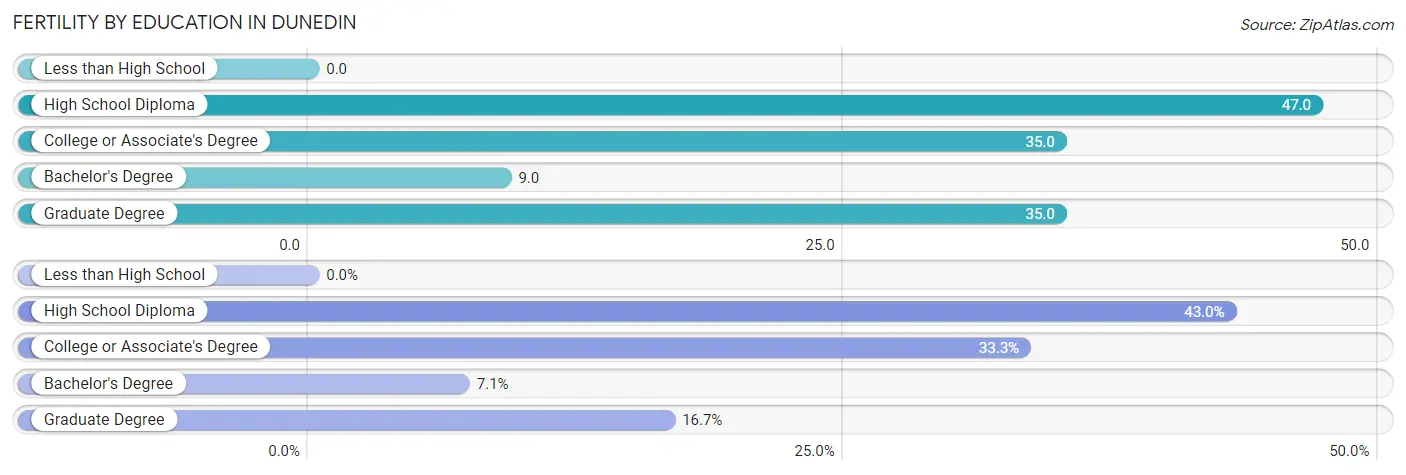
| Educational Attainment | Women with Births | Births / 1,000 Women |
| Less than High School | 0 (0.0%) | 0.0 |
| High School Diploma | 67 (42.9%) | 47.0 |
| College or Associate's Degree | 52 (33.3%) | 35.0 |
| Bachelor's Degree | 11 (7.0%) | 9.0 |
| Graduate Degree | 26 (16.7%) | 35.0 |
| Total | 156 (100.0%) | 28.0 |
Fertility by Education by Marriage Status in Dunedin
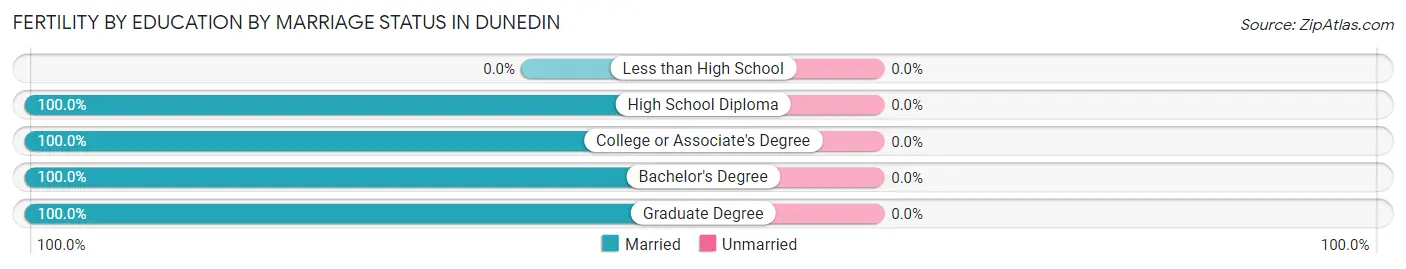
| Educational Attainment | Married | Unmarried |
| Less than High School | 0 (0.0%) | 0 (0.0%) |
| High School Diploma | 67 (100.0%) | 0 (0.0%) |
| College or Associate's Degree | 52 (100.0%) | 0 (0.0%) |
| Bachelor's Degree | 11 (100.0%) | 0 (0.0%) |
| Graduate Degree | 26 (100.0%) | 0 (0.0%) |
| Total | 156 (100.0%) | 0 (0.0%) |
Employment Characteristics in Dunedin
Employment by Class of Employer in Dunedin
Among the 15,753 employed individuals in Dunedin, private company employees (10,262 | 65.1%), not-for-profit organizations (1,473 | 9.3%), and self-employed (not incorporated) (1,217 | 7.7%) make up the most common classes of employment.
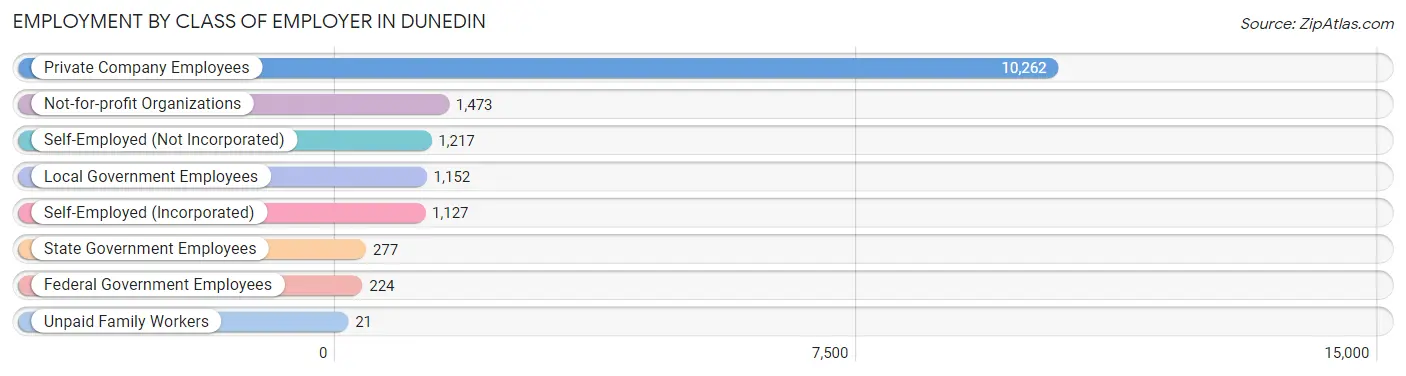
| Employer Class | # Employees | % Employees |
| Private Company Employees | 10,262 | 65.1% |
| Self-Employed (Incorporated) | 1,127 | 7.1% |
| Self-Employed (Not Incorporated) | 1,217 | 7.7% |
| Not-for-profit Organizations | 1,473 | 9.3% |
| Local Government Employees | 1,152 | 7.3% |
| State Government Employees | 277 | 1.8% |
| Federal Government Employees | 224 | 1.4% |
| Unpaid Family Workers | 21 | 0.1% |
| Total | 15,753 | 100.0% |
Employment Status by Age in Dunedin
According to the labor force statistics for Dunedin, out of the total population over 16 years of age (32,175), 52.7% or 16,956 individuals are in the labor force, with 4.7% or 797 of them unemployed. The age group with the highest labor force participation rate is 45 to 54 years, with 86.9% or 3,746 individuals in the labor force. Within the labor force, the 25 to 29 years age range has the highest percentage of unemployed individuals, with 12.4% or 123 of them being unemployed.
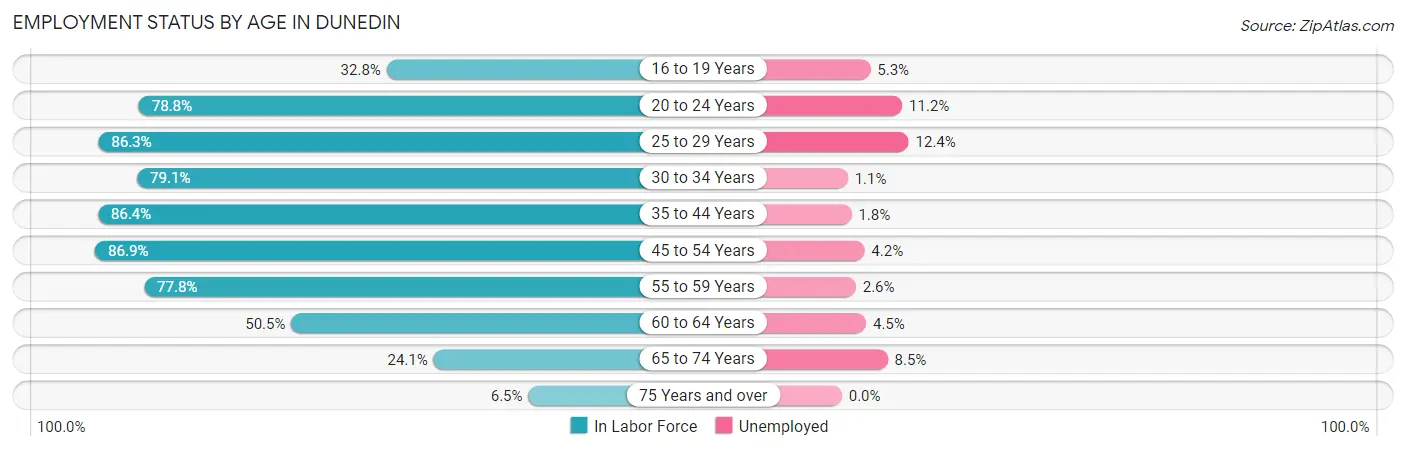
| Age Bracket | In Labor Force | Unemployed |
| 16 to 19 Years | 169 (32.8%) | 9 (5.3%) |
| 20 to 24 Years | 1,223 (78.8%) | 137 (11.2%) |
| 25 to 29 Years | 995 (86.3%) | 123 (12.4%) |
| 30 to 34 Years | 1,462 (79.1%) | 16 (1.1%) |
| 35 to 44 Years | 2,836 (86.4%) | 51 (1.8%) |
| 45 to 54 Years | 3,746 (86.9%) | 157 (4.2%) |
| 55 to 59 Years | 2,762 (77.8%) | 72 (2.6%) |
| 60 to 64 Years | 1,644 (50.5%) | 74 (4.5%) |
| 65 to 74 Years | 1,778 (24.1%) | 151 (8.5%) |
| 75 Years and over | 347 (6.5%) | 0 (0.0%) |
| Total | 16,956 (52.7%) | 797 (4.7%) |
Employment Status by Educational Attainment in Dunedin
According to labor force statistics for Dunedin, 77.3% of individuals (13,449) out of the total population between 25 and 64 years of age (17,399) are in the labor force, with 3.7% or 498 of them being unemployed. The group with the highest labor force participation rate are those with the educational attainment of bachelor's degree or higher, with 83.0% or 5,502 individuals in the labor force. Within the labor force, individuals with less than high school education have the highest percentage of unemployment, with 6.8% or 22 of them being unemployed.
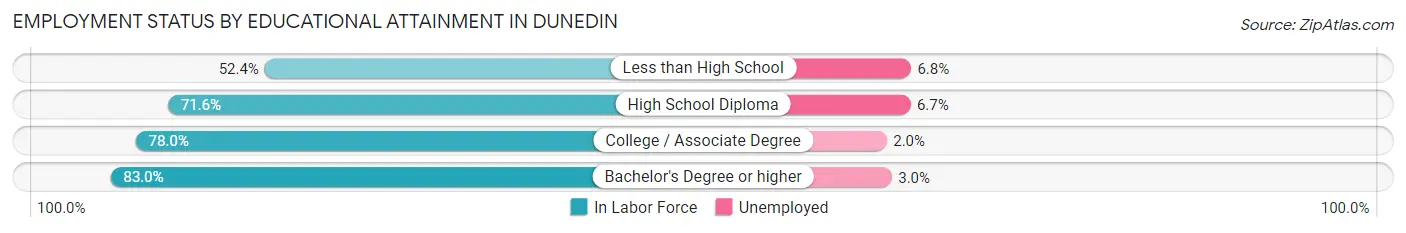
| Educational Attainment | In Labor Force | Unemployed |
| Less than High School | 322 (52.4%) | 42 (6.8%) |
| High School Diploma | 3,332 (71.6%) | 312 (6.7%) |
| College / Associate Degree | 4,292 (78.0%) | 110 (2.0%) |
| Bachelor's Degree or higher | 5,502 (83.0%) | 199 (3.0%) |
| Total | 13,449 (77.3%) | 644 (3.7%) |
Employment Occupations by Sex in Dunedin
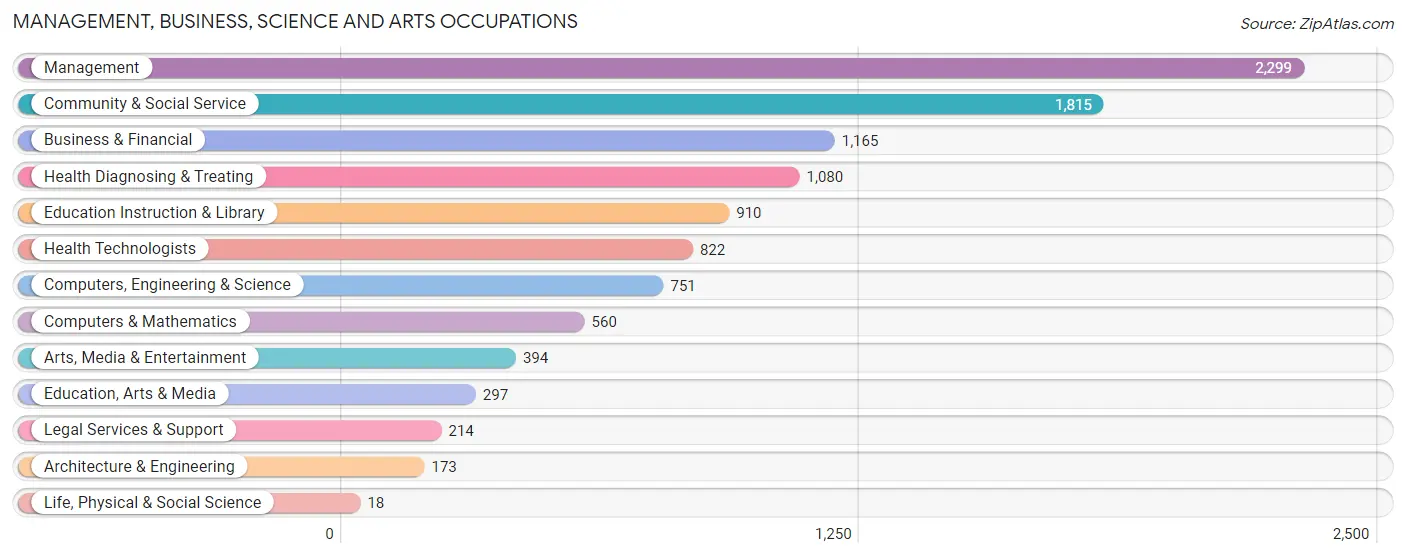
Management, Business, Science and Arts Occupations
The most common Management, Business, Science and Arts occupations in Dunedin are Management (2,299 | 14.3%), Community & Social Service (1,815 | 11.3%), Business & Financial (1,165 | 7.2%), Health Diagnosing & Treating (1,080 | 6.7%), and Education Instruction & Library (910 | 5.7%).
Management, Business, Science and Arts Occupations by Sex
Within the Management, Business, Science and Arts occupations in Dunedin, the most male-oriented occupations are Architecture & Engineering (79.2%), Computers, Engineering & Science (71.0%), and Computers & Mathematics (69.1%), while the most female-oriented occupations are Legal Services & Support (84.1%), Health Diagnosing & Treating (83.2%), and Health Technologists (79.4%).
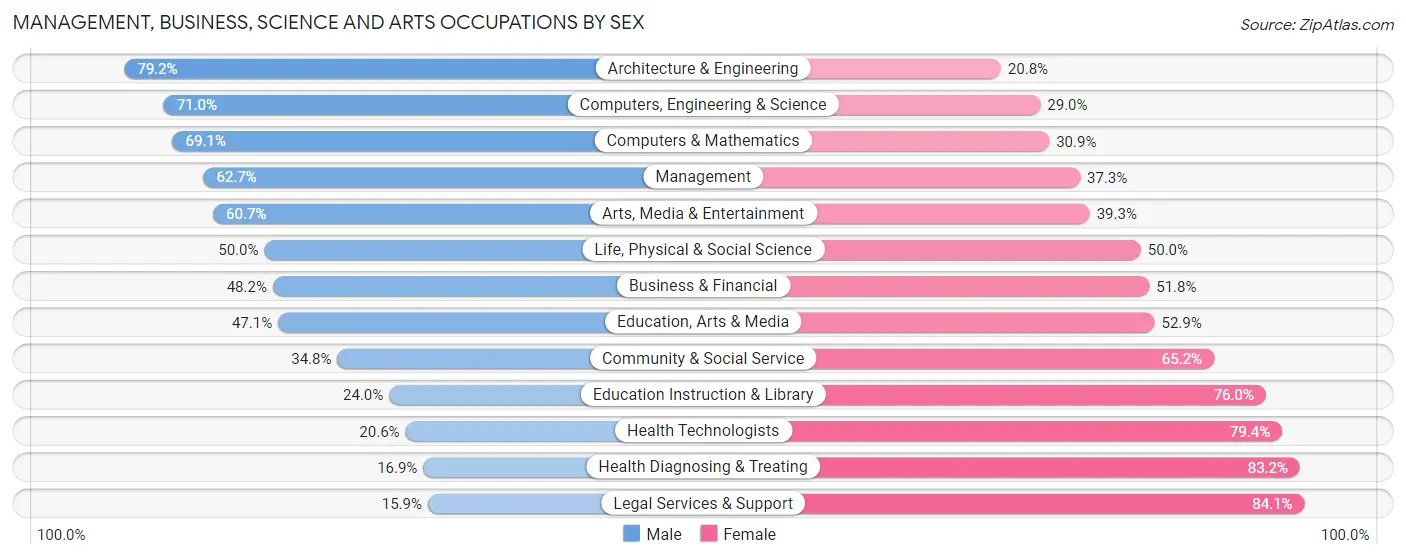
| Occupation | Male | Female |
| Management | 1,441 (62.7%) | 858 (37.3%) |
| Business & Financial | 562 (48.2%) | 603 (51.8%) |
| Computers, Engineering & Science | 533 (71.0%) | 218 (29.0%) |
| Computers & Mathematics | 387 (69.1%) | 173 (30.9%) |
| Architecture & Engineering | 137 (79.2%) | 36 (20.8%) |
| Life, Physical & Social Science | 9 (50.0%) | 9 (50.0%) |
| Community & Social Service | 631 (34.8%) | 1,184 (65.2%) |
| Education, Arts & Media | 140 (47.1%) | 157 (52.9%) |
| Legal Services & Support | 34 (15.9%) | 180 (84.1%) |
| Education Instruction & Library | 218 (24.0%) | 692 (76.0%) |
| Arts, Media & Entertainment | 239 (60.7%) | 155 (39.3%) |
| Health Diagnosing & Treating | 182 (16.9%) | 898 (83.2%) |
| Health Technologists | 169 (20.6%) | 653 (79.4%) |
| Total (Category) | 3,349 (47.1%) | 3,761 (52.9%) |
| Total (Overall) | 8,199 (50.9%) | 7,912 (49.1%) |
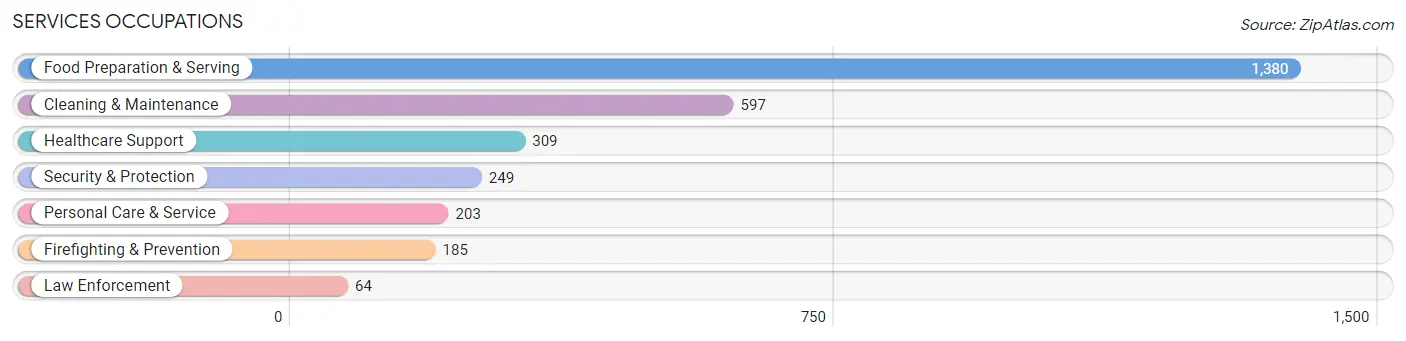
Services Occupations
The most common Services occupations in Dunedin are Food Preparation & Serving (1,380 | 8.6%), Cleaning & Maintenance (597 | 3.7%), Healthcare Support (309 | 1.9%), Security & Protection (249 | 1.5%), and Personal Care & Service (203 | 1.3%).
Services Occupations by Sex
Within the Services occupations in Dunedin, the most male-oriented occupations are Firefighting & Prevention (73.5%), Security & Protection (70.7%), and Law Enforcement (62.5%), while the most female-oriented occupations are Healthcare Support (97.1%), Personal Care & Service (73.9%), and Food Preparation & Serving (46.8%).
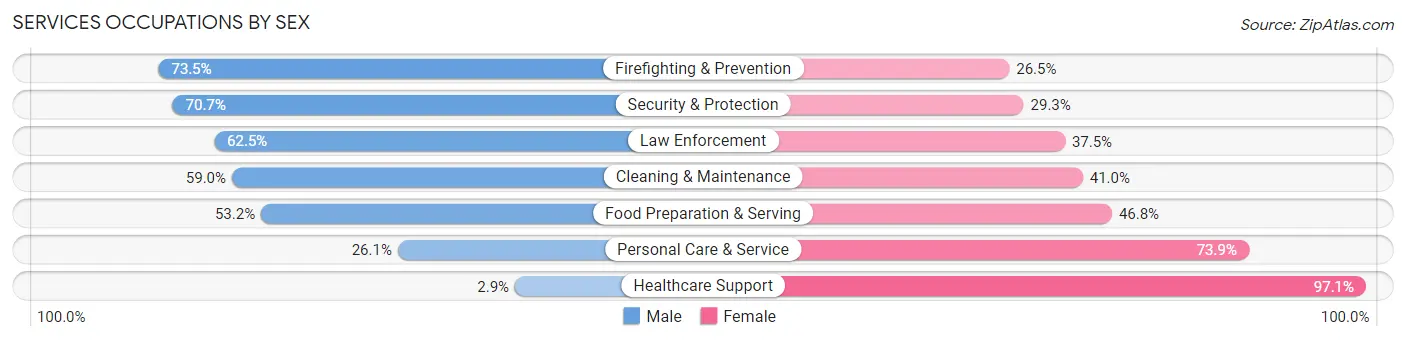
| Occupation | Male | Female |
| Healthcare Support | 9 (2.9%) | 300 (97.1%) |
| Security & Protection | 176 (70.7%) | 73 (29.3%) |
| Firefighting & Prevention | 136 (73.5%) | 49 (26.5%) |
| Law Enforcement | 40 (62.5%) | 24 (37.5%) |
| Food Preparation & Serving | 734 (53.2%) | 646 (46.8%) |
| Cleaning & Maintenance | 352 (59.0%) | 245 (41.0%) |
| Personal Care & Service | 53 (26.1%) | 150 (73.9%) |
| Total (Category) | 1,324 (48.4%) | 1,414 (51.6%) |
| Total (Overall) | 8,199 (50.9%) | 7,912 (49.1%) |
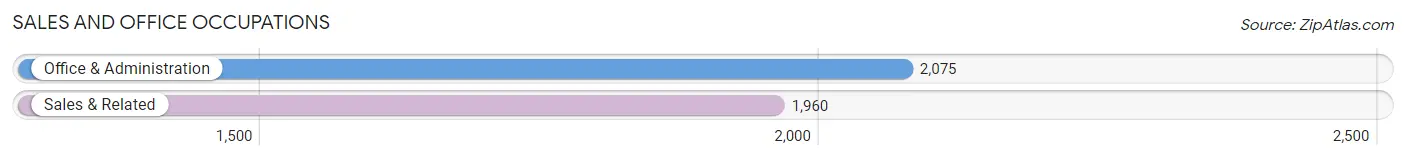
Sales and Office Occupations
The most common Sales and Office occupations in Dunedin are Office & Administration (2,075 | 12.9%), and Sales & Related (1,960 | 12.2%).
Sales and Office Occupations by Sex
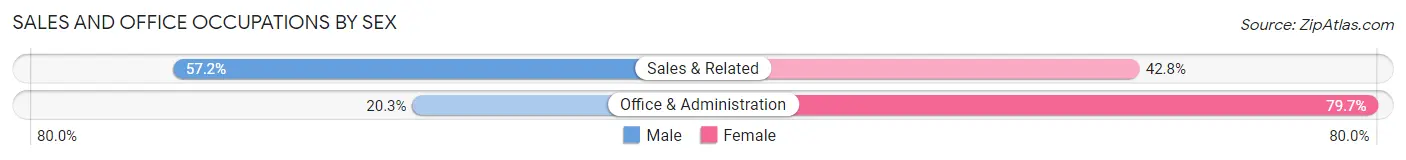
| Occupation | Male | Female |
| Sales & Related | 1,121 (57.2%) | 839 (42.8%) |
| Office & Administration | 422 (20.3%) | 1,653 (79.7%) |
| Total (Category) | 1,543 (38.2%) | 2,492 (61.8%) |
| Total (Overall) | 8,199 (50.9%) | 7,912 (49.1%) |
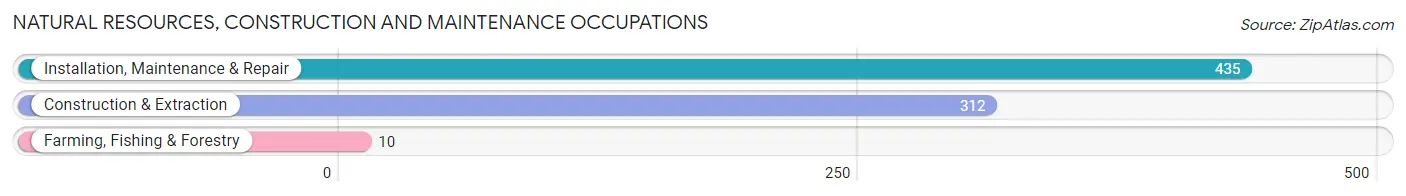
Natural Resources, Construction and Maintenance Occupations
The most common Natural Resources, Construction and Maintenance occupations in Dunedin are Installation, Maintenance & Repair (435 | 2.7%), Construction & Extraction (312 | 1.9%), and Farming, Fishing & Forestry (10 | 0.1%).
Natural Resources, Construction and Maintenance Occupations by Sex
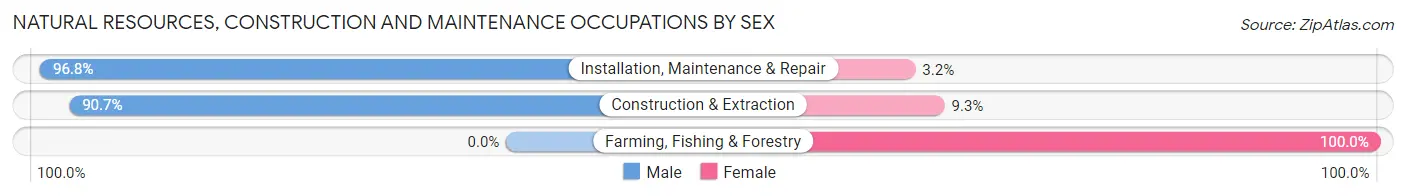
| Occupation | Male | Female |
| Farming, Fishing & Forestry | 0 (0.0%) | 10 (100.0%) |
| Construction & Extraction | 283 (90.7%) | 29 (9.3%) |
| Installation, Maintenance & Repair | 421 (96.8%) | 14 (3.2%) |
| Total (Category) | 704 (93.0%) | 53 (7.0%) |
| Total (Overall) | 8,199 (50.9%) | 7,912 (49.1%) |
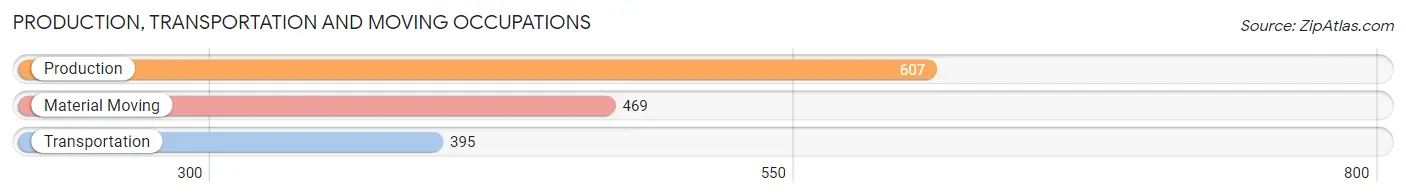
Production, Transportation and Moving Occupations
The most common Production, Transportation and Moving occupations in Dunedin are Production (607 | 3.8%), Material Moving (469 | 2.9%), and Transportation (395 | 2.5%).
Production, Transportation and Moving Occupations by Sex
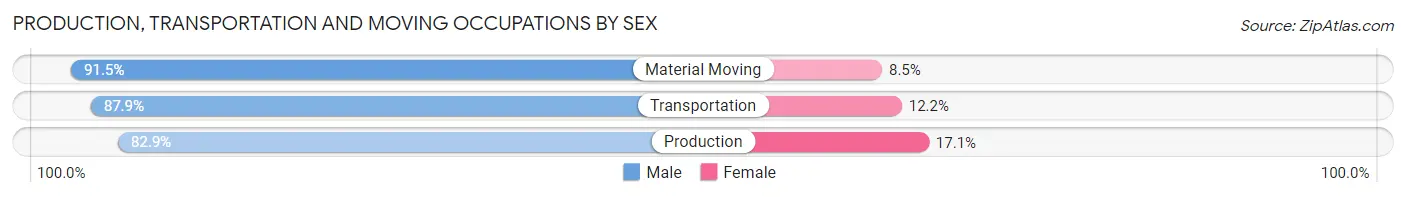
| Occupation | Male | Female |
| Production | 503 (82.9%) | 104 (17.1%) |
| Transportation | 347 (87.8%) | 48 (12.1%) |
| Material Moving | 429 (91.5%) | 40 (8.5%) |
| Total (Category) | 1,279 (87.0%) | 192 (13.1%) |
| Total (Overall) | 8,199 (50.9%) | 7,912 (49.1%) |
Employment Industries by Sex in Dunedin
Employment Industries in Dunedin
The major employment industries in Dunedin include Health Care & Social Assistance (2,547 | 15.8%), Professional & Scientific (2,047 | 12.7%), Retail Trade (1,977 | 12.3%), Accommodation & Food Services (1,556 | 9.7%), and Educational Services (1,198 | 7.4%).
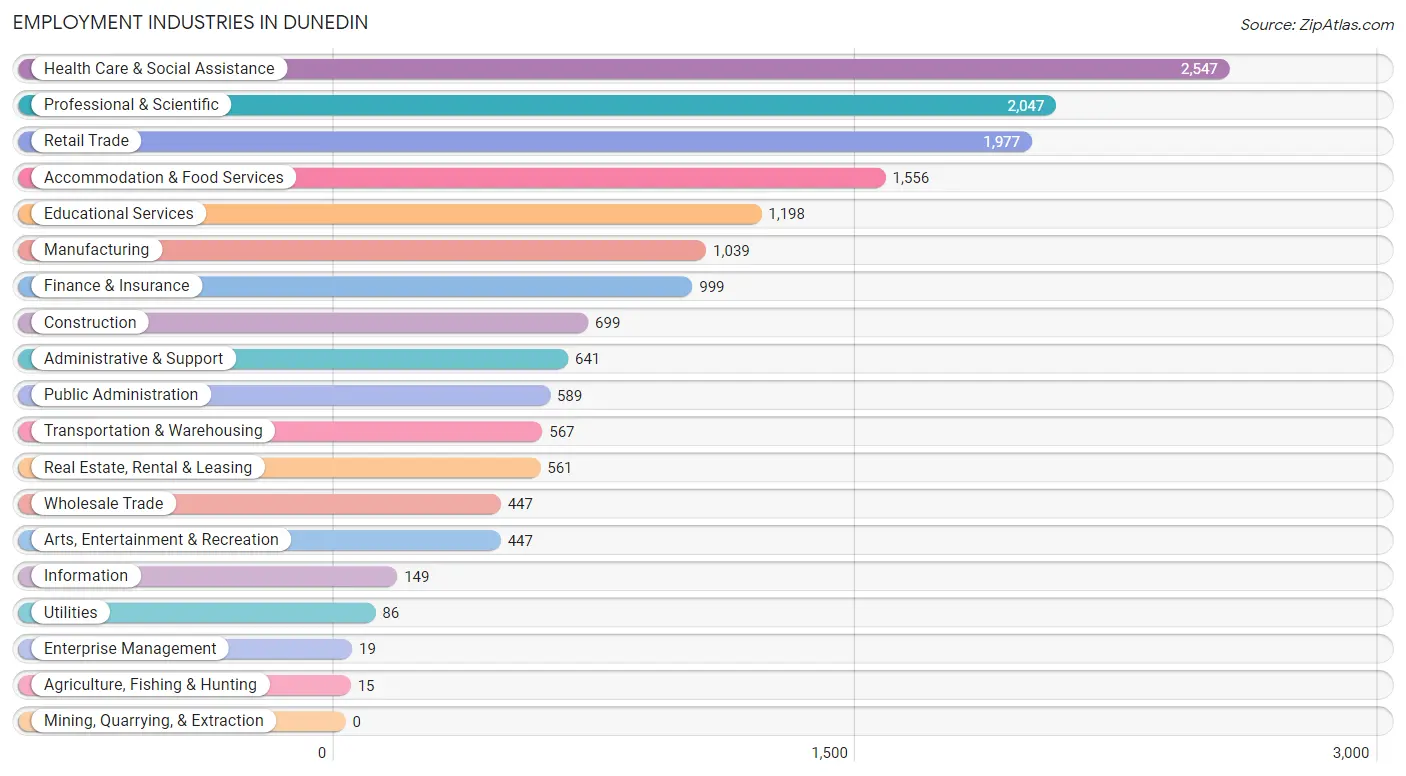
Employment Industries by Sex in Dunedin
The Dunedin industries that see more men than women are Construction (96.7%), Wholesale Trade (81.2%), and Arts, Entertainment & Recreation (79.4%), whereas the industries that tend to have a higher number of women are Agriculture, Fishing & Hunting (100.0%), Enterprise Management (100.0%), and Health Care & Social Assistance (76.4%).
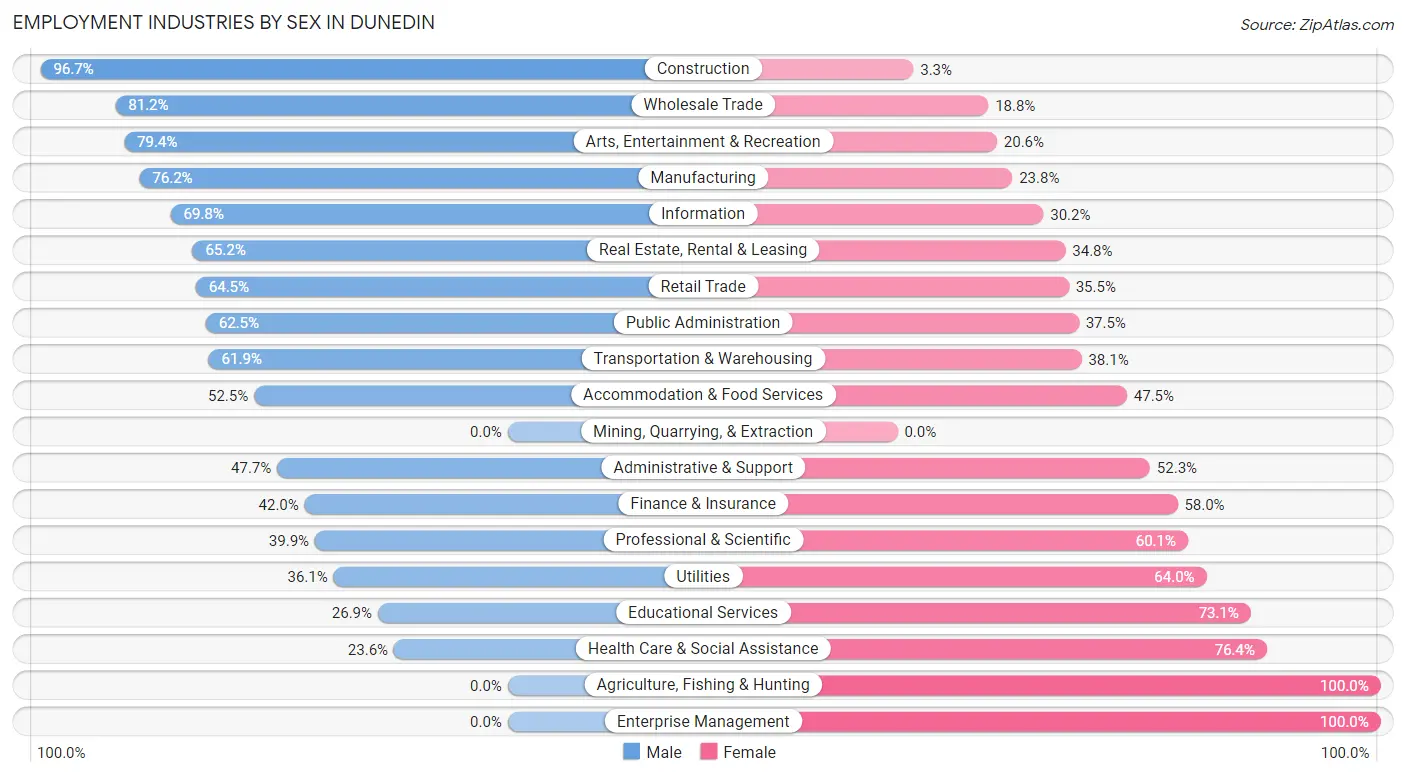
| Industry | Male | Female |
| Agriculture, Fishing & Hunting | 0 (0.0%) | 15 (100.0%) |
| Mining, Quarrying, & Extraction | 0 (0.0%) | 0 (0.0%) |
| Construction | 676 (96.7%) | 23 (3.3%) |
| Manufacturing | 792 (76.2%) | 247 (23.8%) |
| Wholesale Trade | 363 (81.2%) | 84 (18.8%) |
| Retail Trade | 1,276 (64.5%) | 701 (35.5%) |
| Transportation & Warehousing | 351 (61.9%) | 216 (38.1%) |
| Utilities | 31 (36.0%) | 55 (63.9%) |
| Information | 104 (69.8%) | 45 (30.2%) |
| Finance & Insurance | 420 (42.0%) | 579 (58.0%) |
| Real Estate, Rental & Leasing | 366 (65.2%) | 195 (34.8%) |
| Professional & Scientific | 817 (39.9%) | 1,230 (60.1%) |
| Enterprise Management | 0 (0.0%) | 19 (100.0%) |
| Administrative & Support | 306 (47.7%) | 335 (52.3%) |
| Educational Services | 322 (26.9%) | 876 (73.1%) |
| Health Care & Social Assistance | 600 (23.6%) | 1,947 (76.4%) |
| Arts, Entertainment & Recreation | 355 (79.4%) | 92 (20.6%) |
| Accommodation & Food Services | 817 (52.5%) | 739 (47.5%) |
| Public Administration | 368 (62.5%) | 221 (37.5%) |
| Total | 8,199 (50.9%) | 7,912 (49.1%) |
Education in Dunedin
School Enrollment in Dunedin
The most common levels of schooling among the 4,299 students in Dunedin are elementary school (935 | 21.7%), middle school (930 | 21.6%), and high school (880 | 20.5%).
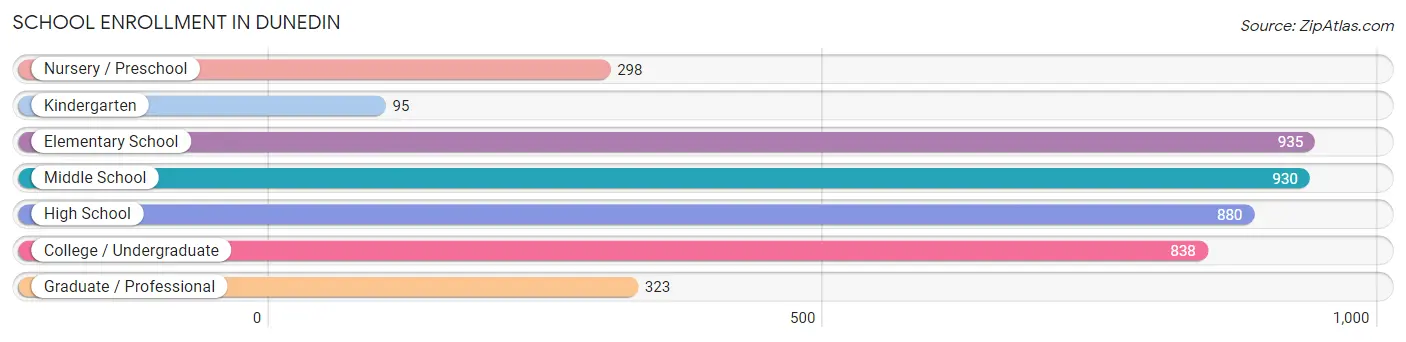
| School Level | # Students | % Students |
| Nursery / Preschool | 298 | 6.9% |
| Kindergarten | 95 | 2.2% |
| Elementary School | 935 | 21.7% |
| Middle School | 930 | 21.6% |
| High School | 880 | 20.5% |
| College / Undergraduate | 838 | 19.5% |
| Graduate / Professional | 323 | 7.5% |
| Total | 4,299 | 100.0% |
School Enrollment by Age by Funding Source in Dunedin
Out of a total of 4,299 students who are enrolled in schools in Dunedin, 984 (22.9%) attend a private institution, while the remaining 3,315 (77.1%) are enrolled in public schools. The age group of 3 to 4 year olds has the highest likelihood of being enrolled in private schools, with 142 (78.0% in the age bracket) enrolled. Conversely, the age group of 18 to 19 year olds has the lowest likelihood of being enrolled in a private school, with 118 (100.0% in the age bracket) attending a public institution.
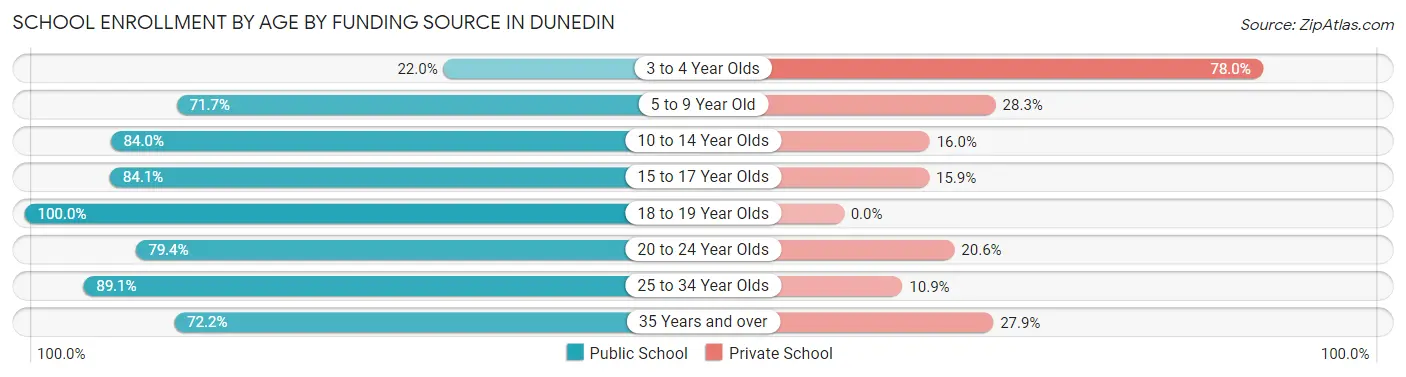
| Age Bracket | Public School | Private School |
| 3 to 4 Year Olds | 40 (22.0%) | 142 (78.0%) |
| 5 to 9 Year Old | 780 (71.7%) | 308 (28.3%) |
| 10 to 14 Year Olds | 875 (84.0%) | 167 (16.0%) |
| 15 to 17 Year Olds | 603 (84.1%) | 114 (15.9%) |
| 18 to 19 Year Olds | 118 (100.0%) | 0 (0.0%) |
| 20 to 24 Year Olds | 400 (79.4%) | 104 (20.6%) |
| 25 to 34 Year Olds | 171 (89.1%) | 21 (10.9%) |
| 35 Years and over | 329 (72.2%) | 127 (27.9%) |
| Total | 3,315 (77.1%) | 984 (22.9%) |
Educational Attainment by Field of Study in Dunedin
Business (2,544 | 21.6%), education (1,781 | 15.2%), science & technology (1,198 | 10.2%), social sciences (773 | 6.6%), and arts & humanities (729 | 6.2%) are the most common fields of study among 11,748 individuals in Dunedin who have obtained a bachelor's degree or higher.
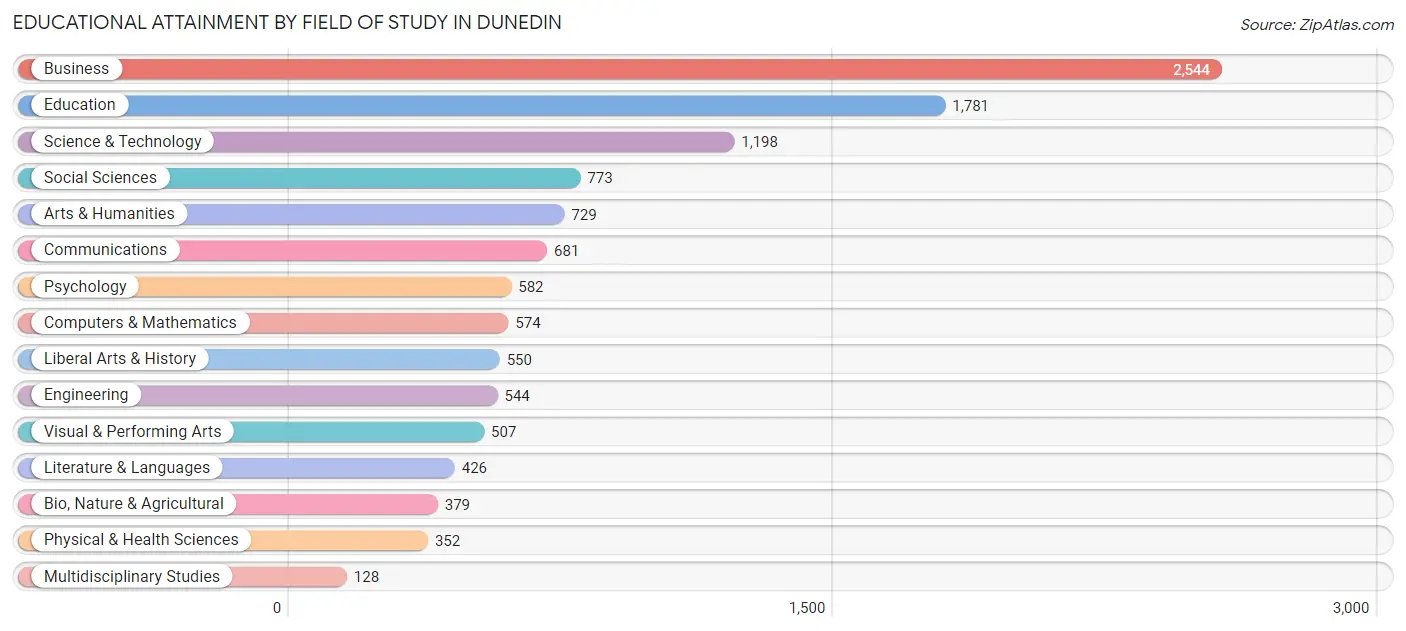
| Field of Study | # Graduates | % Graduates |
| Computers & Mathematics | 574 | 4.9% |
| Bio, Nature & Agricultural | 379 | 3.2% |
| Physical & Health Sciences | 352 | 3.0% |
| Psychology | 582 | 5.0% |
| Social Sciences | 773 | 6.6% |
| Engineering | 544 | 4.6% |
| Multidisciplinary Studies | 128 | 1.1% |
| Science & Technology | 1,198 | 10.2% |
| Business | 2,544 | 21.6% |
| Education | 1,781 | 15.2% |
| Literature & Languages | 426 | 3.6% |
| Liberal Arts & History | 550 | 4.7% |
| Visual & Performing Arts | 507 | 4.3% |
| Communications | 681 | 5.8% |
| Arts & Humanities | 729 | 6.2% |
| Total | 11,748 | 100.0% |
Transportation & Commute in Dunedin
Vehicle Availability by Sex in Dunedin
The most prevalent vehicle ownership categories in Dunedin are males with 2 vehicles (4,181, accounting for 52.0%) and females with 2 vehicles (3,618, making up 54.4%).
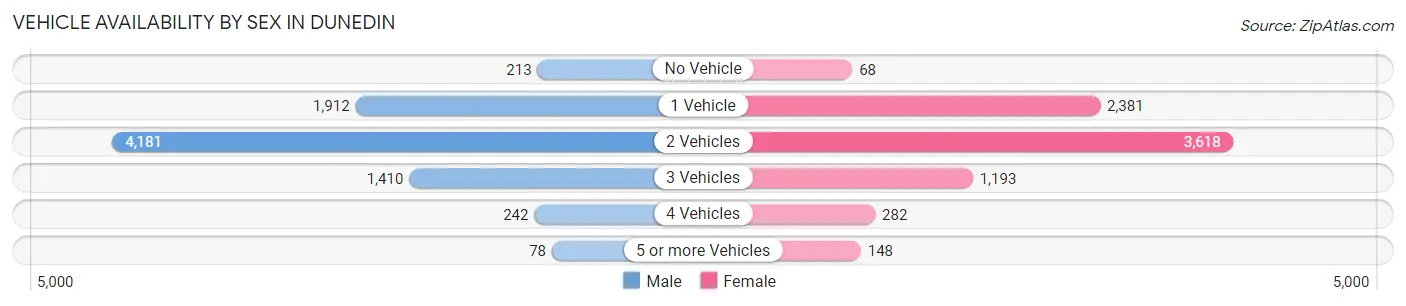
| Vehicles Available | Male | Female |
| No Vehicle | 213 (2.6%) | 68 (0.9%) |
| 1 Vehicle | 1,912 (23.8%) | 2,381 (31.0%) |
| 2 Vehicles | 4,181 (52.0%) | 3,618 (47.0%) |
| 3 Vehicles | 1,410 (17.5%) | 1,193 (15.5%) |
| 4 Vehicles | 242 (3.0%) | 282 (3.7%) |
| 5 or more Vehicles | 78 (1.0%) | 148 (1.9%) |
| Total | 8,036 (100.0%) | 7,690 (100.0%) |
Commute Time in Dunedin
The most frequently occuring commute durations in Dunedin are 15 to 19 minutes (2,584 commuters, 19.7%), 30 to 34 minutes (1,899 commuters, 14.4%), and 10 to 14 minutes (1,879 commuters, 14.3%).
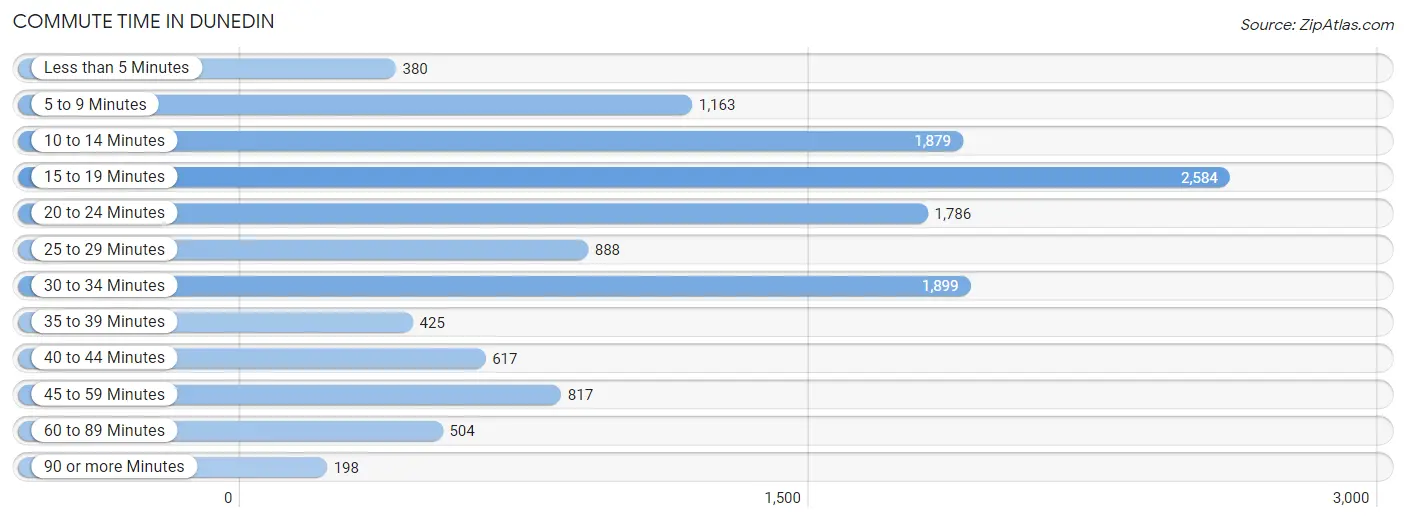
| Commute Time | # Commuters | % Commuters |
| Less than 5 Minutes | 380 | 2.9% |
| 5 to 9 Minutes | 1,163 | 8.8% |
| 10 to 14 Minutes | 1,879 | 14.3% |
| 15 to 19 Minutes | 2,584 | 19.7% |
| 20 to 24 Minutes | 1,786 | 13.6% |
| 25 to 29 Minutes | 888 | 6.8% |
| 30 to 34 Minutes | 1,899 | 14.4% |
| 35 to 39 Minutes | 425 | 3.2% |
| 40 to 44 Minutes | 617 | 4.7% |
| 45 to 59 Minutes | 817 | 6.2% |
| 60 to 89 Minutes | 504 | 3.8% |
| 90 or more Minutes | 198 | 1.5% |
Commute Time by Sex in Dunedin
The most common commute times in Dunedin are 15 to 19 minutes (1,239 commuters, 18.2%) for males and 15 to 19 minutes (1,345 commuters, 21.3%) for females.
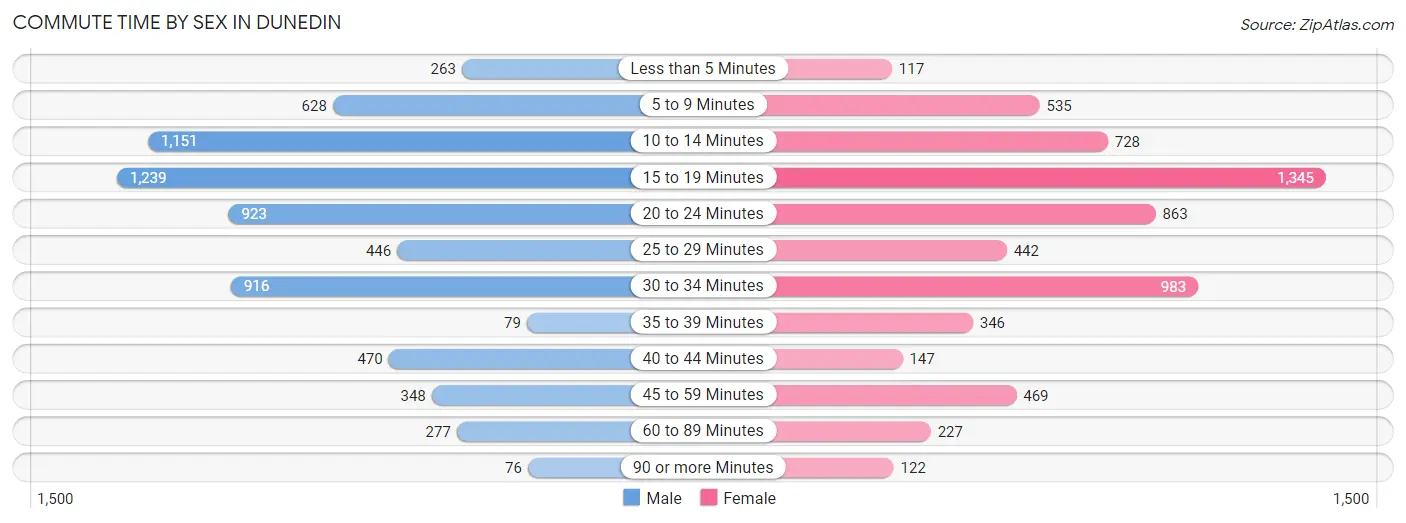
| Commute Time | Male | Female |
| Less than 5 Minutes | 263 (3.9%) | 117 (1.8%) |
| 5 to 9 Minutes | 628 (9.2%) | 535 (8.5%) |
| 10 to 14 Minutes | 1,151 (16.9%) | 728 (11.5%) |
| 15 to 19 Minutes | 1,239 (18.2%) | 1,345 (21.3%) |
| 20 to 24 Minutes | 923 (13.5%) | 863 (13.7%) |
| 25 to 29 Minutes | 446 (6.5%) | 442 (7.0%) |
| 30 to 34 Minutes | 916 (13.4%) | 983 (15.5%) |
| 35 to 39 Minutes | 79 (1.2%) | 346 (5.5%) |
| 40 to 44 Minutes | 470 (6.9%) | 147 (2.3%) |
| 45 to 59 Minutes | 348 (5.1%) | 469 (7.4%) |
| 60 to 89 Minutes | 277 (4.1%) | 227 (3.6%) |
| 90 or more Minutes | 76 (1.1%) | 122 (1.9%) |
Time of Departure to Work by Sex in Dunedin
The most frequent times of departure to work in Dunedin are 7:00 AM to 7:29 AM (808, 11.8%) for males and 7:00 AM to 7:29 AM (1,029, 16.3%) for females.
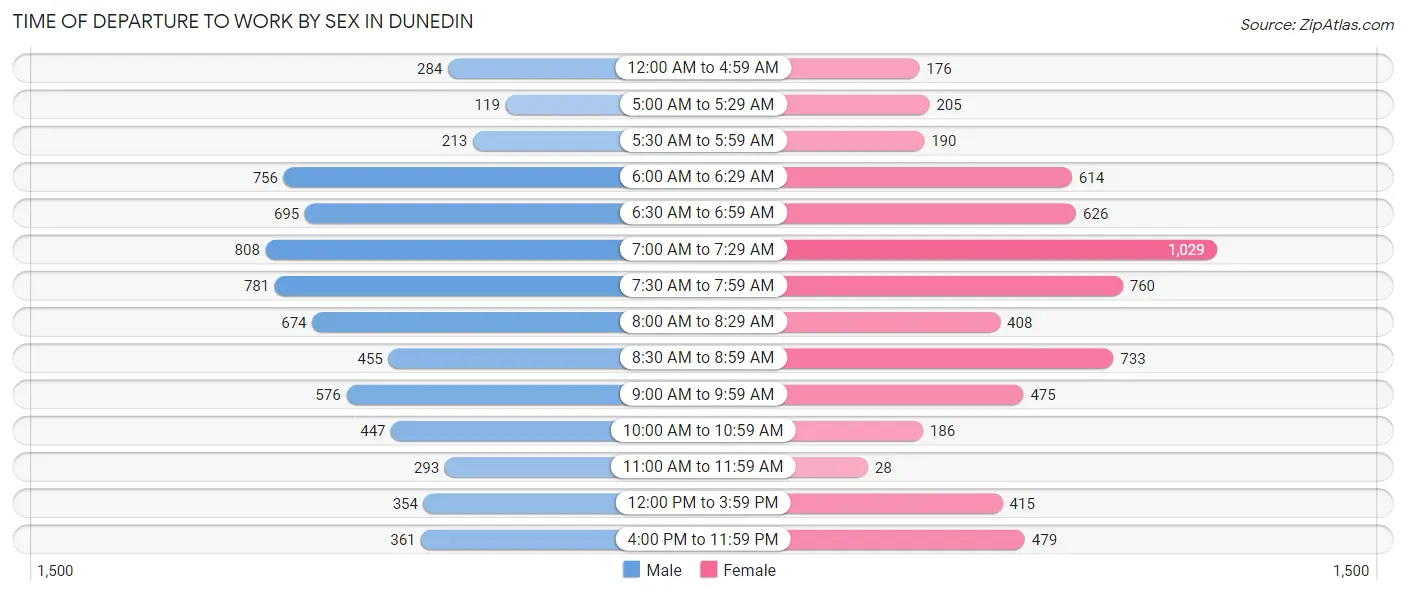
| Time of Departure | Male | Female |
| 12:00 AM to 4:59 AM | 284 (4.2%) | 176 (2.8%) |
| 5:00 AM to 5:29 AM | 119 (1.8%) | 205 (3.2%) |
| 5:30 AM to 5:59 AM | 213 (3.1%) | 190 (3.0%) |
| 6:00 AM to 6:29 AM | 756 (11.1%) | 614 (9.7%) |
| 6:30 AM to 6:59 AM | 695 (10.2%) | 626 (9.9%) |
| 7:00 AM to 7:29 AM | 808 (11.8%) | 1,029 (16.3%) |
| 7:30 AM to 7:59 AM | 781 (11.5%) | 760 (12.0%) |
| 8:00 AM to 8:29 AM | 674 (9.9%) | 408 (6.5%) |
| 8:30 AM to 8:59 AM | 455 (6.7%) | 733 (11.6%) |
| 9:00 AM to 9:59 AM | 576 (8.5%) | 475 (7.5%) |
| 10:00 AM to 10:59 AM | 447 (6.6%) | 186 (2.9%) |
| 11:00 AM to 11:59 AM | 293 (4.3%) | 28 (0.4%) |
| 12:00 PM to 3:59 PM | 354 (5.2%) | 415 (6.6%) |
| 4:00 PM to 11:59 PM | 361 (5.3%) | 479 (7.6%) |
| Total | 6,816 (100.0%) | 6,324 (100.0%) |
Housing Occupancy in Dunedin
Occupancy by Ownership in Dunedin
Of the total 17,506 dwellings in Dunedin, owner-occupied units account for 12,352 (70.6%), while renter-occupied units make up 5,154 (29.4%).
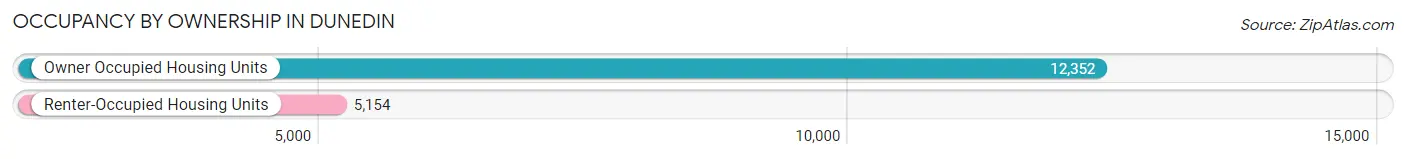
| Occupancy | # Housing Units | % Housing Units |
| Owner Occupied Housing Units | 12,352 | 70.6% |
| Renter-Occupied Housing Units | 5,154 | 29.4% |
| Total Occupied Housing Units | 17,506 | 100.0% |
Occupancy by Household Size in Dunedin
| Household Size | # Housing Units | % Housing Units |
| 1-Person Household | 6,888 | 39.4% |
| 2-Person Household | 7,306 | 41.7% |
| 3-Person Household | 1,741 | 10.0% |
| 4+ Person Household | 1,571 | 9.0% |
| Total Housing Units | 17,506 | 100.0% |
Occupancy by Ownership by Household Size in Dunedin
| Household Size | Owner-occupied | Renter-occupied |
| 1-Person Household | 4,212 (61.2%) | 2,676 (38.9%) |
| 2-Person Household | 5,865 (80.3%) | 1,441 (19.7%) |
| 3-Person Household | 1,160 (66.6%) | 581 (33.4%) |
| 4+ Person Household | 1,115 (71.0%) | 456 (29.0%) |
| Total Housing Units | 12,352 (70.6%) | 5,154 (29.4%) |
Occupancy by Educational Attainment in Dunedin
| Household Size | Owner-occupied | Renter-occupied |
| Less than High School | 509 (60.9%) | 327 (39.1%) |
| High School Diploma | 2,562 (61.0%) | 1,638 (39.0%) |
| College/Associate Degree | 3,901 (69.7%) | 1,693 (30.3%) |
| Bachelor's Degree or higher | 5,380 (78.2%) | 1,496 (21.8%) |
Occupancy by Age of Householder in Dunedin
| Age Bracket | # Households | % Households |
| Under 35 Years | 1,331 | 7.6% |
| 35 to 44 Years | 1,724 | 9.9% |
| 45 to 54 Years | 2,282 | 13.0% |
| 55 to 64 Years | 4,078 | 23.3% |
| 65 to 74 Years | 4,478 | 25.6% |
| 75 to 84 Years | 2,376 | 13.6% |
| 85 Years and Over | 1,237 | 7.1% |
| Total | 17,506 | 100.0% |
Housing Finances in Dunedin
Median Income by Occupancy in Dunedin
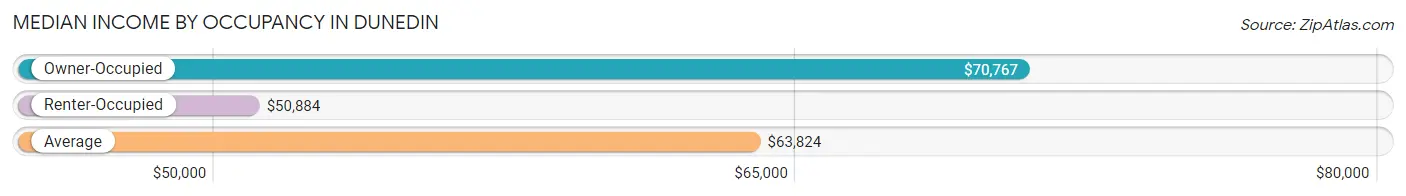
| Occupancy Type | # Households | Median Income |
| Owner-Occupied | 12,352 (70.6%) | $70,767 |
| Renter-Occupied | 5,154 (29.4%) | $50,884 |
| Average | 17,506 (100.0%) | $63,824 |
Occupancy by Householder Income Bracket in Dunedin
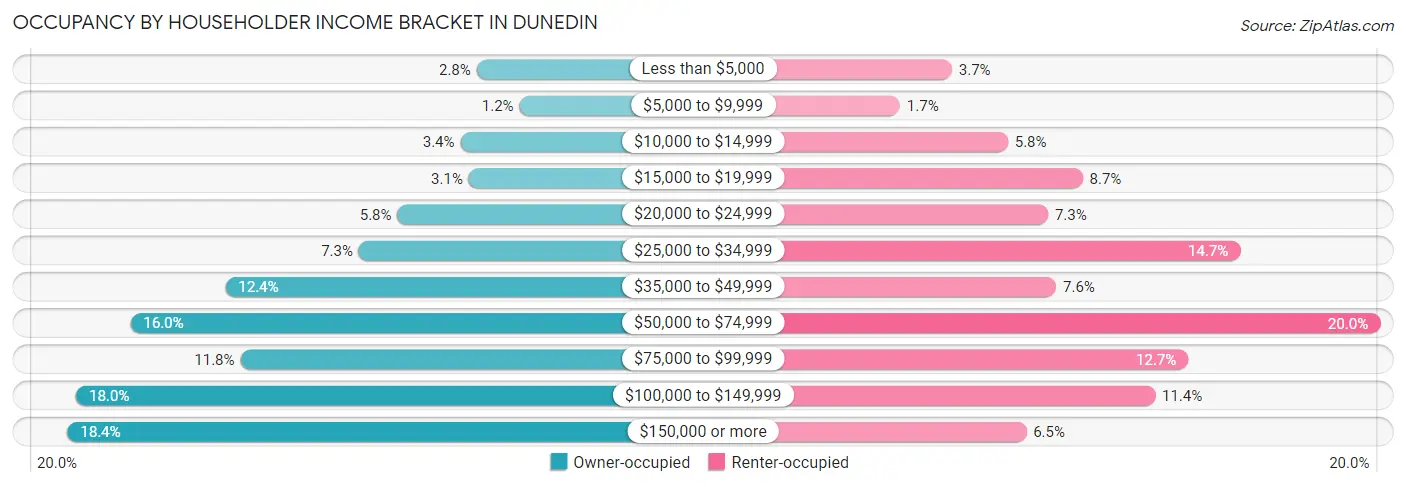
| Income Bracket | Owner-occupied | Renter-occupied |
| Less than $5,000 | 344 (2.8%) | 189 (3.7%) |
| $5,000 to $9,999 | 142 (1.1%) | 87 (1.7%) |
| $10,000 to $14,999 | 420 (3.4%) | 299 (5.8%) |
| $15,000 to $19,999 | 380 (3.1%) | 446 (8.6%) |
| $20,000 to $24,999 | 717 (5.8%) | 378 (7.3%) |
| $25,000 to $34,999 | 898 (7.3%) | 755 (14.6%) |
| $35,000 to $49,999 | 1,526 (12.3%) | 394 (7.6%) |
| $50,000 to $74,999 | 1,973 (16.0%) | 1,030 (20.0%) |
| $75,000 to $99,999 | 1,455 (11.8%) | 653 (12.7%) |
| $100,000 to $149,999 | 2,228 (18.0%) | 588 (11.4%) |
| $150,000 or more | 2,269 (18.4%) | 335 (6.5%) |
| Total | 12,352 (100.0%) | 5,154 (100.0%) |
Monthly Housing Cost Tiers in Dunedin
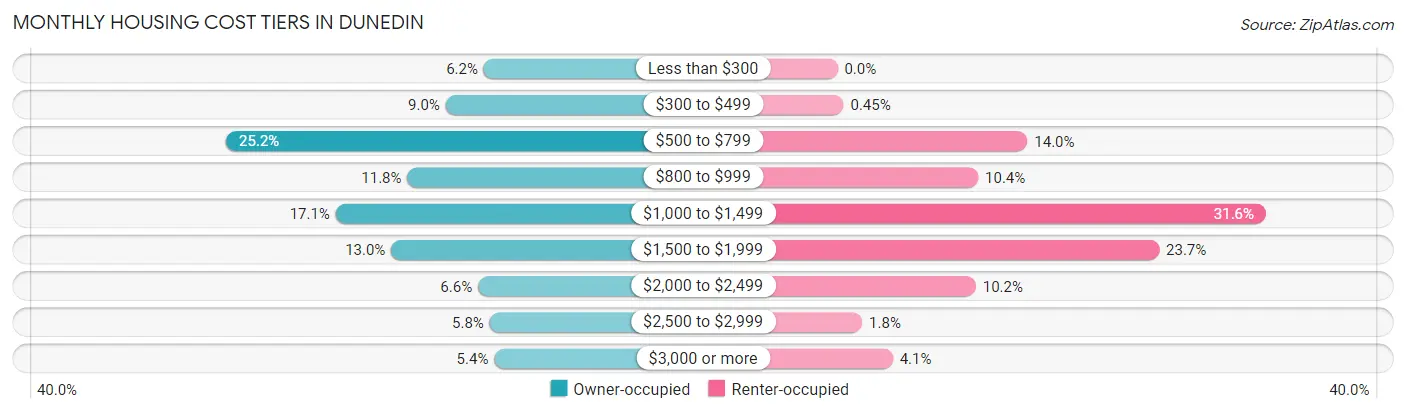
| Monthly Cost | Owner-occupied | Renter-occupied |
| Less than $300 | 763 (6.2%) | 0 (0.0%) |
| $300 to $499 | 1,110 (9.0%) | 23 (0.4%) |
| $500 to $799 | 3,109 (25.2%) | 721 (14.0%) |
| $800 to $999 | 1,459 (11.8%) | 534 (10.4%) |
| $1,000 to $1,499 | 2,111 (17.1%) | 1,626 (31.6%) |
| $1,500 to $1,999 | 1,606 (13.0%) | 1,221 (23.7%) |
| $2,000 to $2,499 | 816 (6.6%) | 525 (10.2%) |
| $2,500 to $2,999 | 710 (5.8%) | 94 (1.8%) |
| $3,000 or more | 668 (5.4%) | 210 (4.1%) |
| Total | 12,352 (100.0%) | 5,154 (100.0%) |
Physical Housing Characteristics in Dunedin
Housing Structures in Dunedin
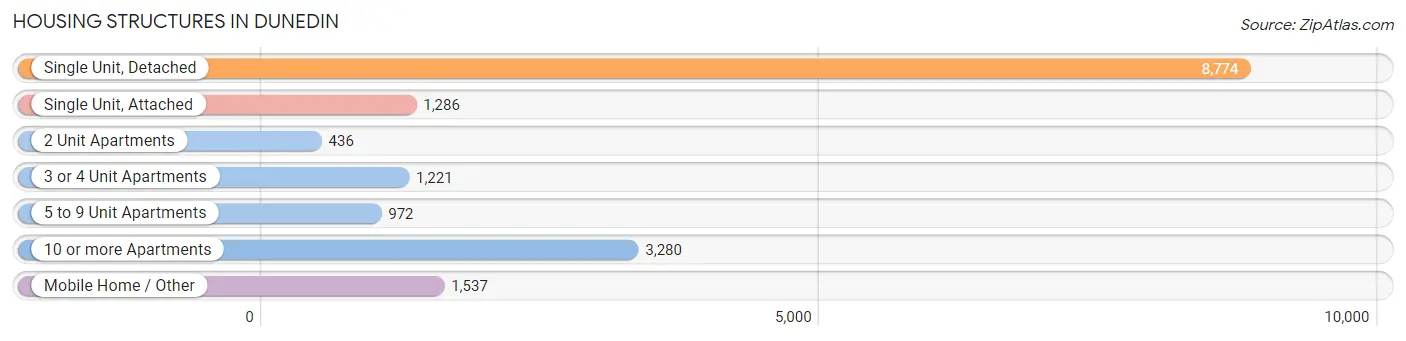
| Structure Type | # Housing Units | % Housing Units |
| Single Unit, Detached | 8,774 | 50.1% |
| Single Unit, Attached | 1,286 | 7.3% |
| 2 Unit Apartments | 436 | 2.5% |
| 3 or 4 Unit Apartments | 1,221 | 7.0% |
| 5 to 9 Unit Apartments | 972 | 5.6% |
| 10 or more Apartments | 3,280 | 18.7% |
| Mobile Home / Other | 1,537 | 8.8% |
| Total | 17,506 | 100.0% |
Housing Structures by Occupancy in Dunedin
| Structure Type | Owner-occupied | Renter-occupied |
| Single Unit, Detached | 7,835 (89.3%) | 939 (10.7%) |
| Single Unit, Attached | 973 (75.7%) | 313 (24.3%) |
| 2 Unit Apartments | 12 (2.8%) | 424 (97.3%) |
| 3 or 4 Unit Apartments | 339 (27.8%) | 882 (72.2%) |
| 5 to 9 Unit Apartments | 378 (38.9%) | 594 (61.1%) |
| 10 or more Apartments | 1,581 (48.2%) | 1,699 (51.8%) |
| Mobile Home / Other | 1,234 (80.3%) | 303 (19.7%) |
| Total | 12,352 (70.6%) | 5,154 (29.4%) |
Housing Structures by Number of Rooms in Dunedin
| Number of Rooms | Owner-occupied | Renter-occupied |
| 1 Room | 17 (0.1%) | 392 (7.6%) |
| 2 or 3 Rooms | 694 (5.6%) | 1,950 (37.8%) |
| 4 or 5 Rooms | 5,753 (46.6%) | 1,927 (37.4%) |
| 6 or 7 Rooms | 4,109 (33.3%) | 633 (12.3%) |
| 8 or more Rooms | 1,779 (14.4%) | 252 (4.9%) |
| Total | 12,352 (100.0%) | 5,154 (100.0%) |
Housing Structure by Heating Type in Dunedin
| Heating Type | Owner-occupied | Renter-occupied |
| Utility Gas | 519 (4.2%) | 144 (2.8%) |
| Bottled, Tank, or LP Gas | 76 (0.6%) | 12 (0.2%) |
| Electricity | 11,472 (92.9%) | 4,786 (92.9%) |
| Fuel Oil or Kerosene | 20 (0.2%) | 34 (0.7%) |
| Coal or Coke | 0 (0.0%) | 0 (0.0%) |
| All other Fuels | 124 (1.0%) | 0 (0.0%) |
| No Fuel Used | 141 (1.1%) | 178 (3.5%) |
| Total | 12,352 (100.0%) | 5,154 (100.0%) |
Household Vehicle Usage in Dunedin
| Vehicles per Household | Owner-occupied | Renter-occupied |
| No Vehicle | 479 (3.9%) | 788 (15.3%) |
| 1 Vehicle | 5,528 (44.8%) | 3,006 (58.3%) |
| 2 Vehicles | 4,916 (39.8%) | 1,109 (21.5%) |
| 3 or more Vehicles | 1,429 (11.6%) | 251 (4.9%) |
| Total | 12,352 (100.0%) | 5,154 (100.0%) |
Real Estate & Mortgages in Dunedin
Real Estate and Mortgage Overview in Dunedin
| Characteristic | Without Mortgage | With Mortgage |
| Housing Units | 6,601 | 5,751 |
| Median Property Value | $237,600 | $361,400 |
| Median Household Income | $50,232 | $1,663 |
| Monthly Housing Costs | $602 | $654 |
| Real Estate Taxes | $1,577 | $183 |
Property Value by Mortgage Status in Dunedin
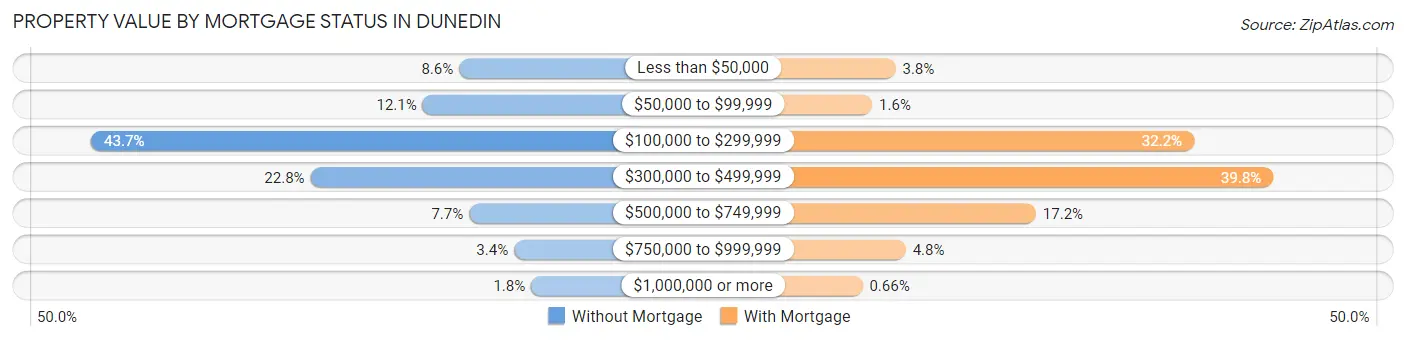
| Property Value | Without Mortgage | With Mortgage |
| Less than $50,000 | 569 (8.6%) | 219 (3.8%) |
| $50,000 to $99,999 | 799 (12.1%) | 91 (1.6%) |
| $100,000 to $299,999 | 2,882 (43.7%) | 1,853 (32.2%) |
| $300,000 to $499,999 | 1,504 (22.8%) | 2,287 (39.8%) |
| $500,000 to $749,999 | 506 (7.7%) | 988 (17.2%) |
| $750,000 to $999,999 | 224 (3.4%) | 275 (4.8%) |
| $1,000,000 or more | 117 (1.8%) | 38 (0.7%) |
| Total | 6,601 (100.0%) | 5,751 (100.0%) |
Household Income by Mortgage Status in Dunedin
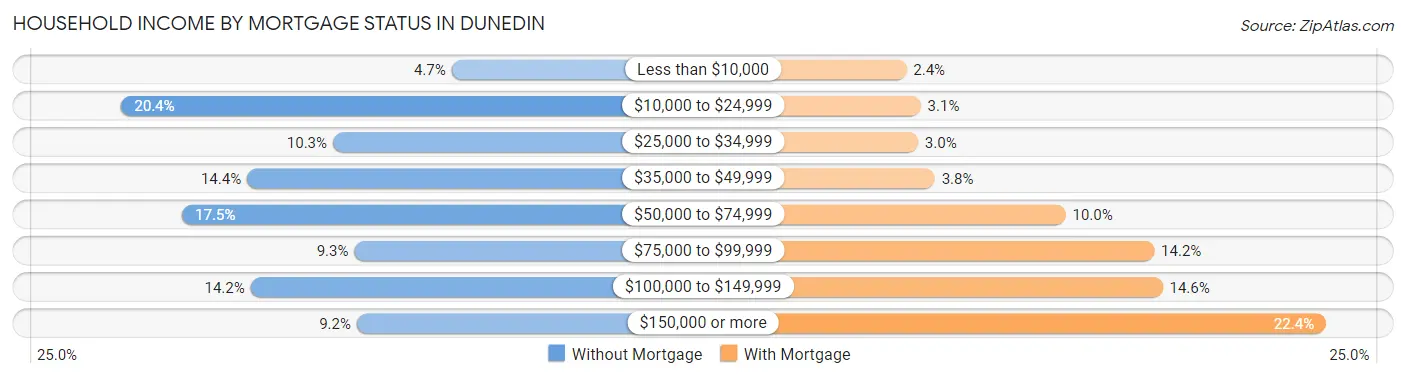
| Household Income | Without Mortgage | With Mortgage |
| Less than $10,000 | 308 (4.7%) | 139 (2.4%) |
| $10,000 to $24,999 | 1,346 (20.4%) | 178 (3.1%) |
| $25,000 to $34,999 | 681 (10.3%) | 171 (3.0%) |
| $35,000 to $49,999 | 951 (14.4%) | 217 (3.8%) |
| $50,000 to $74,999 | 1,155 (17.5%) | 575 (10.0%) |
| $75,000 to $99,999 | 614 (9.3%) | 818 (14.2%) |
| $100,000 to $149,999 | 940 (14.2%) | 841 (14.6%) |
| $150,000 or more | 606 (9.2%) | 1,288 (22.4%) |
| Total | 6,601 (100.0%) | 5,751 (100.0%) |
Property Value to Household Income Ratio in Dunedin
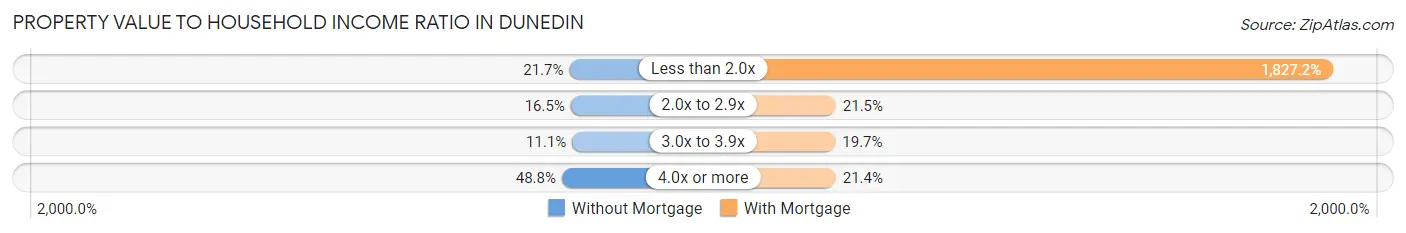
| Value-to-Income Ratio | Without Mortgage | With Mortgage |
| Less than 2.0x | 1,429 (21.6%) | 105,084 (1,827.2%) |
| 2.0x to 2.9x | 1,086 (16.5%) | 1,238 (21.5%) |
| 3.0x to 3.9x | 733 (11.1%) | 1,134 (19.7%) |
| 4.0x or more | 3,221 (48.8%) | 1,229 (21.4%) |
| Total | 6,601 (100.0%) | 5,751 (100.0%) |
Real Estate Taxes by Mortgage Status in Dunedin
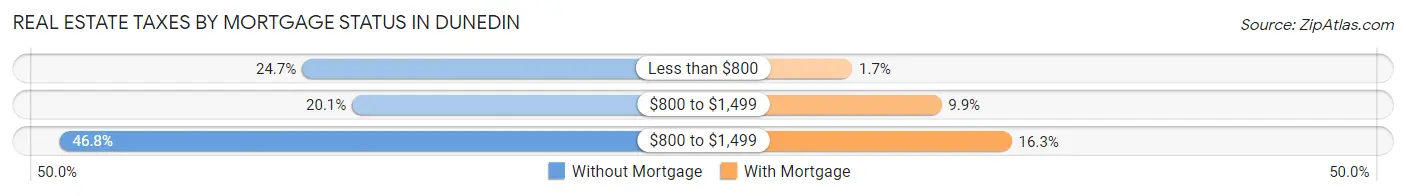
| Property Taxes | Without Mortgage | With Mortgage |
| Less than $800 | 1,628 (24.7%) | 100 (1.7%) |
| $800 to $1,499 | 1,326 (20.1%) | 569 (9.9%) |
| $800 to $1,499 | 3,089 (46.8%) | 938 (16.3%) |
| Total | 6,601 (100.0%) | 5,751 (100.0%) |
Health & Disability in Dunedin
Health Insurance Coverage by Age in Dunedin
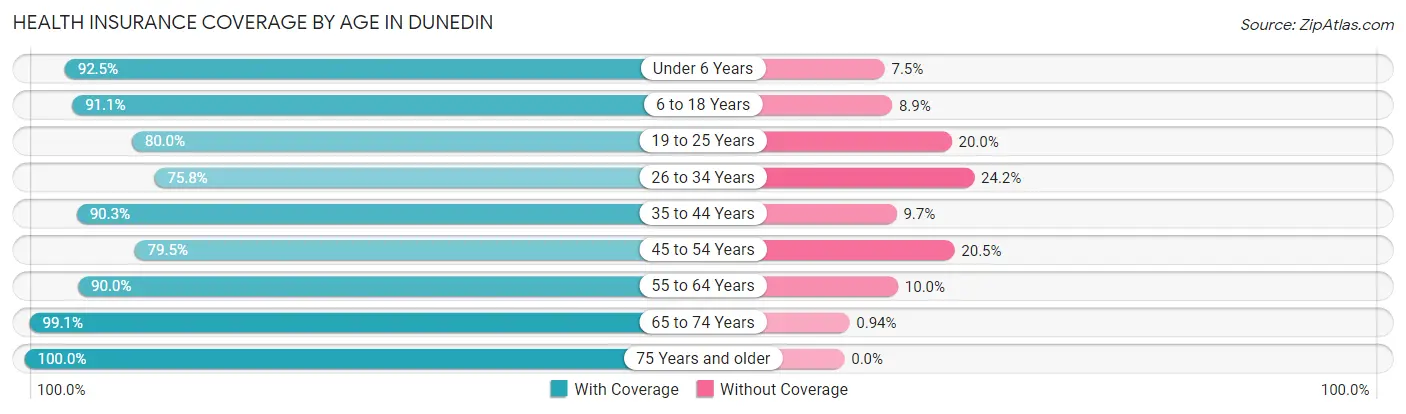
| Age Bracket | With Coverage | Without Coverage |
| Under 6 Years | 1,305 (92.5%) | 106 (7.5%) |
| 6 to 18 Years | 2,716 (91.1%) | 265 (8.9%) |
| 19 to 25 Years | 1,404 (80.0%) | 351 (20.0%) |
| 26 to 34 Years | 2,129 (75.8%) | 680 (24.2%) |
| 35 to 44 Years | 2,932 (90.3%) | 316 (9.7%) |
| 45 to 54 Years | 3,418 (79.5%) | 883 (20.5%) |
| 55 to 64 Years | 6,084 (90.0%) | 675 (10.0%) |
| 65 to 74 Years | 7,195 (99.1%) | 68 (0.9%) |
| 75 Years and older | 4,953 (100.0%) | 0 (0.0%) |
| Total | 32,136 (90.6%) | 3,344 (9.4%) |
Health Insurance Coverage by Citizenship Status in Dunedin
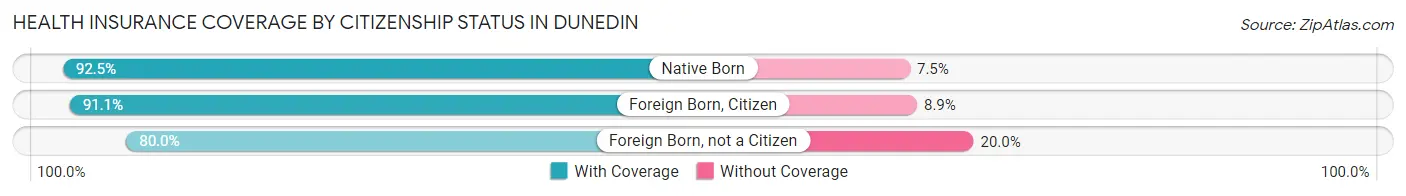
| Citizenship Status | With Coverage | Without Coverage |
| Native Born | 1,305 (92.5%) | 106 (7.5%) |
| Foreign Born, Citizen | 2,716 (91.1%) | 265 (8.9%) |
| Foreign Born, not a Citizen | 1,404 (80.0%) | 351 (20.0%) |
Health Insurance Coverage by Household Income in Dunedin
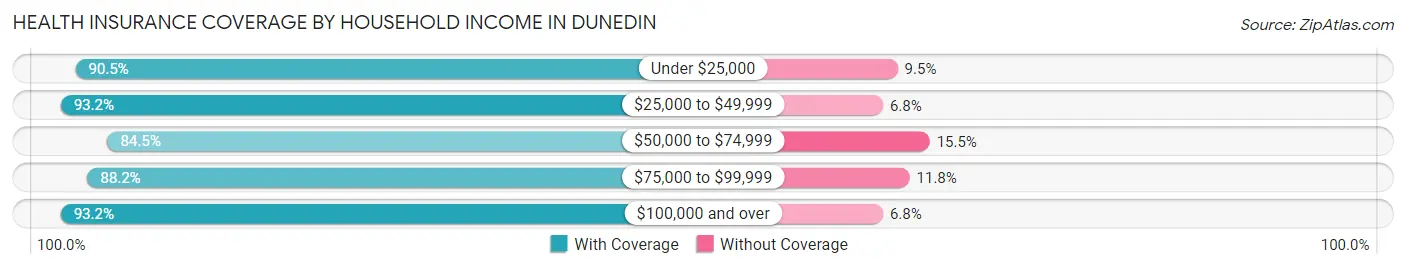
| Household Income | With Coverage | Without Coverage |
| Under $25,000 | 4,119 (90.5%) | 434 (9.5%) |
| $25,000 to $49,999 | 4,910 (93.2%) | 357 (6.8%) |
| $50,000 to $74,999 | 5,577 (84.5%) | 1,025 (15.5%) |
| $75,000 to $99,999 | 4,250 (88.2%) | 567 (11.8%) |
| $100,000 and over | 13,070 (93.2%) | 950 (6.8%) |
Public vs Private Health Insurance Coverage by Age in Dunedin
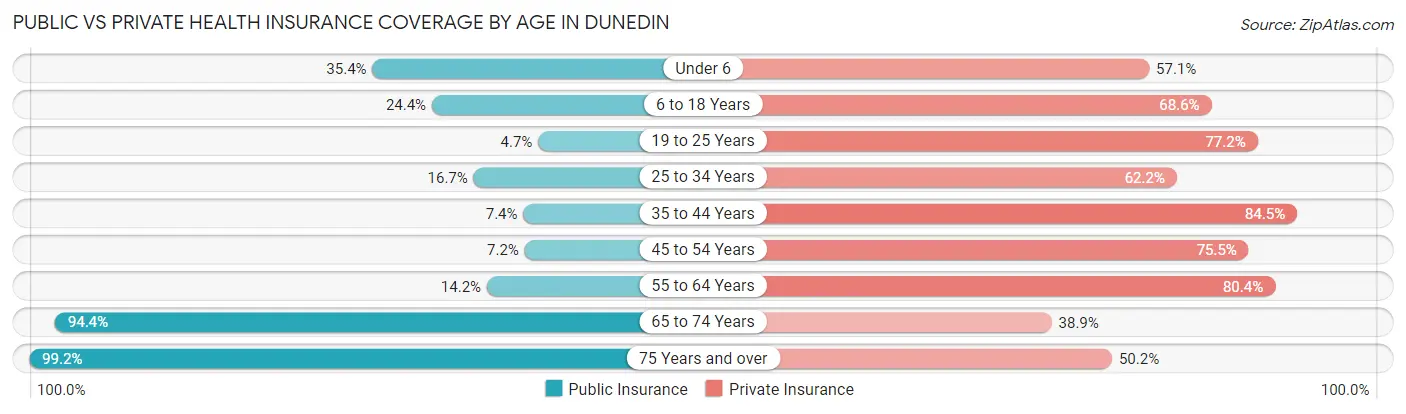
| Age Bracket | Public Insurance | Private Insurance |
| Under 6 | 500 (35.4%) | 805 (57.1%) |
| 6 to 18 Years | 727 (24.4%) | 2,045 (68.6%) |
| 19 to 25 Years | 82 (4.7%) | 1,354 (77.1%) |
| 25 to 34 Years | 468 (16.7%) | 1,746 (62.2%) |
| 35 to 44 Years | 241 (7.4%) | 2,745 (84.5%) |
| 45 to 54 Years | 309 (7.2%) | 3,248 (75.5%) |
| 55 to 64 Years | 959 (14.2%) | 5,434 (80.4%) |
| 65 to 74 Years | 6,855 (94.4%) | 2,828 (38.9%) |
| 75 Years and over | 4,911 (99.2%) | 2,484 (50.1%) |
| Total | 15,052 (42.4%) | 22,689 (63.9%) |
Disability Status by Sex by Age in Dunedin
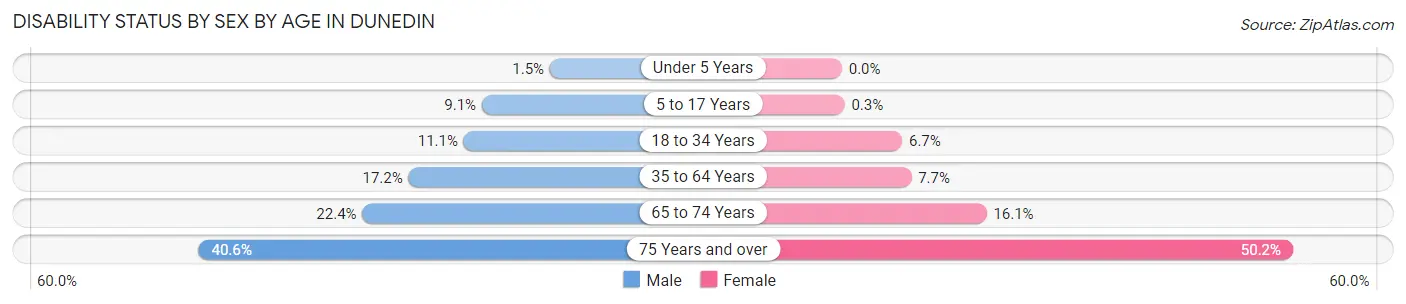
| Age Bracket | Male | Female |
| Under 5 Years | 7 (1.5%) | 0 (0.0%) |
| 5 to 17 Years | 118 (9.1%) | 5 (0.3%) |
| 18 to 34 Years | 296 (11.1%) | 137 (6.7%) |
| 35 to 64 Years | 1,190 (17.2%) | 572 (7.7%) |
| 65 to 74 Years | 727 (22.4%) | 647 (16.1%) |
| 75 Years and over | 845 (40.6%) | 1,443 (50.2%) |
Disability Class by Sex by Age in Dunedin
Disability Class: Hearing Difficulty
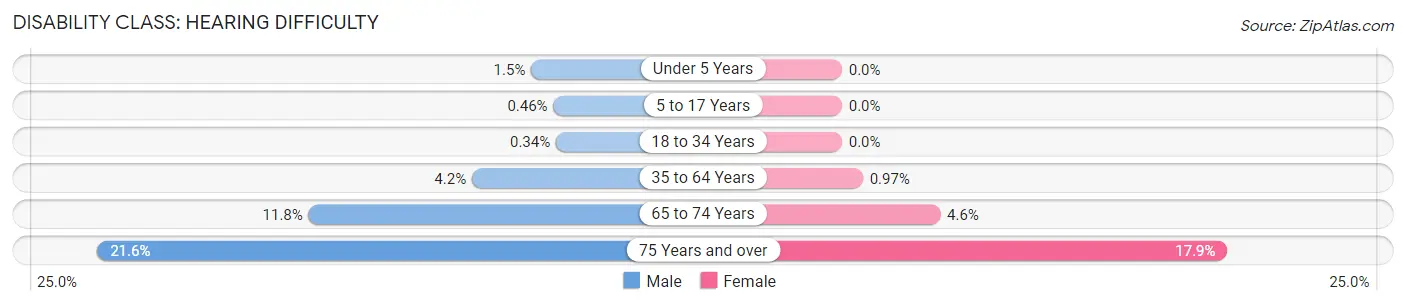
| Age Bracket | Male | Female |
| Under 5 Years | 7 (1.5%) | 0 (0.0%) |
| 5 to 17 Years | 6 (0.5%) | 0 (0.0%) |
| 18 to 34 Years | 9 (0.3%) | 0 (0.0%) |
| 35 to 64 Years | 293 (4.2%) | 72 (1.0%) |
| 65 to 74 Years | 384 (11.8%) | 183 (4.6%) |
| 75 Years and over | 450 (21.6%) | 514 (17.9%) |
Disability Class: Vision Difficulty
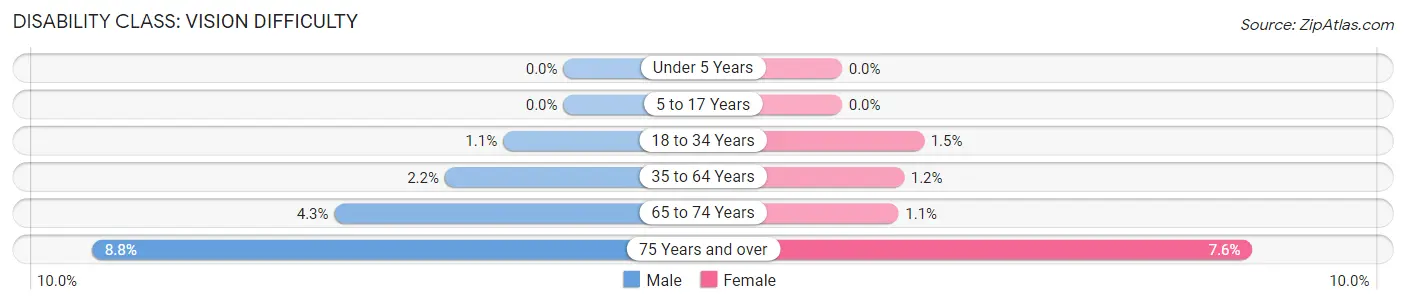
| Age Bracket | Male | Female |
| Under 5 Years | 0 (0.0%) | 0 (0.0%) |
| 5 to 17 Years | 0 (0.0%) | 0 (0.0%) |
| 18 to 34 Years | 30 (1.1%) | 31 (1.5%) |
| 35 to 64 Years | 152 (2.2%) | 85 (1.1%) |
| 65 to 74 Years | 138 (4.3%) | 42 (1.1%) |
| 75 Years and over | 182 (8.7%) | 219 (7.6%) |
Disability Class: Cognitive Difficulty
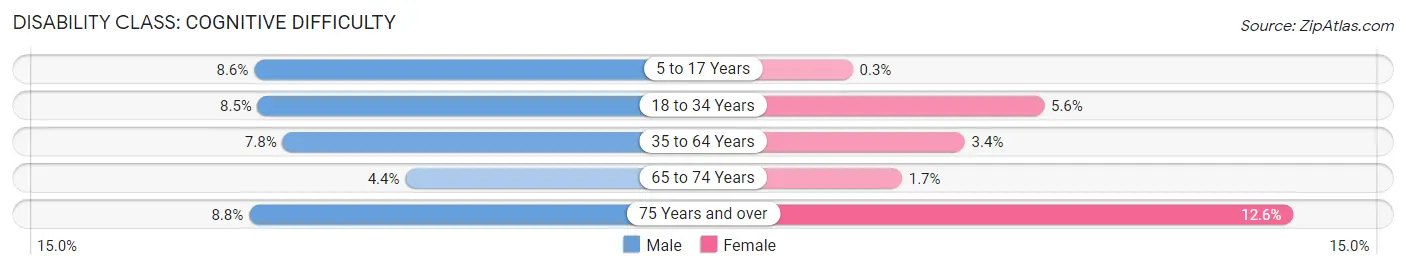
| Age Bracket | Male | Female |
| 5 to 17 Years | 112 (8.6%) | 5 (0.3%) |
| 18 to 34 Years | 227 (8.5%) | 115 (5.6%) |
| 35 to 64 Years | 540 (7.8%) | 253 (3.4%) |
| 65 to 74 Years | 143 (4.4%) | 67 (1.7%) |
| 75 Years and over | 182 (8.7%) | 361 (12.6%) |
Disability Class: Ambulatory Difficulty
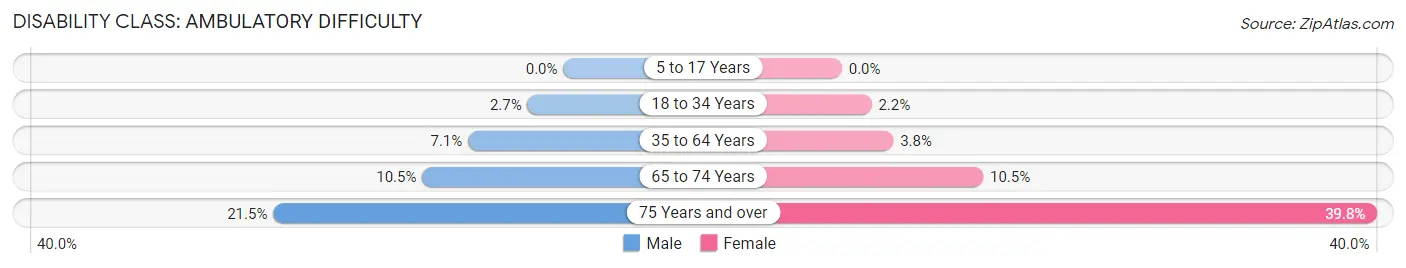
| Age Bracket | Male | Female |
| 5 to 17 Years | 0 (0.0%) | 0 (0.0%) |
| 18 to 34 Years | 71 (2.7%) | 45 (2.2%) |
| 35 to 64 Years | 488 (7.1%) | 283 (3.8%) |
| 65 to 74 Years | 340 (10.5%) | 421 (10.5%) |
| 75 Years and over | 448 (21.5%) | 1,142 (39.8%) |
Disability Class: Self-Care Difficulty
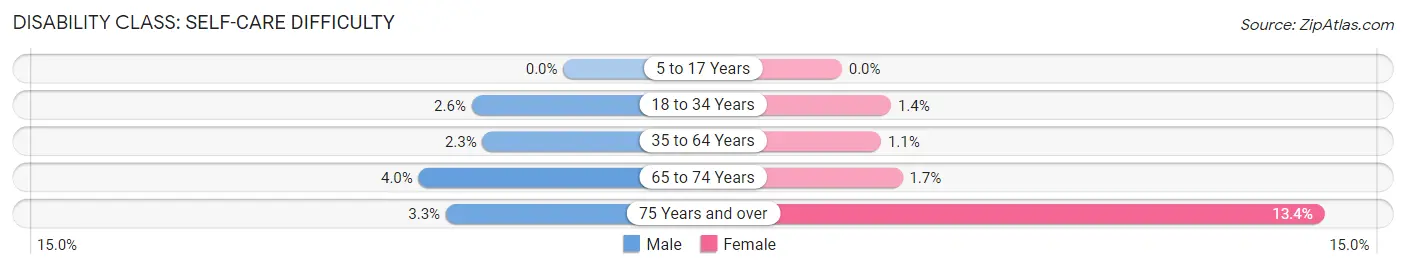
| Age Bracket | Male | Female |
| 5 to 17 Years | 0 (0.0%) | 0 (0.0%) |
| 18 to 34 Years | 68 (2.5%) | 28 (1.4%) |
| 35 to 64 Years | 155 (2.2%) | 81 (1.1%) |
| 65 to 74 Years | 131 (4.0%) | 68 (1.7%) |
| 75 Years and over | 68 (3.3%) | 386 (13.4%) |
Technology Access in Dunedin
Computing Device Access in Dunedin
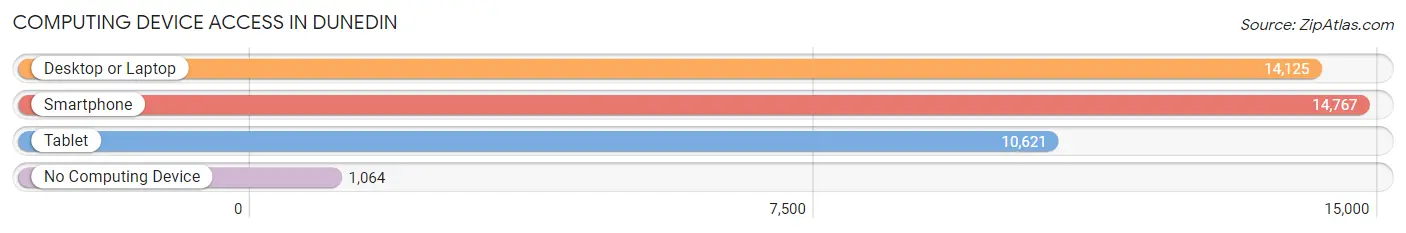
| Device Type | # Households | % Households |
| Desktop or Laptop | 14,125 | 80.7% |
| Smartphone | 14,767 | 84.4% |
| Tablet | 10,621 | 60.7% |
| No Computing Device | 1,064 | 6.1% |
| Total | 17,506 | 100.0% |
Internet Access in Dunedin
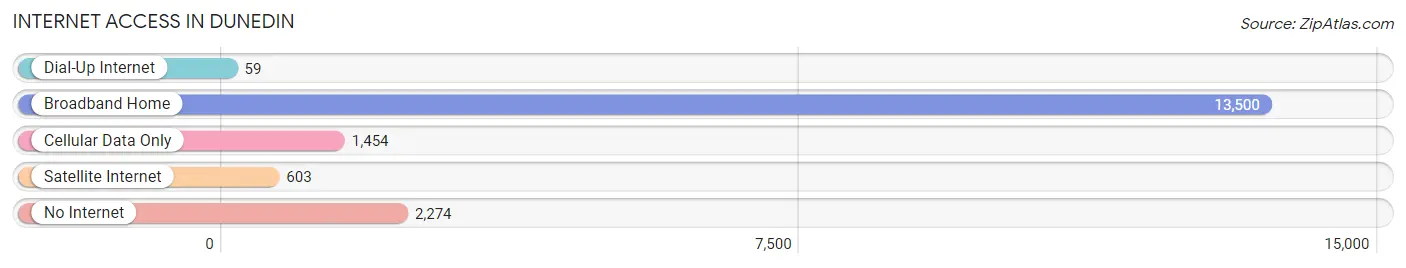
| Internet Type | # Households | % Households |
| Dial-Up Internet | 59 | 0.3% |
| Broadband Home | 13,500 | 77.1% |
| Cellular Data Only | 1,454 | 8.3% |
| Satellite Internet | 603 | 3.4% |
| No Internet | 2,274 | 13.0% |
| Total | 17,506 | 100.0% |
Dunedin Summary
Dunedin, Florida is a city located in Pinellas County, Florida, United States. It is part of the Tampa-St. Petersburg-Clearwater metropolitan area. The population was 35,321 at the 2010 census. Dunedin is home to several beaches, including Dunedin Causeway, Honeymoon Island, and Caladesi Island State Park, which is consistently rated among the best beaches in the world.
Geography
Dunedin is located at 28°01′31″N 82°46′45″W (28.025278, -82.779068). According to the United States Census Bureau, the city has a total area of 15.2 square miles (39.4 km2), of which 14.7 square miles (38.1 km2) is land and 0.5 square miles (1.3 km2) (3.17%) is water.
Dunedin is bordered by the city of Clearwater to the south and east, the Gulf of Mexico to the west, and Palm Harbor to the north.
History
The area around Dunedin was first settled by Scottish immigrants in the mid-1800s. The town was named after Dunedin, Scotland, the birthplace of the city's first mayor, James Somerville. The city was incorporated in 1899.
Dunedin was a popular tourist destination in the early 1900s, and the city's economy was largely based on tourism and citrus production. The city was also home to a large number of retirees, who were attracted to the area's mild climate and natural beauty.
Economy
Dunedin's economy is largely based on tourism and services. The city is home to several popular beaches, including Dunedin Causeway, Honeymoon Island, and Caladesi Island State Park. The city also has a vibrant downtown area, which is home to a variety of shops, restaurants, and entertainment venues.
The city is also home to several major employers, including Honeywell, Nielsen Media Research, and the Pinellas County Sheriff's Office.
Demographics
As of the 2010 census, there were 35,321 people, 15,845 households, and 8,845 families residing in the city. The population density was 2,400.3 people per square mile (926.2/km2). There were 17,845 housing units at an average density of 1,212.2 per square mile (468.7/km2). The racial makeup of the city was 87.2% White, 5.2% African American, 0.3% Native American, 2.2% Asian, 0.1% Pacific Islander, 2.7% from other races, and 2.3% from two or more races. Hispanic or Latino of any race were 8.9% of the population.
There were 15,845 households, out of which 21.2% had children under the age of 18 living with them, 41.2% were married couples living together, 11.7% had a female householder with no husband present, and 43.2% were non-families. 35.2% of all households were made up of individuals, and 14.2% had someone living alone who was 65 years of age or older. The average household size was 2.17 and the average family size was 2.79.
In the city, the population was spread out, with 19.2% under the age of 18, 7.2% from 18 to 24, 27.2% from 25 to 44, 25.2% from 45 to 64, and 21.2% who were 65 years of age or older. The median age was 42 years. For every 100 females, there were 91.2 males. For every 100 females age 18 and over, there were 88.2 males.
The median income for a household in the city was $41,939, and the median income for a family was $51,856. Males had a median income of $36,858 versus $27,945 for females. The per capita income for the city was $25,890. About 6.2% of families and 9.2% of the population were below the poverty line, including 11.2% of those under age 18 and 6.2% of those age 65 or over.
Common Questions
What is Per Capita Income in Dunedin?
Per Capita income in Dunedin is $43,463.
What is the Median Family Income in Dunedin?
Median Family Income in Dunedin is $89,167.
What is the Median Household income in Dunedin?
Median Household Income in Dunedin is $63,824.
What is Income or Wage Gap in Dunedin?
Income or Wage Gap in Dunedin is 14.5%.
Women in Dunedin earn 85.5 cents for every dollar earned by a man.
What is Inequality or Gini Index in Dunedin?
Inequality or Gini Index in Dunedin is 0.46.
What is the Total Population of Dunedin?
Total Population of Dunedin is 36,089.
What is the Total Male Population of Dunedin?
Total Male Population of Dunedin is 16,924.
What is the Total Female Population of Dunedin?
Total Female Population of Dunedin is 19,165.
What is the Ratio of Males per 100 Females in Dunedin?
There are 88.31 Males per 100 Females in Dunedin.
What is the Ratio of Females per 100 Males in Dunedin?
There are 113.24 Females per 100 Males in Dunedin.
What is the Median Population Age in Dunedin?
Median Population Age in Dunedin is 57.8 Years.
What is the Average Family Size in Dunedin
Average Family Size in Dunedin is 2.7 People.
What is the Average Household Size in Dunedin
Average Household Size in Dunedin is 2.0 People.
How Large is the Labor Force in Dunedin?
There are 16,956 People in the Labor Forcein in Dunedin.
What is the Percentage of People in the Labor Force in Dunedin?
52.7% of People are in the Labor Force in Dunedin.
What is the Unemployment Rate in Dunedin?
Unemployment Rate in Dunedin is 4.7%.