De Leon Springs, FL Map & Demographics
De Leon Springs Map
De Leon Springs Overview
$20,327
PER CAPITA INCOME
$51,470
AVG FAMILY INCOME
$52,111
AVG HOUSEHOLD INCOME
0.30
INEQUALITY / GINI INDEX
2,745
TOTAL POPULATION
1,244
MALE POPULATION
1,501
FEMALE POPULATION
82.88
MALES / 100 FEMALES
120.66
FEMALES / 100 MALES
38.7
MEDIAN AGE
3.6
AVG FAMILY SIZE
3.1
AVG HOUSEHOLD SIZE
873
LABOR FORCE [ PEOPLE ]
42.4%
PERCENT IN LABOR FORCE
De Leon Springs Zip Codes
De Leon Springs Area Codes
Income in De Leon Springs
Income Overview in De Leon Springs
Per Capita Income in De Leon Springs is $20,327, while median incomes of families and households are $51,470 and $52,111 respectively.
| Characteristic | Number | Measure |
| Per Capita Income | 2,745 | $20,327 |
| Median Family Income | 687 | $51,470 |
| Mean Family Income | 687 | $64,769 |
| Median Household Income | 871 | $52,111 |
| Mean Household Income | 871 | $64,528 |
| Income Deficit | 687 | $0 |
| Wage / Income Gap (%) | 2,745 | 0.00% |
| Wage / Income Gap ($) | 2,745 | 100.00¢ per $1 |
| Gini / Inequality Index | 2,745 | 0.30 |
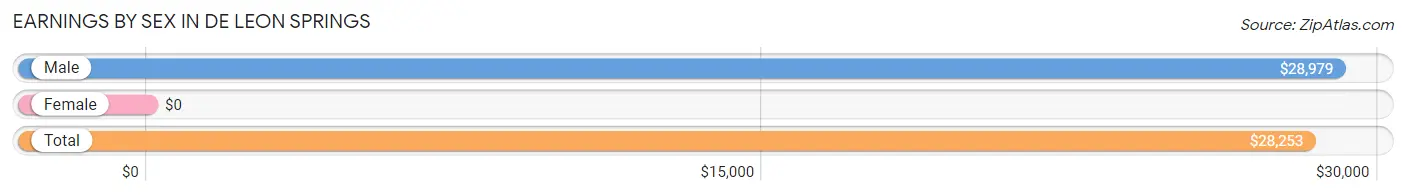
Earnings by Sex in De Leon Springs
| Sex | Number | Average Earnings |
| Male | 580 (62.8%) | $28,979 |
| Female | 344 (37.2%) | $0 |
| Total | 924 (100.0%) | $28,253 |
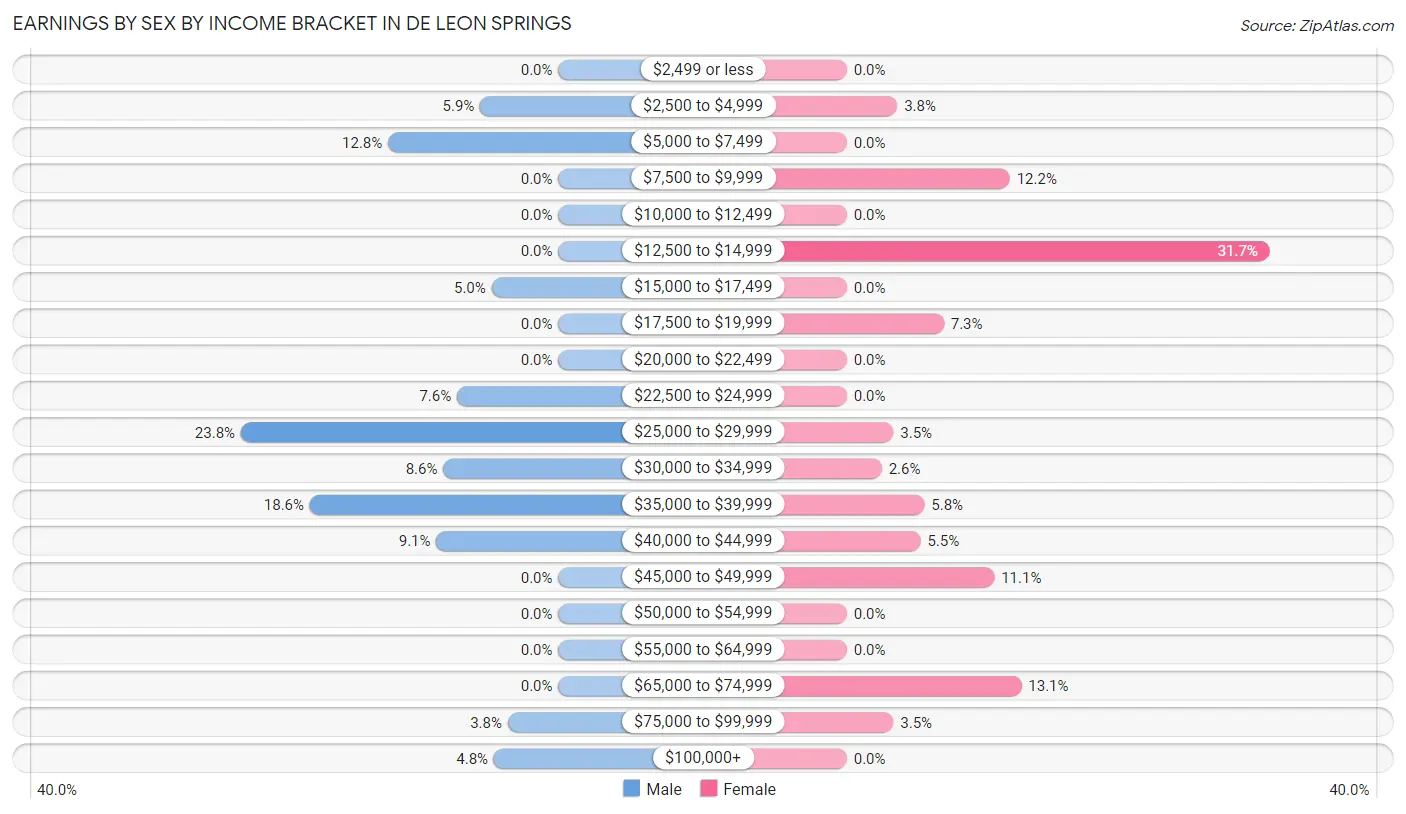
Earnings by Sex by Income Bracket in De Leon Springs
The most common earnings brackets in De Leon Springs are $25,000 to $29,999 for men (138 | 23.8%) and $12,500 to $14,999 for women (109 | 31.7%).
| Income | Male | Female |
| $2,499 or less | 0 (0.0%) | 0 (0.0%) |
| $2,500 to $4,999 | 34 (5.9%) | 13 (3.8%) |
| $5,000 to $7,499 | 74 (12.8%) | 0 (0.0%) |
| $7,500 to $9,999 | 0 (0.0%) | 42 (12.2%) |
| $10,000 to $12,499 | 0 (0.0%) | 0 (0.0%) |
| $12,500 to $14,999 | 0 (0.0%) | 109 (31.7%) |
| $15,000 to $17,499 | 29 (5.0%) | 0 (0.0%) |
| $17,500 to $19,999 | 0 (0.0%) | 25 (7.3%) |
| $20,000 to $22,499 | 0 (0.0%) | 0 (0.0%) |
| $22,500 to $24,999 | 44 (7.6%) | 0 (0.0%) |
| $25,000 to $29,999 | 138 (23.8%) | 12 (3.5%) |
| $30,000 to $34,999 | 50 (8.6%) | 9 (2.6%) |
| $35,000 to $39,999 | 108 (18.6%) | 20 (5.8%) |
| $40,000 to $44,999 | 53 (9.1%) | 19 (5.5%) |
| $45,000 to $49,999 | 0 (0.0%) | 38 (11.1%) |
| $50,000 to $54,999 | 0 (0.0%) | 0 (0.0%) |
| $55,000 to $64,999 | 0 (0.0%) | 0 (0.0%) |
| $65,000 to $74,999 | 0 (0.0%) | 45 (13.1%) |
| $75,000 to $99,999 | 22 (3.8%) | 12 (3.5%) |
| $100,000+ | 28 (4.8%) | 0 (0.0%) |
| Total | 580 (100.0%) | 344 (100.0%) |
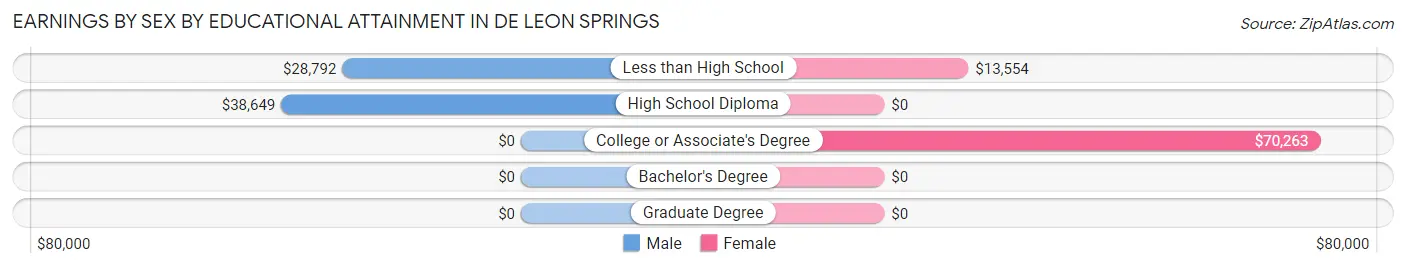
Earnings by Sex by Educational Attainment in De Leon Springs
| Educational Attainment | Male Income | Female Income |
| Less than High School | $28,792 | $13,554 |
| High School Diploma | $38,649 | $0 |
| College or Associate's Degree | - | - |
| Bachelor's Degree | - | - |
| Graduate Degree | - | - |
| Total | $33,250 | $0 |
Family Income in De Leon Springs
Family Income Brackets in De Leon Springs
According to the De Leon Springs family income data, there are 192 families falling into the $35,000 to $49,999 income range, which is the most common income bracket and makes up 28.0% of all families.
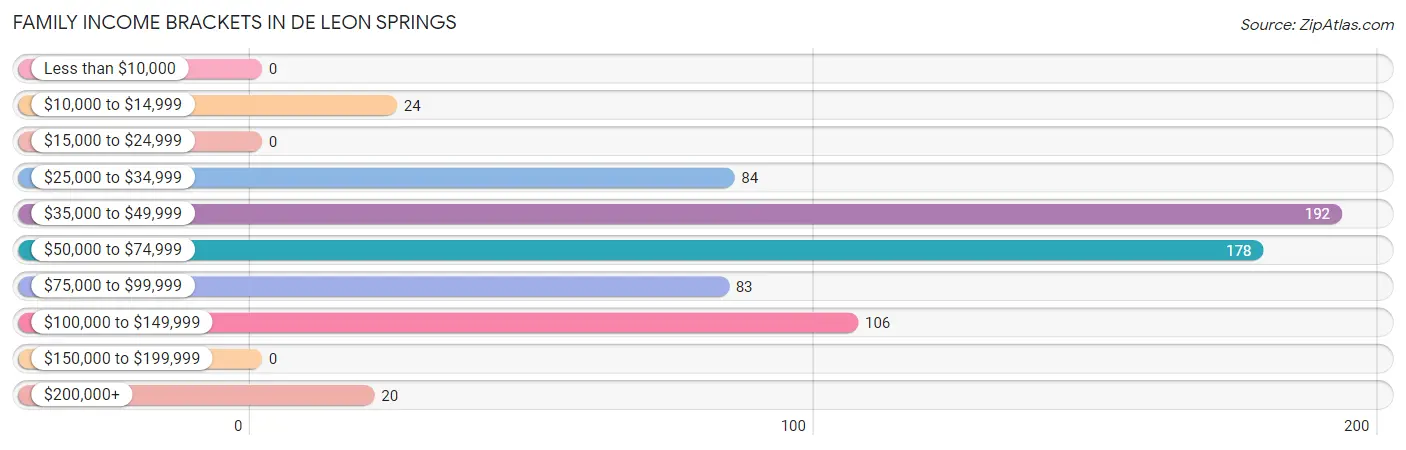
| Income Bracket | # Families | % Families |
| Less than $10,000 | 0 | 0.0% |
| $10,000 to $14,999 | 24 | 3.5% |
| $15,000 to $24,999 | 0 | 0.0% |
| $25,000 to $34,999 | 84 | 12.2% |
| $35,000 to $49,999 | 192 | 27.9% |
| $50,000 to $74,999 | 178 | 25.9% |
| $75,000 to $99,999 | 83 | 12.1% |
| $100,000 to $149,999 | 106 | 15.4% |
| $150,000 to $199,999 | 0 | 0.0% |
| $200,000+ | 20 | 2.9% |
Family Income by Famaliy Size in De Leon Springs
4-person families (141 | 20.5%) account for the highest median family income in De Leon Springs with $75,524 per family, while 2-person families (276 | 40.2%) have the highest median income of $22,578 per family member.
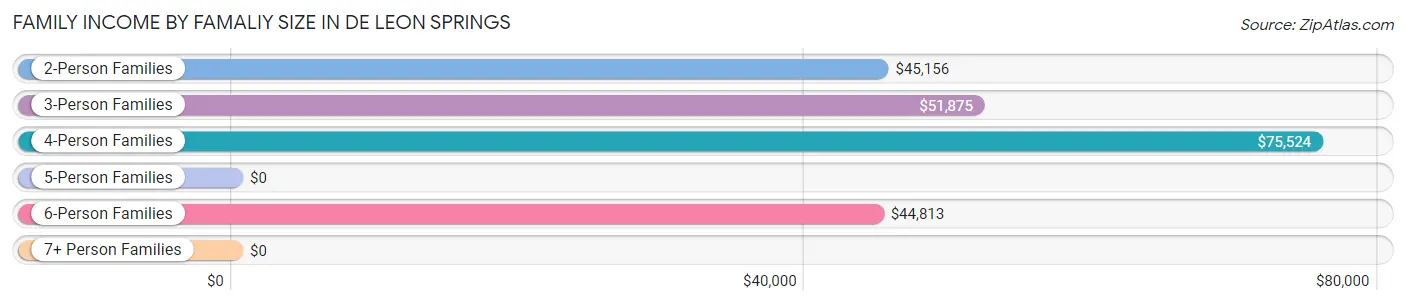
| Income Bracket | # Families | Median Income |
| 2-Person Families | 276 (40.2%) | $45,156 |
| 3-Person Families | 111 (16.2%) | $51,875 |
| 4-Person Families | 141 (20.5%) | $75,524 |
| 5-Person Families | 41 (6.0%) | $0 |
| 6-Person Families | 85 (12.4%) | $44,813 |
| 7+ Person Families | 33 (4.8%) | $0 |
| Total | 687 (100.0%) | $51,470 |
Family Income by Number of Earners in De Leon Springs
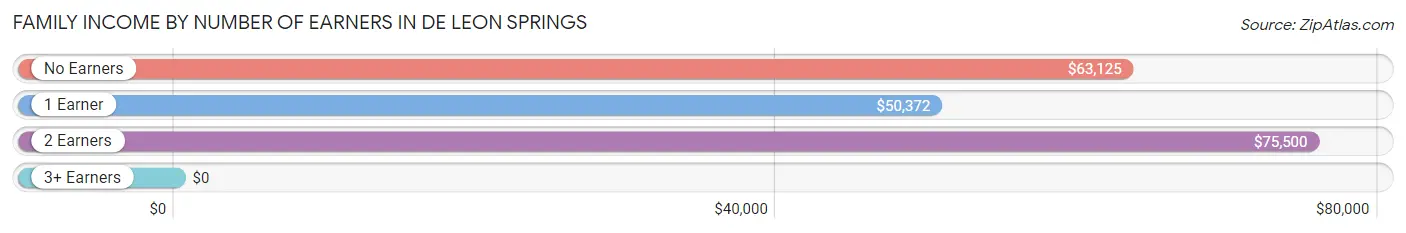
| Number of Earners | # Families | Median Income |
| No Earners | 114 (16.6%) | $63,125 |
| 1 Earner | 324 (47.2%) | $50,372 |
| 2 Earners | 208 (30.3%) | $75,500 |
| 3+ Earners | 41 (6.0%) | $0 |
| Total | 687 (100.0%) | $51,470 |
Household Income in De Leon Springs
Household Income Brackets in De Leon Springs
With 236 households falling in the category, the $50,000 to $74,999 income range is the most frequent in De Leon Springs, accounting for 27.1% of all households.
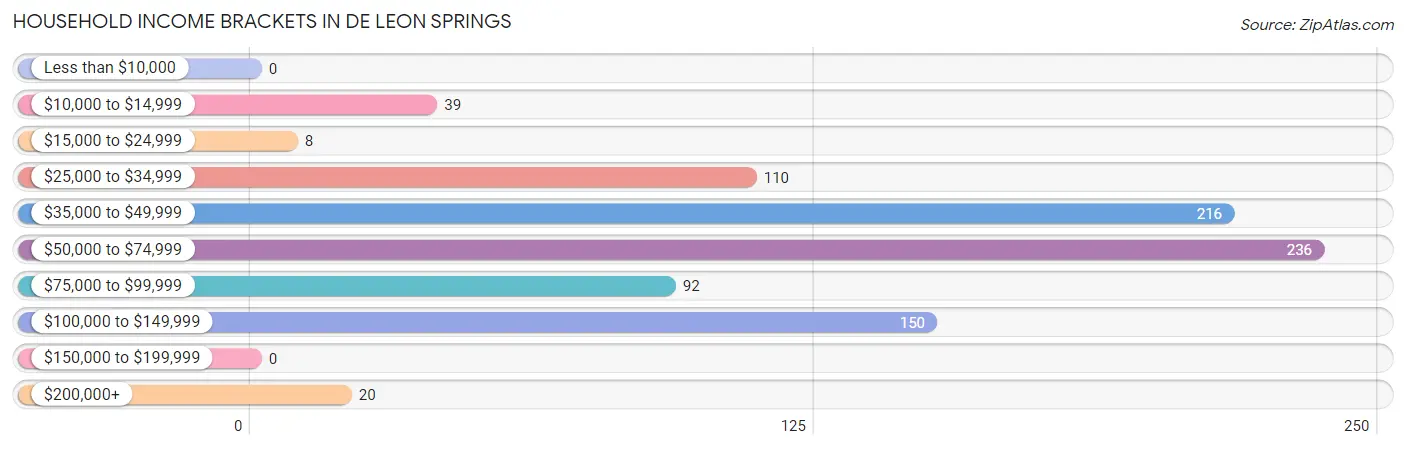
| Income Bracket | # Households | % Households |
| Less than $10,000 | 0 | 0.0% |
| $10,000 to $14,999 | 39 | 4.5% |
| $15,000 to $24,999 | 8 | 0.9% |
| $25,000 to $34,999 | 110 | 12.6% |
| $35,000 to $49,999 | 216 | 24.8% |
| $50,000 to $74,999 | 236 | 27.1% |
| $75,000 to $99,999 | 92 | 10.6% |
| $100,000 to $149,999 | 150 | 17.2% |
| $150,000 to $199,999 | 0 | 0.0% |
| $200,000+ | 20 | 2.3% |
Household Income by Householder Age in De Leon Springs
The median household income in De Leon Springs is $52,111, with the highest median household income of $54,055 found in the 25 to 44 years age bracket for the primary householder. A total of 269 households (30.9%) fall into this category.
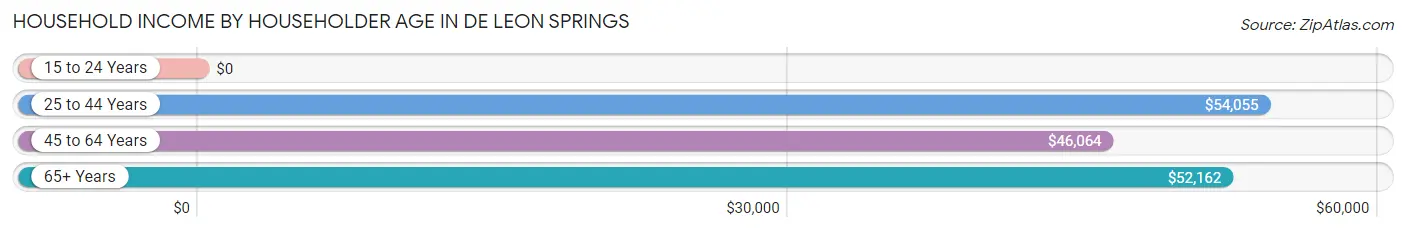
| Income Bracket | # Households | Median Income |
| 15 to 24 Years | 0 (0.0%) | $0 |
| 25 to 44 Years | 269 (30.9%) | $54,055 |
| 45 to 64 Years | 266 (30.5%) | $46,064 |
| 65+ Years | 336 (38.6%) | $52,162 |
| Total | 871 (100.0%) | $52,111 |
Poverty in De Leon Springs
Income Below Poverty by Sex and Age in De Leon Springs
With 2.2% poverty level for males and 8.7% for females among the residents of De Leon Springs, 16 and 17 year old males and 18 to 24 year old females are the most vulnerable to poverty, with 28 males (35.0%) and 27 females (40.3%) in their respective age groups living below the poverty level.
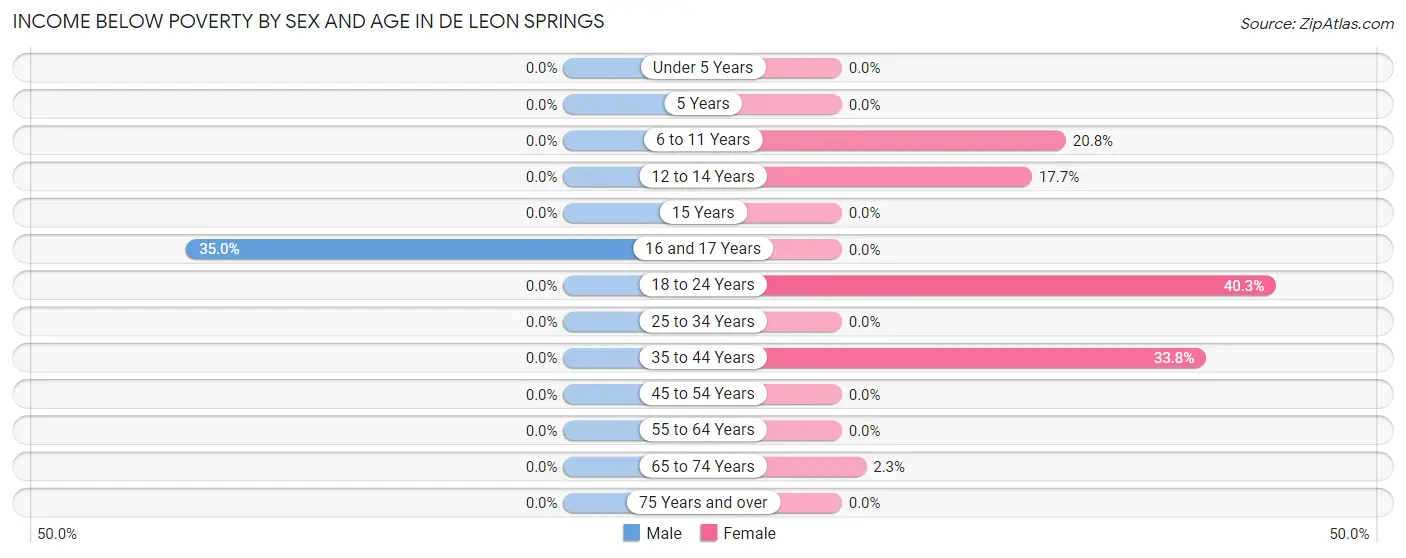
| Age Bracket | Male | Female |
| Under 5 Years | 0 (0.0%) | 0 (0.0%) |
| 5 Years | 0 (0.0%) | 0 (0.0%) |
| 6 to 11 Years | 0 (0.0%) | 47 (20.8%) |
| 12 to 14 Years | 0 (0.0%) | 24 (17.6%) |
| 15 Years | 0 (0.0%) | 0 (0.0%) |
| 16 and 17 Years | 28 (35.0%) | 0 (0.0%) |
| 18 to 24 Years | 0 (0.0%) | 27 (40.3%) |
| 25 to 34 Years | 0 (0.0%) | 0 (0.0%) |
| 35 to 44 Years | 0 (0.0%) | 24 (33.8%) |
| 45 to 54 Years | 0 (0.0%) | 0 (0.0%) |
| 55 to 64 Years | 0 (0.0%) | 0 (0.0%) |
| 65 to 74 Years | 0 (0.0%) | 8 (2.3%) |
| 75 Years and over | 0 (0.0%) | 0 (0.0%) |
| Total | 28 (2.2%) | 130 (8.7%) |
Income Above Poverty by Sex and Age in De Leon Springs
According to the poverty statistics in De Leon Springs, males aged under 5 years and females aged under 5 years are the age groups that are most secure financially, with 100.0% of males and 100.0% of females in these age groups living above the poverty line.
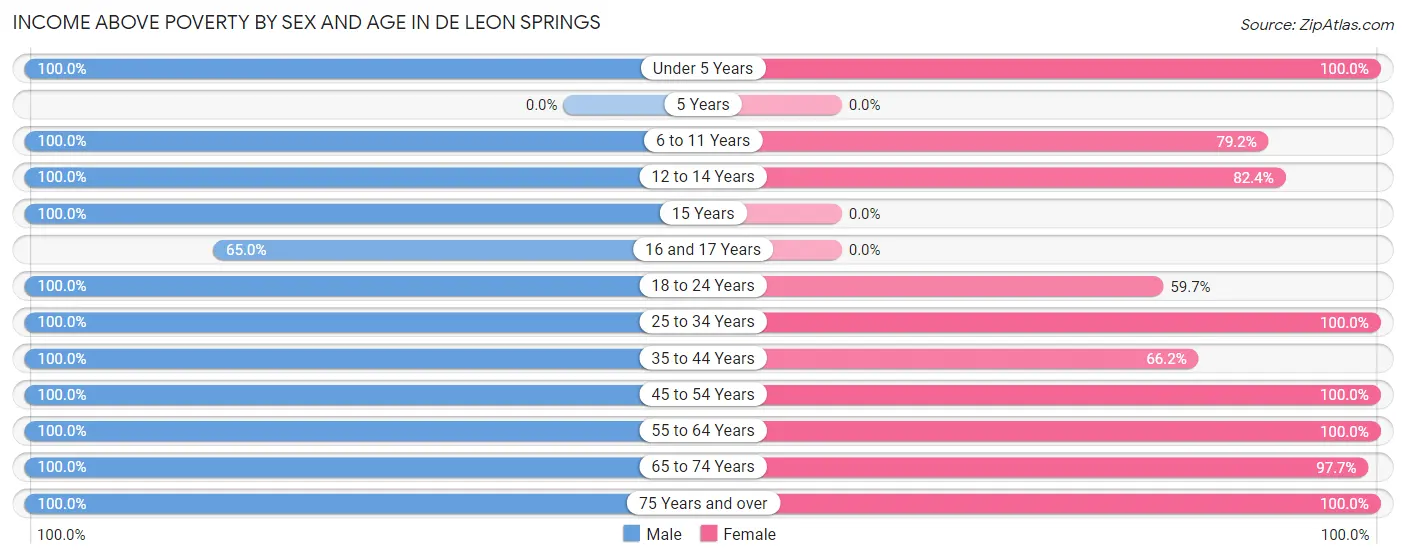
| Age Bracket | Male | Female |
| Under 5 Years | 72 (100.0%) | 58 (100.0%) |
| 5 Years | 0 (0.0%) | 0 (0.0%) |
| 6 to 11 Years | 151 (100.0%) | 179 (79.2%) |
| 12 to 14 Years | 20 (100.0%) | 112 (82.4%) |
| 15 Years | 24 (100.0%) | 0 (0.0%) |
| 16 and 17 Years | 52 (65.0%) | 0 (0.0%) |
| 18 to 24 Years | 57 (100.0%) | 40 (59.7%) |
| 25 to 34 Years | 237 (100.0%) | 189 (100.0%) |
| 35 to 44 Years | 122 (100.0%) | 47 (66.2%) |
| 45 to 54 Years | 150 (100.0%) | 201 (100.0%) |
| 55 to 64 Years | 112 (100.0%) | 110 (100.0%) |
| 65 to 74 Years | 174 (100.0%) | 345 (97.7%) |
| 75 Years and over | 45 (100.0%) | 90 (100.0%) |
| Total | 1,216 (97.8%) | 1,371 (91.3%) |
Income Below Poverty Among Married-Couple Families in De Leon Springs
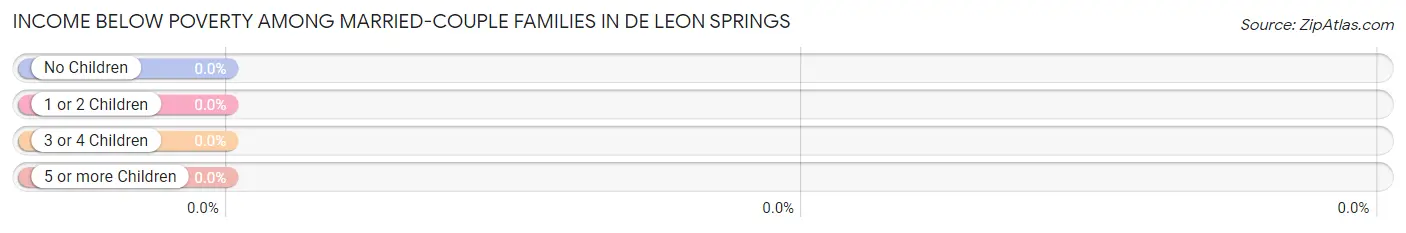
| Children | Above Poverty | Below Poverty |
| No Children | 337 (100.0%) | 0 (0.0%) |
| 1 or 2 Children | 177 (100.0%) | 0 (0.0%) |
| 3 or 4 Children | 32 (100.0%) | 0 (0.0%) |
| 5 or more Children | 33 (100.0%) | 0 (0.0%) |
| Total | 579 (100.0%) | 0 (0.0%) |
Income Below Poverty Among Single-Parent Households in De Leon Springs
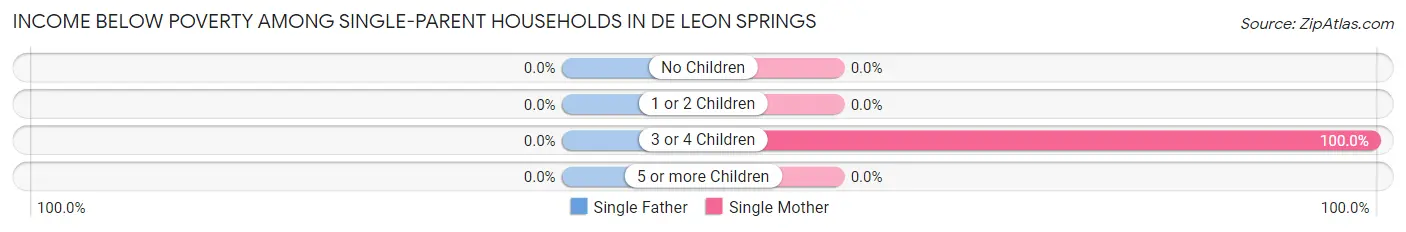
| Children | Single Father | Single Mother |
| No Children | 0 (0.0%) | 0 (0.0%) |
| 1 or 2 Children | 0 (0.0%) | 0 (0.0%) |
| 3 or 4 Children | 0 (0.0%) | 24 (100.0%) |
| 5 or more Children | 0 (0.0%) | 0 (0.0%) |
| Total | 0 (0.0%) | 24 (22.2%) |
Income Below Poverty Among Married-Couple vs Single-Parent Households in De Leon Springs
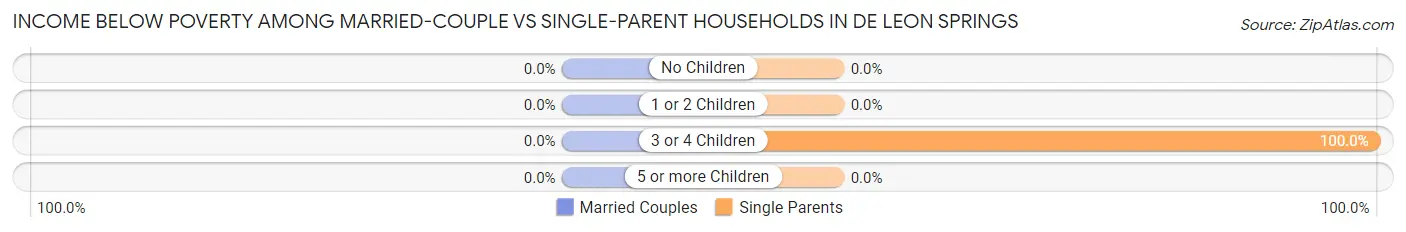
| Children | Married-Couple Families | Single-Parent Households |
| No Children | 0 (0.0%) | 0 (0.0%) |
| 1 or 2 Children | 0 (0.0%) | 0 (0.0%) |
| 3 or 4 Children | 0 (0.0%) | 24 (100.0%) |
| 5 or more Children | 0 (0.0%) | 0 (0.0%) |
| Total | 0 (0.0%) | 24 (22.2%) |
Race in De Leon Springs
The most populous races in De Leon Springs are Hispanic or Latino (1,787 | 65.1%), White / Caucasian (1,495 | 54.5%), and Some other Race (1,082 | 39.4%).
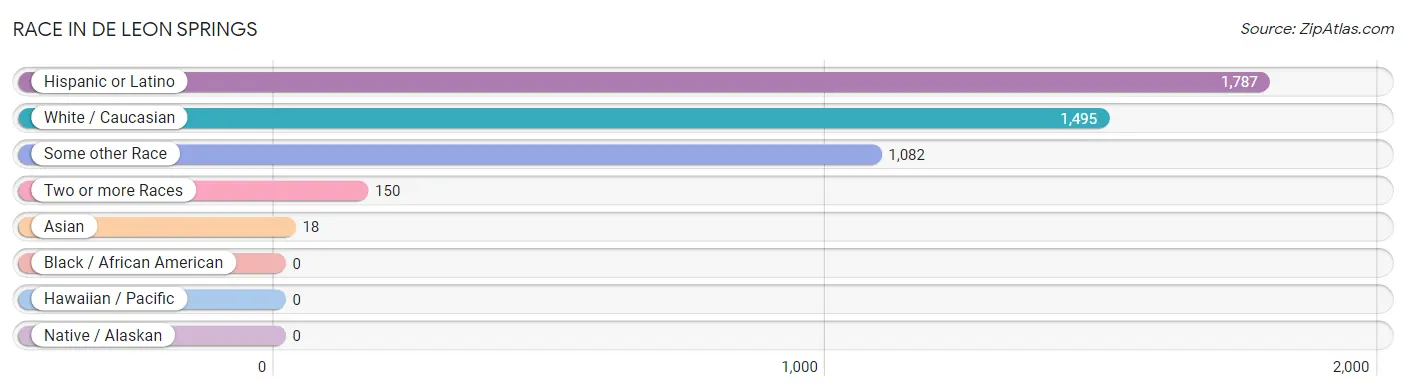
| Race | # Population | % Population |
| Asian | 18 | 0.7% |
| Black / African American | 0 | 0.0% |
| Hawaiian / Pacific | 0 | 0.0% |
| Hispanic or Latino | 1,787 | 65.1% |
| Native / Alaskan | 0 | 0.0% |
| White / Caucasian | 1,495 | 54.5% |
| Two or more Races | 150 | 5.5% |
| Some other Race | 1,082 | 39.4% |
| Total | 2,745 | 100.0% |
Ancestry in De Leon Springs
The most populous ancestries reported in De Leon Springs are Mexican (1,560 | 56.8%), German (137 | 5.0%), English (111 | 4.0%), Irish (95 | 3.5%), and Puerto Rican (77 | 2.8%), together accounting for 72.1% of all De Leon Springs residents.
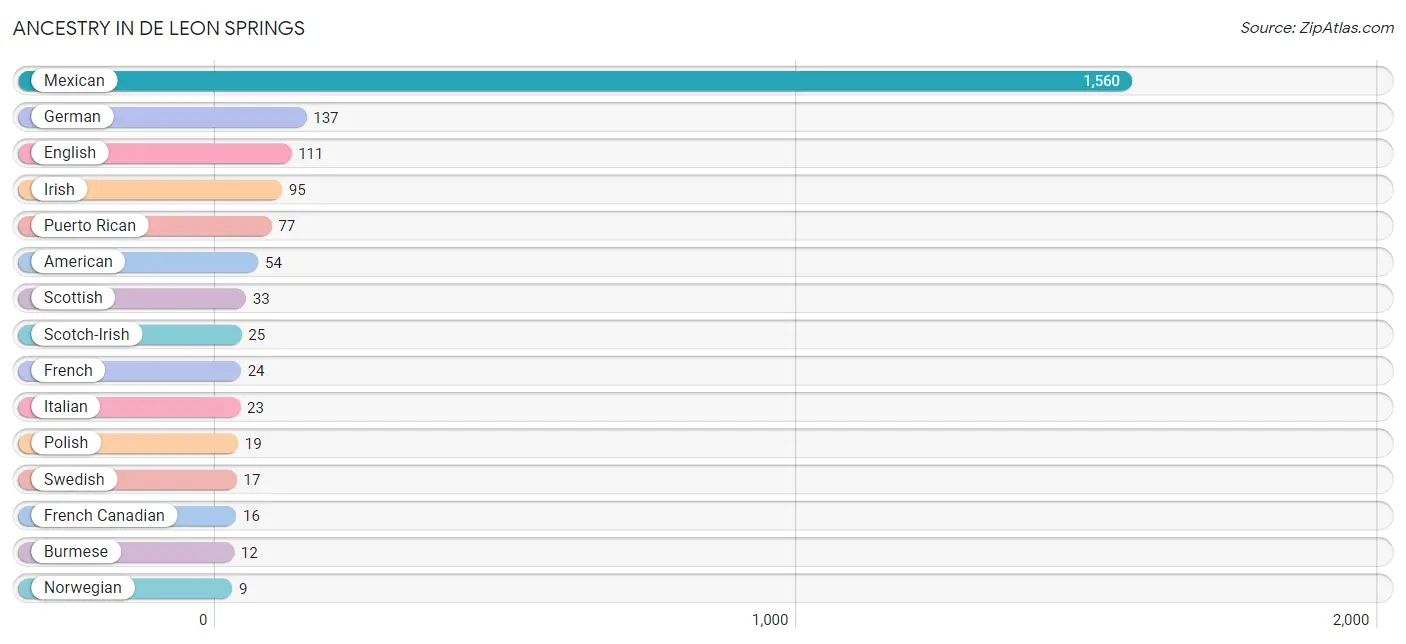
| Ancestry | # Population | % Population |
| American | 54 | 2.0% |
| British | 5 | 0.2% |
| Burmese | 12 | 0.4% |
| English | 111 | 4.0% |
| French | 24 | 0.9% |
| French Canadian | 16 | 0.6% |
| German | 137 | 5.0% |
| Irish | 95 | 3.5% |
| Italian | 23 | 0.8% |
| Malaysian | 6 | 0.2% |
| Mexican | 1,560 | 56.8% |
| Northern European | 3 | 0.1% |
| Norwegian | 9 | 0.3% |
| Polish | 19 | 0.7% |
| Puerto Rican | 77 | 2.8% |
| Scotch-Irish | 25 | 0.9% |
| Scottish | 33 | 1.2% |
| Slavic | 8 | 0.3% |
| Swedish | 17 | 0.6% | View All 19 Rows |
Immigrants in De Leon Springs
The most numerous immigrant groups reported in De Leon Springs came from Central America (223 | 8.1%), Latin America (223 | 8.1%), Mexico (223 | 8.1%), Europe (20 | 0.7%), and Germany (20 | 0.7%), together accounting for 25.8% of all De Leon Springs residents.
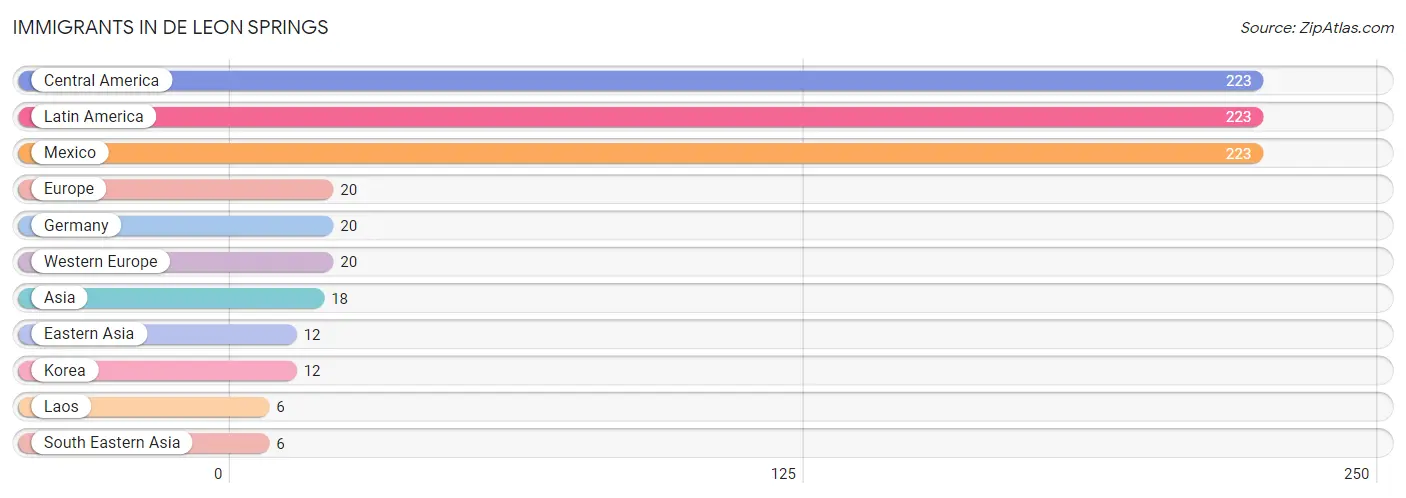
| Immigration Origin | # Population | % Population |
| Asia | 18 | 0.7% |
| Central America | 223 | 8.1% |
| Eastern Asia | 12 | 0.4% |
| Europe | 20 | 0.7% |
| Germany | 20 | 0.7% |
| Korea | 12 | 0.4% |
| Laos | 6 | 0.2% |
| Latin America | 223 | 8.1% |
| Mexico | 223 | 8.1% |
| South Eastern Asia | 6 | 0.2% |
| Western Europe | 20 | 0.7% | View All 11 Rows |
Sex and Age in De Leon Springs
Sex and Age in De Leon Springs
The most populous age groups in De Leon Springs are 25 to 29 Years (204 | 16.4%) for men and 65 to 69 Years (323 | 21.5%) for women.
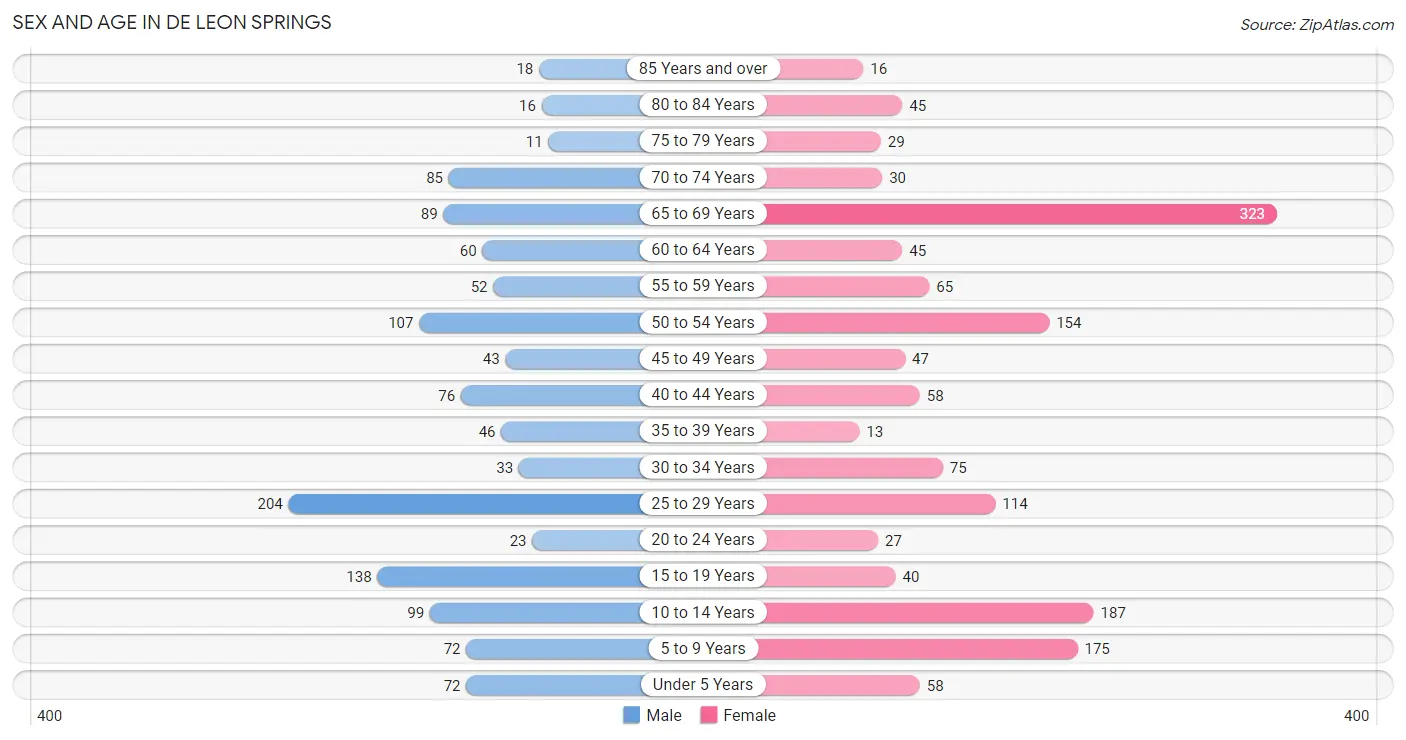
| Age Bracket | Male | Female |
| Under 5 Years | 72 (5.8%) | 58 (3.9%) |
| 5 to 9 Years | 72 (5.8%) | 175 (11.7%) |
| 10 to 14 Years | 99 (8.0%) | 187 (12.5%) |
| 15 to 19 Years | 138 (11.1%) | 40 (2.7%) |
| 20 to 24 Years | 23 (1.8%) | 27 (1.8%) |
| 25 to 29 Years | 204 (16.4%) | 114 (7.6%) |
| 30 to 34 Years | 33 (2.6%) | 75 (5.0%) |
| 35 to 39 Years | 46 (3.7%) | 13 (0.9%) |
| 40 to 44 Years | 76 (6.1%) | 58 (3.9%) |
| 45 to 49 Years | 43 (3.5%) | 47 (3.1%) |
| 50 to 54 Years | 107 (8.6%) | 154 (10.3%) |
| 55 to 59 Years | 52 (4.2%) | 65 (4.3%) |
| 60 to 64 Years | 60 (4.8%) | 45 (3.0%) |
| 65 to 69 Years | 89 (7.1%) | 323 (21.5%) |
| 70 to 74 Years | 85 (6.8%) | 30 (2.0%) |
| 75 to 79 Years | 11 (0.9%) | 29 (1.9%) |
| 80 to 84 Years | 16 (1.3%) | 45 (3.0%) |
| 85 Years and over | 18 (1.5%) | 16 (1.1%) |
| Total | 1,244 (100.0%) | 1,501 (100.0%) |
Families and Households in De Leon Springs
Median Family Size in De Leon Springs
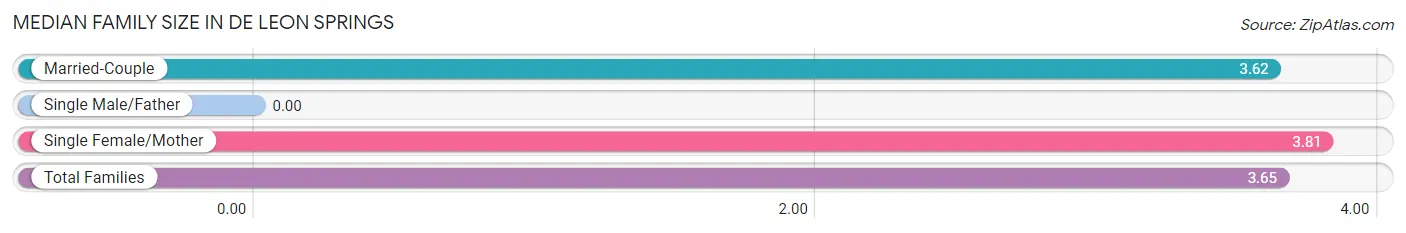
| Family Type | # Families | Family Size |
| Married-Couple | 579 (84.3%) | 3.62 |
| Single Male/Father | 0 (0.0%) | - |
| Single Female/Mother | 108 (15.7%) | 3.81 |
| Total Families | 687 (100.0%) | 3.65 |
Median Household Size in De Leon Springs
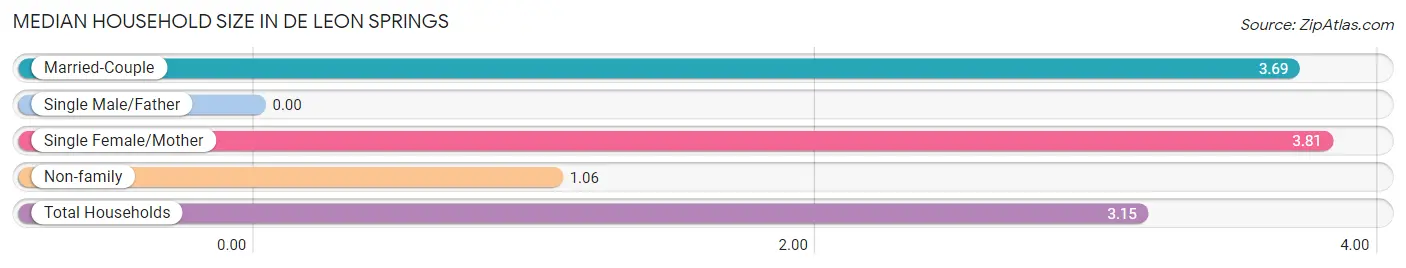
| Household Type | # Households | Household Size |
| Married-Couple | 579 (66.5%) | 3.69 |
| Single Male/Father | 0 (0.0%) | - |
| Single Female/Mother | 108 (12.4%) | 3.81 |
| Non-family | 184 (21.1%) | 1.06 |
| Total Households | 871 (100.0%) | 3.15 |
Household Size by Marriage Status in De Leon Springs
Out of a total of 871 households in De Leon Springs, 687 (78.9%) are family households, while 184 (21.1%) are nonfamily households. The most numerous type of family households are 2-person households, comprising 242, and the most common type of nonfamily households are 1-person households, comprising 174.
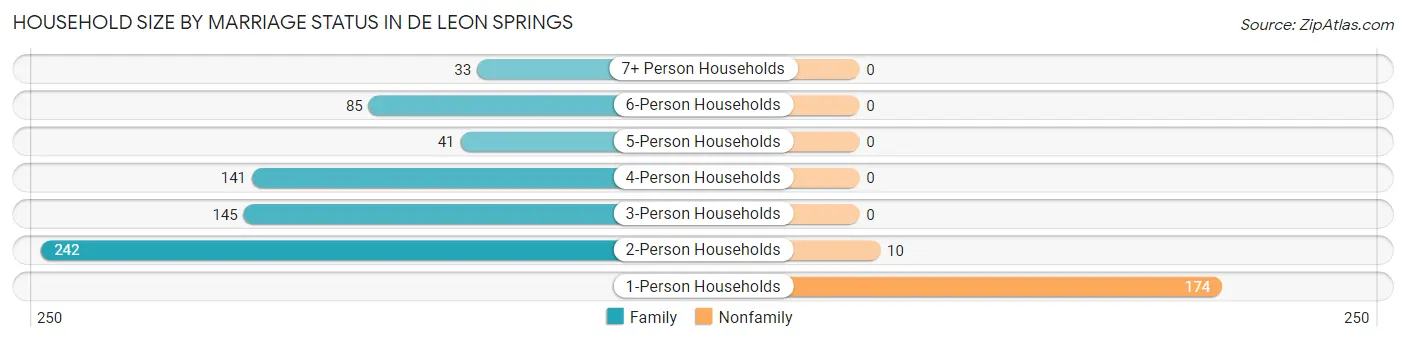
| Household Size | Family Households | Nonfamily Households |
| 1-Person Households | - | 174 (20.0%) |
| 2-Person Households | 242 (27.8%) | 10 (1.1%) |
| 3-Person Households | 145 (16.7%) | 0 (0.0%) |
| 4-Person Households | 141 (16.2%) | 0 (0.0%) |
| 5-Person Households | 41 (4.7%) | 0 (0.0%) |
| 6-Person Households | 85 (9.8%) | 0 (0.0%) |
| 7+ Person Households | 33 (3.8%) | 0 (0.0%) |
| Total | 687 (78.9%) | 184 (21.1%) |
Female Fertility in De Leon Springs
Fertility by Age in De Leon Springs
Average fertility rate in De Leon Springs is 99.0 births per 1,000 women. Women in the age bracket of 20 to 34 years have the highest fertility rate with 194.0 births per 1,000 women. Women in the age bracket of 20 to 34 years acount for 100.0% of all women with births.
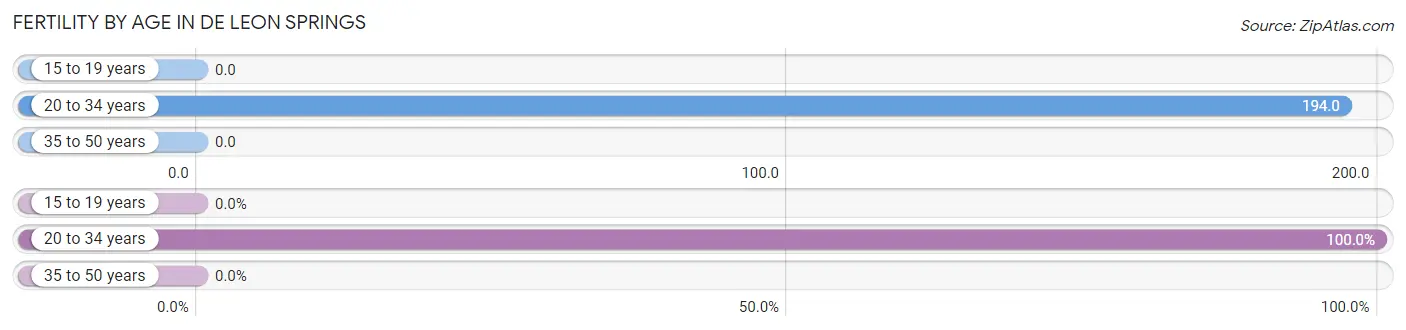
| Age Bracket | Women with Births | Births / 1,000 Women |
| 15 to 19 years | 0 (0.0%) | 0.0 |
| 20 to 34 years | 42 (100.0%) | 194.0 |
| 35 to 50 years | 0 (0.0%) | 0.0 |
| Total | 42 (100.0%) | 99.0 |
Fertility by Age by Marriage Status in De Leon Springs
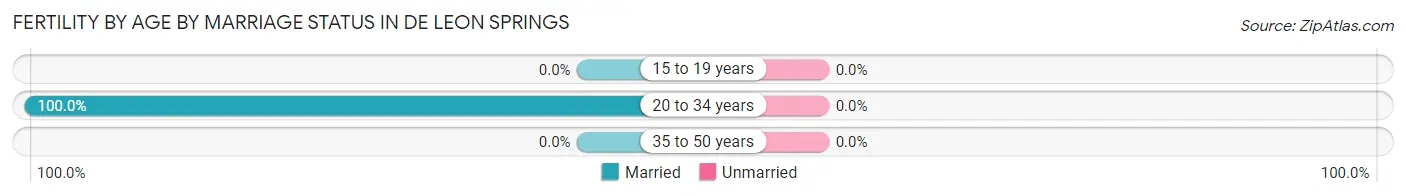
| Age Bracket | Married | Unmarried |
| 15 to 19 years | 0 (0.0%) | 0 (0.0%) |
| 20 to 34 years | 42 (100.0%) | 0 (0.0%) |
| 35 to 50 years | 0 (0.0%) | 0 (0.0%) |
| Total | 42 (100.0%) | 0 (0.0%) |
Fertility by Education in De Leon Springs
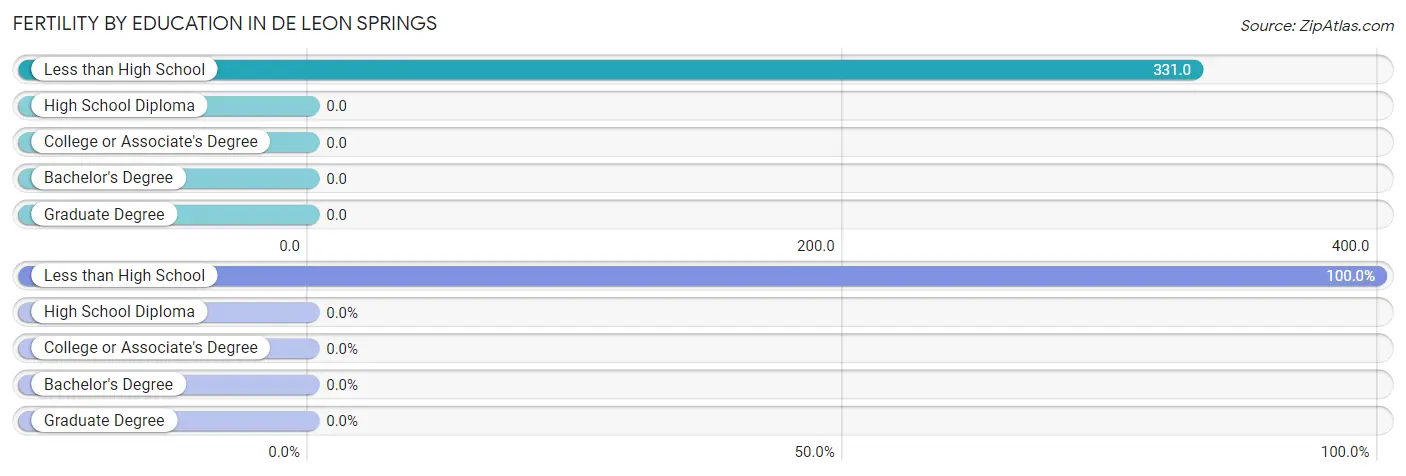
| Educational Attainment | Women with Births | Births / 1,000 Women |
| Less than High School | 42 (100.0%) | 331.0 |
| High School Diploma | 0 (0.0%) | 0.0 |
| College or Associate's Degree | 0 (0.0%) | 0.0 |
| Bachelor's Degree | 0 (0.0%) | 0.0 |
| Graduate Degree | 0 (0.0%) | 0.0 |
| Total | 42 (100.0%) | 99.0 |
Fertility by Education by Marriage Status in De Leon Springs
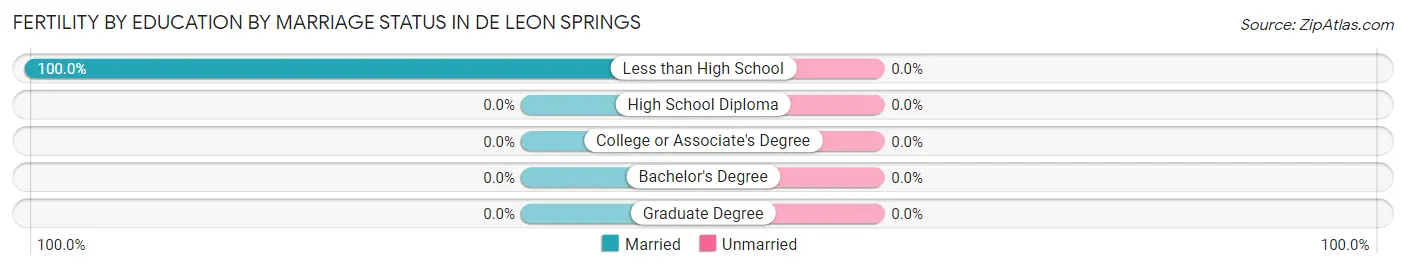
| Educational Attainment | Married | Unmarried |
| Less than High School | 42 (100.0%) | 0 (0.0%) |
| High School Diploma | 0 (0.0%) | 0 (0.0%) |
| College or Associate's Degree | 0 (0.0%) | 0 (0.0%) |
| Bachelor's Degree | 0 (0.0%) | 0 (0.0%) |
| Graduate Degree | 0 (0.0%) | 0 (0.0%) |
| Total | 42 (100.0%) | 0 (0.0%) |
Employment Characteristics in De Leon Springs
Employment by Class of Employer in De Leon Springs
Among the 873 employed individuals in De Leon Springs, private company employees (620 | 71.0%), self-employed (not incorporated) (104 | 11.9%), and not-for-profit organizations (59 | 6.8%) make up the most common classes of employment.
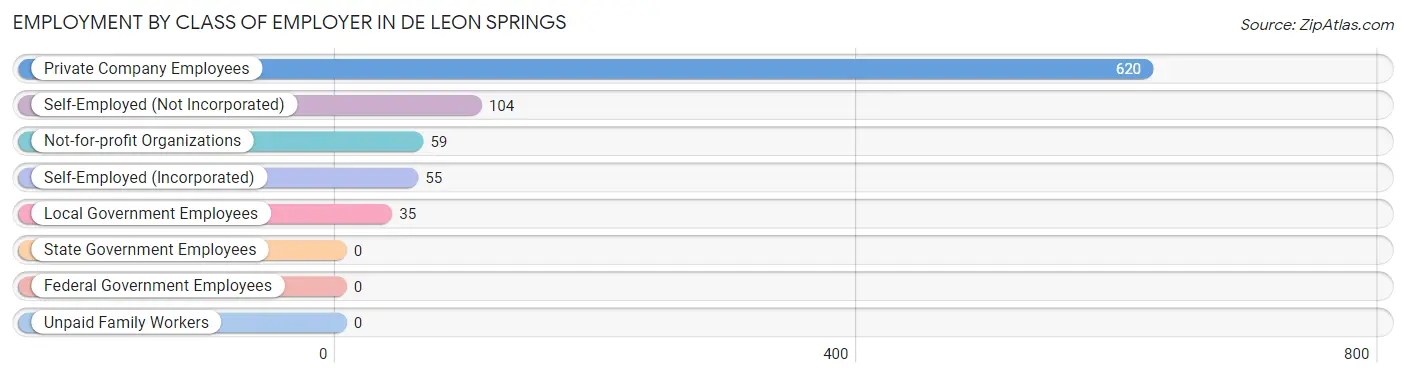
| Employer Class | # Employees | % Employees |
| Private Company Employees | 620 | 71.0% |
| Self-Employed (Incorporated) | 55 | 6.3% |
| Self-Employed (Not Incorporated) | 104 | 11.9% |
| Not-for-profit Organizations | 59 | 6.8% |
| Local Government Employees | 35 | 4.0% |
| State Government Employees | 0 | 0.0% |
| Federal Government Employees | 0 | 0.0% |
| Unpaid Family Workers | 0 | 0.0% |
| Total | 873 | 100.0% |
Employment Status by Age in De Leon Springs
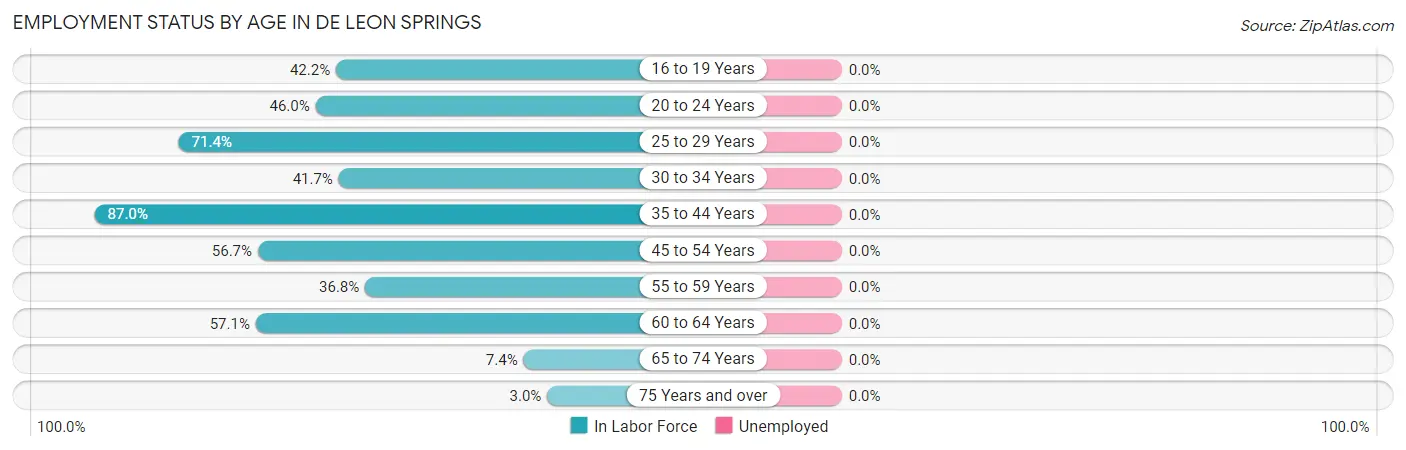
| Age Bracket | In Labor Force | Unemployed |
| 16 to 19 Years | 65 (42.2%) | 0 (0.0%) |
| 20 to 24 Years | 23 (46.0%) | 0 (0.0%) |
| 25 to 29 Years | 227 (71.4%) | 0 (0.0%) |
| 30 to 34 Years | 45 (41.7%) | 0 (0.0%) |
| 35 to 44 Years | 168 (87.0%) | 0 (0.0%) |
| 45 to 54 Years | 199 (56.7%) | 0 (0.0%) |
| 55 to 59 Years | 43 (36.8%) | 0 (0.0%) |
| 60 to 64 Years | 60 (57.1%) | 0 (0.0%) |
| 65 to 74 Years | 39 (7.4%) | 0 (0.0%) |
| 75 Years and over | 4 (3.0%) | 0 (0.0%) |
| Total | 873 (42.4%) | 0 (0.0%) |
Employment Status by Educational Attainment in De Leon Springs
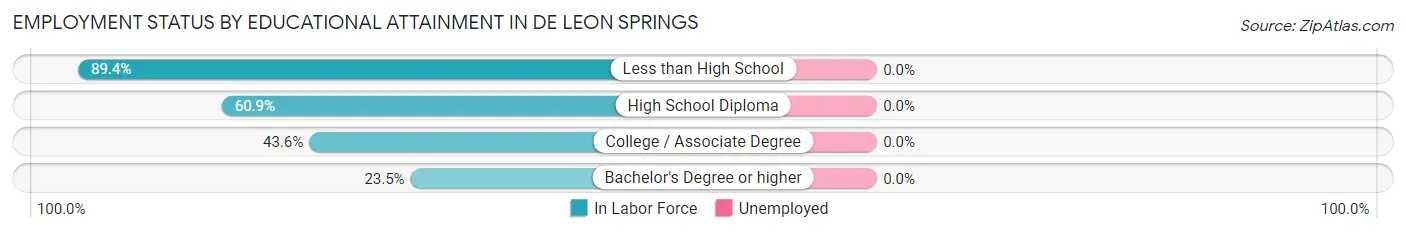
| Educational Attainment | In Labor Force | Unemployed |
| Less than High School | 286 (89.4%) | 0 (0.0%) |
| High School Diploma | 327 (60.9%) | 0 (0.0%) |
| College / Associate Degree | 109 (43.6%) | 0 (0.0%) |
| Bachelor's Degree or higher | 20 (23.5%) | 0 (0.0%) |
| Total | 741 (62.2%) | 0 (0.0%) |
Employment Occupations by Sex in De Leon Springs
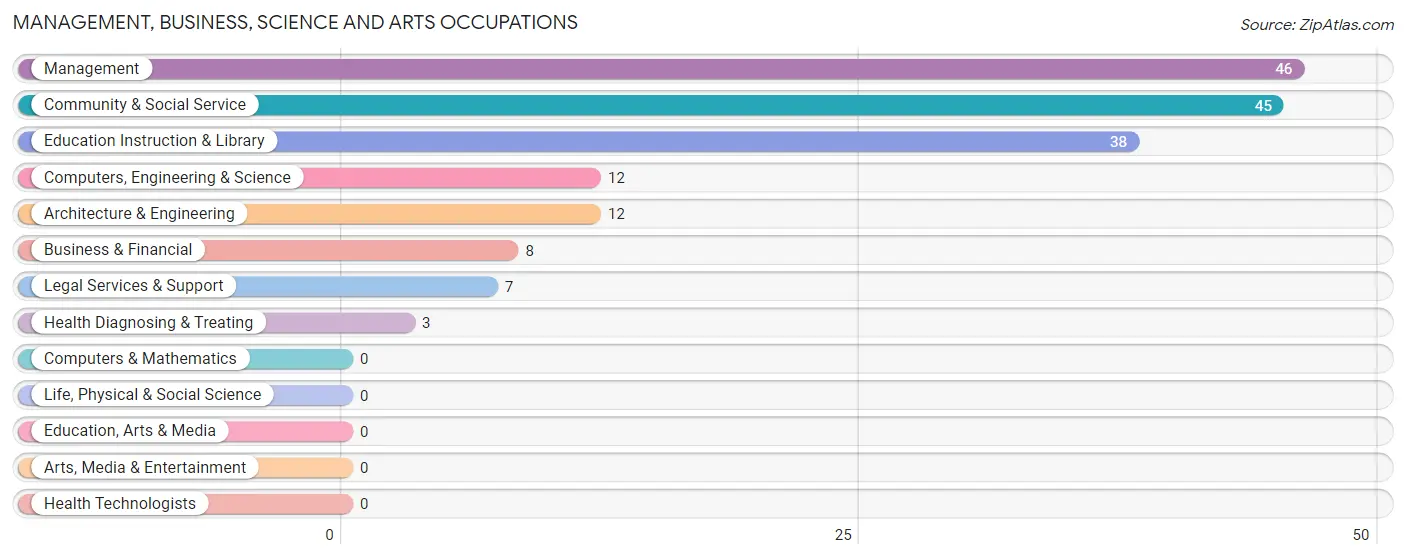
Management, Business, Science and Arts Occupations
The most common Management, Business, Science and Arts occupations in De Leon Springs are Management (46 | 5.3%), Community & Social Service (45 | 5.1%), Education Instruction & Library (38 | 4.3%), Computers, Engineering & Science (12 | 1.4%), and Architecture & Engineering (12 | 1.4%).
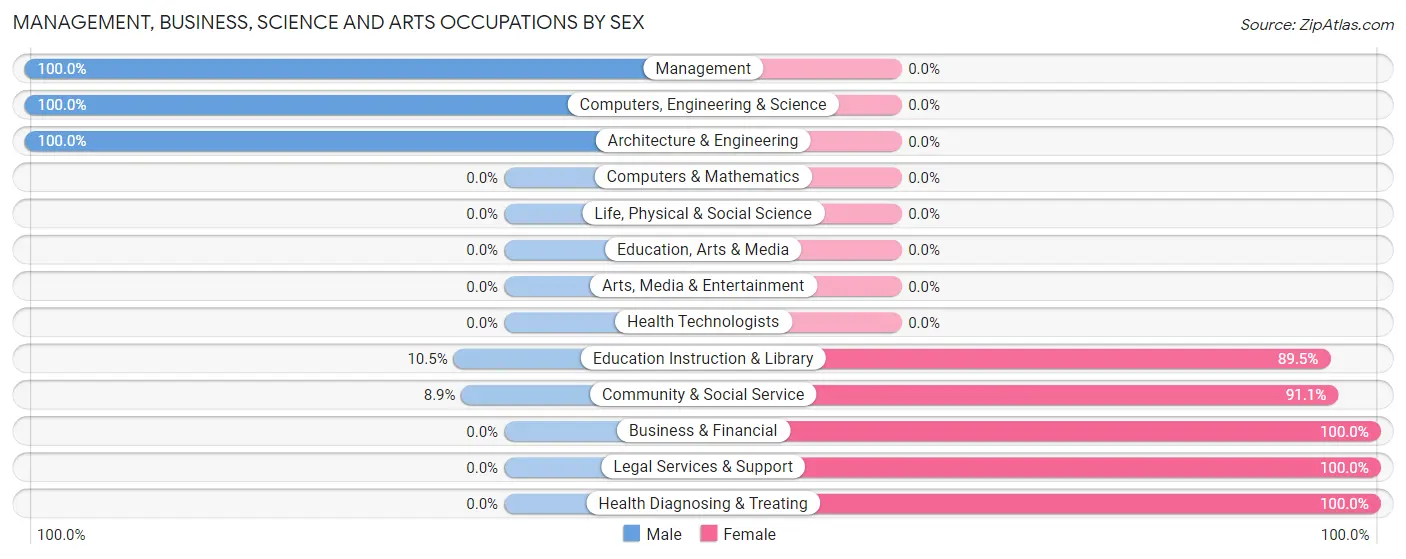
Management, Business, Science and Arts Occupations by Sex
Within the Management, Business, Science and Arts occupations in De Leon Springs, the most male-oriented occupations are Management (100.0%), Computers, Engineering & Science (100.0%), and Architecture & Engineering (100.0%), while the most female-oriented occupations are Business & Financial (100.0%), Legal Services & Support (100.0%), and Health Diagnosing & Treating (100.0%).
| Occupation | Male | Female |
| Management | 46 (100.0%) | 0 (0.0%) |
| Business & Financial | 0 (0.0%) | 8 (100.0%) |
| Computers, Engineering & Science | 12 (100.0%) | 0 (0.0%) |
| Computers & Mathematics | 0 (0.0%) | 0 (0.0%) |
| Architecture & Engineering | 12 (100.0%) | 0 (0.0%) |
| Life, Physical & Social Science | 0 (0.0%) | 0 (0.0%) |
| Community & Social Service | 4 (8.9%) | 41 (91.1%) |
| Education, Arts & Media | 0 (0.0%) | 0 (0.0%) |
| Legal Services & Support | 0 (0.0%) | 7 (100.0%) |
| Education Instruction & Library | 4 (10.5%) | 34 (89.5%) |
| Arts, Media & Entertainment | 0 (0.0%) | 0 (0.0%) |
| Health Diagnosing & Treating | 0 (0.0%) | 3 (100.0%) |
| Health Technologists | 0 (0.0%) | 0 (0.0%) |
| Total (Category) | 62 (54.4%) | 52 (45.6%) |
| Total (Overall) | 580 (66.4%) | 293 (33.6%) |
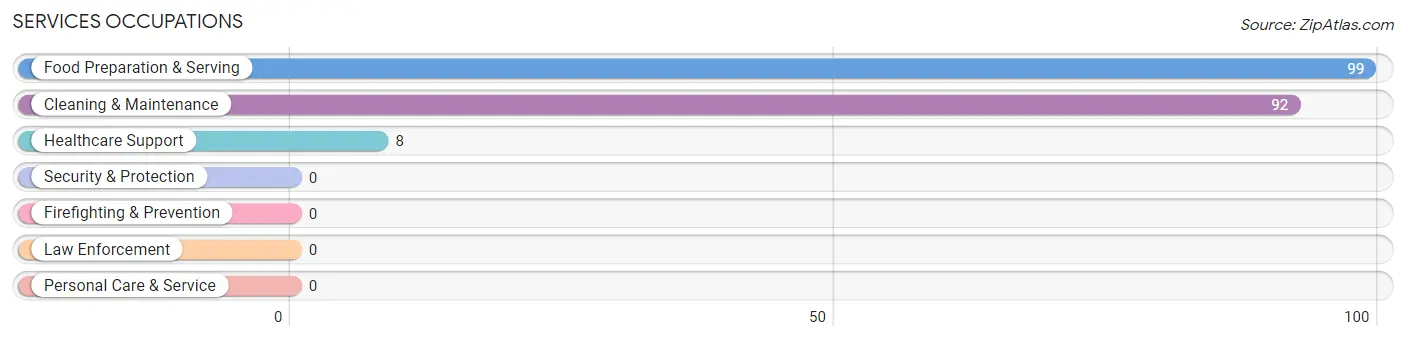
Services Occupations
The most common Services occupations in De Leon Springs are Food Preparation & Serving (99 | 11.3%), Cleaning & Maintenance (92 | 10.5%), and Healthcare Support (8 | 0.9%).
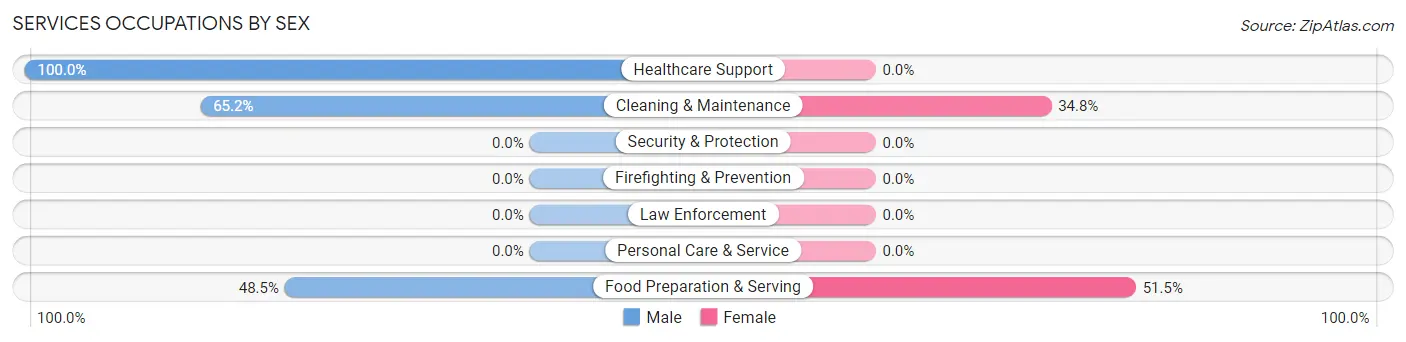
Services Occupations by Sex
Within the Services occupations in De Leon Springs, the most male-oriented occupations are Healthcare Support (100.0%), Cleaning & Maintenance (65.2%), and Food Preparation & Serving (48.5%), while the most female-oriented occupations are Food Preparation & Serving (51.5%), and Cleaning & Maintenance (34.8%).
| Occupation | Male | Female |
| Healthcare Support | 8 (100.0%) | 0 (0.0%) |
| Security & Protection | 0 (0.0%) | 0 (0.0%) |
| Firefighting & Prevention | 0 (0.0%) | 0 (0.0%) |
| Law Enforcement | 0 (0.0%) | 0 (0.0%) |
| Food Preparation & Serving | 48 (48.5%) | 51 (51.5%) |
| Cleaning & Maintenance | 60 (65.2%) | 32 (34.8%) |
| Personal Care & Service | 0 (0.0%) | 0 (0.0%) |
| Total (Category) | 116 (58.3%) | 83 (41.7%) |
| Total (Overall) | 580 (66.4%) | 293 (33.6%) |
Sales and Office Occupations
The most common Sales and Office occupations in De Leon Springs are Sales & Related (107 | 12.3%), and Office & Administration (73 | 8.4%).
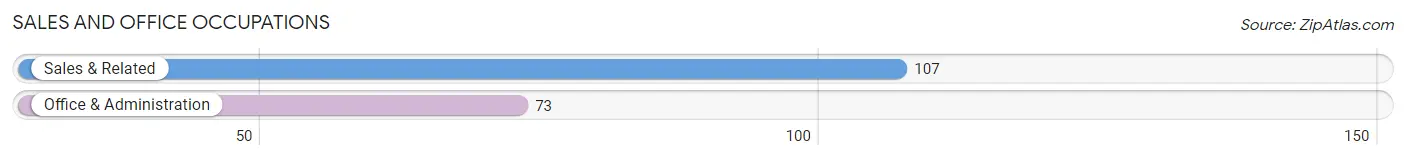
Sales and Office Occupations by Sex
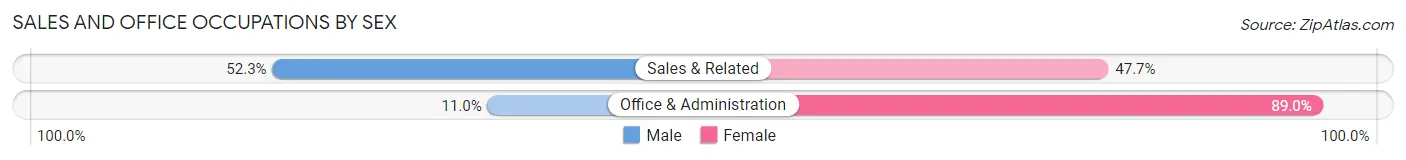
| Occupation | Male | Female |
| Sales & Related | 56 (52.3%) | 51 (47.7%) |
| Office & Administration | 8 (11.0%) | 65 (89.0%) |
| Total (Category) | 64 (35.6%) | 116 (64.4%) |
| Total (Overall) | 580 (66.4%) | 293 (33.6%) |
Natural Resources, Construction and Maintenance Occupations
The most common Natural Resources, Construction and Maintenance occupations in De Leon Springs are Construction & Extraction (97 | 11.1%), Installation, Maintenance & Repair (71 | 8.1%), and Farming, Fishing & Forestry (41 | 4.7%).
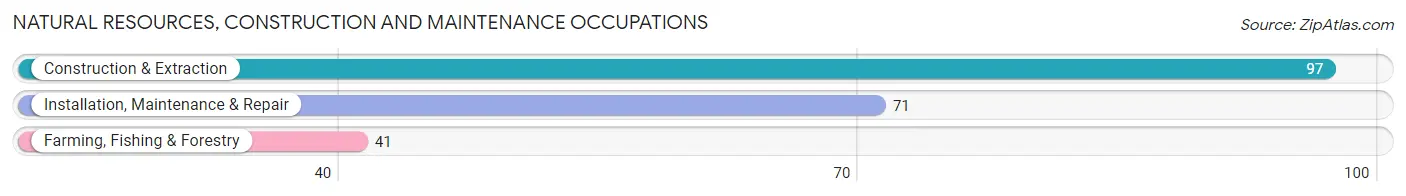
Natural Resources, Construction and Maintenance Occupations by Sex
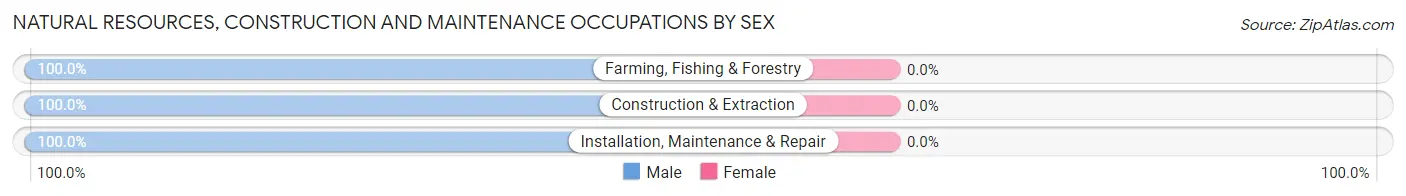
| Occupation | Male | Female |
| Farming, Fishing & Forestry | 41 (100.0%) | 0 (0.0%) |
| Construction & Extraction | 97 (100.0%) | 0 (0.0%) |
| Installation, Maintenance & Repair | 71 (100.0%) | 0 (0.0%) |
| Total (Category) | 209 (100.0%) | 0 (0.0%) |
| Total (Overall) | 580 (66.4%) | 293 (33.6%) |
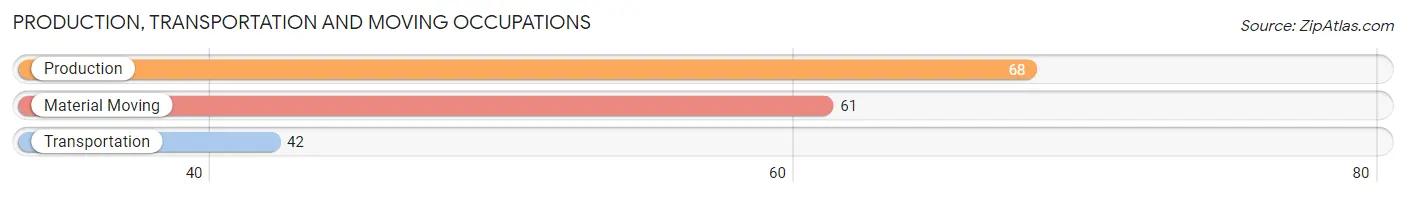
Production, Transportation and Moving Occupations
The most common Production, Transportation and Moving occupations in De Leon Springs are Production (68 | 7.8%), Material Moving (61 | 7.0%), and Transportation (42 | 4.8%).
Production, Transportation and Moving Occupations by Sex
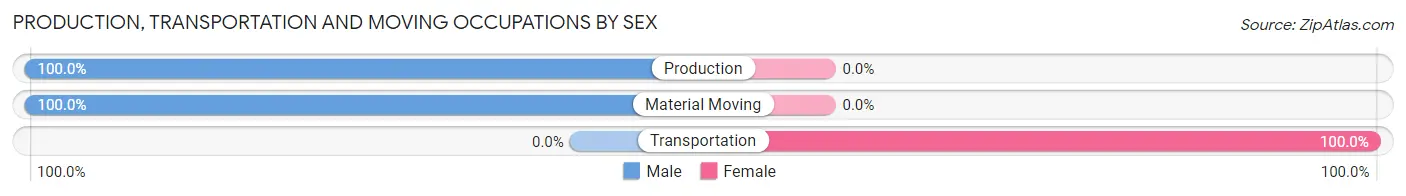
| Occupation | Male | Female |
| Production | 68 (100.0%) | 0 (0.0%) |
| Transportation | 0 (0.0%) | 42 (100.0%) |
| Material Moving | 61 (100.0%) | 0 (0.0%) |
| Total (Category) | 129 (75.4%) | 42 (24.6%) |
| Total (Overall) | 580 (66.4%) | 293 (33.6%) |
Employment Industries by Sex in De Leon Springs
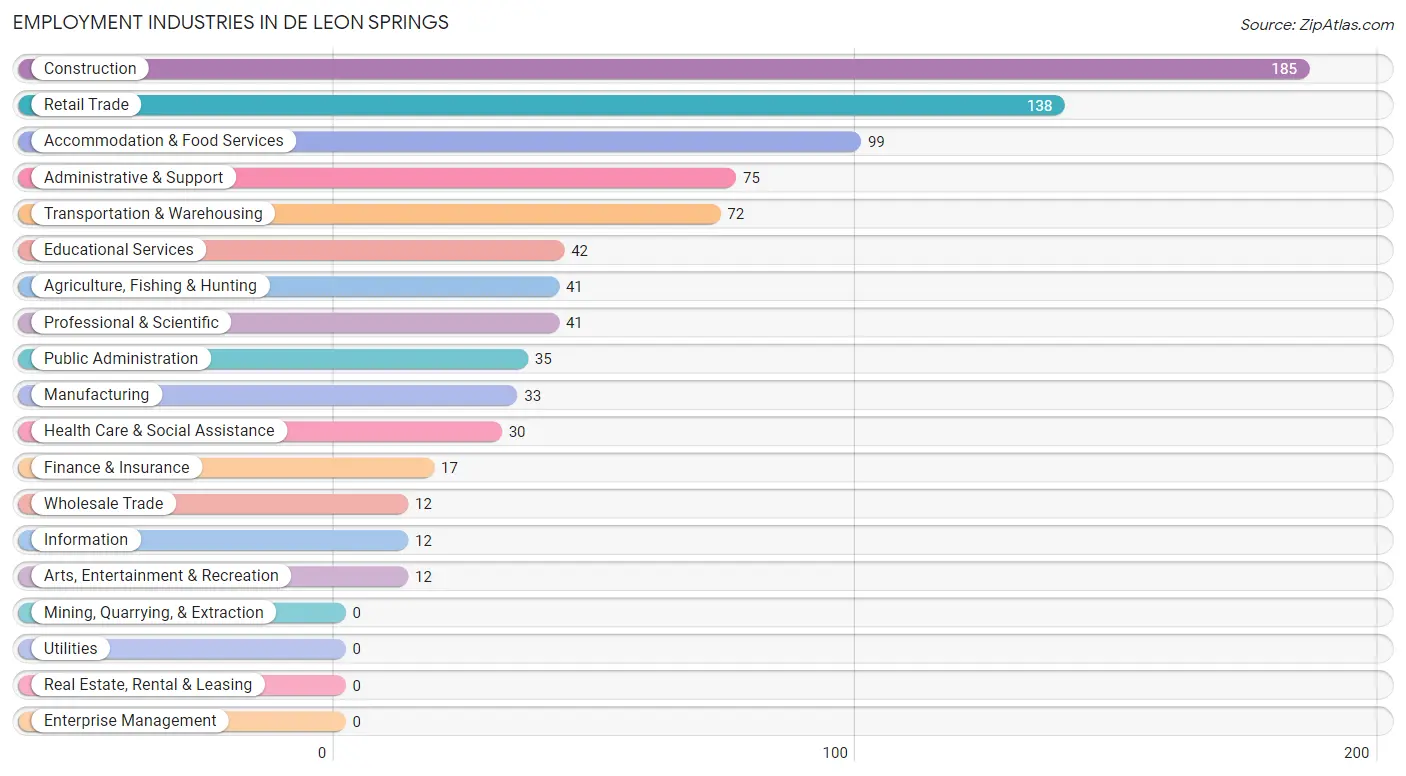
Employment Industries in De Leon Springs
The major employment industries in De Leon Springs include Construction (185 | 21.2%), Retail Trade (138 | 15.8%), Accommodation & Food Services (99 | 11.3%), Administrative & Support (75 | 8.6%), and Transportation & Warehousing (72 | 8.3%).
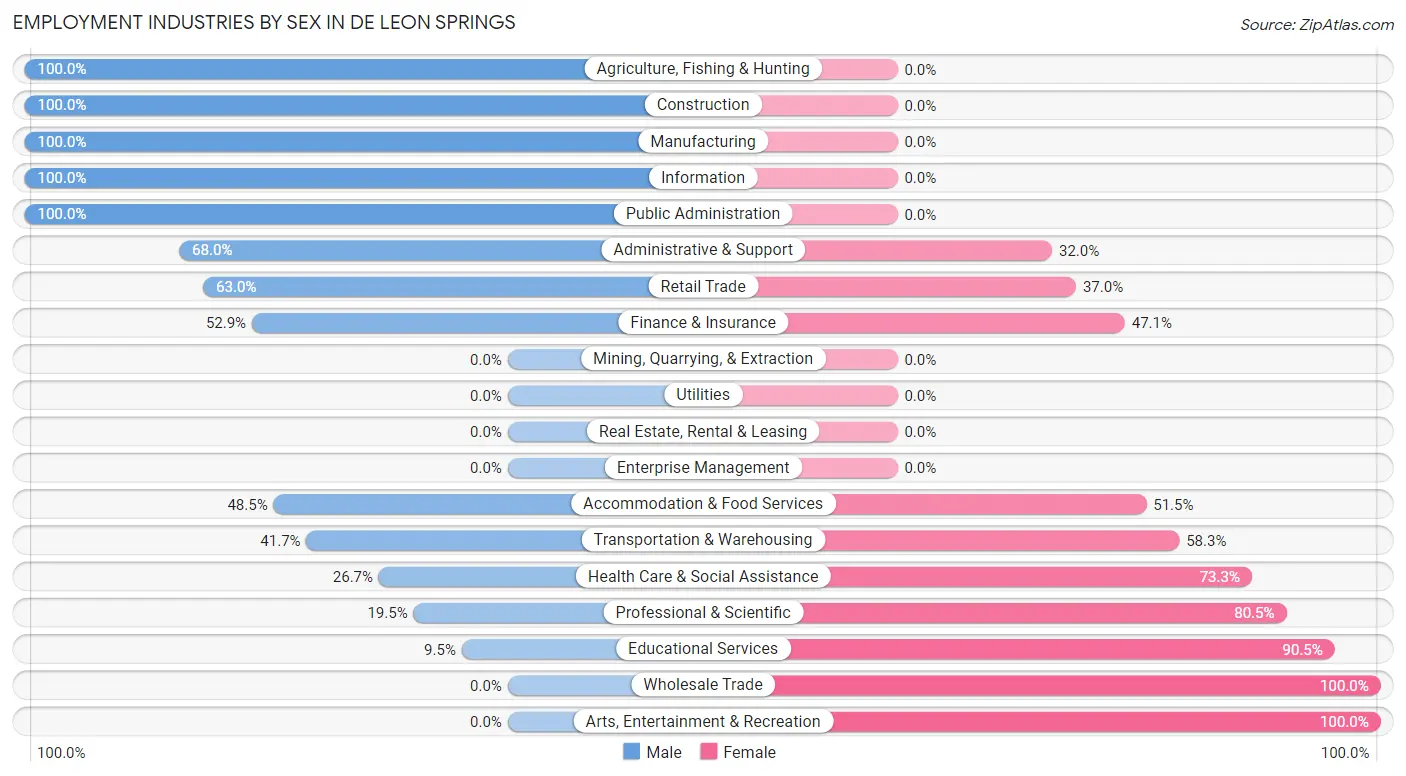
Employment Industries by Sex in De Leon Springs
The De Leon Springs industries that see more men than women are Agriculture, Fishing & Hunting (100.0%), Construction (100.0%), and Manufacturing (100.0%), whereas the industries that tend to have a higher number of women are Wholesale Trade (100.0%), Arts, Entertainment & Recreation (100.0%), and Educational Services (90.5%).
| Industry | Male | Female |
| Agriculture, Fishing & Hunting | 41 (100.0%) | 0 (0.0%) |
| Mining, Quarrying, & Extraction | 0 (0.0%) | 0 (0.0%) |
| Construction | 185 (100.0%) | 0 (0.0%) |
| Manufacturing | 33 (100.0%) | 0 (0.0%) |
| Wholesale Trade | 0 (0.0%) | 12 (100.0%) |
| Retail Trade | 87 (63.0%) | 51 (37.0%) |
| Transportation & Warehousing | 30 (41.7%) | 42 (58.3%) |
| Utilities | 0 (0.0%) | 0 (0.0%) |
| Information | 12 (100.0%) | 0 (0.0%) |
| Finance & Insurance | 9 (52.9%) | 8 (47.1%) |
| Real Estate, Rental & Leasing | 0 (0.0%) | 0 (0.0%) |
| Professional & Scientific | 8 (19.5%) | 33 (80.5%) |
| Enterprise Management | 0 (0.0%) | 0 (0.0%) |
| Administrative & Support | 51 (68.0%) | 24 (32.0%) |
| Educational Services | 4 (9.5%) | 38 (90.5%) |
| Health Care & Social Assistance | 8 (26.7%) | 22 (73.3%) |
| Arts, Entertainment & Recreation | 0 (0.0%) | 12 (100.0%) |
| Accommodation & Food Services | 48 (48.5%) | 51 (51.5%) |
| Public Administration | 35 (100.0%) | 0 (0.0%) |
| Total | 580 (66.4%) | 293 (33.6%) |
Education in De Leon Springs
School Enrollment in De Leon Springs
The most common levels of schooling among the 744 students in De Leon Springs are elementary school (217 | 29.2%), middle school (186 | 25.0%), and college / undergraduate (147 | 19.8%).
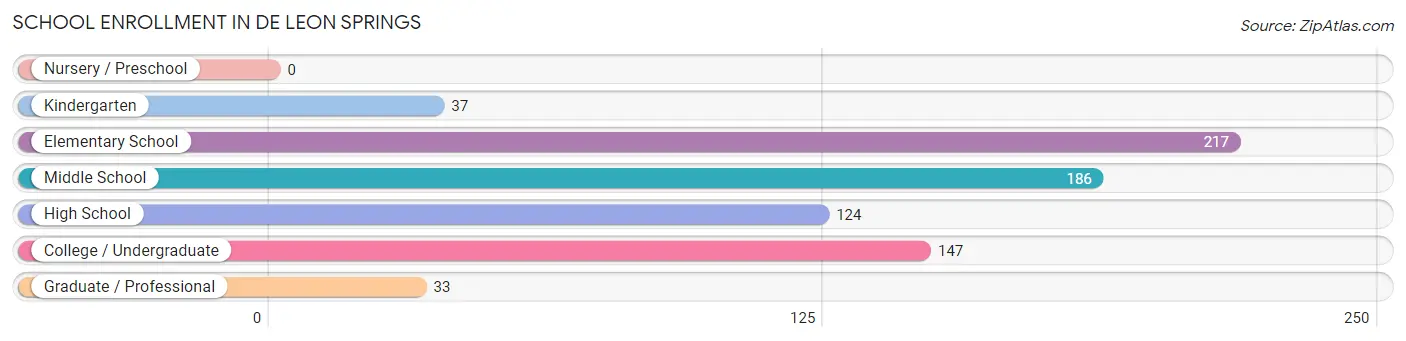
| School Level | # Students | % Students |
| Nursery / Preschool | 0 | 0.0% |
| Kindergarten | 37 | 5.0% |
| Elementary School | 217 | 29.2% |
| Middle School | 186 | 25.0% |
| High School | 124 | 16.7% |
| College / Undergraduate | 147 | 19.8% |
| Graduate / Professional | 33 | 4.4% |
| Total | 744 | 100.0% |
School Enrollment by Age by Funding Source in De Leon Springs
Out of a total of 744 students who are enrolled in schools in De Leon Springs, 170 (22.8%) attend a private institution, while the remaining 574 (77.2%) are enrolled in public schools. The age group of 25 to 34 year olds has the highest likelihood of being enrolled in private schools, with 44 (100.0% in the age bracket) enrolled. Conversely, the age group of 15 to 17 year olds has the lowest likelihood of being enrolled in a private school, with 104 (100.0% in the age bracket) attending a public institution.
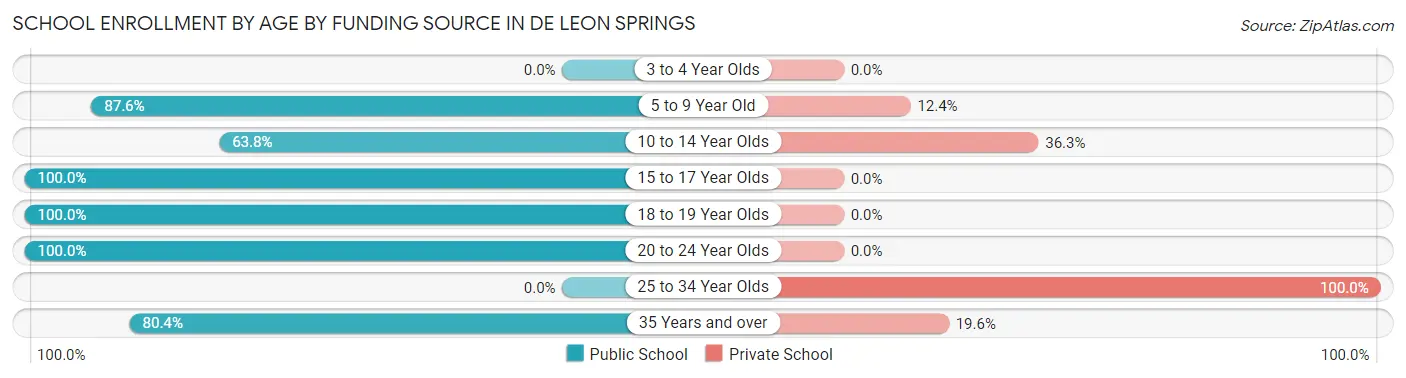
| Age Bracket | Public School | Private School |
| 3 to 4 Year Olds | 0 (0.0%) | 0 (0.0%) |
| 5 to 9 Year Old | 183 (87.6%) | 26 (12.4%) |
| 10 to 14 Year Olds | 160 (63.7%) | 91 (36.2%) |
| 15 to 17 Year Olds | 104 (100.0%) | 0 (0.0%) |
| 18 to 19 Year Olds | 40 (100.0%) | 0 (0.0%) |
| 20 to 24 Year Olds | 50 (100.0%) | 0 (0.0%) |
| 25 to 34 Year Olds | 0 (0.0%) | 44 (100.0%) |
| 35 Years and over | 37 (80.4%) | 9 (19.6%) |
| Total | 574 (77.2%) | 170 (22.8%) |
Educational Attainment by Field of Study in De Leon Springs
Education (76 | 33.0%), business (50 | 21.7%), science & technology (29 | 12.6%), bio, nature & agricultural (16 | 7.0%), and social sciences (15 | 6.5%) are the most common fields of study among 230 individuals in De Leon Springs who have obtained a bachelor's degree or higher.
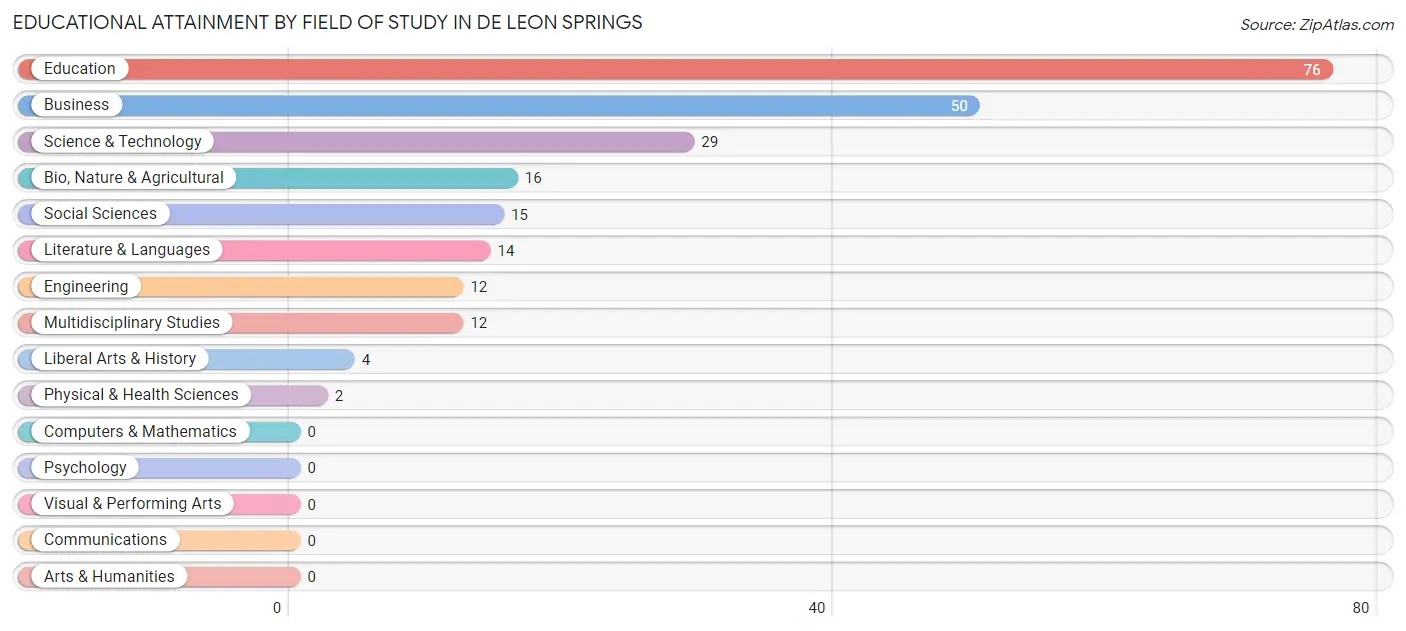
| Field of Study | # Graduates | % Graduates |
| Computers & Mathematics | 0 | 0.0% |
| Bio, Nature & Agricultural | 16 | 7.0% |
| Physical & Health Sciences | 2 | 0.9% |
| Psychology | 0 | 0.0% |
| Social Sciences | 15 | 6.5% |
| Engineering | 12 | 5.2% |
| Multidisciplinary Studies | 12 | 5.2% |
| Science & Technology | 29 | 12.6% |
| Business | 50 | 21.7% |
| Education | 76 | 33.0% |
| Literature & Languages | 14 | 6.1% |
| Liberal Arts & History | 4 | 1.7% |
| Visual & Performing Arts | 0 | 0.0% |
| Communications | 0 | 0.0% |
| Arts & Humanities | 0 | 0.0% |
| Total | 230 | 100.0% |
Transportation & Commute in De Leon Springs
Vehicle Availability by Sex in De Leon Springs
The most prevalent vehicle ownership categories in De Leon Springs are males with 2 vehicles (293, accounting for 50.5%) and females with 2 vehicles (39, making up 100.0%).
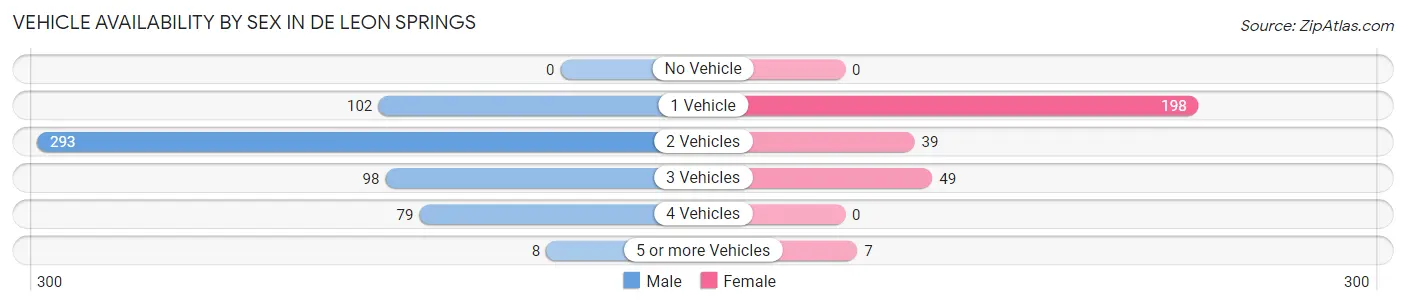
| Vehicles Available | Male | Female |
| No Vehicle | 0 (0.0%) | 0 (0.0%) |
| 1 Vehicle | 102 (17.6%) | 198 (67.6%) |
| 2 Vehicles | 293 (50.5%) | 39 (13.3%) |
| 3 Vehicles | 98 (16.9%) | 49 (16.7%) |
| 4 Vehicles | 79 (13.6%) | 0 (0.0%) |
| 5 or more Vehicles | 8 (1.4%) | 7 (2.4%) |
| Total | 580 (100.0%) | 293 (100.0%) |
Commute Time in De Leon Springs
The most frequently occuring commute durations in De Leon Springs are 60 to 89 minutes (185 commuters, 23.4%), 15 to 19 minutes (126 commuters, 15.9%), and 30 to 34 minutes (107 commuters, 13.5%).
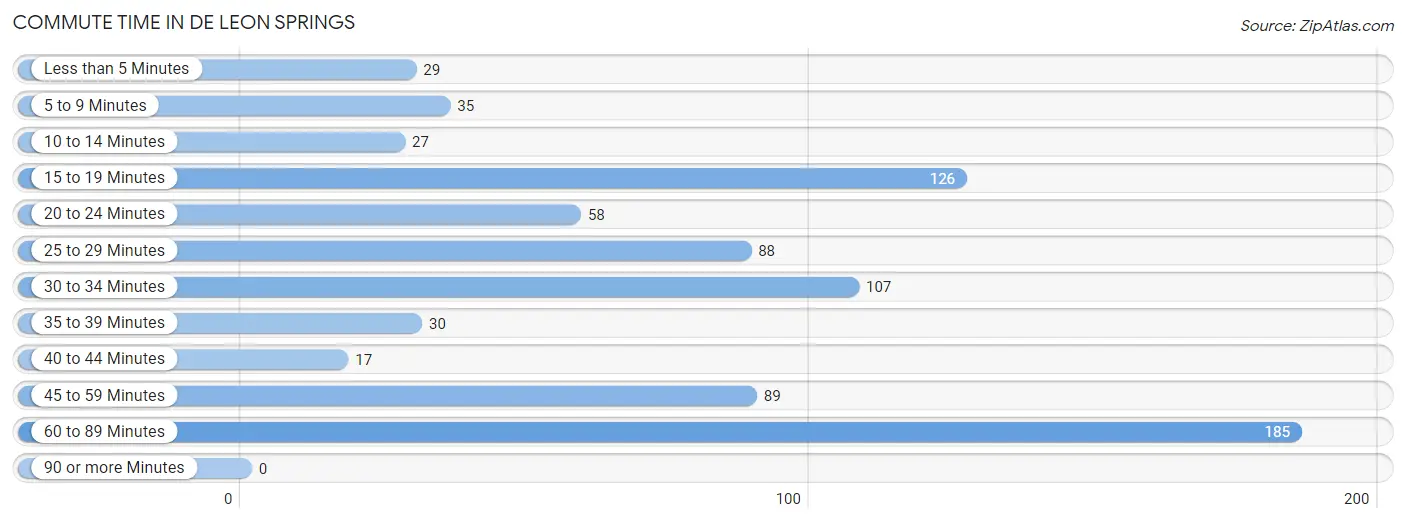
| Commute Time | # Commuters | % Commuters |
| Less than 5 Minutes | 29 | 3.7% |
| 5 to 9 Minutes | 35 | 4.4% |
| 10 to 14 Minutes | 27 | 3.4% |
| 15 to 19 Minutes | 126 | 15.9% |
| 20 to 24 Minutes | 58 | 7.3% |
| 25 to 29 Minutes | 88 | 11.1% |
| 30 to 34 Minutes | 107 | 13.5% |
| 35 to 39 Minutes | 30 | 3.8% |
| 40 to 44 Minutes | 17 | 2.1% |
| 45 to 59 Minutes | 89 | 11.3% |
| 60 to 89 Minutes | 185 | 23.4% |
| 90 or more Minutes | 0 | 0.0% |
Commute Time by Sex in De Leon Springs
The most common commute times in De Leon Springs are 60 to 89 minutes (114 commuters, 21.8%) for males and 15 to 19 minutes (77 commuters, 28.6%) for females.
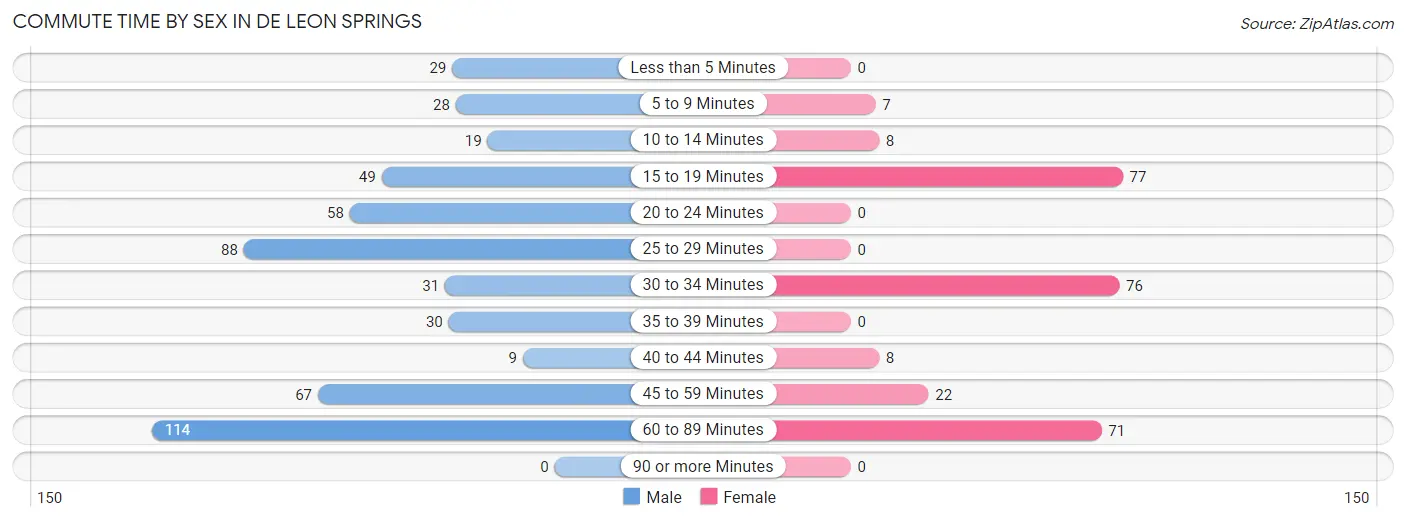
| Commute Time | Male | Female |
| Less than 5 Minutes | 29 (5.6%) | 0 (0.0%) |
| 5 to 9 Minutes | 28 (5.4%) | 7 (2.6%) |
| 10 to 14 Minutes | 19 (3.6%) | 8 (3.0%) |
| 15 to 19 Minutes | 49 (9.4%) | 77 (28.6%) |
| 20 to 24 Minutes | 58 (11.1%) | 0 (0.0%) |
| 25 to 29 Minutes | 88 (16.9%) | 0 (0.0%) |
| 30 to 34 Minutes | 31 (5.9%) | 76 (28.2%) |
| 35 to 39 Minutes | 30 (5.8%) | 0 (0.0%) |
| 40 to 44 Minutes | 9 (1.7%) | 8 (3.0%) |
| 45 to 59 Minutes | 67 (12.8%) | 22 (8.2%) |
| 60 to 89 Minutes | 114 (21.8%) | 71 (26.4%) |
| 90 or more Minutes | 0 (0.0%) | 0 (0.0%) |
Time of Departure to Work by Sex in De Leon Springs
The most frequent times of departure to work in De Leon Springs are 7:00 AM to 7:29 AM (128, 24.5%) for males and 8:00 AM to 8:29 AM (59, 21.9%) for females.
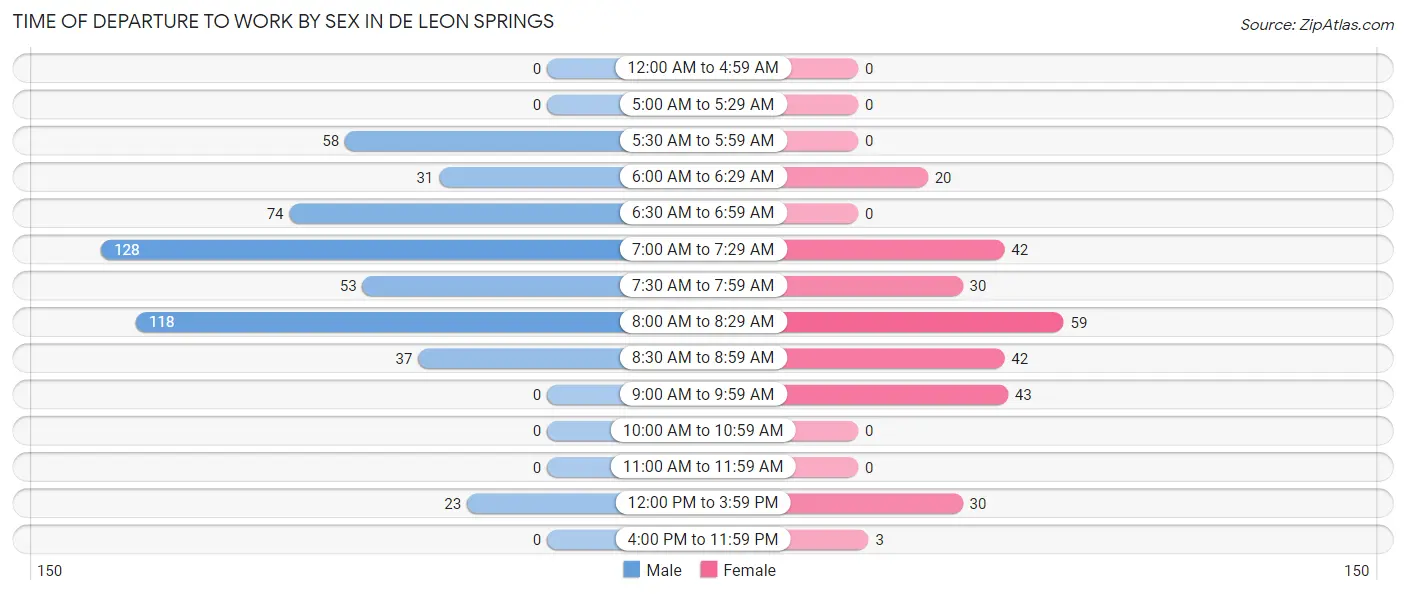
| Time of Departure | Male | Female |
| 12:00 AM to 4:59 AM | 0 (0.0%) | 0 (0.0%) |
| 5:00 AM to 5:29 AM | 0 (0.0%) | 0 (0.0%) |
| 5:30 AM to 5:59 AM | 58 (11.1%) | 0 (0.0%) |
| 6:00 AM to 6:29 AM | 31 (5.9%) | 20 (7.4%) |
| 6:30 AM to 6:59 AM | 74 (14.2%) | 0 (0.0%) |
| 7:00 AM to 7:29 AM | 128 (24.5%) | 42 (15.6%) |
| 7:30 AM to 7:59 AM | 53 (10.2%) | 30 (11.2%) |
| 8:00 AM to 8:29 AM | 118 (22.6%) | 59 (21.9%) |
| 8:30 AM to 8:59 AM | 37 (7.1%) | 42 (15.6%) |
| 9:00 AM to 9:59 AM | 0 (0.0%) | 43 (16.0%) |
| 10:00 AM to 10:59 AM | 0 (0.0%) | 0 (0.0%) |
| 11:00 AM to 11:59 AM | 0 (0.0%) | 0 (0.0%) |
| 12:00 PM to 3:59 PM | 23 (4.4%) | 30 (11.2%) |
| 4:00 PM to 11:59 PM | 0 (0.0%) | 3 (1.1%) |
| Total | 522 (100.0%) | 269 (100.0%) |
Housing Occupancy in De Leon Springs
Occupancy by Ownership in De Leon Springs
Of the total 871 dwellings in De Leon Springs, owner-occupied units account for 703 (80.7%), while renter-occupied units make up 168 (19.3%).
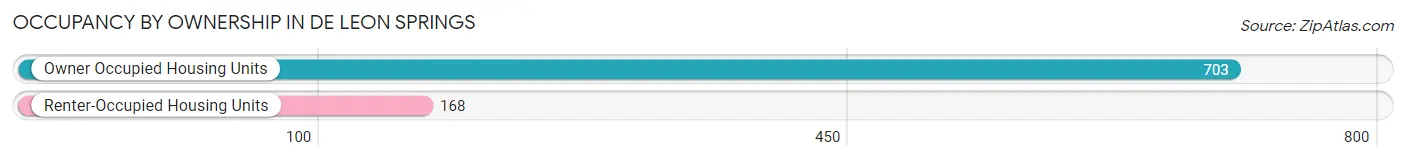
| Occupancy | # Housing Units | % Housing Units |
| Owner Occupied Housing Units | 703 | 80.7% |
| Renter-Occupied Housing Units | 168 | 19.3% |
| Total Occupied Housing Units | 871 | 100.0% |
Occupancy by Household Size in De Leon Springs
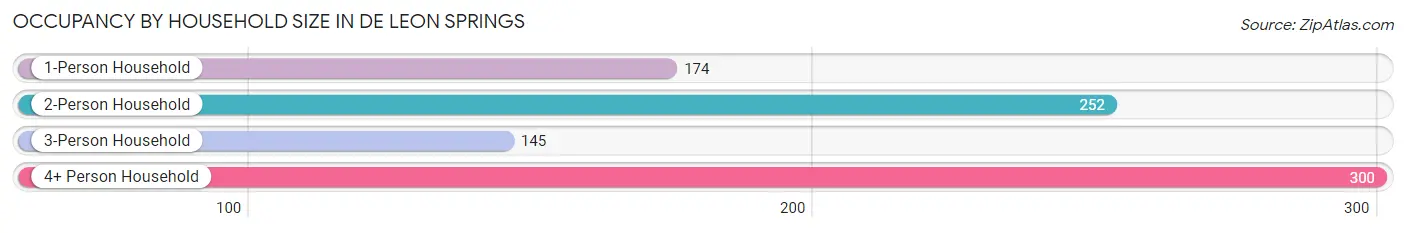
| Household Size | # Housing Units | % Housing Units |
| 1-Person Household | 174 | 20.0% |
| 2-Person Household | 252 | 28.9% |
| 3-Person Household | 145 | 16.7% |
| 4+ Person Household | 300 | 34.4% |
| Total Housing Units | 871 | 100.0% |
Occupancy by Ownership by Household Size in De Leon Springs
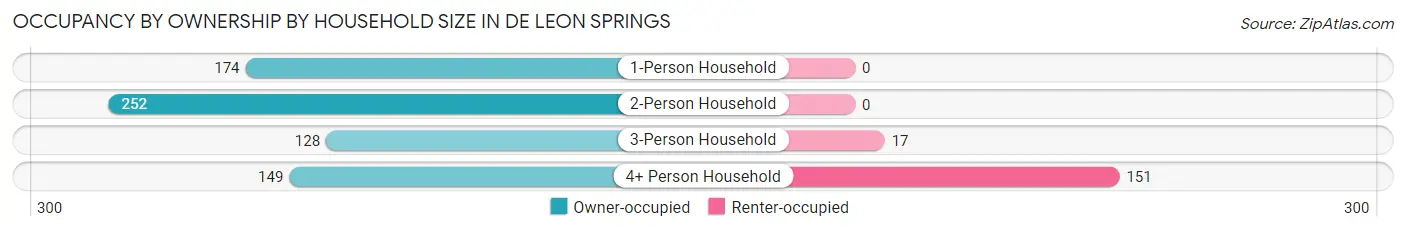
| Household Size | Owner-occupied | Renter-occupied |
| 1-Person Household | 174 (100.0%) | 0 (0.0%) |
| 2-Person Household | 252 (100.0%) | 0 (0.0%) |
| 3-Person Household | 128 (88.3%) | 17 (11.7%) |
| 4+ Person Household | 149 (49.7%) | 151 (50.3%) |
| Total Housing Units | 703 (80.7%) | 168 (19.3%) |
Occupancy by Educational Attainment in De Leon Springs
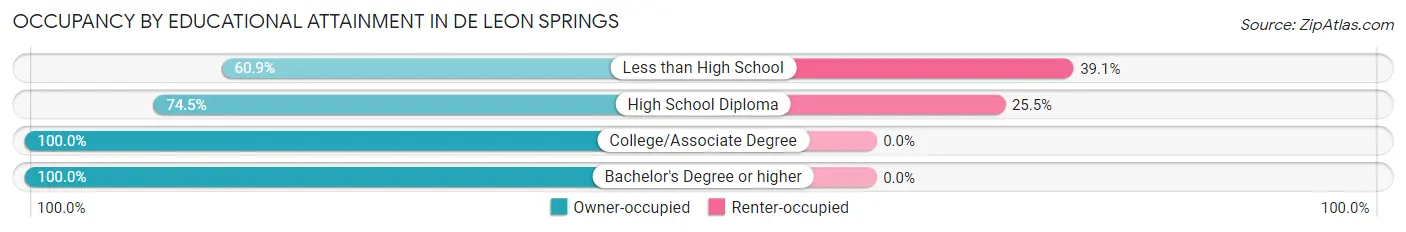
| Household Size | Owner-occupied | Renter-occupied |
| Less than High School | 92 (60.9%) | 59 (39.1%) |
| High School Diploma | 318 (74.5%) | 109 (25.5%) |
| College/Associate Degree | 186 (100.0%) | 0 (0.0%) |
| Bachelor's Degree or higher | 107 (100.0%) | 0 (0.0%) |
Occupancy by Age of Householder in De Leon Springs
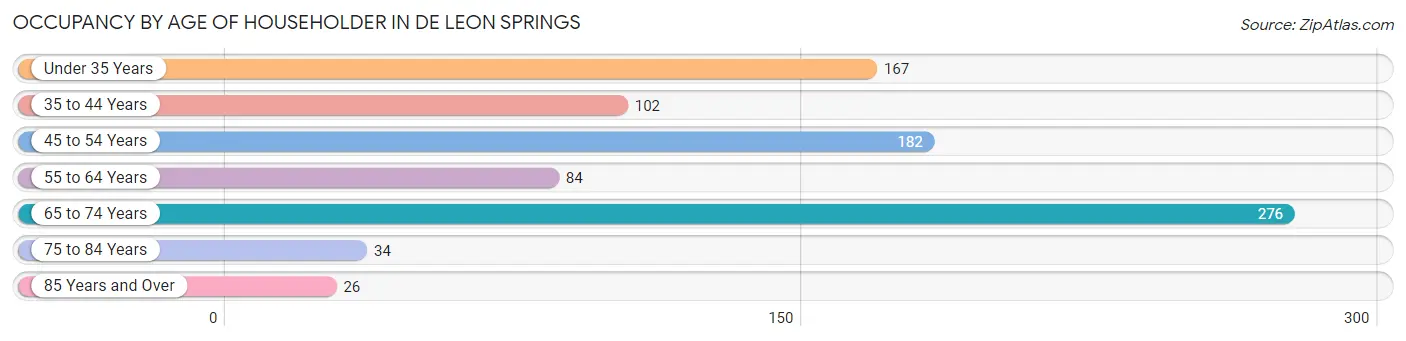
| Age Bracket | # Households | % Households |
| Under 35 Years | 167 | 19.2% |
| 35 to 44 Years | 102 | 11.7% |
| 45 to 54 Years | 182 | 20.9% |
| 55 to 64 Years | 84 | 9.6% |
| 65 to 74 Years | 276 | 31.7% |
| 75 to 84 Years | 34 | 3.9% |
| 85 Years and Over | 26 | 3.0% |
| Total | 871 | 100.0% |
Housing Finances in De Leon Springs
Median Income by Occupancy in De Leon Springs
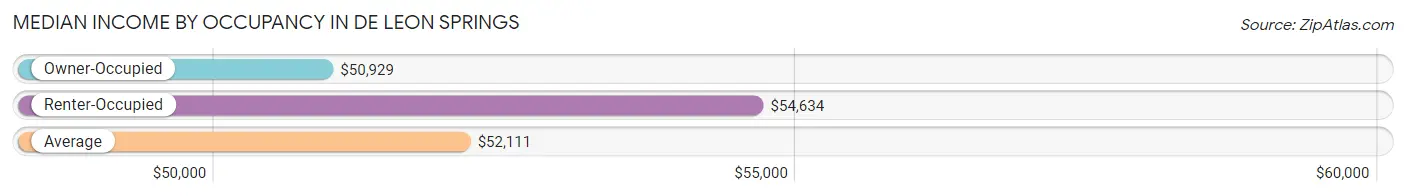
| Occupancy Type | # Households | Median Income |
| Owner-Occupied | 703 (80.7%) | $50,929 |
| Renter-Occupied | 168 (19.3%) | $54,634 |
| Average | 871 (100.0%) | $52,111 |
Occupancy by Householder Income Bracket in De Leon Springs
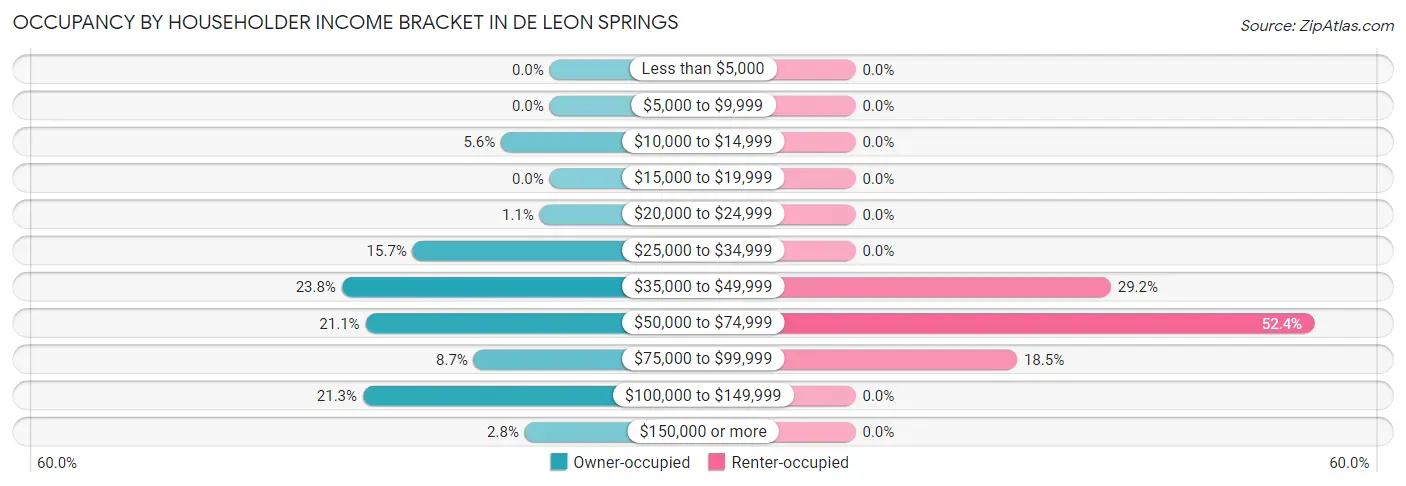
| Income Bracket | Owner-occupied | Renter-occupied |
| Less than $5,000 | 0 (0.0%) | 0 (0.0%) |
| $5,000 to $9,999 | 0 (0.0%) | 0 (0.0%) |
| $10,000 to $14,999 | 39 (5.6%) | 0 (0.0%) |
| $15,000 to $19,999 | 0 (0.0%) | 0 (0.0%) |
| $20,000 to $24,999 | 8 (1.1%) | 0 (0.0%) |
| $25,000 to $34,999 | 110 (15.7%) | 0 (0.0%) |
| $35,000 to $49,999 | 167 (23.8%) | 49 (29.2%) |
| $50,000 to $74,999 | 148 (21.0%) | 88 (52.4%) |
| $75,000 to $99,999 | 61 (8.7%) | 31 (18.4%) |
| $100,000 to $149,999 | 150 (21.3%) | 0 (0.0%) |
| $150,000 or more | 20 (2.8%) | 0 (0.0%) |
| Total | 703 (100.0%) | 168 (100.0%) |
Monthly Housing Cost Tiers in De Leon Springs
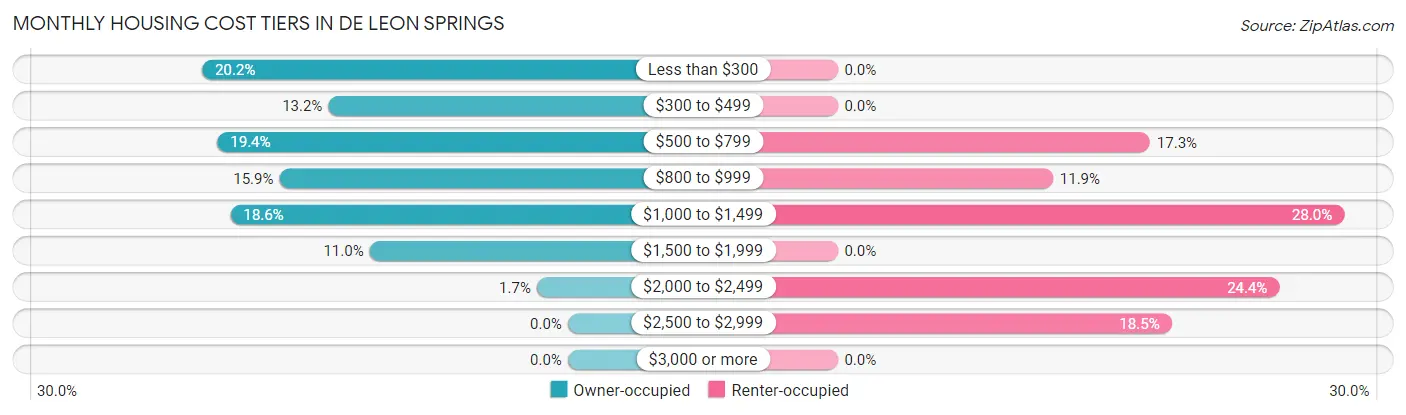
| Monthly Cost | Owner-occupied | Renter-occupied |
| Less than $300 | 142 (20.2%) | 0 (0.0%) |
| $300 to $499 | 93 (13.2%) | 0 (0.0%) |
| $500 to $799 | 136 (19.4%) | 29 (17.3%) |
| $800 to $999 | 112 (15.9%) | 20 (11.9%) |
| $1,000 to $1,499 | 131 (18.6%) | 47 (28.0%) |
| $1,500 to $1,999 | 77 (11.0%) | 0 (0.0%) |
| $2,000 to $2,499 | 12 (1.7%) | 41 (24.4%) |
| $2,500 to $2,999 | 0 (0.0%) | 31 (18.4%) |
| $3,000 or more | 0 (0.0%) | 0 (0.0%) |
| Total | 703 (100.0%) | 168 (100.0%) |
Physical Housing Characteristics in De Leon Springs
Housing Structures in De Leon Springs
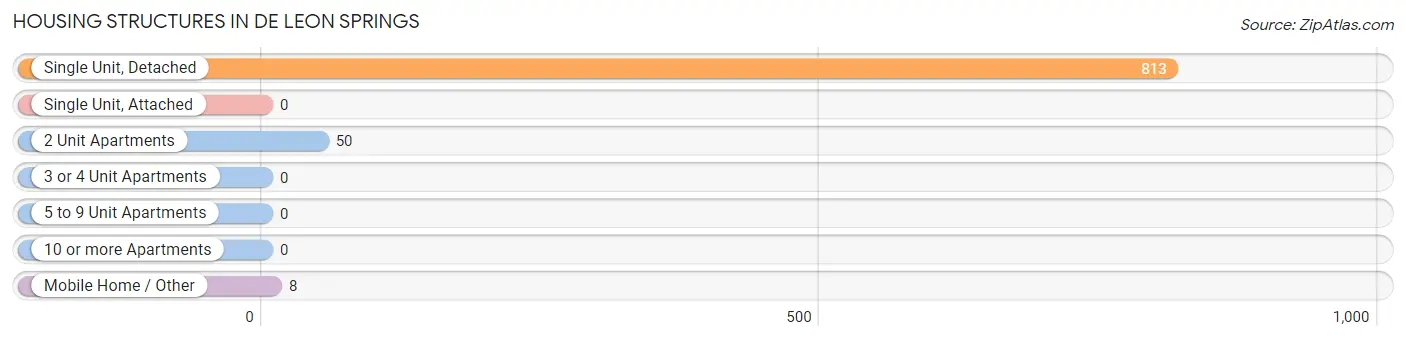
| Structure Type | # Housing Units | % Housing Units |
| Single Unit, Detached | 813 | 93.3% |
| Single Unit, Attached | 0 | 0.0% |
| 2 Unit Apartments | 50 | 5.7% |
| 3 or 4 Unit Apartments | 0 | 0.0% |
| 5 to 9 Unit Apartments | 0 | 0.0% |
| 10 or more Apartments | 0 | 0.0% |
| Mobile Home / Other | 8 | 0.9% |
| Total | 871 | 100.0% |
Housing Structures by Occupancy in De Leon Springs
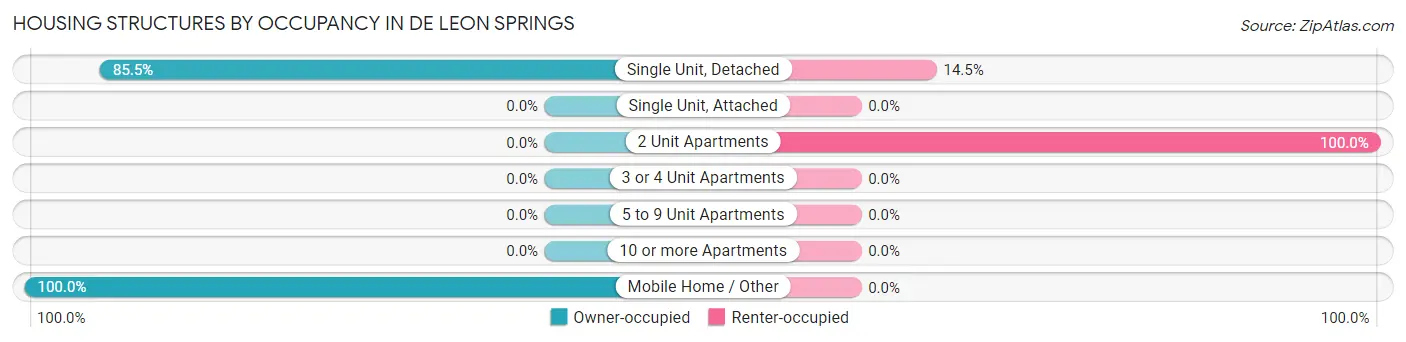
| Structure Type | Owner-occupied | Renter-occupied |
| Single Unit, Detached | 695 (85.5%) | 118 (14.5%) |
| Single Unit, Attached | 0 (0.0%) | 0 (0.0%) |
| 2 Unit Apartments | 0 (0.0%) | 50 (100.0%) |
| 3 or 4 Unit Apartments | 0 (0.0%) | 0 (0.0%) |
| 5 to 9 Unit Apartments | 0 (0.0%) | 0 (0.0%) |
| 10 or more Apartments | 0 (0.0%) | 0 (0.0%) |
| Mobile Home / Other | 8 (100.0%) | 0 (0.0%) |
| Total | 703 (80.7%) | 168 (19.3%) |
Housing Structures by Number of Rooms in De Leon Springs
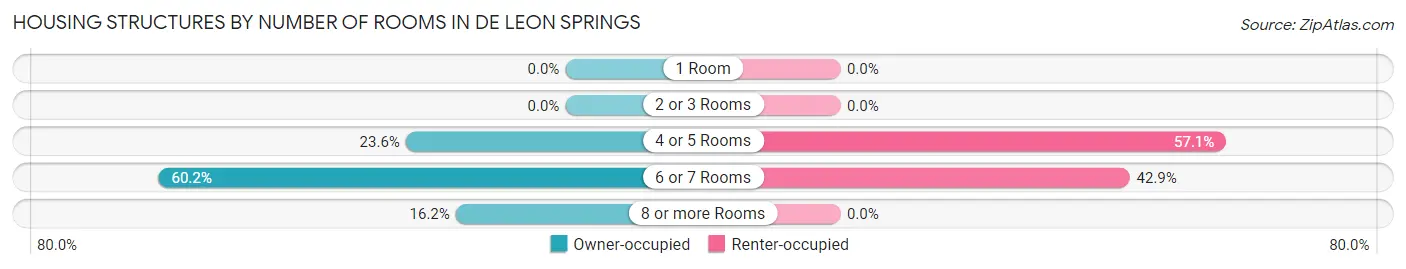
| Number of Rooms | Owner-occupied | Renter-occupied |
| 1 Room | 0 (0.0%) | 0 (0.0%) |
| 2 or 3 Rooms | 0 (0.0%) | 0 (0.0%) |
| 4 or 5 Rooms | 166 (23.6%) | 96 (57.1%) |
| 6 or 7 Rooms | 423 (60.2%) | 72 (42.9%) |
| 8 or more Rooms | 114 (16.2%) | 0 (0.0%) |
| Total | 703 (100.0%) | 168 (100.0%) |
Housing Structure by Heating Type in De Leon Springs
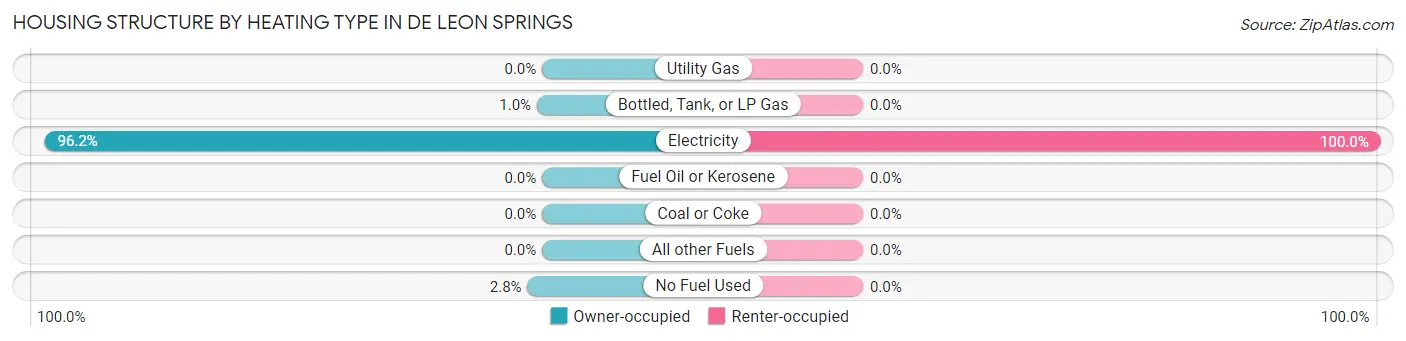
| Heating Type | Owner-occupied | Renter-occupied |
| Utility Gas | 0 (0.0%) | 0 (0.0%) |
| Bottled, Tank, or LP Gas | 7 (1.0%) | 0 (0.0%) |
| Electricity | 676 (96.2%) | 168 (100.0%) |
| Fuel Oil or Kerosene | 0 (0.0%) | 0 (0.0%) |
| Coal or Coke | 0 (0.0%) | 0 (0.0%) |
| All other Fuels | 0 (0.0%) | 0 (0.0%) |
| No Fuel Used | 20 (2.8%) | 0 (0.0%) |
| Total | 703 (100.0%) | 168 (100.0%) |
Household Vehicle Usage in De Leon Springs
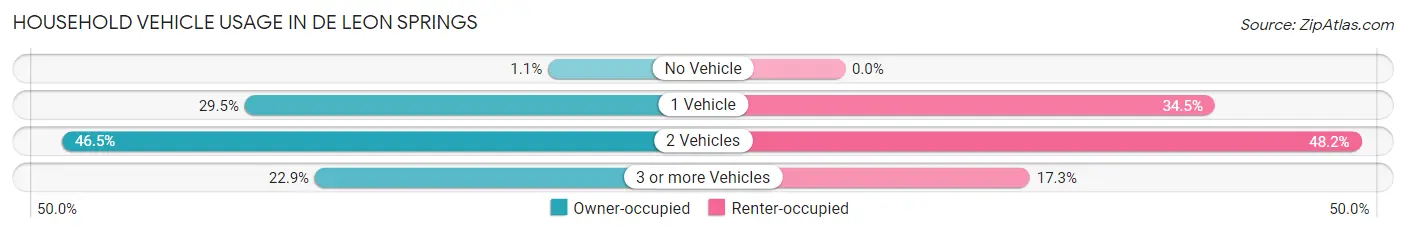
| Vehicles per Household | Owner-occupied | Renter-occupied |
| No Vehicle | 8 (1.1%) | 0 (0.0%) |
| 1 Vehicle | 207 (29.4%) | 58 (34.5%) |
| 2 Vehicles | 327 (46.5%) | 81 (48.2%) |
| 3 or more Vehicles | 161 (22.9%) | 29 (17.3%) |
| Total | 703 (100.0%) | 168 (100.0%) |
Real Estate & Mortgages in De Leon Springs
Real Estate and Mortgage Overview in De Leon Springs
| Characteristic | Without Mortgage | With Mortgage |
| Housing Units | 287 | 416 |
| Median Property Value | $192,000 | $216,000 |
| Median Household Income | $58,661 | $12 |
| Monthly Housing Costs | $301 | $0 |
| Real Estate Taxes | $1,372 | $38 |
Property Value by Mortgage Status in De Leon Springs
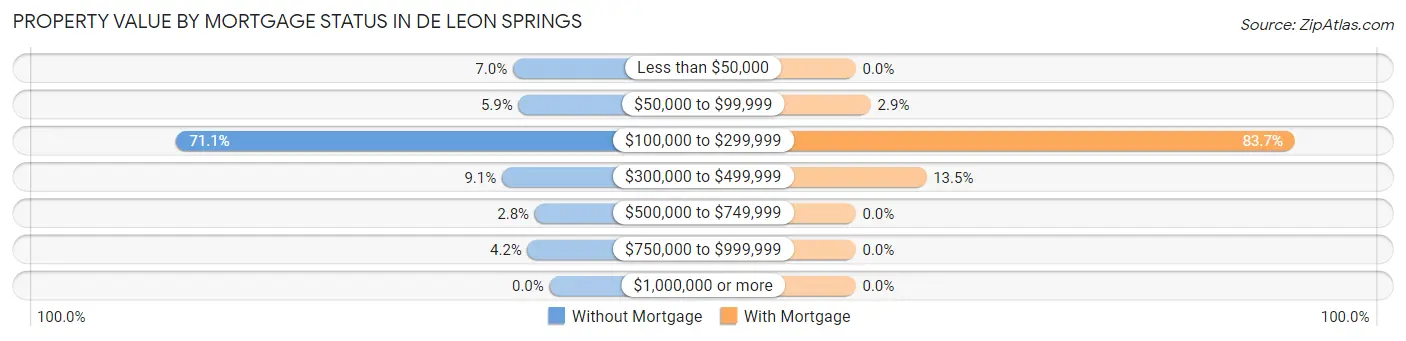
| Property Value | Without Mortgage | With Mortgage |
| Less than $50,000 | 20 (7.0%) | 0 (0.0%) |
| $50,000 to $99,999 | 17 (5.9%) | 12 (2.9%) |
| $100,000 to $299,999 | 204 (71.1%) | 348 (83.7%) |
| $300,000 to $499,999 | 26 (9.1%) | 56 (13.5%) |
| $500,000 to $749,999 | 8 (2.8%) | 0 (0.0%) |
| $750,000 to $999,999 | 12 (4.2%) | 0 (0.0%) |
| $1,000,000 or more | 0 (0.0%) | 0 (0.0%) |
| Total | 287 (100.0%) | 416 (100.0%) |
Household Income by Mortgage Status in De Leon Springs
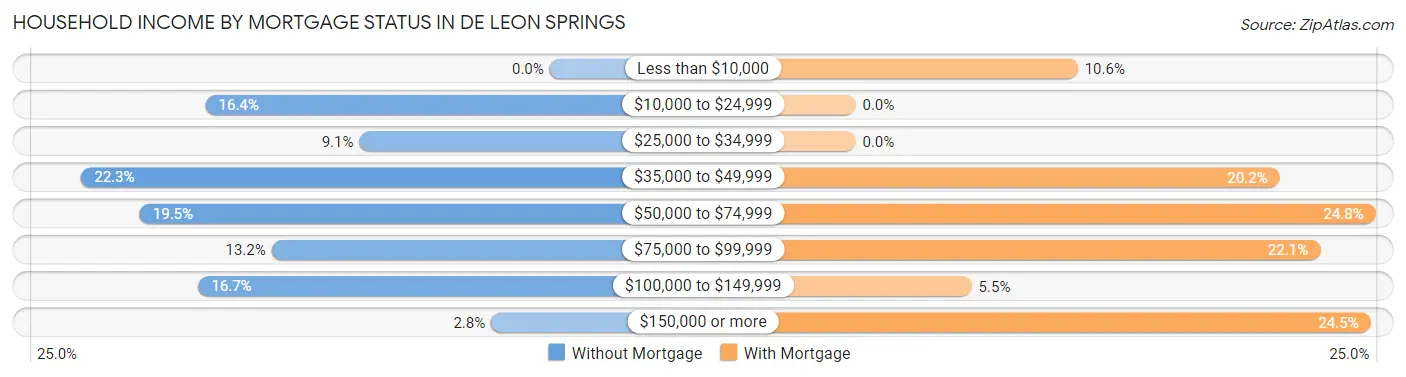
| Household Income | Without Mortgage | With Mortgage |
| Less than $10,000 | 0 (0.0%) | 44 (10.6%) |
| $10,000 to $24,999 | 47 (16.4%) | 0 (0.0%) |
| $25,000 to $34,999 | 26 (9.1%) | 0 (0.0%) |
| $35,000 to $49,999 | 64 (22.3%) | 84 (20.2%) |
| $50,000 to $74,999 | 56 (19.5%) | 103 (24.8%) |
| $75,000 to $99,999 | 38 (13.2%) | 92 (22.1%) |
| $100,000 to $149,999 | 48 (16.7%) | 23 (5.5%) |
| $150,000 or more | 8 (2.8%) | 102 (24.5%) |
| Total | 287 (100.0%) | 416 (100.0%) |
Property Value to Household Income Ratio in De Leon Springs
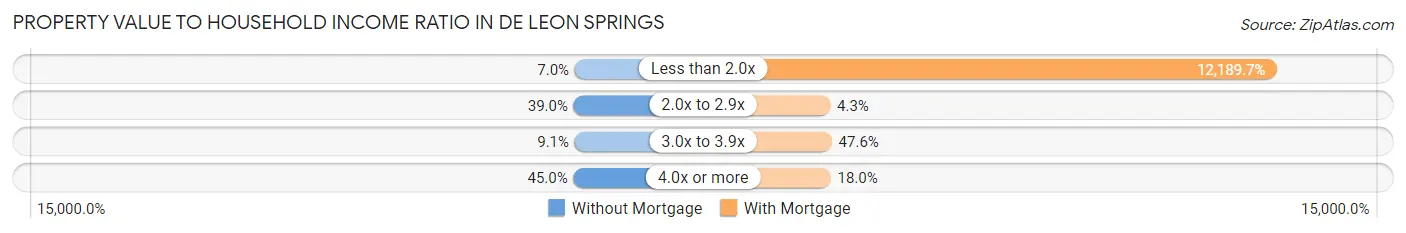
| Value-to-Income Ratio | Without Mortgage | With Mortgage |
| Less than 2.0x | 20 (7.0%) | 50,709 (12,189.7%) |
| 2.0x to 2.9x | 112 (39.0%) | 18 (4.3%) |
| 3.0x to 3.9x | 26 (9.1%) | 198 (47.6%) |
| 4.0x or more | 129 (45.0%) | 75 (18.0%) |
| Total | 287 (100.0%) | 416 (100.0%) |
Real Estate Taxes by Mortgage Status in De Leon Springs
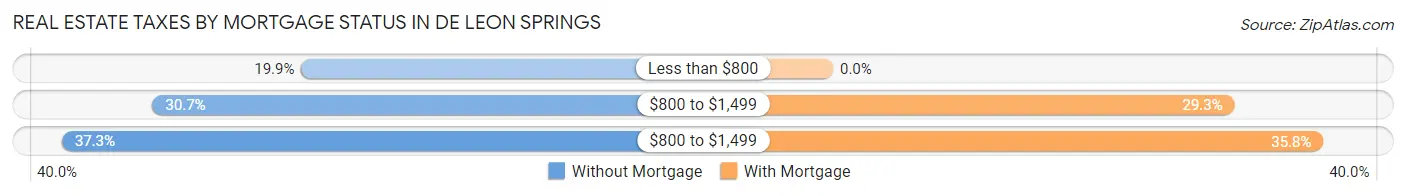
| Property Taxes | Without Mortgage | With Mortgage |
| Less than $800 | 57 (19.9%) | 0 (0.0%) |
| $800 to $1,499 | 88 (30.7%) | 122 (29.3%) |
| $800 to $1,499 | 107 (37.3%) | 149 (35.8%) |
| Total | 287 (100.0%) | 416 (100.0%) |
Health & Disability in De Leon Springs
Health Insurance Coverage by Age in De Leon Springs
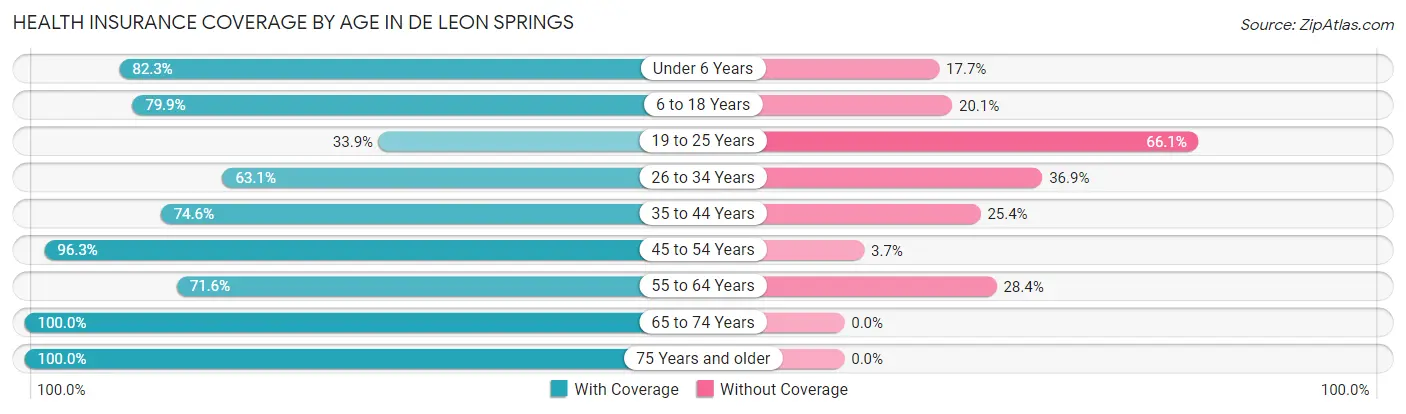
| Age Bracket | With Coverage | Without Coverage |
| Under 6 Years | 107 (82.3%) | 23 (17.7%) |
| 6 to 18 Years | 509 (79.9%) | 128 (20.1%) |
| 19 to 25 Years | 57 (33.9%) | 111 (66.1%) |
| 26 to 34 Years | 241 (63.1%) | 141 (36.9%) |
| 35 to 44 Years | 144 (74.6%) | 49 (25.4%) |
| 45 to 54 Years | 338 (96.3%) | 13 (3.7%) |
| 55 to 64 Years | 159 (71.6%) | 63 (28.4%) |
| 65 to 74 Years | 527 (100.0%) | 0 (0.0%) |
| 75 Years and older | 135 (100.0%) | 0 (0.0%) |
| Total | 2,217 (80.8%) | 528 (19.2%) |
Health Insurance Coverage by Citizenship Status in De Leon Springs
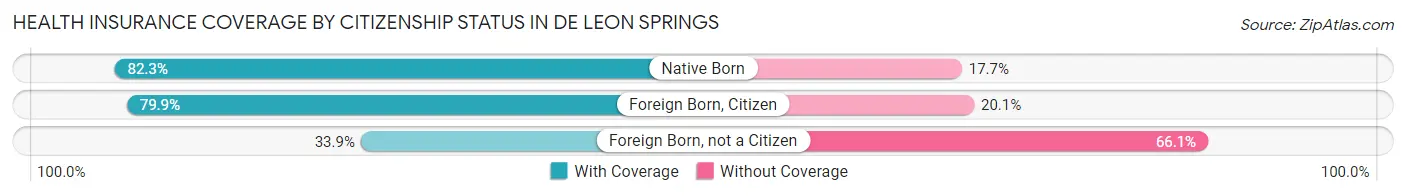
| Citizenship Status | With Coverage | Without Coverage |
| Native Born | 107 (82.3%) | 23 (17.7%) |
| Foreign Born, Citizen | 509 (79.9%) | 128 (20.1%) |
| Foreign Born, not a Citizen | 57 (33.9%) | 111 (66.1%) |
Health Insurance Coverage by Household Income in De Leon Springs
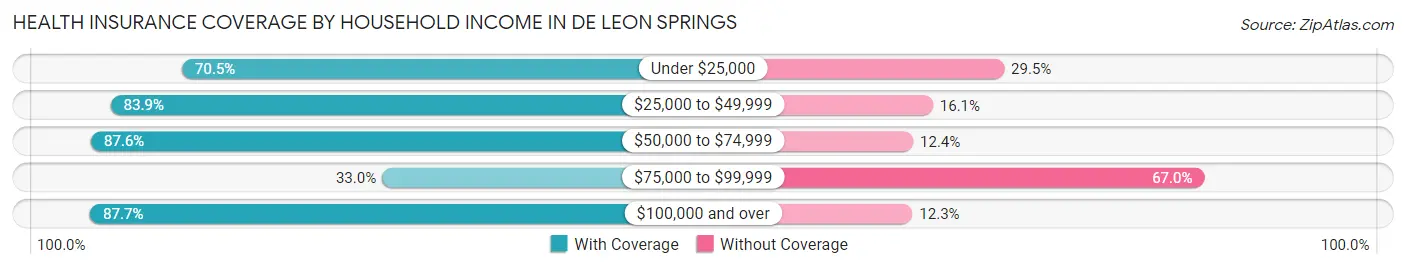
| Household Income | With Coverage | Without Coverage |
| Under $25,000 | 122 (70.5%) | 51 (29.5%) |
| $25,000 to $49,999 | 812 (83.9%) | 156 (16.1%) |
| $50,000 to $74,999 | 838 (87.6%) | 119 (12.4%) |
| $75,000 to $99,999 | 74 (33.0%) | 150 (67.0%) |
| $100,000 and over | 371 (87.7%) | 52 (12.3%) |
Public vs Private Health Insurance Coverage by Age in De Leon Springs
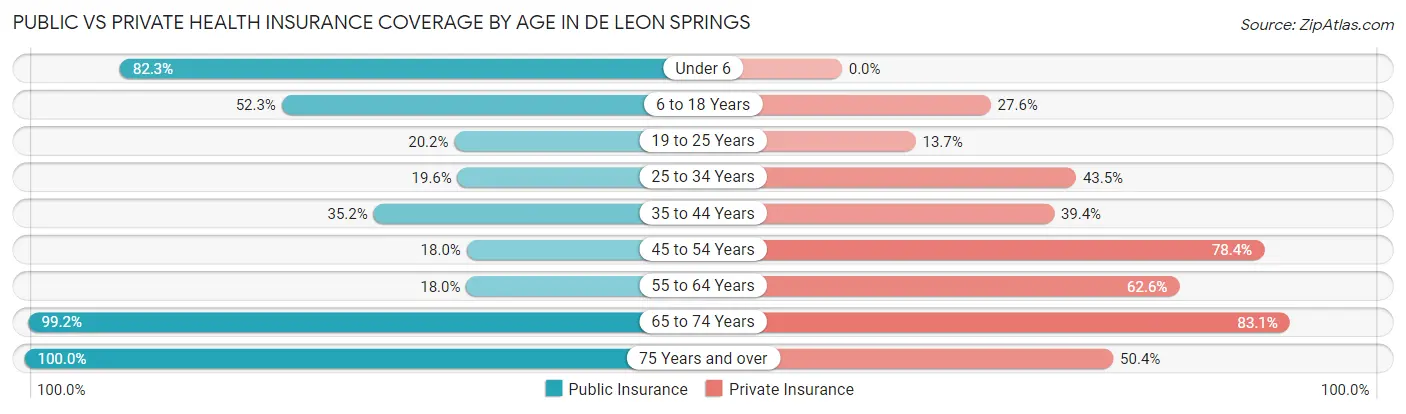
| Age Bracket | Public Insurance | Private Insurance |
| Under 6 | 107 (82.3%) | 0 (0.0%) |
| 6 to 18 Years | 333 (52.3%) | 176 (27.6%) |
| 19 to 25 Years | 34 (20.2%) | 23 (13.7%) |
| 25 to 34 Years | 75 (19.6%) | 166 (43.5%) |
| 35 to 44 Years | 68 (35.2%) | 76 (39.4%) |
| 45 to 54 Years | 63 (17.9%) | 275 (78.3%) |
| 55 to 64 Years | 40 (18.0%) | 139 (62.6%) |
| 65 to 74 Years | 523 (99.2%) | 438 (83.1%) |
| 75 Years and over | 135 (100.0%) | 68 (50.4%) |
| Total | 1,378 (50.2%) | 1,361 (49.6%) |
Disability Status by Sex by Age in De Leon Springs
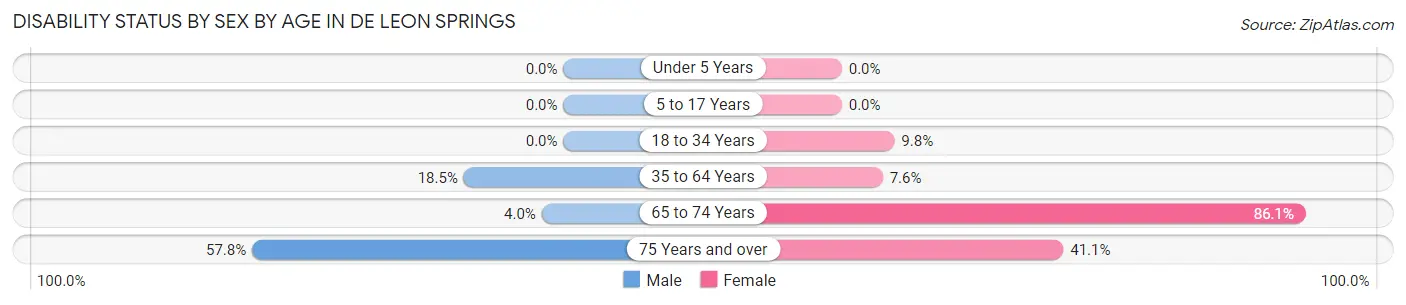
| Age Bracket | Male | Female |
| Under 5 Years | 0 (0.0%) | 0 (0.0%) |
| 5 to 17 Years | 0 (0.0%) | 0 (0.0%) |
| 18 to 34 Years | 0 (0.0%) | 25 (9.8%) |
| 35 to 64 Years | 71 (18.5%) | 29 (7.6%) |
| 65 to 74 Years | 7 (4.0%) | 304 (86.1%) |
| 75 Years and over | 26 (57.8%) | 37 (41.1%) |
Disability Class by Sex by Age in De Leon Springs
Disability Class: Hearing Difficulty
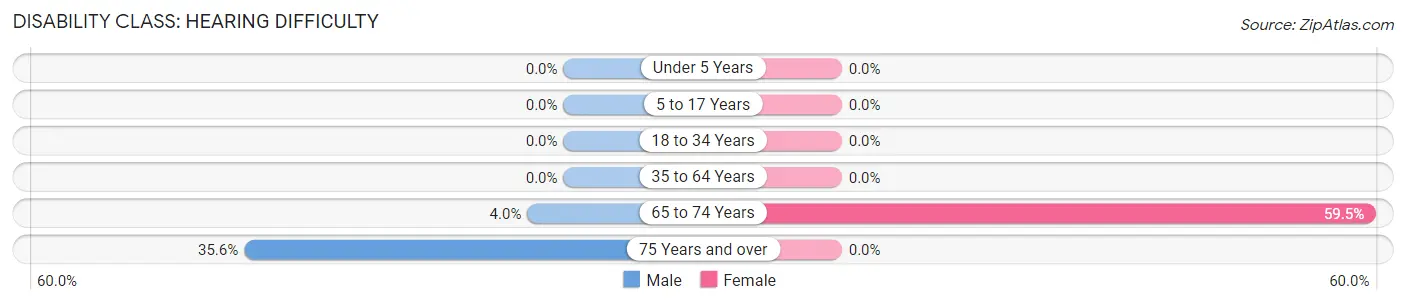
| Age Bracket | Male | Female |
| Under 5 Years | 0 (0.0%) | 0 (0.0%) |
| 5 to 17 Years | 0 (0.0%) | 0 (0.0%) |
| 18 to 34 Years | 0 (0.0%) | 0 (0.0%) |
| 35 to 64 Years | 0 (0.0%) | 0 (0.0%) |
| 65 to 74 Years | 7 (4.0%) | 210 (59.5%) |
| 75 Years and over | 16 (35.6%) | 0 (0.0%) |
Disability Class: Vision Difficulty
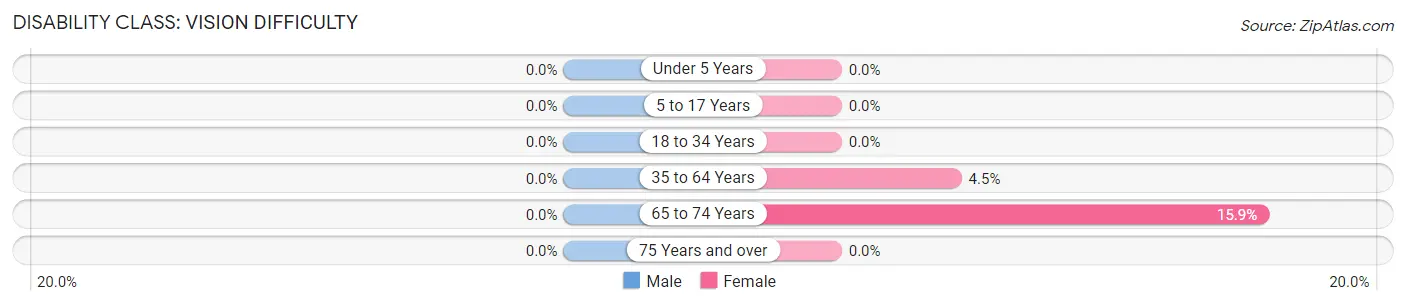
| Age Bracket | Male | Female |
| Under 5 Years | 0 (0.0%) | 0 (0.0%) |
| 5 to 17 Years | 0 (0.0%) | 0 (0.0%) |
| 18 to 34 Years | 0 (0.0%) | 0 (0.0%) |
| 35 to 64 Years | 0 (0.0%) | 17 (4.4%) |
| 65 to 74 Years | 0 (0.0%) | 56 (15.9%) |
| 75 Years and over | 0 (0.0%) | 0 (0.0%) |
Disability Class: Cognitive Difficulty
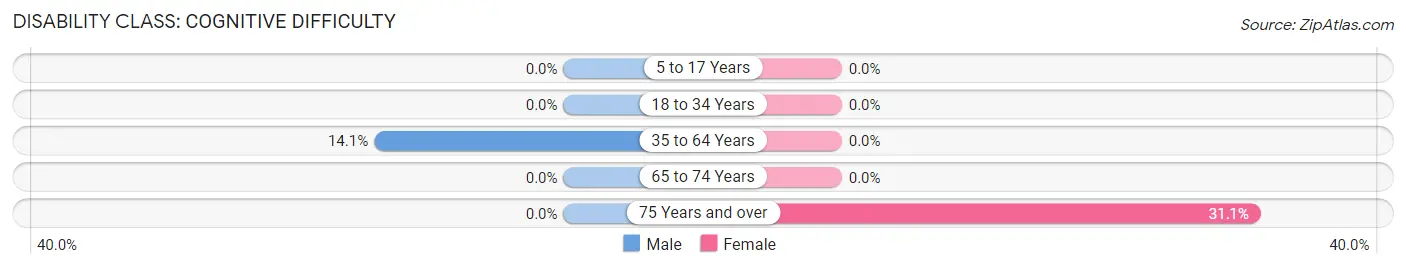
| Age Bracket | Male | Female |
| 5 to 17 Years | 0 (0.0%) | 0 (0.0%) |
| 18 to 34 Years | 0 (0.0%) | 0 (0.0%) |
| 35 to 64 Years | 54 (14.1%) | 0 (0.0%) |
| 65 to 74 Years | 0 (0.0%) | 0 (0.0%) |
| 75 Years and over | 0 (0.0%) | 28 (31.1%) |
Disability Class: Ambulatory Difficulty
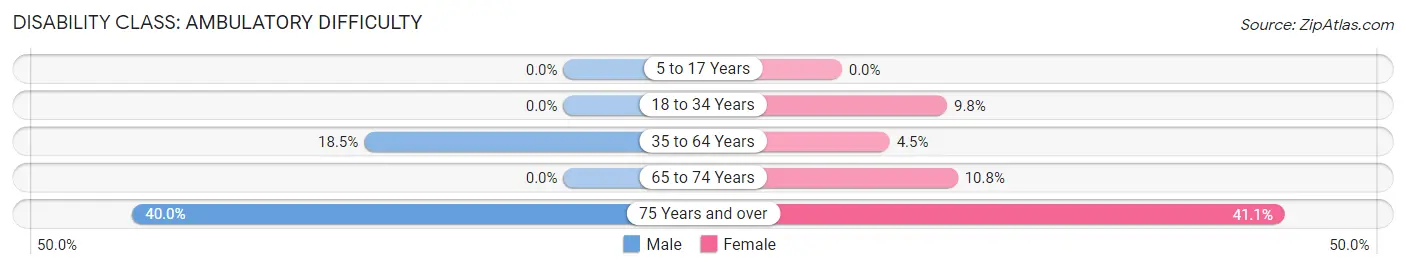
| Age Bracket | Male | Female |
| 5 to 17 Years | 0 (0.0%) | 0 (0.0%) |
| 18 to 34 Years | 0 (0.0%) | 25 (9.8%) |
| 35 to 64 Years | 71 (18.5%) | 17 (4.4%) |
| 65 to 74 Years | 0 (0.0%) | 38 (10.8%) |
| 75 Years and over | 18 (40.0%) | 37 (41.1%) |
Disability Class: Self-Care Difficulty
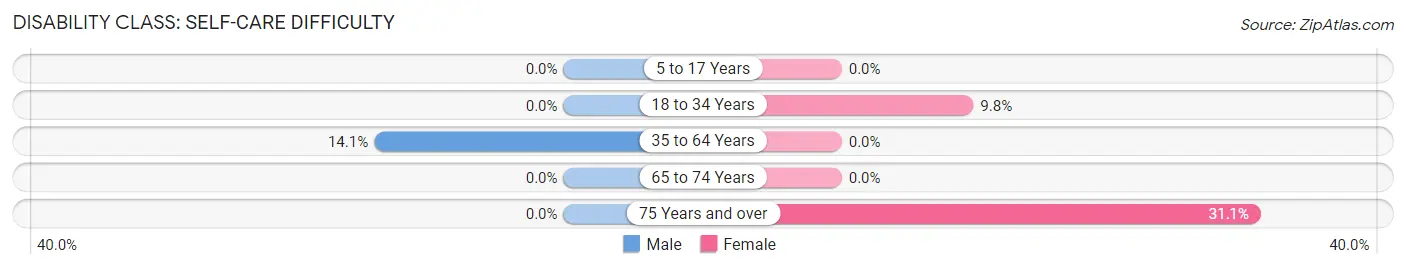
| Age Bracket | Male | Female |
| 5 to 17 Years | 0 (0.0%) | 0 (0.0%) |
| 18 to 34 Years | 0 (0.0%) | 25 (9.8%) |
| 35 to 64 Years | 54 (14.1%) | 0 (0.0%) |
| 65 to 74 Years | 0 (0.0%) | 0 (0.0%) |
| 75 Years and over | 0 (0.0%) | 28 (31.1%) |
Technology Access in De Leon Springs
Computing Device Access in De Leon Springs

| Device Type | # Households | % Households |
| Desktop or Laptop | 636 | 73.0% |
| Smartphone | 792 | 90.9% |
| Tablet | 546 | 62.7% |
| No Computing Device | 8 | 0.9% |
| Total | 871 | 100.0% |
Internet Access in De Leon Springs
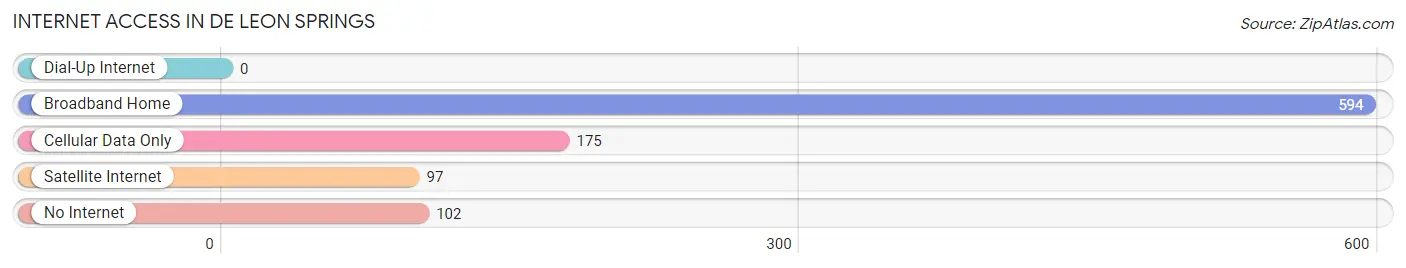
| Internet Type | # Households | % Households |
| Dial-Up Internet | 0 | 0.0% |
| Broadband Home | 594 | 68.2% |
| Cellular Data Only | 175 | 20.1% |
| Satellite Internet | 97 | 11.1% |
| No Internet | 102 | 11.7% |
| Total | 871 | 100.0% |
De Leon Springs Summary
De Leon Springs is a small unincorporated community located in Volusia County, Florida. It is situated on the western shore of Lake Woodruff, a large freshwater lake in the St. Johns River basin. The community is located approximately 25 miles northwest of Daytona Beach and about 50 miles northeast of Orlando.
History
De Leon Springs was first settled in the late 1800s by settlers from the nearby town of De Leon. The town was named after Ponce de Leon, the Spanish explorer who is credited with discovering Florida in 1513. The area was originally used for cattle ranching and citrus farming. In the early 1900s, the area began to attract tourists who were drawn to the natural beauty of the area and the nearby springs.
In the 1920s, the area was developed as a tourist destination and a number of resorts were built. The most famous of these was the De Leon Springs Hotel, which was built in 1925 and was a popular destination for visitors from all over the country. The hotel was destroyed by a fire in the 1950s and the area has since been redeveloped as a residential community.
Geography
De Leon Springs is located in the northern part of Volusia County, Florida. It is situated on the western shore of Lake Woodruff, a large freshwater lake in the St. Johns River basin. The community is located approximately 25 miles northwest of Daytona Beach and about 50 miles northeast of Orlando.
The area is characterized by rolling hills and flatlands, with the highest elevation being around 100 feet above sea level. The climate is subtropical, with hot, humid summers and mild winters. The average annual temperature is around 73 degrees Fahrenheit.
Economy
De Leon Springs is primarily a residential community, with most of the population employed in the service sector. The area is home to a number of small businesses, including restaurants, retail stores, and professional services. The area is also home to a number of tourist attractions, including the De Leon Springs State Park, which is a popular destination for swimming, boating, and fishing.
Demographics
As of the 2010 census, the population of De Leon Springs was 2,845. The racial makeup of the community was 94.3% White, 2.2% African American, 0.7% Native American, 0.7% Asian, 0.2% Pacific Islander, and 1.9% from other races. The median household income was $41,944, and the median family income was $50,944. The per capita income was $20,944.
Conclusion
De Leon Springs is a small unincorporated community located in Volusia County, Florida. It is situated on the western shore of Lake Woodruff and is known for its natural beauty and tourist attractions. The area has a long history of settlement, beginning in the late 1800s, and has since developed into a residential community. The population of De Leon Springs is primarily employed in the service sector, and the area is home to a number of small businesses and tourist attractions.
Common Questions
What is Per Capita Income in De Leon Springs?
Per Capita income in De Leon Springs is $20,327.
What is the Median Family Income in De Leon Springs?
Median Family Income in De Leon Springs is $51,470.
What is the Median Household income in De Leon Springs?
Median Household Income in De Leon Springs is $52,111.
What is Inequality or Gini Index in De Leon Springs?
Inequality or Gini Index in De Leon Springs is 0.30.
What is the Total Population of De Leon Springs?
Total Population of De Leon Springs is 2,745.
What is the Total Male Population of De Leon Springs?
Total Male Population of De Leon Springs is 1,244.
What is the Total Female Population of De Leon Springs?
Total Female Population of De Leon Springs is 1,501.
What is the Ratio of Males per 100 Females in De Leon Springs?
There are 82.88 Males per 100 Females in De Leon Springs.
What is the Ratio of Females per 100 Males in De Leon Springs?
There are 120.66 Females per 100 Males in De Leon Springs.
What is the Median Population Age in De Leon Springs?
Median Population Age in De Leon Springs is 38.7 Years.
What is the Average Family Size in De Leon Springs
Average Family Size in De Leon Springs is 3.6 People.
What is the Average Household Size in De Leon Springs
Average Household Size in De Leon Springs is 3.1 People.
How Large is the Labor Force in De Leon Springs?
There are 873 People in the Labor Forcein in De Leon Springs.
What is the Percentage of People in the Labor Force in De Leon Springs?
42.4% of People are in the Labor Force in De Leon Springs.