Center Hill, FL Map & Demographics
Center Hill Map
Center Hill Overview
$21,600
PER CAPITA INCOME
$58,264
AVG FAMILY INCOME
$59,514
AVG HOUSEHOLD INCOME
33.0%
WAGE / INCOME GAP [ % ]
67.0¢/ $1
WAGE / INCOME GAP [ $ ]
0.35
INEQUALITY / GINI INDEX
1,129
TOTAL POPULATION
618
MALE POPULATION
511
FEMALE POPULATION
120.94
MALES / 100 FEMALES
82.69
FEMALES / 100 MALES
40.0
MEDIAN AGE
3.3
AVG FAMILY SIZE
3.0
AVG HOUSEHOLD SIZE
492
LABOR FORCE [ PEOPLE ]
54.7%
PERCENT IN LABOR FORCE
7.3%
UNEMPLOYMENT RATE
Center Hill Zip Codes
Center Hill Area Codes
Income in Center Hill
Income Overview in Center Hill
Per Capita Income in Center Hill is $21,600, while median incomes of families and households are $58,264 and $59,514 respectively.
| Characteristic | Number | Measure |
| Per Capita Income | 1,129 | $21,600 |
| Median Family Income | 287 | $58,264 |
| Mean Family Income | 287 | $64,172 |
| Median Household Income | 377 | $59,514 |
| Mean Household Income | 377 | $61,358 |
| Income Deficit | 287 | $0 |
| Wage / Income Gap (%) | 1,129 | 33.01% |
| Wage / Income Gap ($) | 1,129 | 66.99¢ per $1 |
| Gini / Inequality Index | 1,129 | 0.35 |
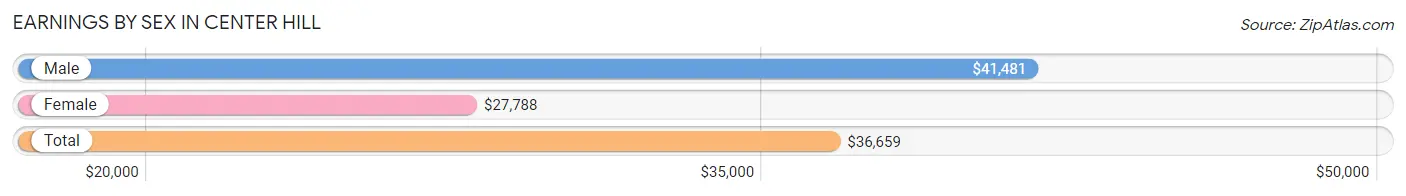
Earnings by Sex in Center Hill
Average Earnings in Center Hill are $36,659, $41,481 for men and $27,788 for women, a difference of 33.0%.
| Sex | Number | Average Earnings |
| Male | 342 (68.5%) | $41,481 |
| Female | 157 (31.5%) | $27,788 |
| Total | 499 (100.0%) | $36,659 |
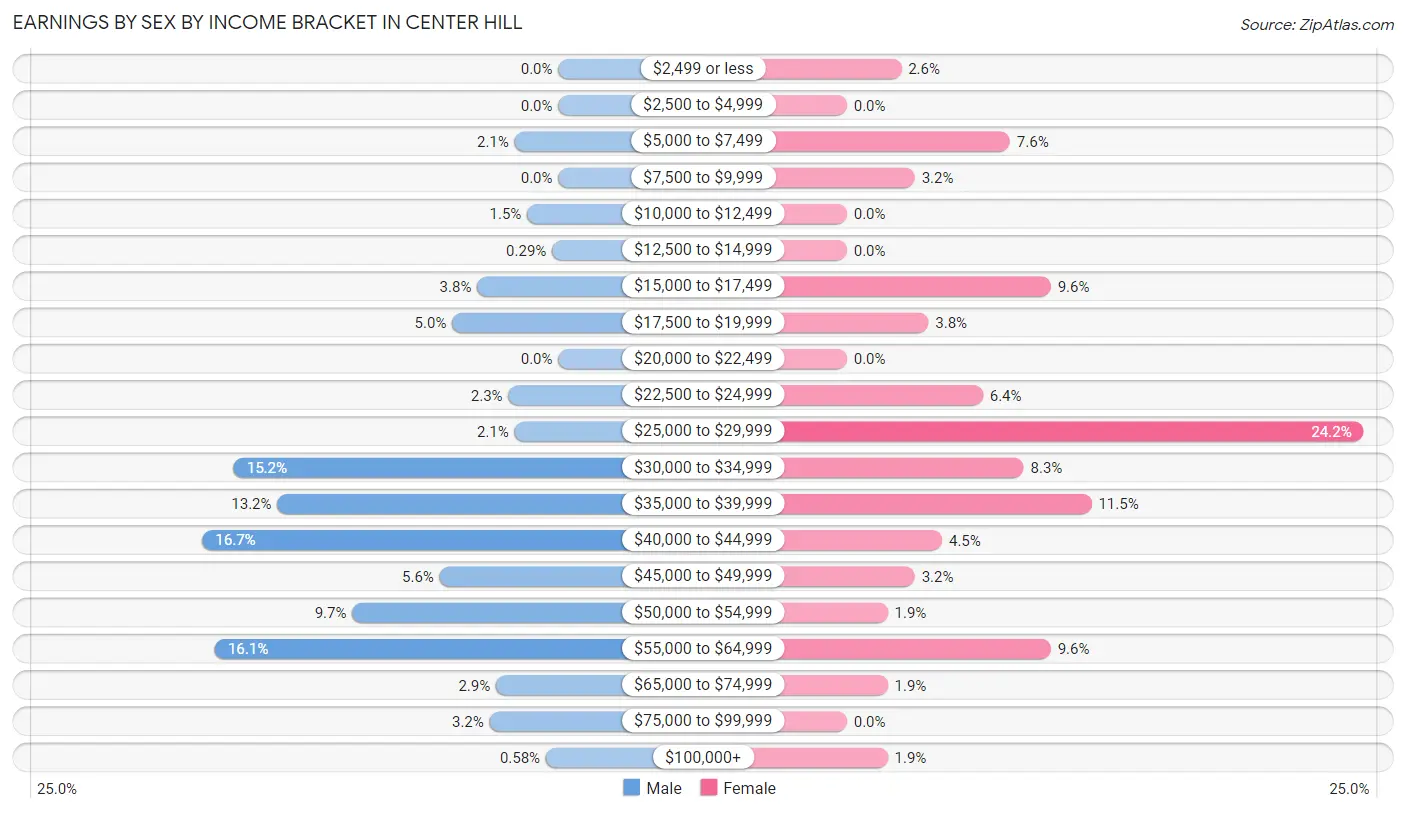
Earnings by Sex by Income Bracket in Center Hill
The most common earnings brackets in Center Hill are $40,000 to $44,999 for men (57 | 16.7%) and $25,000 to $29,999 for women (38 | 24.2%).
| Income | Male | Female |
| $2,499 or less | 0 (0.0%) | 4 (2.5%) |
| $2,500 to $4,999 | 0 (0.0%) | 0 (0.0%) |
| $5,000 to $7,499 | 7 (2.1%) | 12 (7.6%) |
| $7,500 to $9,999 | 0 (0.0%) | 5 (3.2%) |
| $10,000 to $12,499 | 5 (1.5%) | 0 (0.0%) |
| $12,500 to $14,999 | 1 (0.3%) | 0 (0.0%) |
| $15,000 to $17,499 | 13 (3.8%) | 15 (9.6%) |
| $17,500 to $19,999 | 17 (5.0%) | 6 (3.8%) |
| $20,000 to $22,499 | 0 (0.0%) | 0 (0.0%) |
| $22,500 to $24,999 | 8 (2.3%) | 10 (6.4%) |
| $25,000 to $29,999 | 7 (2.1%) | 38 (24.2%) |
| $30,000 to $34,999 | 52 (15.2%) | 13 (8.3%) |
| $35,000 to $39,999 | 45 (13.2%) | 18 (11.5%) |
| $40,000 to $44,999 | 57 (16.7%) | 7 (4.5%) |
| $45,000 to $49,999 | 19 (5.6%) | 5 (3.2%) |
| $50,000 to $54,999 | 33 (9.7%) | 3 (1.9%) |
| $55,000 to $64,999 | 55 (16.1%) | 15 (9.6%) |
| $65,000 to $74,999 | 10 (2.9%) | 3 (1.9%) |
| $75,000 to $99,999 | 11 (3.2%) | 0 (0.0%) |
| $100,000+ | 2 (0.6%) | 3 (1.9%) |
| Total | 342 (100.0%) | 157 (100.0%) |
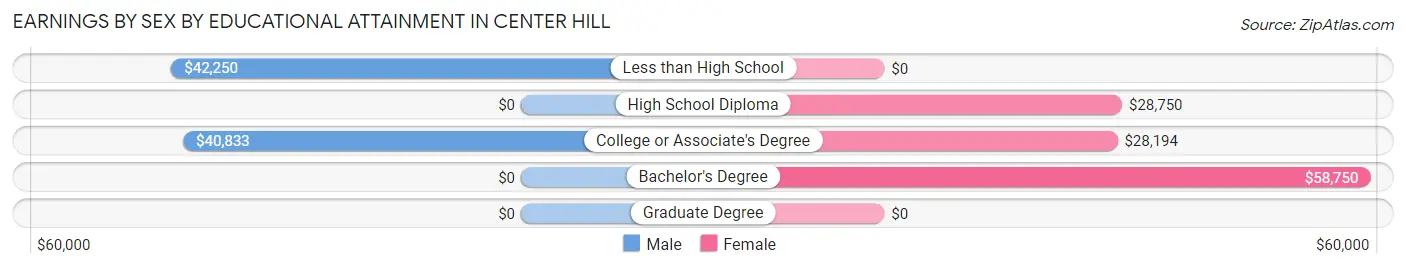
Earnings by Sex by Educational Attainment in Center Hill
Average earnings in Center Hill are $40,926 for men and $28,750 for women, a difference of 29.7%. Men with an educational attainment of less than high school enjoy the highest average annual earnings of $42,250, while those with college or associate's degree education earn the least with $40,833. Women with an educational attainment of bachelor's degree earn the most with the average annual earnings of $58,750, while those with college or associate's degree education have the smallest earnings of $28,194.
| Educational Attainment | Male Income | Female Income |
| Less than High School | $42,250 | $0 |
| High School Diploma | - | - |
| College or Associate's Degree | $40,833 | $28,194 |
| Bachelor's Degree | - | - |
| Graduate Degree | - | - |
| Total | $40,926 | $28,750 |
Family Income in Center Hill
Family Income Brackets in Center Hill
According to the Center Hill family income data, there are 86 families falling into the $35,000 to $49,999 income range, which is the most common income bracket and makes up 30.0% of all families. Conversely, the $10,000 to $14,999 income bracket is the least frequent group with only 2 families (0.7%) belonging to this category.
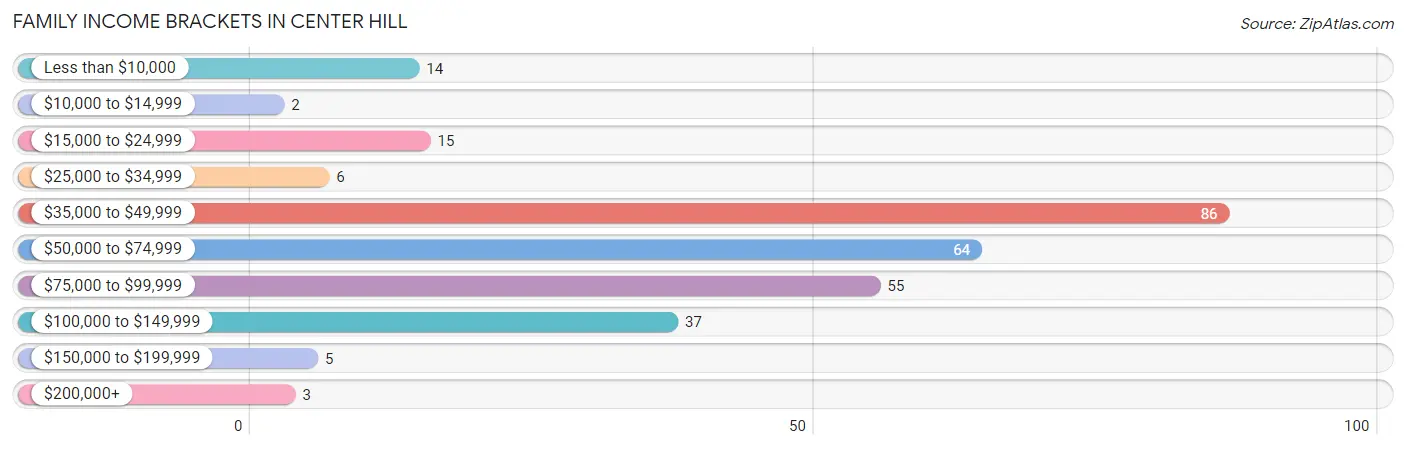
| Income Bracket | # Families | % Families |
| Less than $10,000 | 14 | 4.9% |
| $10,000 to $14,999 | 2 | 0.7% |
| $15,000 to $24,999 | 15 | 5.2% |
| $25,000 to $34,999 | 6 | 2.1% |
| $35,000 to $49,999 | 86 | 30.0% |
| $50,000 to $74,999 | 64 | 22.3% |
| $75,000 to $99,999 | 55 | 19.2% |
| $100,000 to $149,999 | 37 | 12.9% |
| $150,000 to $199,999 | 5 | 1.7% |
| $200,000+ | 3 | 1.0% |
Family Income by Famaliy Size in Center Hill
5-person families (19 | 6.6%) account for the highest median family income in Center Hill with $115,875 per family, while 2-person families (95 | 33.1%) have the highest median income of $26,375 per family member.
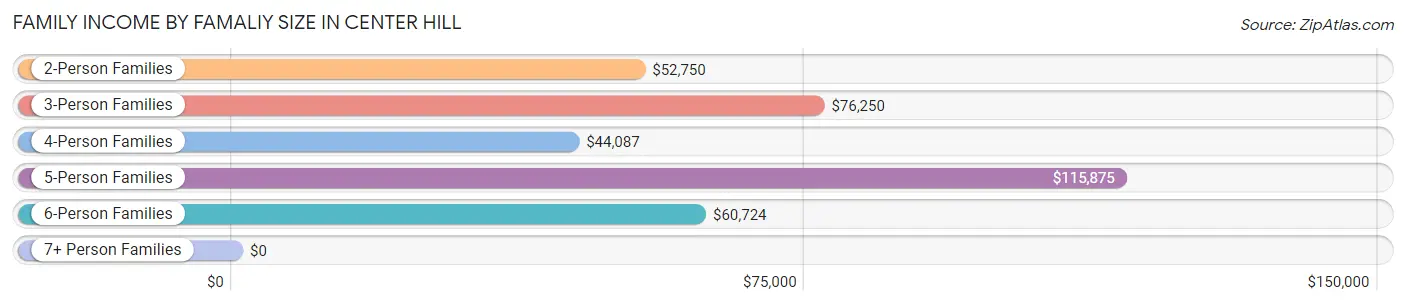
| Income Bracket | # Families | Median Income |
| 2-Person Families | 95 (33.1%) | $52,750 |
| 3-Person Families | 85 (29.6%) | $76,250 |
| 4-Person Families | 45 (15.7%) | $44,087 |
| 5-Person Families | 19 (6.6%) | $115,875 |
| 6-Person Families | 41 (14.3%) | $60,724 |
| 7+ Person Families | 2 (0.7%) | $0 |
| Total | 287 (100.0%) | $58,264 |
Family Income by Number of Earners in Center Hill
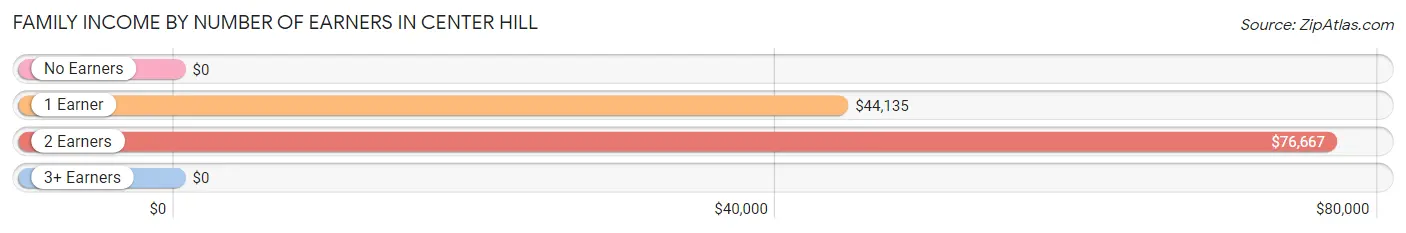
| Number of Earners | # Families | Median Income |
| No Earners | 54 (18.8%) | $0 |
| 1 Earner | 126 (43.9%) | $44,135 |
| 2 Earners | 92 (32.1%) | $76,667 |
| 3+ Earners | 15 (5.2%) | $0 |
| Total | 287 (100.0%) | $58,264 |
Household Income in Center Hill
Household Income Brackets in Center Hill
With 104 households falling in the category, the $50,000 to $74,999 income range is the most frequent in Center Hill, accounting for 27.6% of all households. In contrast, only 3 households (0.8%) fall into the $200,000+ income bracket, making it the least populous group.
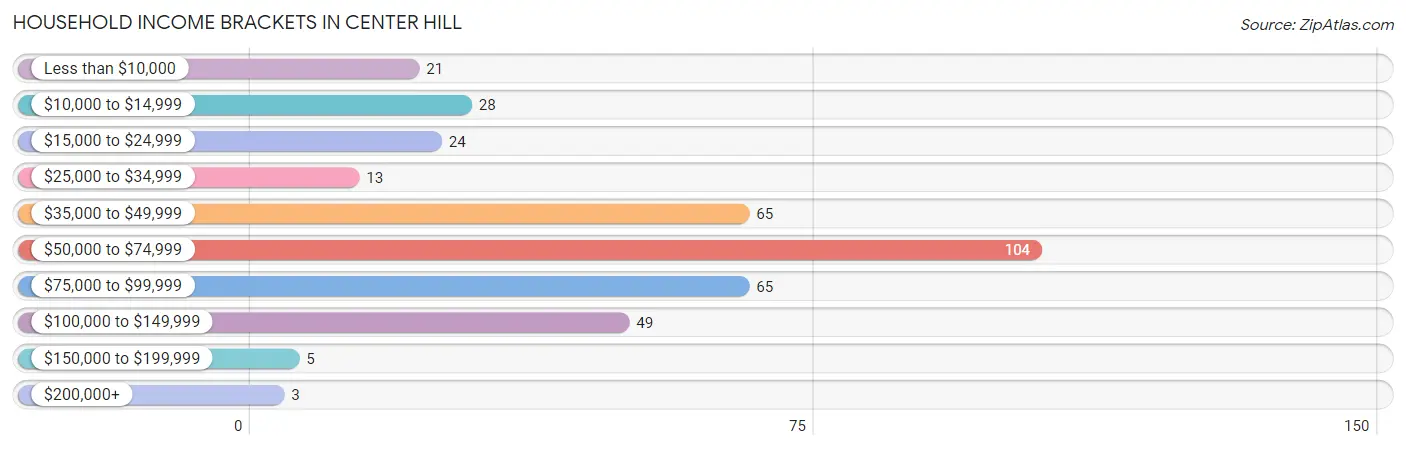
| Income Bracket | # Households | % Households |
| Less than $10,000 | 21 | 5.6% |
| $10,000 to $14,999 | 28 | 7.4% |
| $15,000 to $24,999 | 24 | 6.4% |
| $25,000 to $34,999 | 13 | 3.4% |
| $35,000 to $49,999 | 65 | 17.2% |
| $50,000 to $74,999 | 104 | 27.6% |
| $75,000 to $99,999 | 65 | 17.2% |
| $100,000 to $149,999 | 49 | 13.0% |
| $150,000 to $199,999 | 5 | 1.3% |
| $200,000+ | 3 | 0.8% |
Household Income by Householder Age in Center Hill
The median household income in Center Hill is $59,514, with the highest median household income of $67,500 found in the 45 to 64 years age bracket for the primary householder. A total of 166 households (44.0%) fall into this category. Meanwhile, the 15 to 24 years age bracket for the primary householder has the lowest median household income of $0, with 3 households (0.8%) in this group.
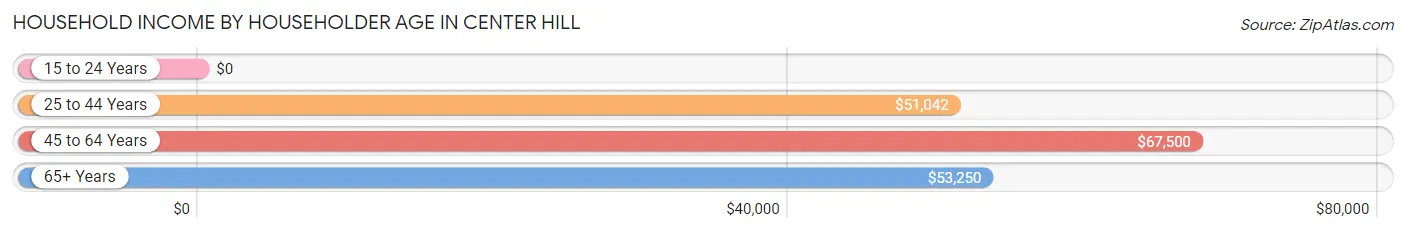
| Income Bracket | # Households | Median Income |
| 15 to 24 Years | 3 (0.8%) | $0 |
| 25 to 44 Years | 123 (32.6%) | $51,042 |
| 45 to 64 Years | 166 (44.0%) | $67,500 |
| 65+ Years | 85 (22.6%) | $53,250 |
| Total | 377 (100.0%) | $59,514 |
Poverty in Center Hill
Income Below Poverty by Sex and Age in Center Hill
With 5.7% poverty level for males and 19.8% for females among the residents of Center Hill, 15 year old males and under 5 year old females are the most vulnerable to poverty, with 2 males (100.0%) and 8 females (53.3%) in their respective age groups living below the poverty level.
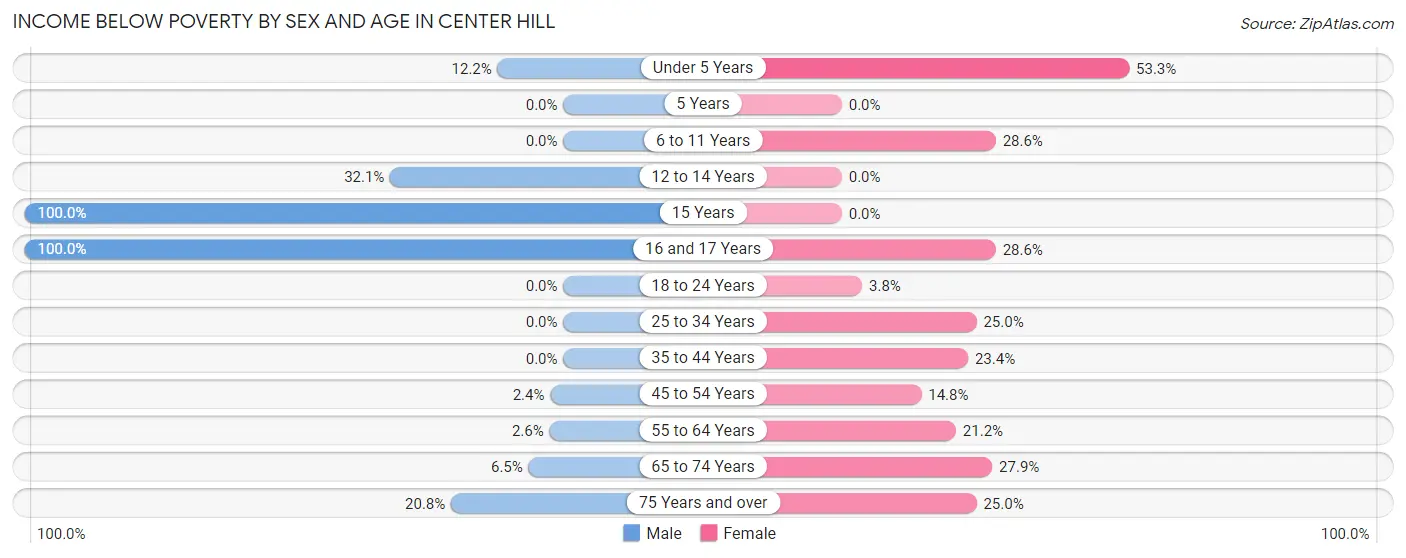
| Age Bracket | Male | Female |
| Under 5 Years | 5 (12.2%) | 8 (53.3%) |
| 5 Years | 0 (0.0%) | 0 (0.0%) |
| 6 to 11 Years | 0 (0.0%) | 10 (28.6%) |
| 12 to 14 Years | 9 (32.1%) | 0 (0.0%) |
| 15 Years | 2 (100.0%) | 0 (0.0%) |
| 16 and 17 Years | 7 (100.0%) | 2 (28.6%) |
| 18 to 24 Years | 0 (0.0%) | 2 (3.8%) |
| 25 to 34 Years | 0 (0.0%) | 6 (25.0%) |
| 35 to 44 Years | 0 (0.0%) | 26 (23.4%) |
| 45 to 54 Years | 3 (2.4%) | 9 (14.7%) |
| 55 to 64 Years | 2 (2.6%) | 18 (21.2%) |
| 65 to 74 Years | 2 (6.5%) | 12 (27.9%) |
| 75 Years and over | 5 (20.8%) | 8 (25.0%) |
| Total | 35 (5.7%) | 101 (19.8%) |
Income Above Poverty by Sex and Age in Center Hill
According to the poverty statistics in Center Hill, males aged 5 years and females aged 5 years are the age groups that are most secure financially, with 100.0% of males and 100.0% of females in these age groups living above the poverty line.
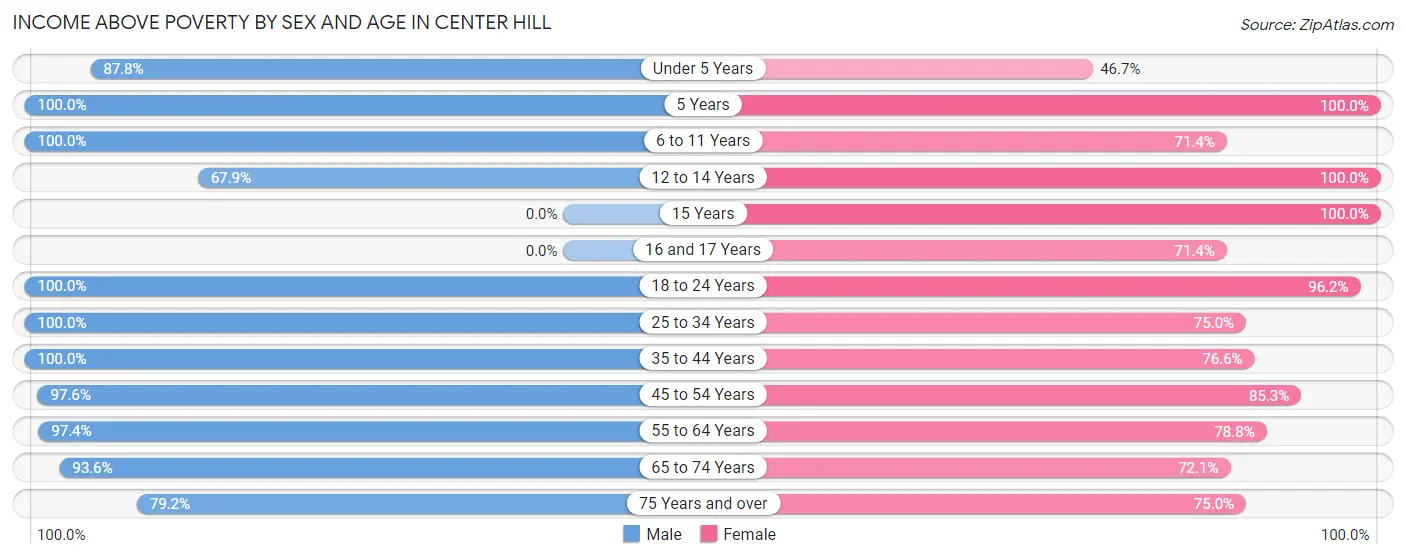
| Age Bracket | Male | Female |
| Under 5 Years | 36 (87.8%) | 7 (46.7%) |
| 5 Years | 1 (100.0%) | 15 (100.0%) |
| 6 to 11 Years | 62 (100.0%) | 25 (71.4%) |
| 12 to 14 Years | 19 (67.9%) | 23 (100.0%) |
| 15 Years | 0 (0.0%) | 7 (100.0%) |
| 16 and 17 Years | 0 (0.0%) | 5 (71.4%) |
| 18 to 24 Years | 30 (100.0%) | 51 (96.2%) |
| 25 to 34 Years | 73 (100.0%) | 18 (75.0%) |
| 35 to 44 Years | 117 (100.0%) | 85 (76.6%) |
| 45 to 54 Years | 121 (97.6%) | 52 (85.3%) |
| 55 to 64 Years | 76 (97.4%) | 67 (78.8%) |
| 65 to 74 Years | 29 (93.5%) | 31 (72.1%) |
| 75 Years and over | 19 (79.2%) | 24 (75.0%) |
| Total | 583 (94.3%) | 410 (80.2%) |
Income Below Poverty Among Married-Couple Families in Center Hill
The poverty statistics for married-couple families in Center Hill show that 3.8% or 7 of the total 183 families live below the poverty line. Families with 1 or 2 children have the highest poverty rate of 8.6%, comprising of 5 families. On the other hand, families with 3 or 4 children have the lowest poverty rate of 0.0%, which includes 0 families.
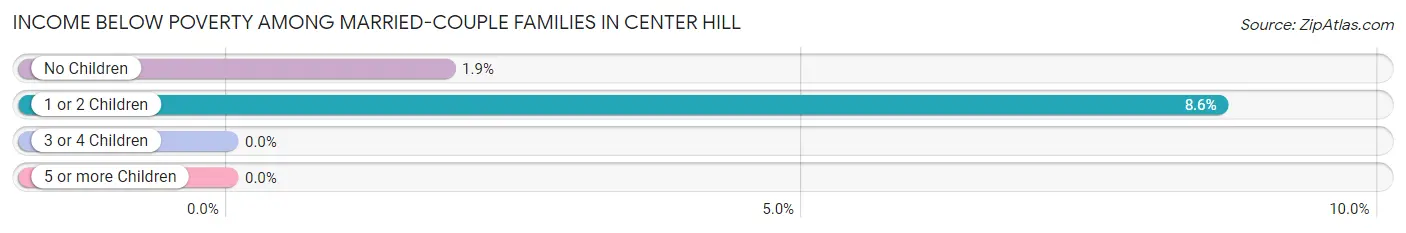
| Children | Above Poverty | Below Poverty |
| No Children | 104 (98.1%) | 2 (1.9%) |
| 1 or 2 Children | 53 (91.4%) | 5 (8.6%) |
| 3 or 4 Children | 19 (100.0%) | 0 (0.0%) |
| 5 or more Children | 0 (0.0%) | 0 (0.0%) |
| Total | 176 (96.2%) | 7 (3.8%) |
Income Below Poverty Among Single-Parent Households in Center Hill
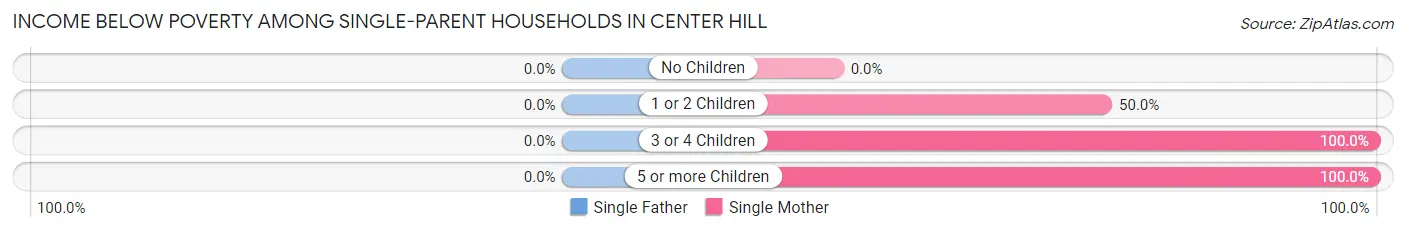
| Children | Single Father | Single Mother |
| No Children | 0 (0.0%) | 0 (0.0%) |
| 1 or 2 Children | 0 (0.0%) | 12 (50.0%) |
| 3 or 4 Children | 0 (0.0%) | 6 (100.0%) |
| 5 or more Children | 0 (0.0%) | 2 (100.0%) |
| Total | 0 (0.0%) | 20 (40.0%) |
Income Below Poverty Among Married-Couple vs Single-Parent Households in Center Hill
The poverty data for Center Hill shows that 7 of the married-couple family households (3.8%) and 20 of the single-parent households (19.2%) are living below the poverty level. Within the married-couple family households, those with 1 or 2 children have the highest poverty rate, with 5 households (8.6%) falling below the poverty line. Among the single-parent households, those with 5 or more children have the highest poverty rate, with 2 household (100.0%) living below poverty.
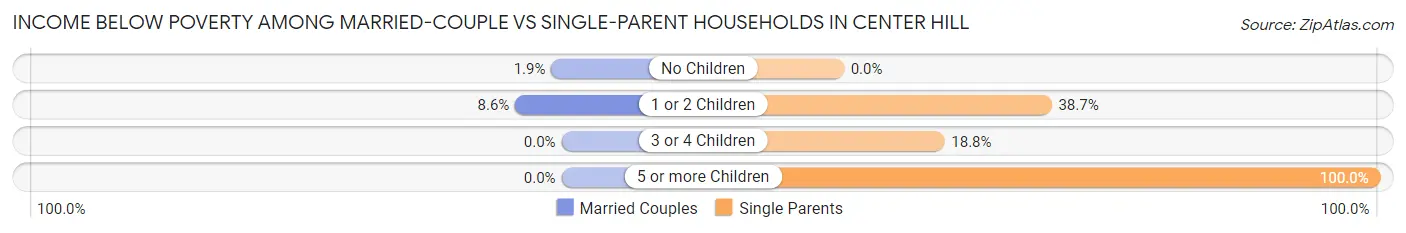
| Children | Married-Couple Families | Single-Parent Households |
| No Children | 2 (1.9%) | 0 (0.0%) |
| 1 or 2 Children | 5 (8.6%) | 12 (38.7%) |
| 3 or 4 Children | 0 (0.0%) | 6 (18.8%) |
| 5 or more Children | 0 (0.0%) | 2 (100.0%) |
| Total | 7 (3.8%) | 20 (19.2%) |
Race in Center Hill
The most populous races in Center Hill are White / Caucasian (627 | 55.5%), Hispanic or Latino (515 | 45.6%), and Two or more Races (243 | 21.5%).
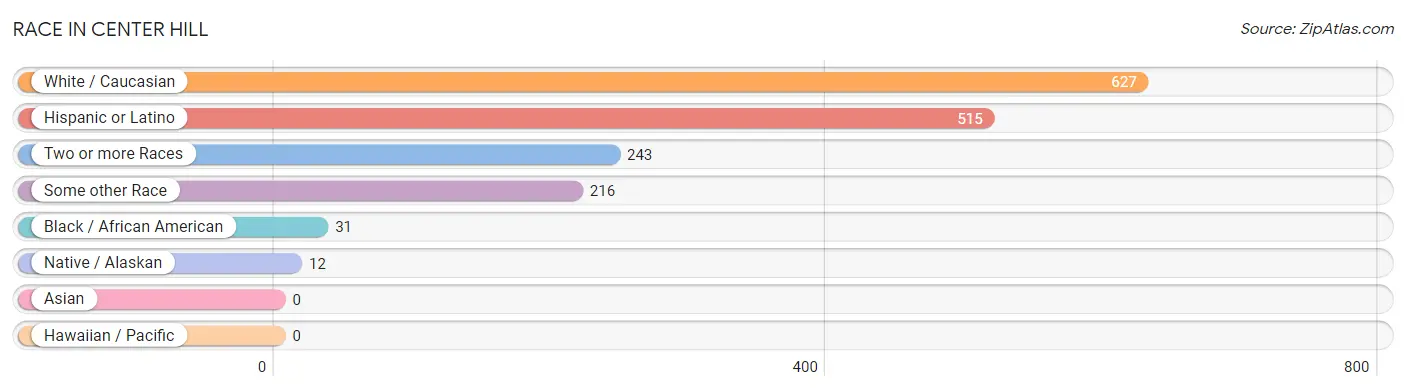
| Race | # Population | % Population |
| Asian | 0 | 0.0% |
| Black / African American | 31 | 2.8% |
| Hawaiian / Pacific | 0 | 0.0% |
| Hispanic or Latino | 515 | 45.6% |
| Native / Alaskan | 12 | 1.1% |
| White / Caucasian | 627 | 55.5% |
| Two or more Races | 243 | 21.5% |
| Some other Race | 216 | 19.1% |
| Total | 1,129 | 100.0% |
Ancestry in Center Hill
The most populous ancestries reported in Center Hill are Mexican (471 | 41.7%), American (229 | 20.3%), Irish (63 | 5.6%), English (51 | 4.5%), and Central American (43 | 3.8%), together accounting for 75.9% of all Center Hill residents.
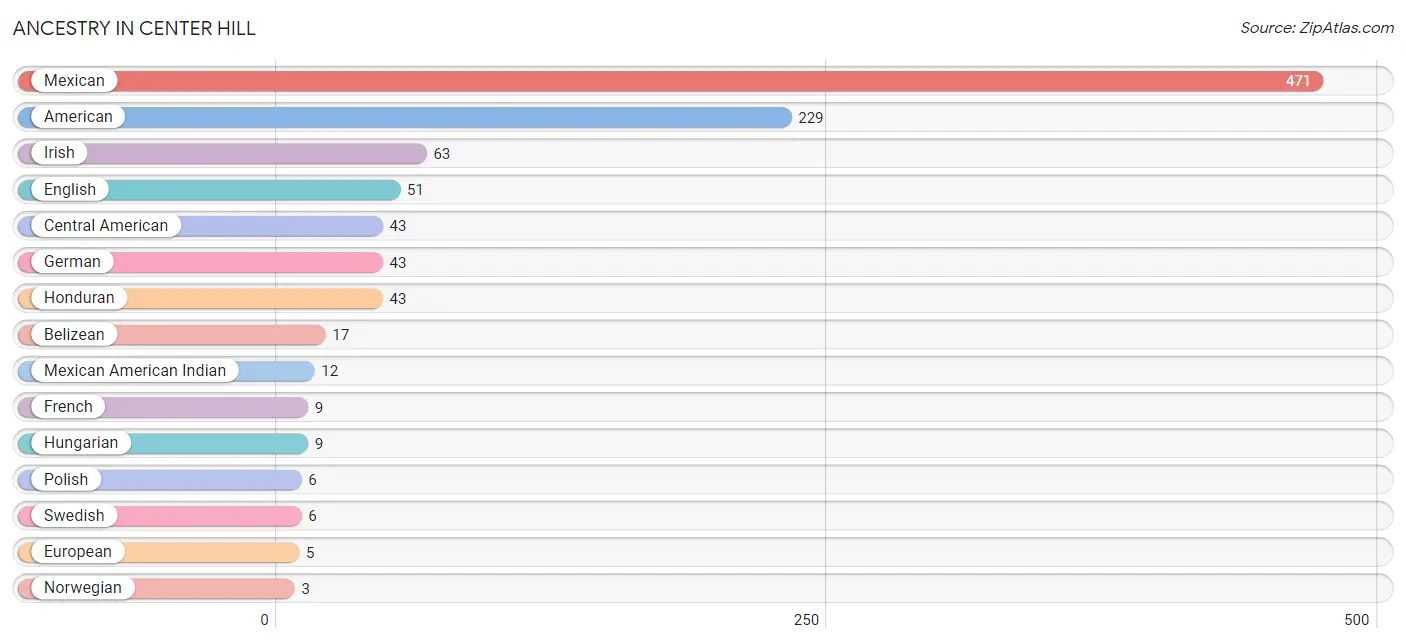
| Ancestry | # Population | % Population |
| American | 229 | 20.3% |
| Belizean | 17 | 1.5% |
| Central American | 43 | 3.8% |
| Dutch | 2 | 0.2% |
| English | 51 | 4.5% |
| European | 5 | 0.4% |
| French | 9 | 0.8% |
| German | 43 | 3.8% |
| Honduran | 43 | 3.8% |
| Hungarian | 9 | 0.8% |
| Irish | 63 | 5.6% |
| Italian | 2 | 0.2% |
| Mexican | 471 | 41.7% |
| Mexican American Indian | 12 | 1.1% |
| Norwegian | 3 | 0.3% |
| Polish | 6 | 0.5% |
| Scotch-Irish | 3 | 0.3% |
| Scottish | 2 | 0.2% |
| Spaniard | 1 | 0.1% |
| Swedish | 6 | 0.5% | View All 20 Rows |
Immigrants in Center Hill
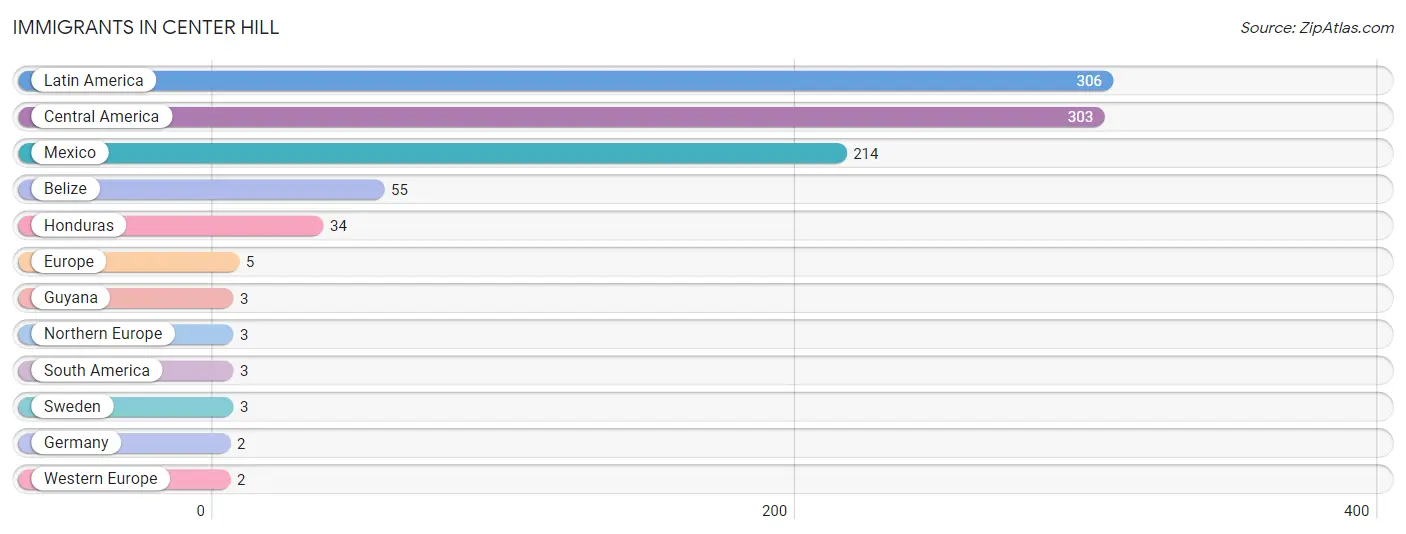
The most numerous immigrant groups reported in Center Hill came from Latin America (306 | 27.1%), Central America (303 | 26.8%), Mexico (214 | 19.0%), Belize (55 | 4.9%), and Honduras (34 | 3.0%), together accounting for 80.8% of all Center Hill residents.
| Immigration Origin | # Population | % Population |
| Belize | 55 | 4.9% |
| Central America | 303 | 26.8% |
| Europe | 5 | 0.4% |
| Germany | 2 | 0.2% |
| Guyana | 3 | 0.3% |
| Honduras | 34 | 3.0% |
| Latin America | 306 | 27.1% |
| Mexico | 214 | 19.0% |
| Northern Europe | 3 | 0.3% |
| South America | 3 | 0.3% |
| Sweden | 3 | 0.3% |
| Western Europe | 2 | 0.2% | View All 12 Rows |
Sex and Age in Center Hill
Sex and Age in Center Hill
The most populous age groups in Center Hill are 45 to 49 Years (111 | 18.0%) for men and 40 to 44 Years (57 | 11.2%) for women.
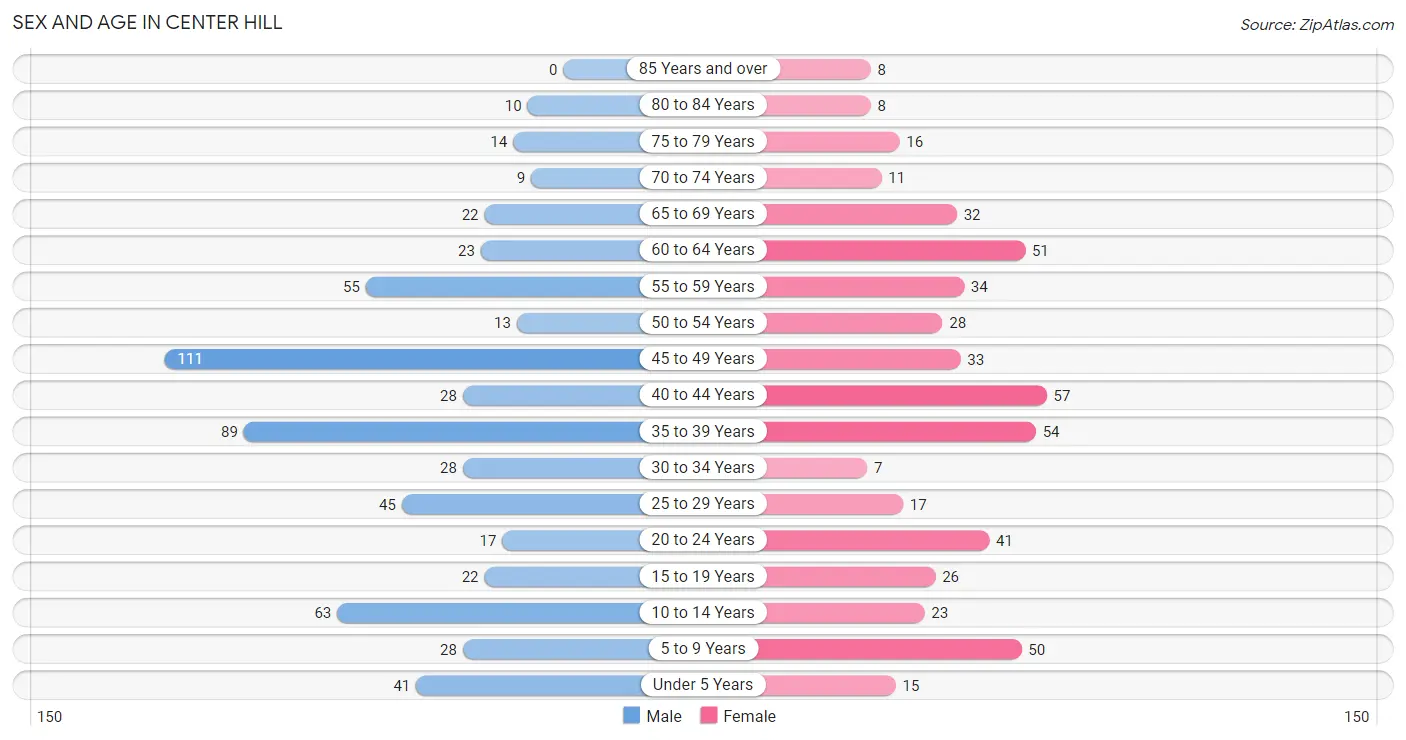
| Age Bracket | Male | Female |
| Under 5 Years | 41 (6.6%) | 15 (2.9%) |
| 5 to 9 Years | 28 (4.5%) | 50 (9.8%) |
| 10 to 14 Years | 63 (10.2%) | 23 (4.5%) |
| 15 to 19 Years | 22 (3.6%) | 26 (5.1%) |
| 20 to 24 Years | 17 (2.8%) | 41 (8.0%) |
| 25 to 29 Years | 45 (7.3%) | 17 (3.3%) |
| 30 to 34 Years | 28 (4.5%) | 7 (1.4%) |
| 35 to 39 Years | 89 (14.4%) | 54 (10.6%) |
| 40 to 44 Years | 28 (4.5%) | 57 (11.2%) |
| 45 to 49 Years | 111 (18.0%) | 33 (6.5%) |
| 50 to 54 Years | 13 (2.1%) | 28 (5.5%) |
| 55 to 59 Years | 55 (8.9%) | 34 (6.7%) |
| 60 to 64 Years | 23 (3.7%) | 51 (10.0%) |
| 65 to 69 Years | 22 (3.6%) | 32 (6.3%) |
| 70 to 74 Years | 9 (1.5%) | 11 (2.1%) |
| 75 to 79 Years | 14 (2.3%) | 16 (3.1%) |
| 80 to 84 Years | 10 (1.6%) | 8 (1.6%) |
| 85 Years and over | 0 (0.0%) | 8 (1.6%) |
| Total | 618 (100.0%) | 511 (100.0%) |
Families and Households in Center Hill
Median Family Size in Center Hill
The median family size in Center Hill is 3.27 persons per family, with married-couple families (183 | 63.8%) accounting for the largest median family size of 3.59 persons per family. On the other hand, single female/mother families (50 | 17.4%) represent the smallest median family size with 2.54 persons per family.
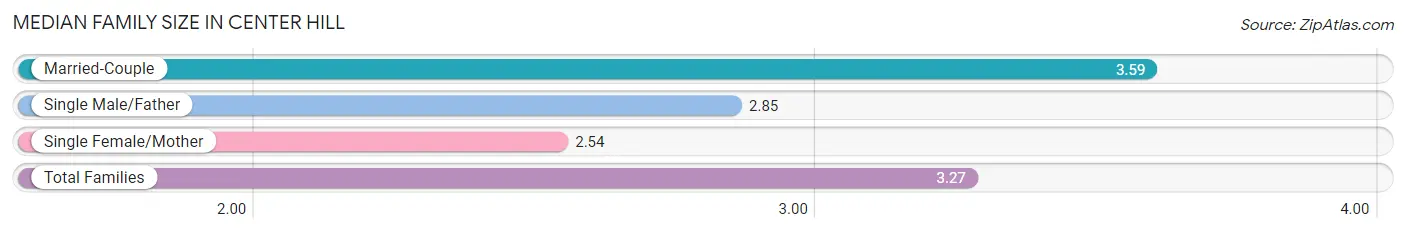
| Family Type | # Families | Family Size |
| Married-Couple | 183 (63.8%) | 3.59 |
| Single Male/Father | 54 (18.8%) | 2.85 |
| Single Female/Mother | 50 (17.4%) | 2.54 |
| Total Families | 287 (100.0%) | 3.27 |
Median Household Size in Center Hill
The median household size in Center Hill is 2.99 persons per household, with married-couple households (183 | 48.5%) accounting for the largest median household size of 3.61 persons per household. non-family households (90 | 23.9%) represent the smallest median household size with 1.43 persons per household.
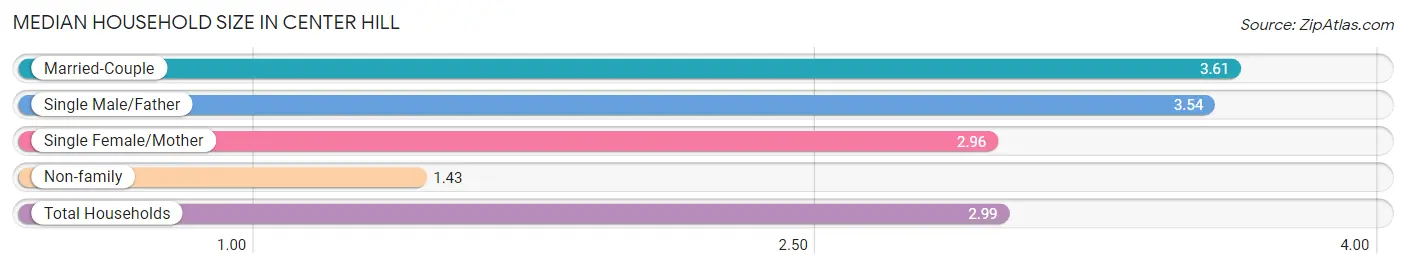
| Household Type | # Households | Household Size |
| Married-Couple | 183 (48.5%) | 3.61 |
| Single Male/Father | 54 (14.3%) | 3.54 |
| Single Female/Mother | 50 (13.3%) | 2.96 |
| Non-family | 90 (23.9%) | 1.43 |
| Total Households | 377 (100.0%) | 2.99 |
Household Size by Marriage Status in Center Hill
Out of a total of 377 households in Center Hill, 287 (76.1%) are family households, while 90 (23.9%) are nonfamily households. The most numerous type of family households are 2-person households, comprising 80, and the most common type of nonfamily households are 1-person households, comprising 62.
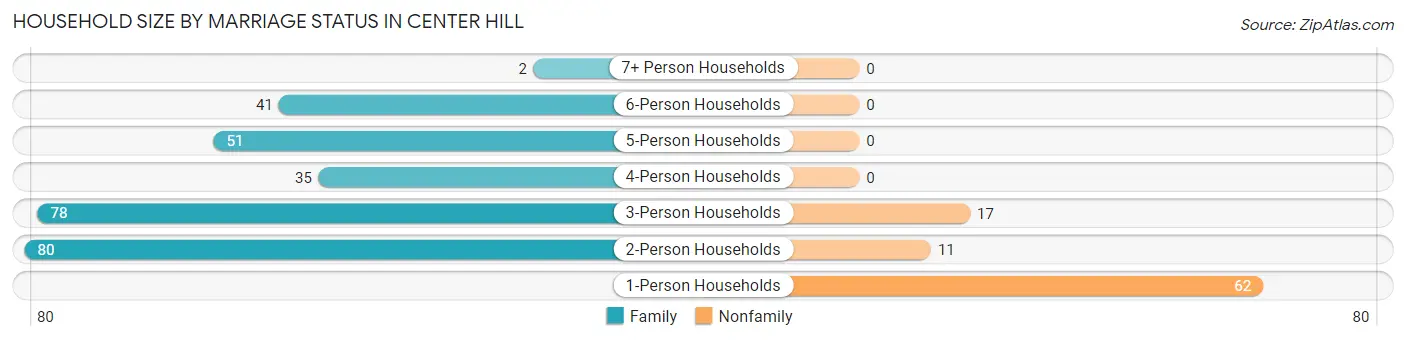
| Household Size | Family Households | Nonfamily Households |
| 1-Person Households | - | 62 (16.5%) |
| 2-Person Households | 80 (21.2%) | 11 (2.9%) |
| 3-Person Households | 78 (20.7%) | 17 (4.5%) |
| 4-Person Households | 35 (9.3%) | 0 (0.0%) |
| 5-Person Households | 51 (13.5%) | 0 (0.0%) |
| 6-Person Households | 41 (10.9%) | 0 (0.0%) |
| 7+ Person Households | 2 (0.5%) | 0 (0.0%) |
| Total | 287 (76.1%) | 90 (23.9%) |
Female Fertility in Center Hill
Fertility by Age in Center Hill
Average fertility rate in Center Hill is 72.0 births per 1,000 women. Women in the age bracket of 20 to 34 years have the highest fertility rate with 262.0 births per 1,000 women. Women in the age bracket of 20 to 34 years acount for 100.0% of all women with births.
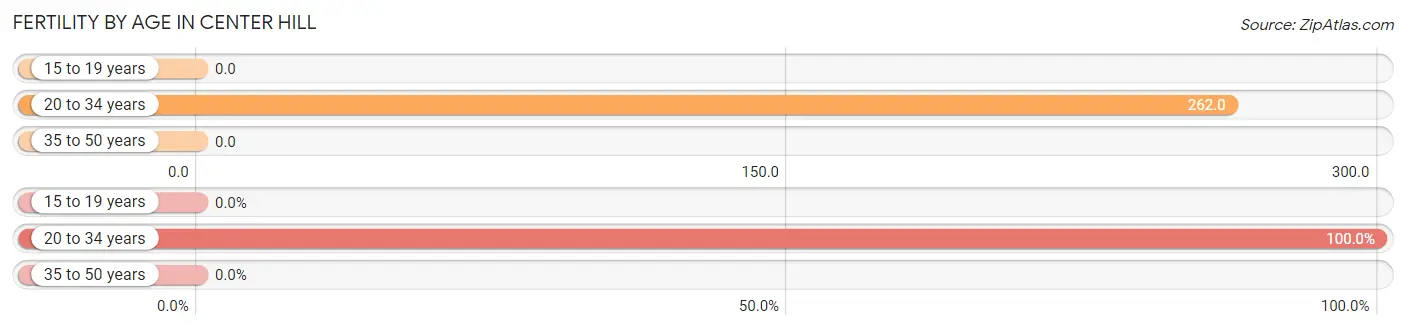
| Age Bracket | Women with Births | Births / 1,000 Women |
| 15 to 19 years | 0 (0.0%) | 0.0 |
| 20 to 34 years | 17 (100.0%) | 262.0 |
| 35 to 50 years | 0 (0.0%) | 0.0 |
| Total | 17 (100.0%) | 72.0 |
Fertility by Age by Marriage Status in Center Hill
52.9% of women with births (17) in Center Hill are married. The highest percentage of unmarried women with births falls into 20 to 34 years age bracket with 47.1% of them unmarried at the time of birth, while the lowest percentage of unmarried women with births belong to 20 to 34 years age bracket with 47.1% of them unmarried.
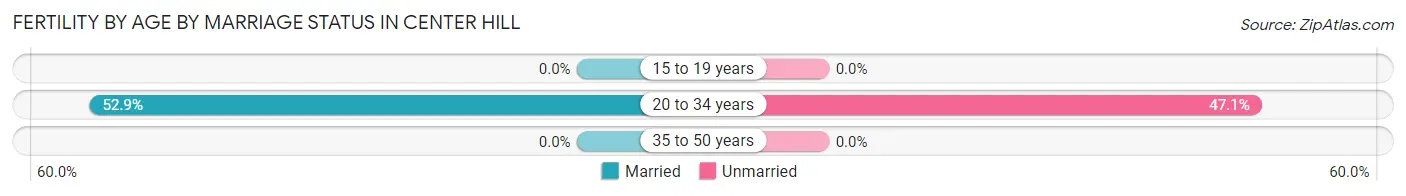
| Age Bracket | Married | Unmarried |
| 15 to 19 years | 0 (0.0%) | 0 (0.0%) |
| 20 to 34 years | 9 (52.9%) | 8 (47.1%) |
| 35 to 50 years | 0 (0.0%) | 0 (0.0%) |
| Total | 9 (52.9%) | 8 (47.1%) |
Fertility by Education in Center Hill
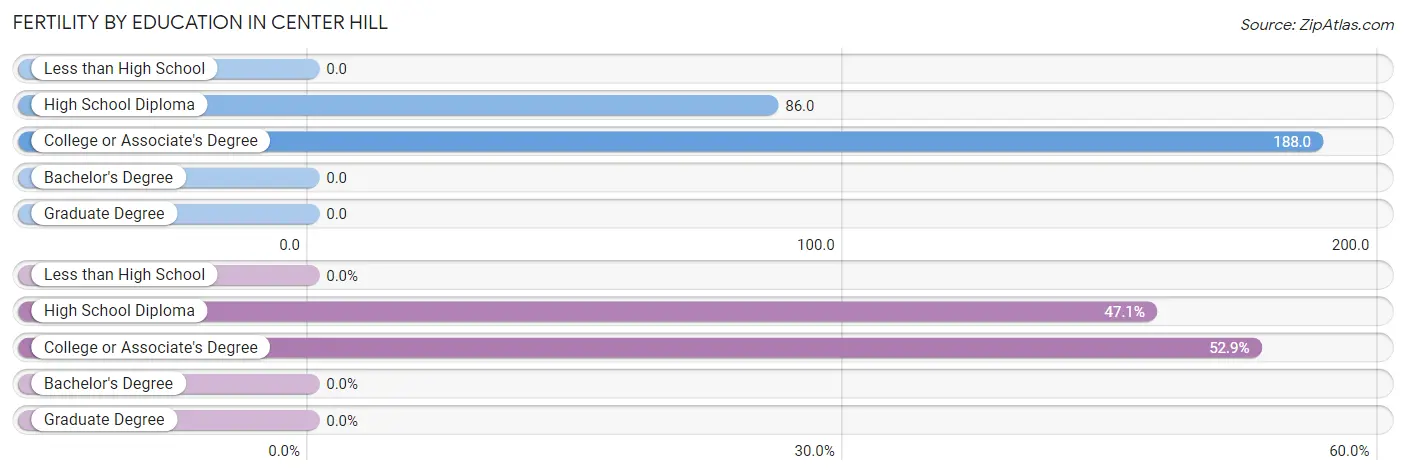
| Educational Attainment | Women with Births | Births / 1,000 Women |
| Less than High School | 0 (0.0%) | 0.0 |
| High School Diploma | 8 (47.1%) | 86.0 |
| College or Associate's Degree | 9 (52.9%) | 188.0 |
| Bachelor's Degree | 0 (0.0%) | 0.0 |
| Graduate Degree | 0 (0.0%) | 0.0 |
| Total | 17 (100.0%) | 72.0 |
Fertility by Education by Marriage Status in Center Hill
47.1% of women with births in Center Hill are unmarried. Women with the educational attainment of college or associate's degree are most likely to be married with 100.0% of them married at childbirth, while women with the educational attainment of high school diploma are least likely to be married with 100.0% of them unmarried at childbirth.
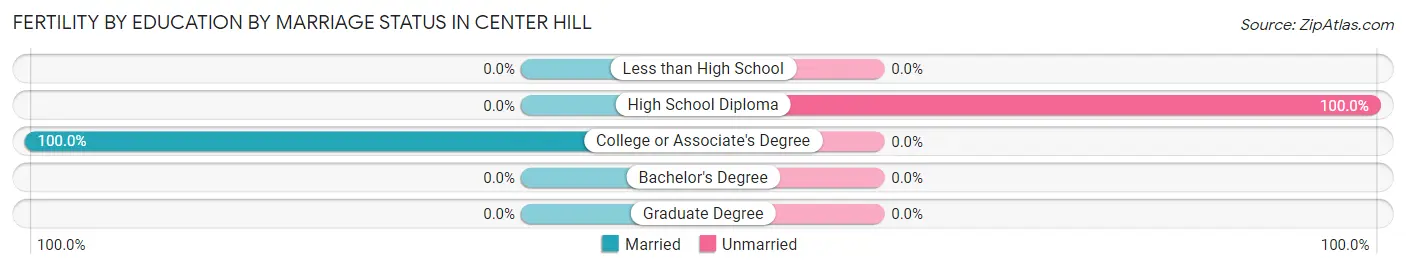
| Educational Attainment | Married | Unmarried |
| Less than High School | 0 (0.0%) | 0 (0.0%) |
| High School Diploma | 0 (0.0%) | 8 (100.0%) |
| College or Associate's Degree | 9 (100.0%) | 0 (0.0%) |
| Bachelor's Degree | 0 (0.0%) | 0 (0.0%) |
| Graduate Degree | 0 (0.0%) | 0 (0.0%) |
| Total | 9 (52.9%) | 8 (47.1%) |
Employment Characteristics in Center Hill
Employment by Class of Employer in Center Hill
Among the 444 employed individuals in Center Hill, private company employees (410 | 92.3%), not-for-profit organizations (13 | 2.9%), and local government employees (11 | 2.5%) make up the most common classes of employment.
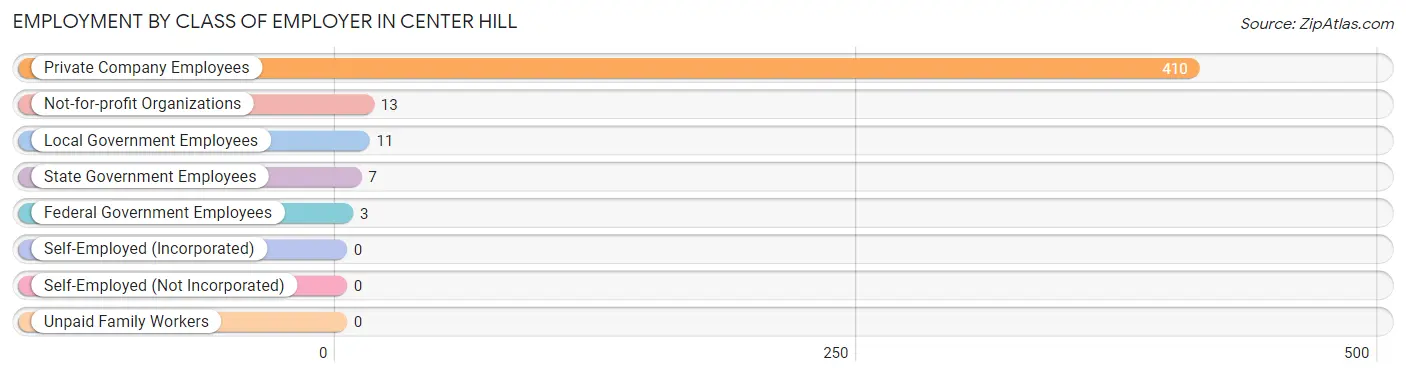
| Employer Class | # Employees | % Employees |
| Private Company Employees | 410 | 92.3% |
| Self-Employed (Incorporated) | 0 | 0.0% |
| Self-Employed (Not Incorporated) | 0 | 0.0% |
| Not-for-profit Organizations | 13 | 2.9% |
| Local Government Employees | 11 | 2.5% |
| State Government Employees | 7 | 1.6% |
| Federal Government Employees | 3 | 0.7% |
| Unpaid Family Workers | 0 | 0.0% |
| Total | 444 | 100.0% |
Employment Status by Age in Center Hill
According to the labor force statistics for Center Hill, out of the total population over 16 years of age (900), 54.7% or 492 individuals are in the labor force, with 7.3% or 36 of them unemployed. The age group with the highest labor force participation rate is 20 to 24 years, with 79.3% or 46 individuals in the labor force. Within the labor force, the 75 years and over age range has the highest percentage of unemployed individuals, with 100.0% or 5 of them being unemployed.
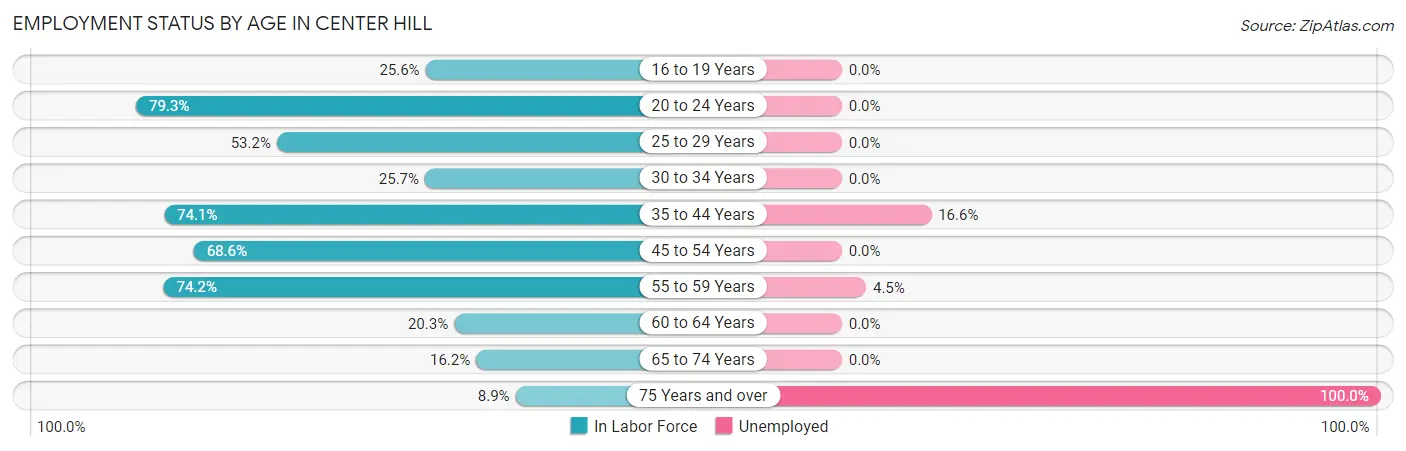
| Age Bracket | In Labor Force | Unemployed |
| 16 to 19 Years | 10 (25.6%) | 0 (0.0%) |
| 20 to 24 Years | 46 (79.3%) | 0 (0.0%) |
| 25 to 29 Years | 33 (53.2%) | 0 (0.0%) |
| 30 to 34 Years | 9 (25.7%) | 0 (0.0%) |
| 35 to 44 Years | 169 (74.1%) | 28 (16.6%) |
| 45 to 54 Years | 127 (68.6%) | 0 (0.0%) |
| 55 to 59 Years | 66 (74.2%) | 3 (4.5%) |
| 60 to 64 Years | 15 (20.3%) | 0 (0.0%) |
| 65 to 74 Years | 12 (16.2%) | 0 (0.0%) |
| 75 Years and over | 5 (8.9%) | 5 (100.0%) |
| Total | 492 (54.7%) | 36 (7.3%) |
Employment Status by Educational Attainment in Center Hill
According to labor force statistics for Center Hill, 62.3% of individuals (419) out of the total population between 25 and 64 years of age (673) are in the labor force, with 7.4% or 31 of them being unemployed. The group with the highest labor force participation rate are those with the educational attainment of bachelor's degree or higher, with 100.0% or 35 individuals in the labor force. Within the labor force, individuals with high school diploma education have the highest percentage of unemployment, with 25.2% or 28 of them being unemployed.
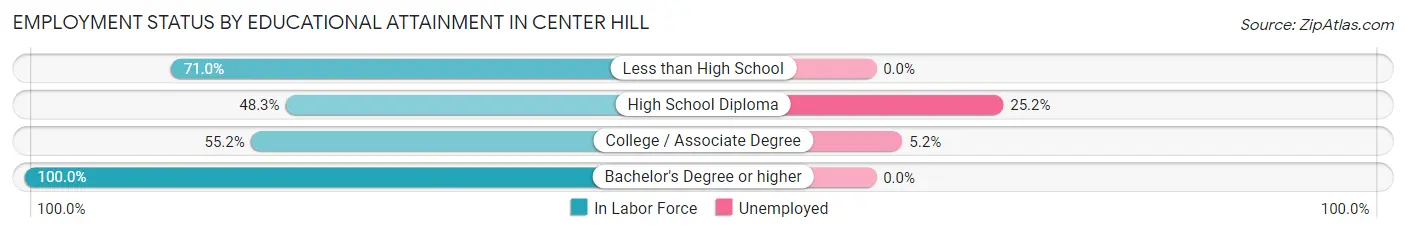
| Educational Attainment | In Labor Force | Unemployed |
| Less than High School | 215 (71.0%) | 0 (0.0%) |
| High School Diploma | 111 (48.3%) | 58 (25.2%) |
| College / Associate Degree | 58 (55.2%) | 5 (5.2%) |
| Bachelor's Degree or higher | 35 (100.0%) | 0 (0.0%) |
| Total | 419 (62.3%) | 50 (7.4%) |
Employment Occupations by Sex in Center Hill
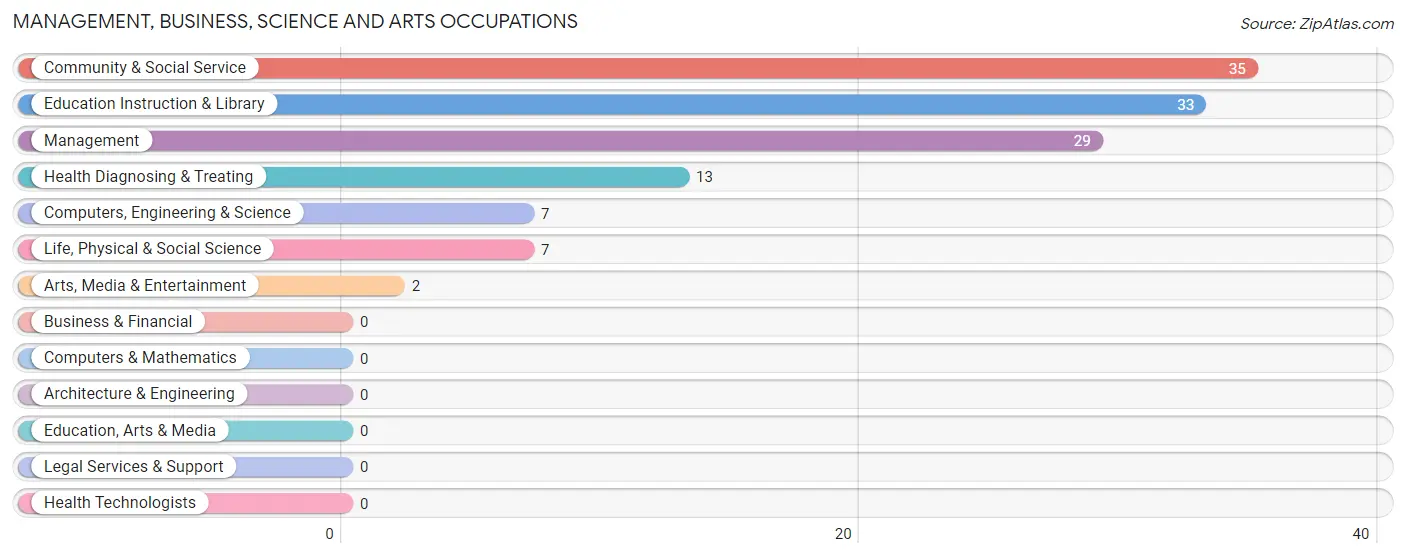
Management, Business, Science and Arts Occupations
The most common Management, Business, Science and Arts occupations in Center Hill are Community & Social Service (35 | 7.7%), Education Instruction & Library (33 | 7.2%), Management (29 | 6.4%), Health Diagnosing & Treating (13 | 2.9%), and Computers, Engineering & Science (7 | 1.5%).
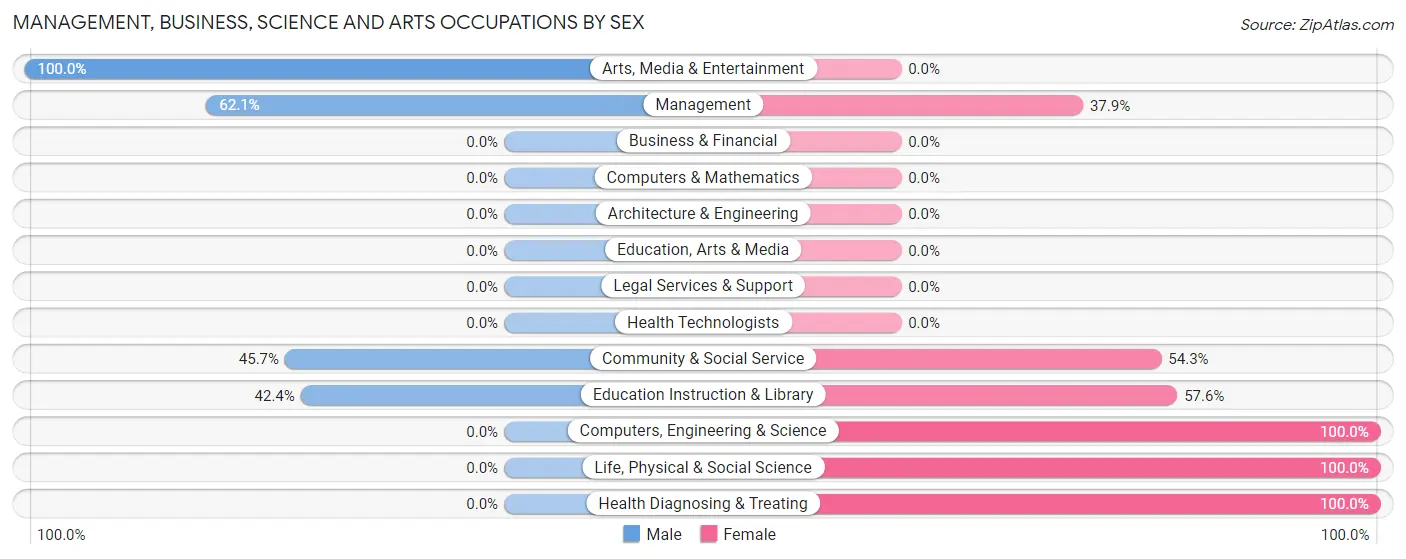
Management, Business, Science and Arts Occupations by Sex
Within the Management, Business, Science and Arts occupations in Center Hill, the most male-oriented occupations are Arts, Media & Entertainment (100.0%), Management (62.1%), and Community & Social Service (45.7%), while the most female-oriented occupations are Computers, Engineering & Science (100.0%), Life, Physical & Social Science (100.0%), and Health Diagnosing & Treating (100.0%).
| Occupation | Male | Female |
| Management | 18 (62.1%) | 11 (37.9%) |
| Business & Financial | 0 (0.0%) | 0 (0.0%) |
| Computers, Engineering & Science | 0 (0.0%) | 7 (100.0%) |
| Computers & Mathematics | 0 (0.0%) | 0 (0.0%) |
| Architecture & Engineering | 0 (0.0%) | 0 (0.0%) |
| Life, Physical & Social Science | 0 (0.0%) | 7 (100.0%) |
| Community & Social Service | 16 (45.7%) | 19 (54.3%) |
| Education, Arts & Media | 0 (0.0%) | 0 (0.0%) |
| Legal Services & Support | 0 (0.0%) | 0 (0.0%) |
| Education Instruction & Library | 14 (42.4%) | 19 (57.6%) |
| Arts, Media & Entertainment | 2 (100.0%) | 0 (0.0%) |
| Health Diagnosing & Treating | 0 (0.0%) | 13 (100.0%) |
| Health Technologists | 0 (0.0%) | 0 (0.0%) |
| Total (Category) | 34 (40.5%) | 50 (59.5%) |
| Total (Overall) | 320 (70.2%) | 136 (29.8%) |
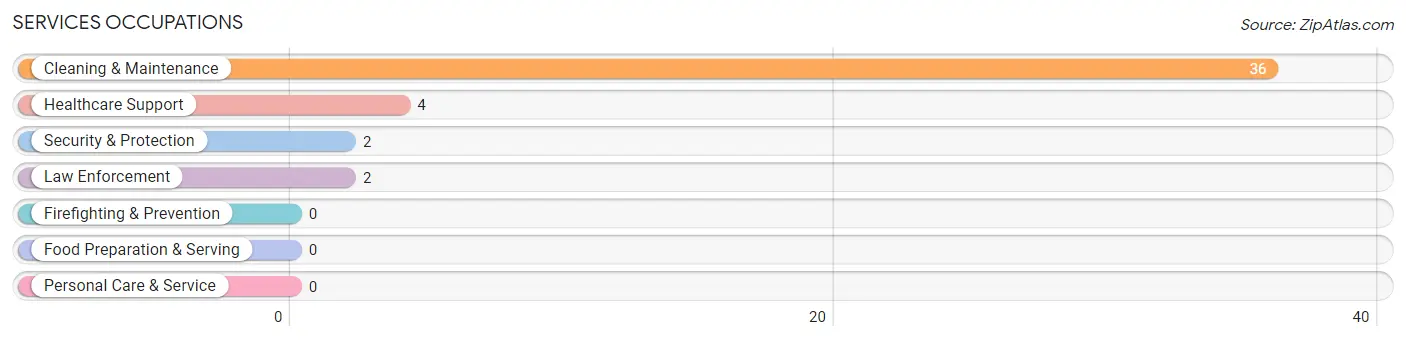
Services Occupations
The most common Services occupations in Center Hill are Cleaning & Maintenance (36 | 7.9%), Healthcare Support (4 | 0.9%), Security & Protection (2 | 0.4%), and Law Enforcement (2 | 0.4%).
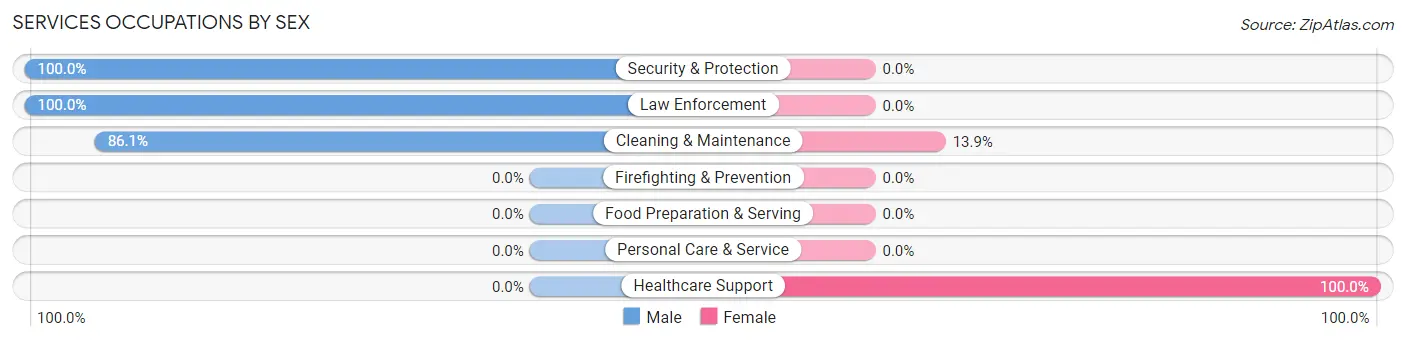
Services Occupations by Sex
Within the Services occupations in Center Hill, the most male-oriented occupations are Security & Protection (100.0%), Law Enforcement (100.0%), and Cleaning & Maintenance (86.1%), while the most female-oriented occupations are Healthcare Support (100.0%), and Cleaning & Maintenance (13.9%).
| Occupation | Male | Female |
| Healthcare Support | 0 (0.0%) | 4 (100.0%) |
| Security & Protection | 2 (100.0%) | 0 (0.0%) |
| Firefighting & Prevention | 0 (0.0%) | 0 (0.0%) |
| Law Enforcement | 2 (100.0%) | 0 (0.0%) |
| Food Preparation & Serving | 0 (0.0%) | 0 (0.0%) |
| Cleaning & Maintenance | 31 (86.1%) | 5 (13.9%) |
| Personal Care & Service | 0 (0.0%) | 0 (0.0%) |
| Total (Category) | 33 (78.6%) | 9 (21.4%) |
| Total (Overall) | 320 (70.2%) | 136 (29.8%) |
Sales and Office Occupations
The most common Sales and Office occupations in Center Hill are Office & Administration (28 | 6.1%), and Sales & Related (26 | 5.7%).
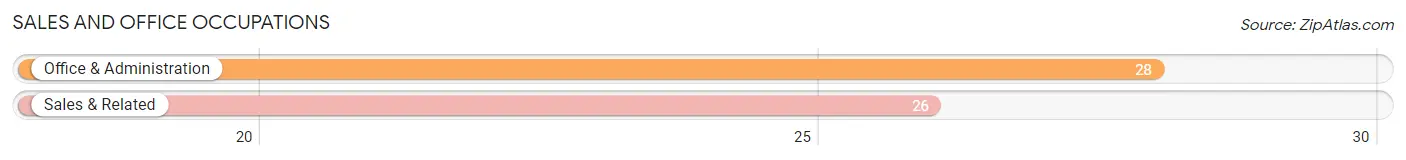
Sales and Office Occupations by Sex
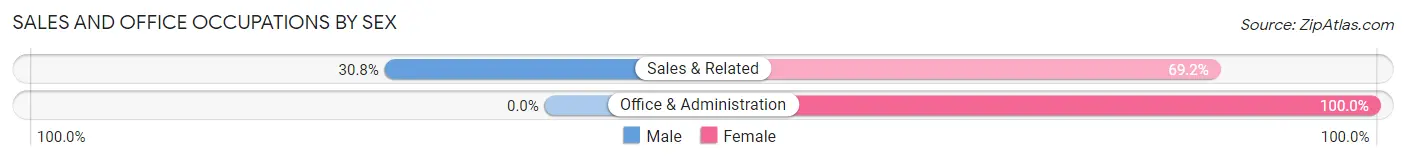
| Occupation | Male | Female |
| Sales & Related | 8 (30.8%) | 18 (69.2%) |
| Office & Administration | 0 (0.0%) | 28 (100.0%) |
| Total (Category) | 8 (14.8%) | 46 (85.2%) |
| Total (Overall) | 320 (70.2%) | 136 (29.8%) |
Natural Resources, Construction and Maintenance Occupations
The most common Natural Resources, Construction and Maintenance occupations in Center Hill are Construction & Extraction (134 | 29.4%), Installation, Maintenance & Repair (27 | 5.9%), and Farming, Fishing & Forestry (21 | 4.6%).
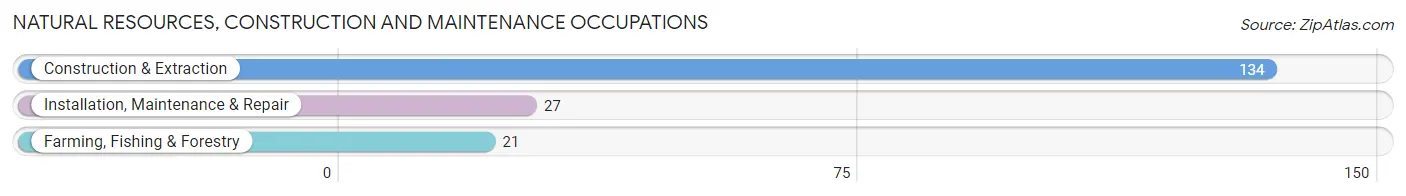
Natural Resources, Construction and Maintenance Occupations by Sex
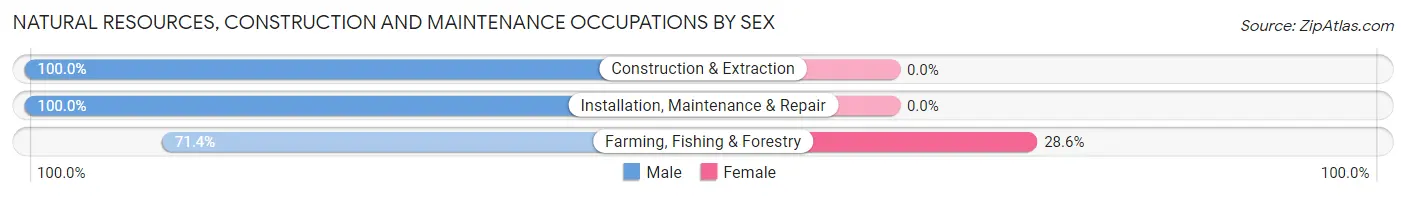
| Occupation | Male | Female |
| Farming, Fishing & Forestry | 15 (71.4%) | 6 (28.6%) |
| Construction & Extraction | 134 (100.0%) | 0 (0.0%) |
| Installation, Maintenance & Repair | 27 (100.0%) | 0 (0.0%) |
| Total (Category) | 176 (96.7%) | 6 (3.3%) |
| Total (Overall) | 320 (70.2%) | 136 (29.8%) |
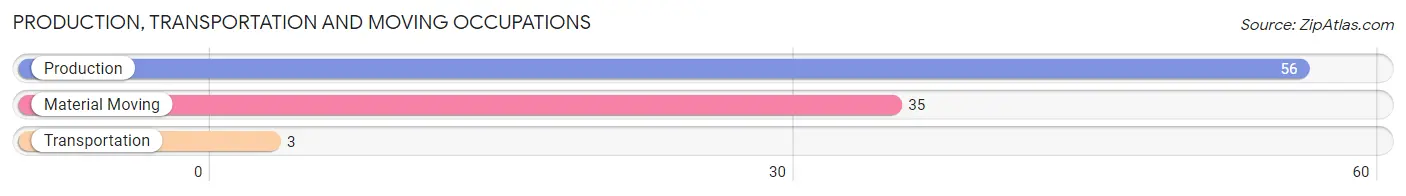
Production, Transportation and Moving Occupations
The most common Production, Transportation and Moving occupations in Center Hill are Production (56 | 12.3%), Material Moving (35 | 7.7%), and Transportation (3 | 0.7%).
Production, Transportation and Moving Occupations by Sex
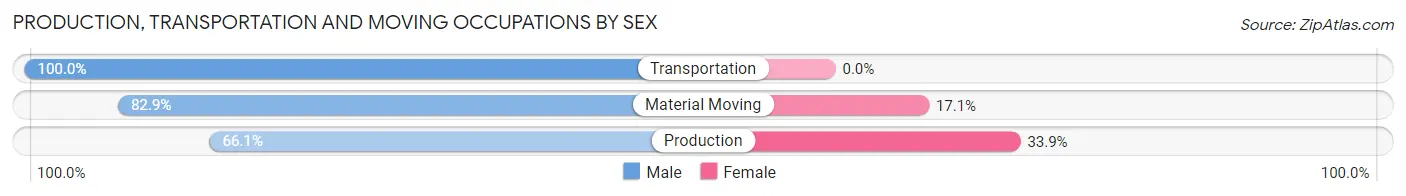
| Occupation | Male | Female |
| Production | 37 (66.1%) | 19 (33.9%) |
| Transportation | 3 (100.0%) | 0 (0.0%) |
| Material Moving | 29 (82.9%) | 6 (17.1%) |
| Total (Category) | 69 (73.4%) | 25 (26.6%) |
| Total (Overall) | 320 (70.2%) | 136 (29.8%) |
Employment Industries by Sex in Center Hill
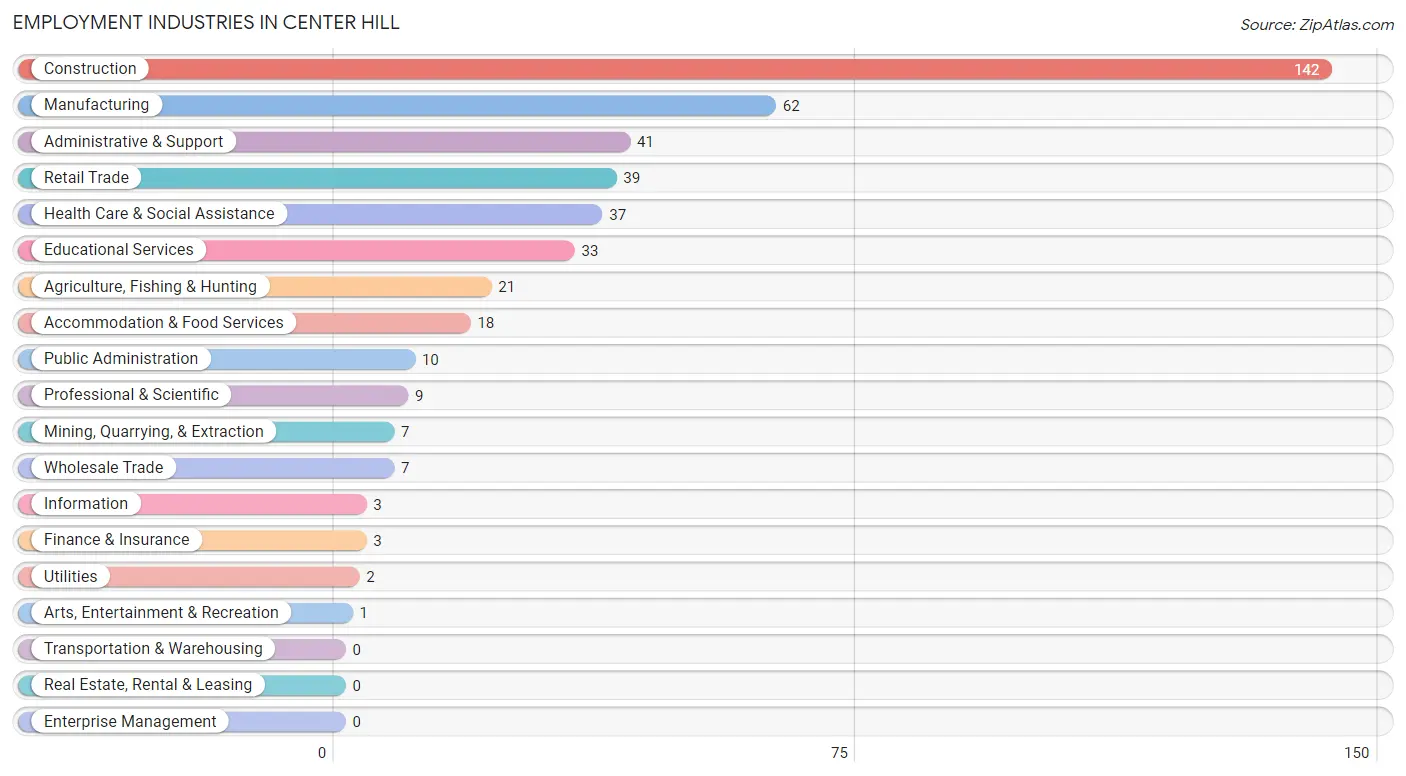
Employment Industries in Center Hill
The major employment industries in Center Hill include Construction (142 | 31.1%), Manufacturing (62 | 13.6%), Administrative & Support (41 | 9.0%), Retail Trade (39 | 8.6%), and Health Care & Social Assistance (37 | 8.1%).
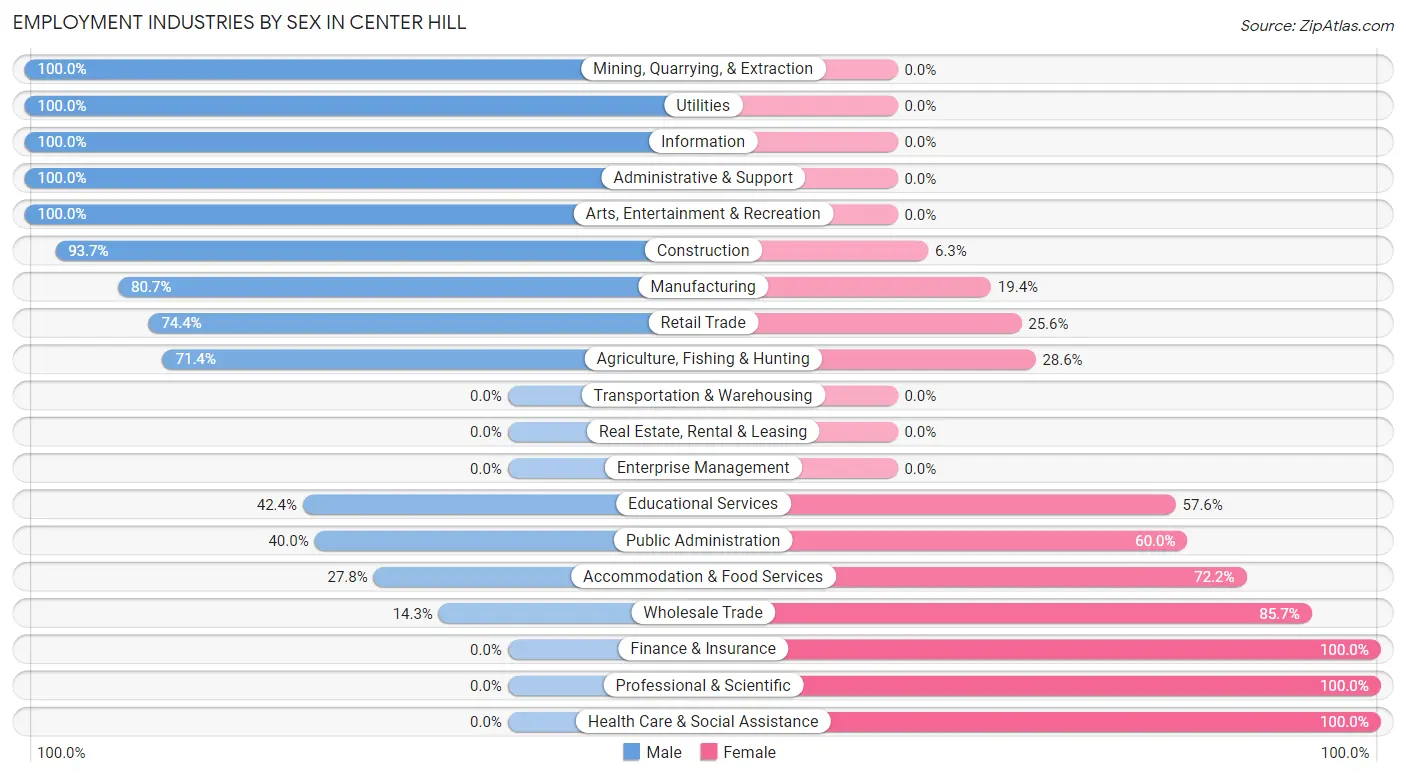
Employment Industries by Sex in Center Hill
The Center Hill industries that see more men than women are Mining, Quarrying, & Extraction (100.0%), Utilities (100.0%), and Information (100.0%), whereas the industries that tend to have a higher number of women are Finance & Insurance (100.0%), Professional & Scientific (100.0%), and Health Care & Social Assistance (100.0%).
| Industry | Male | Female |
| Agriculture, Fishing & Hunting | 15 (71.4%) | 6 (28.6%) |
| Mining, Quarrying, & Extraction | 7 (100.0%) | 0 (0.0%) |
| Construction | 133 (93.7%) | 9 (6.3%) |
| Manufacturing | 50 (80.6%) | 12 (19.4%) |
| Wholesale Trade | 1 (14.3%) | 6 (85.7%) |
| Retail Trade | 29 (74.4%) | 10 (25.6%) |
| Transportation & Warehousing | 0 (0.0%) | 0 (0.0%) |
| Utilities | 2 (100.0%) | 0 (0.0%) |
| Information | 3 (100.0%) | 0 (0.0%) |
| Finance & Insurance | 0 (0.0%) | 3 (100.0%) |
| Real Estate, Rental & Leasing | 0 (0.0%) | 0 (0.0%) |
| Professional & Scientific | 0 (0.0%) | 9 (100.0%) |
| Enterprise Management | 0 (0.0%) | 0 (0.0%) |
| Administrative & Support | 41 (100.0%) | 0 (0.0%) |
| Educational Services | 14 (42.4%) | 19 (57.6%) |
| Health Care & Social Assistance | 0 (0.0%) | 37 (100.0%) |
| Arts, Entertainment & Recreation | 1 (100.0%) | 0 (0.0%) |
| Accommodation & Food Services | 5 (27.8%) | 13 (72.2%) |
| Public Administration | 4 (40.0%) | 6 (60.0%) |
| Total | 320 (70.2%) | 136 (29.8%) |
Education in Center Hill
School Enrollment in Center Hill
The most common levels of schooling among the 233 students in Center Hill are elementary school (97 | 41.6%), middle school (44 | 18.9%), and high school (43 | 18.4%).
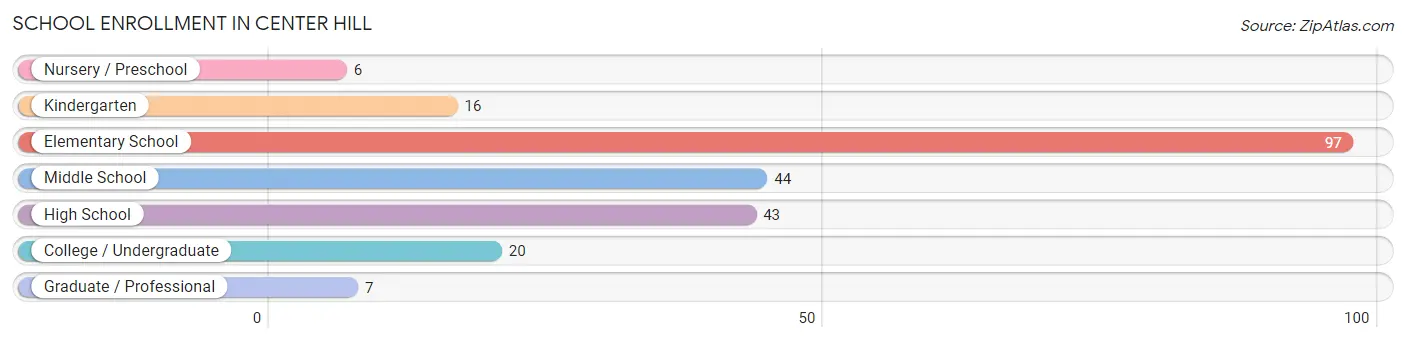
| School Level | # Students | % Students |
| Nursery / Preschool | 6 | 2.6% |
| Kindergarten | 16 | 6.9% |
| Elementary School | 97 | 41.6% |
| Middle School | 44 | 18.9% |
| High School | 43 | 18.4% |
| College / Undergraduate | 20 | 8.6% |
| Graduate / Professional | 7 | 3.0% |
| Total | 233 | 100.0% |
School Enrollment by Age by Funding Source in Center Hill
Out of a total of 233 students who are enrolled in schools in Center Hill, 29 (12.4%) attend a private institution, while the remaining 204 (87.6%) are enrolled in public schools. The age group of 3 to 4 year olds has the highest likelihood of being enrolled in private schools, with 6 (100.0% in the age bracket) enrolled. Conversely, the age group of 15 to 17 year olds has the lowest likelihood of being enrolled in a private school, with 23 (100.0% in the age bracket) attending a public institution.
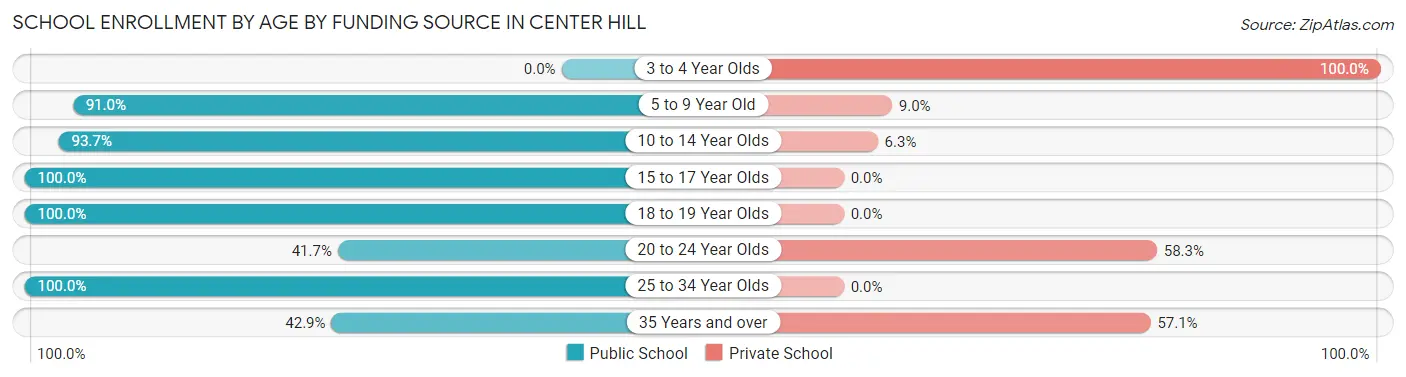
| Age Bracket | Public School | Private School |
| 3 to 4 Year Olds | 0 (0.0%) | 6 (100.0%) |
| 5 to 9 Year Old | 71 (91.0%) | 7 (9.0%) |
| 10 to 14 Year Olds | 74 (93.7%) | 5 (6.3%) |
| 15 to 17 Year Olds | 23 (100.0%) | 0 (0.0%) |
| 18 to 19 Year Olds | 20 (100.0%) | 0 (0.0%) |
| 20 to 24 Year Olds | 5 (41.7%) | 7 (58.3%) |
| 25 to 34 Year Olds | 8 (100.0%) | 0 (0.0%) |
| 35 Years and over | 3 (42.9%) | 4 (57.1%) |
| Total | 204 (87.6%) | 29 (12.4%) |
Educational Attainment by Field of Study in Center Hill
Education (26 | 63.4%), liberal arts & history (6 | 14.6%), psychology (3 | 7.3%), science & technology (3 | 7.3%), and communications (3 | 7.3%) are the most common fields of study among 41 individuals in Center Hill who have obtained a bachelor's degree or higher.
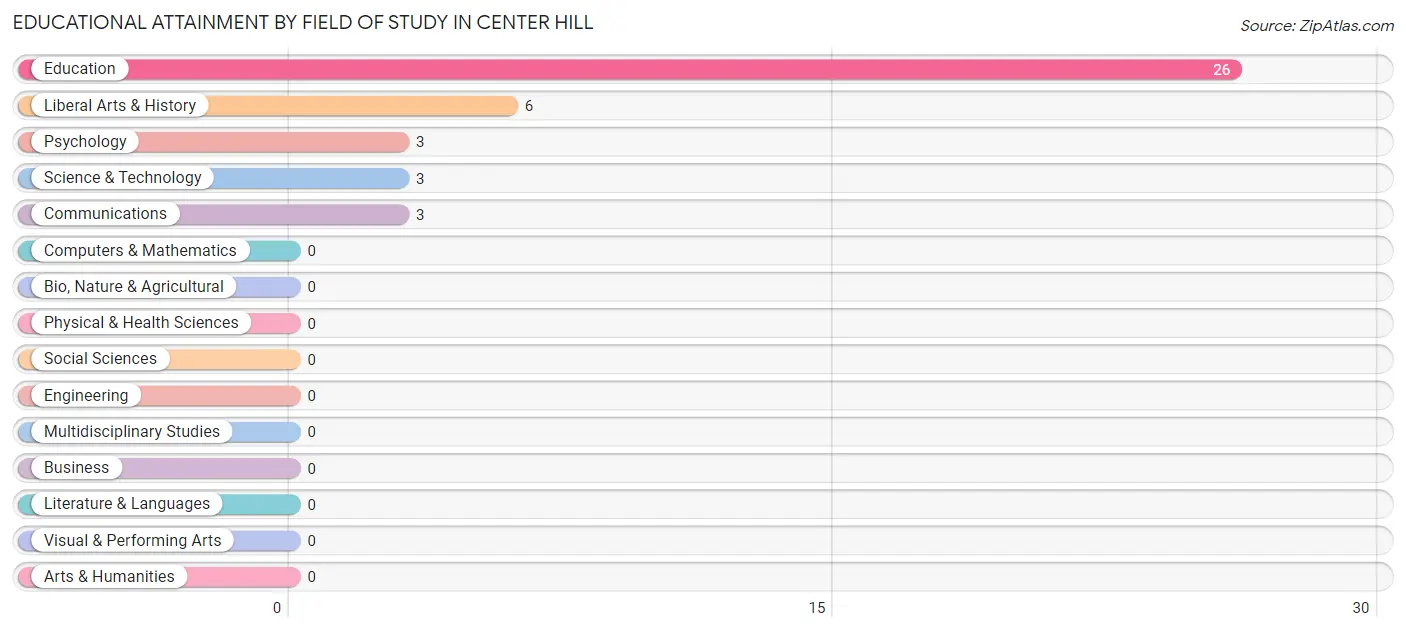
| Field of Study | # Graduates | % Graduates |
| Computers & Mathematics | 0 | 0.0% |
| Bio, Nature & Agricultural | 0 | 0.0% |
| Physical & Health Sciences | 0 | 0.0% |
| Psychology | 3 | 7.3% |
| Social Sciences | 0 | 0.0% |
| Engineering | 0 | 0.0% |
| Multidisciplinary Studies | 0 | 0.0% |
| Science & Technology | 3 | 7.3% |
| Business | 0 | 0.0% |
| Education | 26 | 63.4% |
| Literature & Languages | 0 | 0.0% |
| Liberal Arts & History | 6 | 14.6% |
| Visual & Performing Arts | 0 | 0.0% |
| Communications | 3 | 7.3% |
| Arts & Humanities | 0 | 0.0% |
| Total | 41 | 100.0% |
Transportation & Commute in Center Hill
Vehicle Availability by Sex in Center Hill
The most prevalent vehicle ownership categories in Center Hill are males with 3 vehicles (114, accounting for 36.8%) and females with 3 vehicles (45, making up 85.1%).
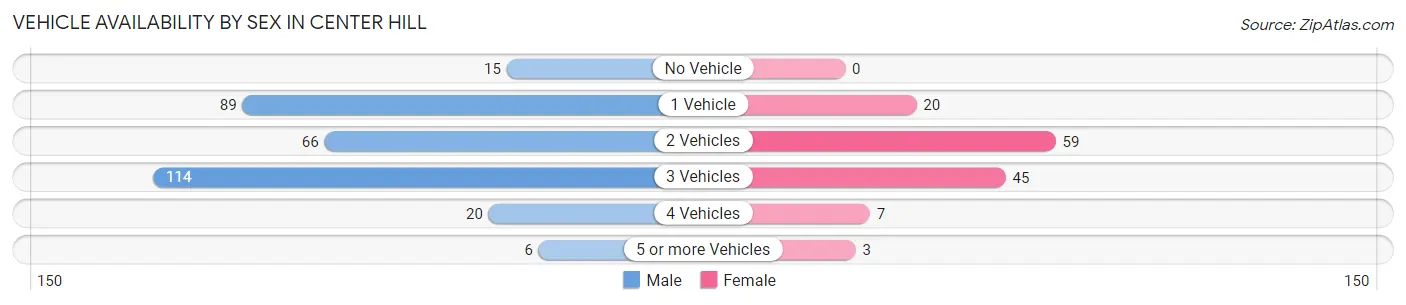
| Vehicles Available | Male | Female |
| No Vehicle | 15 (4.8%) | 0 (0.0%) |
| 1 Vehicle | 89 (28.7%) | 20 (14.9%) |
| 2 Vehicles | 66 (21.3%) | 59 (44.0%) |
| 3 Vehicles | 114 (36.8%) | 45 (33.6%) |
| 4 Vehicles | 20 (6.5%) | 7 (5.2%) |
| 5 or more Vehicles | 6 (1.9%) | 3 (2.2%) |
| Total | 310 (100.0%) | 134 (100.0%) |
Commute Time in Center Hill
The most frequently occuring commute durations in Center Hill are 30 to 34 minutes (88 commuters, 19.8%), 45 to 59 minutes (60 commuters, 13.5%), and 25 to 29 minutes (54 commuters, 12.2%).
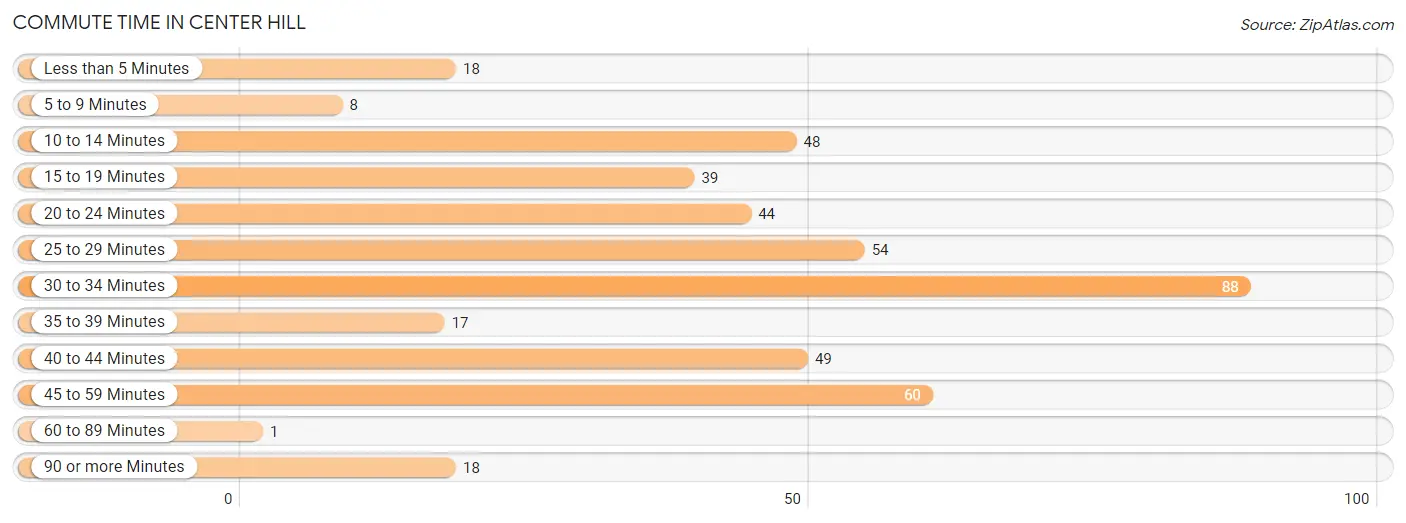
| Commute Time | # Commuters | % Commuters |
| Less than 5 Minutes | 18 | 4.1% |
| 5 to 9 Minutes | 8 | 1.8% |
| 10 to 14 Minutes | 48 | 10.8% |
| 15 to 19 Minutes | 39 | 8.8% |
| 20 to 24 Minutes | 44 | 9.9% |
| 25 to 29 Minutes | 54 | 12.2% |
| 30 to 34 Minutes | 88 | 19.8% |
| 35 to 39 Minutes | 17 | 3.8% |
| 40 to 44 Minutes | 49 | 11.0% |
| 45 to 59 Minutes | 60 | 13.5% |
| 60 to 89 Minutes | 1 | 0.2% |
| 90 or more Minutes | 18 | 4.1% |
Commute Time by Sex in Center Hill
The most common commute times in Center Hill are 30 to 34 minutes (60 commuters, 19.4%) for males and 30 to 34 minutes (28 commuters, 20.9%) for females.
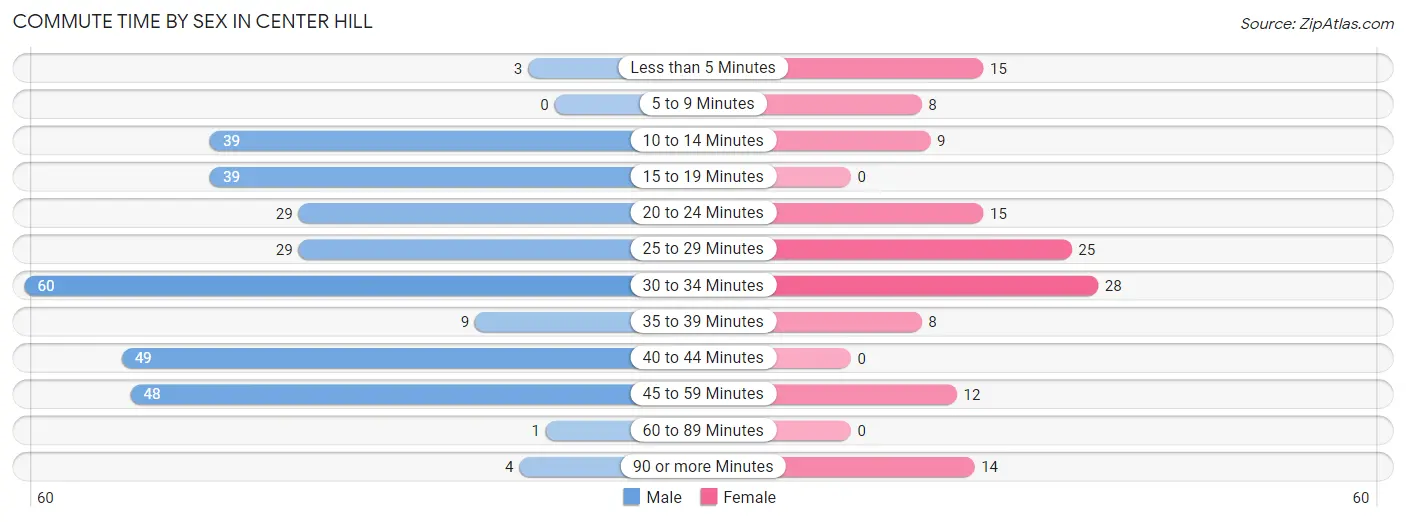
| Commute Time | Male | Female |
| Less than 5 Minutes | 3 (1.0%) | 15 (11.2%) |
| 5 to 9 Minutes | 0 (0.0%) | 8 (6.0%) |
| 10 to 14 Minutes | 39 (12.6%) | 9 (6.7%) |
| 15 to 19 Minutes | 39 (12.6%) | 0 (0.0%) |
| 20 to 24 Minutes | 29 (9.3%) | 15 (11.2%) |
| 25 to 29 Minutes | 29 (9.3%) | 25 (18.7%) |
| 30 to 34 Minutes | 60 (19.4%) | 28 (20.9%) |
| 35 to 39 Minutes | 9 (2.9%) | 8 (6.0%) |
| 40 to 44 Minutes | 49 (15.8%) | 0 (0.0%) |
| 45 to 59 Minutes | 48 (15.5%) | 12 (9.0%) |
| 60 to 89 Minutes | 1 (0.3%) | 0 (0.0%) |
| 90 or more Minutes | 4 (1.3%) | 14 (10.4%) |
Time of Departure to Work by Sex in Center Hill
The most frequent times of departure to work in Center Hill are 12:00 AM to 4:59 AM (109, 35.2%) for males and 7:30 AM to 7:59 AM (52, 38.8%) for females.
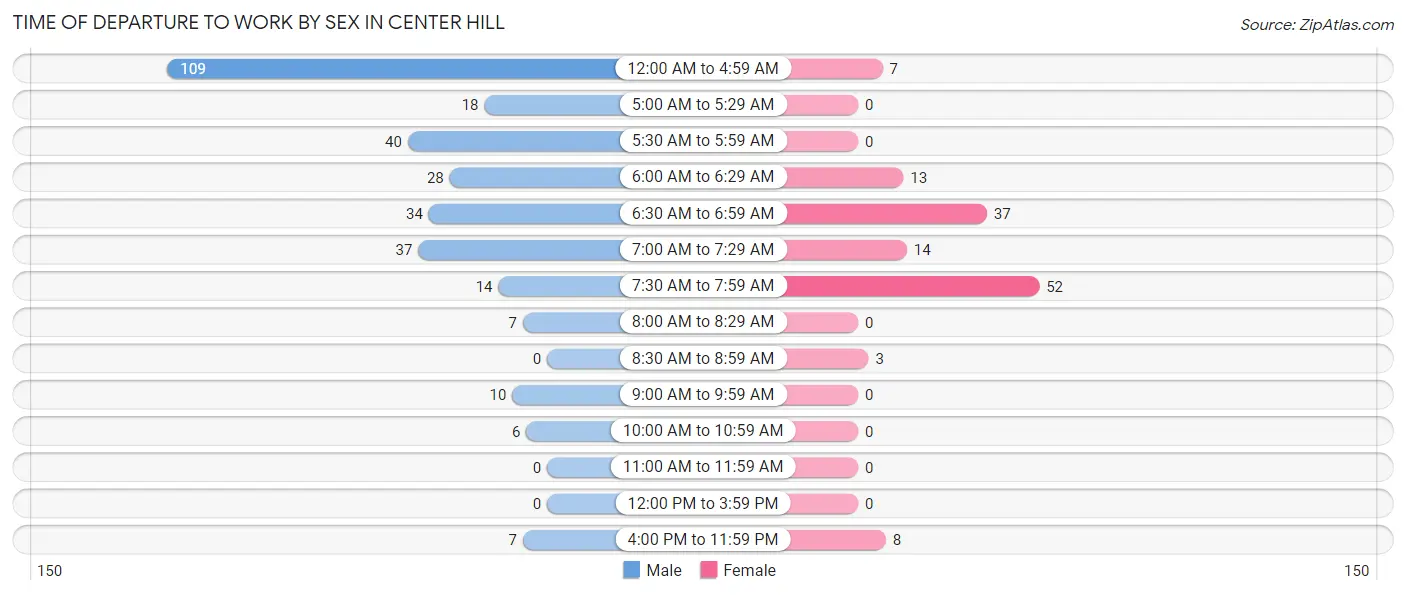
| Time of Departure | Male | Female |
| 12:00 AM to 4:59 AM | 109 (35.2%) | 7 (5.2%) |
| 5:00 AM to 5:29 AM | 18 (5.8%) | 0 (0.0%) |
| 5:30 AM to 5:59 AM | 40 (12.9%) | 0 (0.0%) |
| 6:00 AM to 6:29 AM | 28 (9.0%) | 13 (9.7%) |
| 6:30 AM to 6:59 AM | 34 (11.0%) | 37 (27.6%) |
| 7:00 AM to 7:29 AM | 37 (11.9%) | 14 (10.4%) |
| 7:30 AM to 7:59 AM | 14 (4.5%) | 52 (38.8%) |
| 8:00 AM to 8:29 AM | 7 (2.3%) | 0 (0.0%) |
| 8:30 AM to 8:59 AM | 0 (0.0%) | 3 (2.2%) |
| 9:00 AM to 9:59 AM | 10 (3.2%) | 0 (0.0%) |
| 10:00 AM to 10:59 AM | 6 (1.9%) | 0 (0.0%) |
| 11:00 AM to 11:59 AM | 0 (0.0%) | 0 (0.0%) |
| 12:00 PM to 3:59 PM | 0 (0.0%) | 0 (0.0%) |
| 4:00 PM to 11:59 PM | 7 (2.3%) | 8 (6.0%) |
| Total | 310 (100.0%) | 134 (100.0%) |
Housing Occupancy in Center Hill
Occupancy by Ownership in Center Hill
Of the total 377 dwellings in Center Hill, owner-occupied units account for 226 (60.0%), while renter-occupied units make up 151 (40.1%).
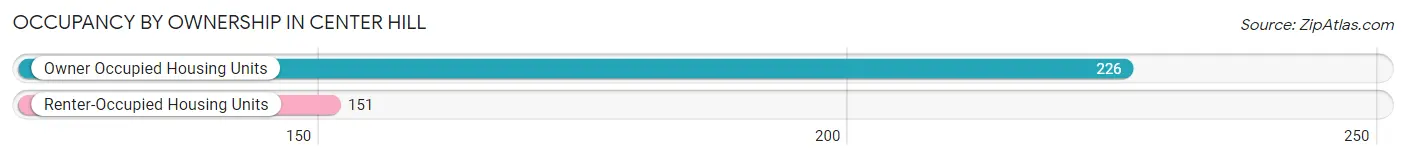
| Occupancy | # Housing Units | % Housing Units |
| Owner Occupied Housing Units | 226 | 60.0% |
| Renter-Occupied Housing Units | 151 | 40.1% |
| Total Occupied Housing Units | 377 | 100.0% |
Occupancy by Household Size in Center Hill
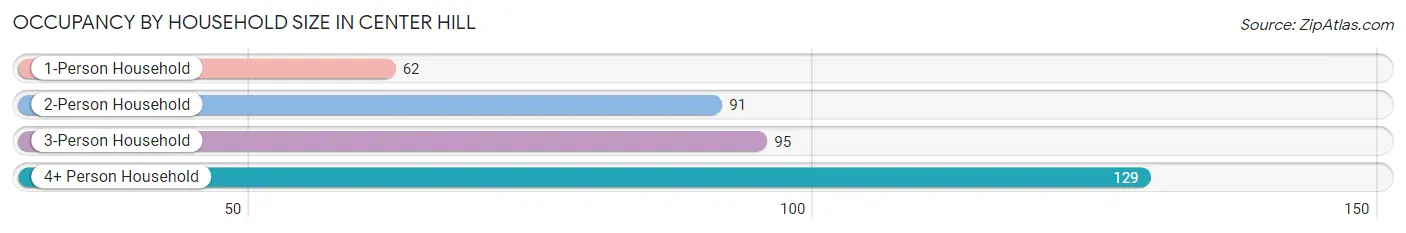
| Household Size | # Housing Units | % Housing Units |
| 1-Person Household | 62 | 16.5% |
| 2-Person Household | 91 | 24.1% |
| 3-Person Household | 95 | 25.2% |
| 4+ Person Household | 129 | 34.2% |
| Total Housing Units | 377 | 100.0% |
Occupancy by Ownership by Household Size in Center Hill
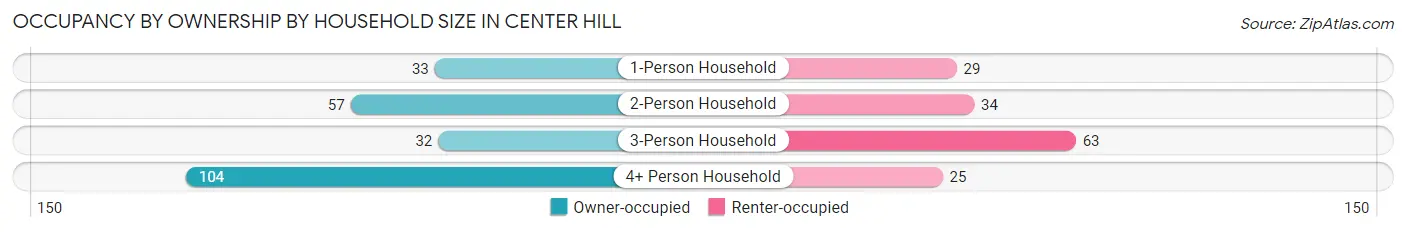
| Household Size | Owner-occupied | Renter-occupied |
| 1-Person Household | 33 (53.2%) | 29 (46.8%) |
| 2-Person Household | 57 (62.6%) | 34 (37.4%) |
| 3-Person Household | 32 (33.7%) | 63 (66.3%) |
| 4+ Person Household | 104 (80.6%) | 25 (19.4%) |
| Total Housing Units | 226 (60.0%) | 151 (40.1%) |
Occupancy by Educational Attainment in Center Hill
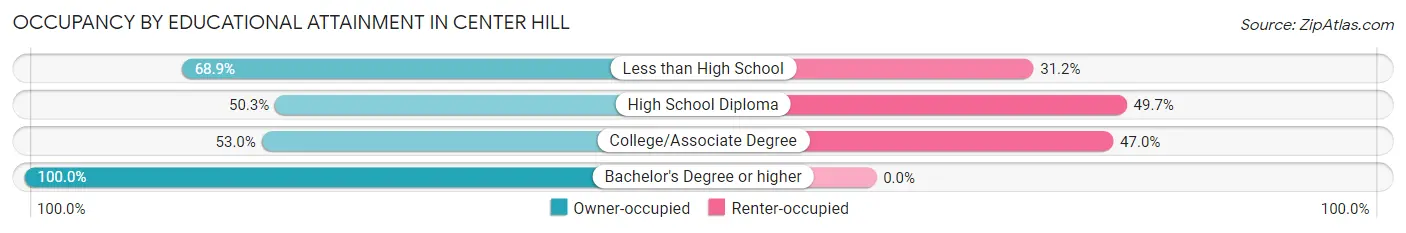
| Household Size | Owner-occupied | Renter-occupied |
| Less than High School | 84 (68.9%) | 38 (31.1%) |
| High School Diploma | 75 (50.3%) | 74 (49.7%) |
| College/Associate Degree | 44 (53.0%) | 39 (47.0%) |
| Bachelor's Degree or higher | 23 (100.0%) | 0 (0.0%) |
Occupancy by Age of Householder in Center Hill
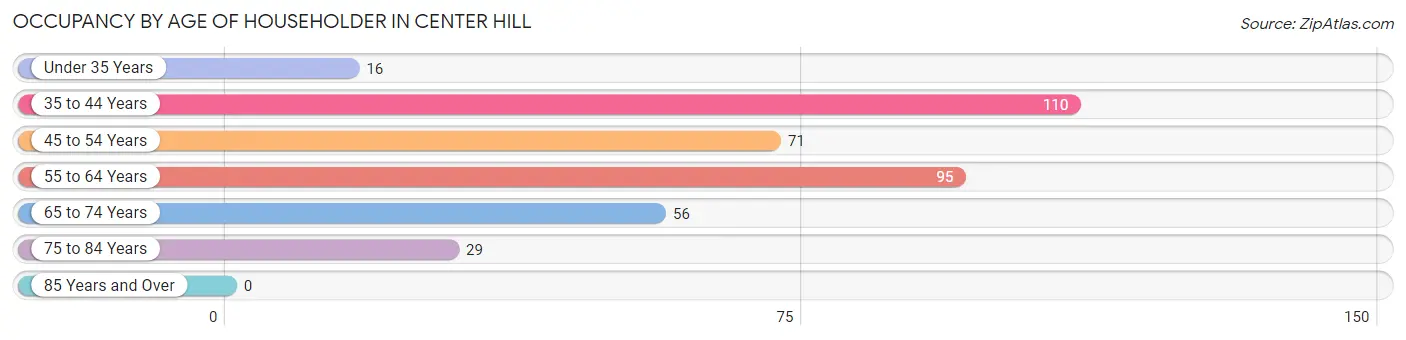
| Age Bracket | # Households | % Households |
| Under 35 Years | 16 | 4.2% |
| 35 to 44 Years | 110 | 29.2% |
| 45 to 54 Years | 71 | 18.8% |
| 55 to 64 Years | 95 | 25.2% |
| 65 to 74 Years | 56 | 14.8% |
| 75 to 84 Years | 29 | 7.7% |
| 85 Years and Over | 0 | 0.0% |
| Total | 377 | 100.0% |
Housing Finances in Center Hill
Median Income by Occupancy in Center Hill
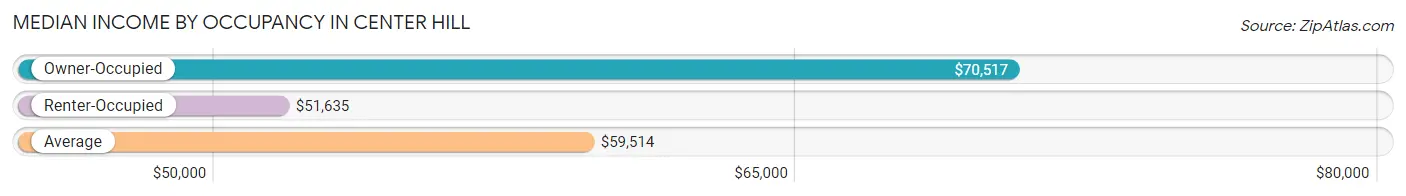
| Occupancy Type | # Households | Median Income |
| Owner-Occupied | 226 (60.0%) | $70,517 |
| Renter-Occupied | 151 (40.1%) | $51,635 |
| Average | 377 (100.0%) | $59,514 |
Occupancy by Householder Income Bracket in Center Hill
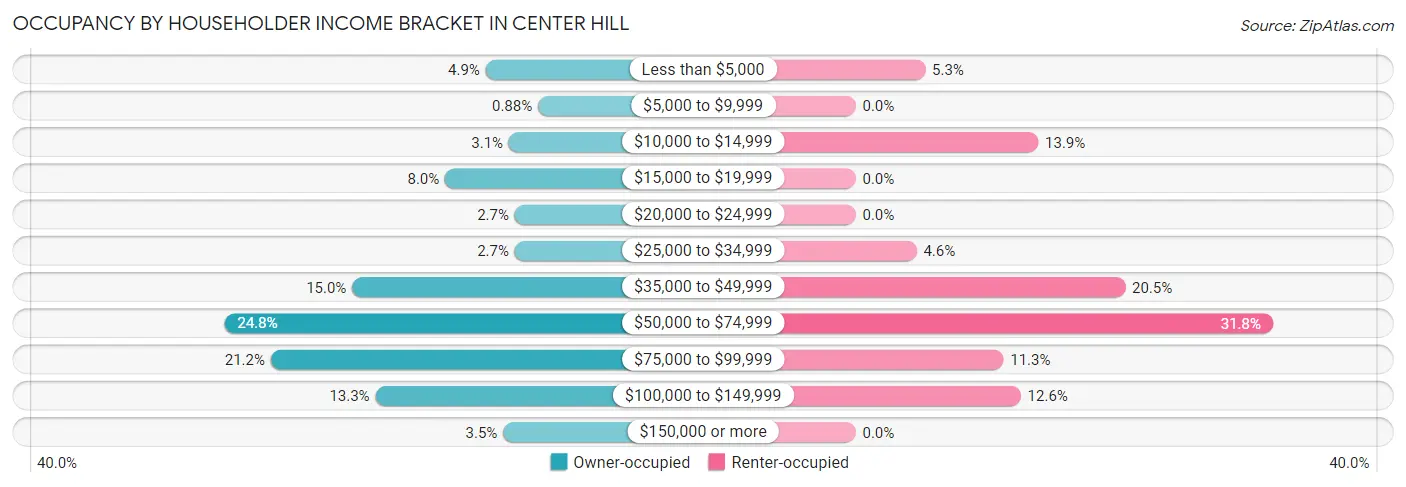
| Income Bracket | Owner-occupied | Renter-occupied |
| Less than $5,000 | 11 (4.9%) | 8 (5.3%) |
| $5,000 to $9,999 | 2 (0.9%) | 0 (0.0%) |
| $10,000 to $14,999 | 7 (3.1%) | 21 (13.9%) |
| $15,000 to $19,999 | 18 (8.0%) | 0 (0.0%) |
| $20,000 to $24,999 | 6 (2.6%) | 0 (0.0%) |
| $25,000 to $34,999 | 6 (2.6%) | 7 (4.6%) |
| $35,000 to $49,999 | 34 (15.0%) | 31 (20.5%) |
| $50,000 to $74,999 | 56 (24.8%) | 48 (31.8%) |
| $75,000 to $99,999 | 48 (21.2%) | 17 (11.3%) |
| $100,000 to $149,999 | 30 (13.3%) | 19 (12.6%) |
| $150,000 or more | 8 (3.5%) | 0 (0.0%) |
| Total | 226 (100.0%) | 151 (100.0%) |
Monthly Housing Cost Tiers in Center Hill
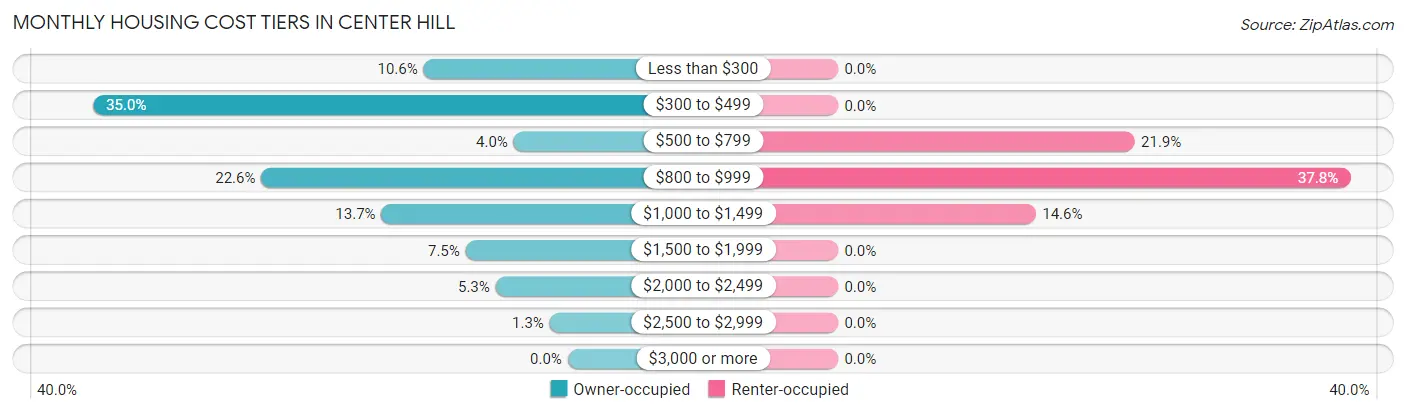
| Monthly Cost | Owner-occupied | Renter-occupied |
| Less than $300 | 24 (10.6%) | 0 (0.0%) |
| $300 to $499 | 79 (35.0%) | 0 (0.0%) |
| $500 to $799 | 9 (4.0%) | 33 (21.8%) |
| $800 to $999 | 51 (22.6%) | 57 (37.8%) |
| $1,000 to $1,499 | 31 (13.7%) | 22 (14.6%) |
| $1,500 to $1,999 | 17 (7.5%) | 0 (0.0%) |
| $2,000 to $2,499 | 12 (5.3%) | 0 (0.0%) |
| $2,500 to $2,999 | 3 (1.3%) | 0 (0.0%) |
| $3,000 or more | 0 (0.0%) | 0 (0.0%) |
| Total | 226 (100.0%) | 151 (100.0%) |
Physical Housing Characteristics in Center Hill
Housing Structures in Center Hill
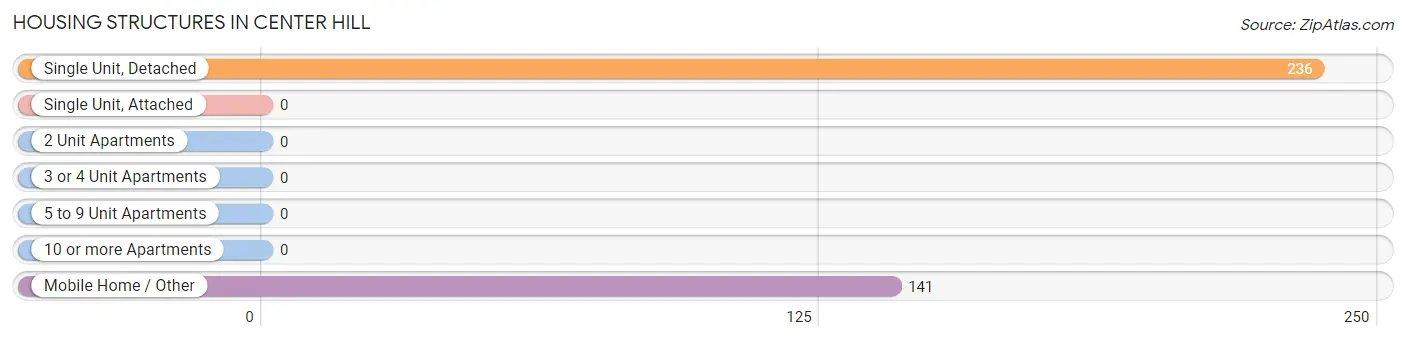
| Structure Type | # Housing Units | % Housing Units |
| Single Unit, Detached | 236 | 62.6% |
| Single Unit, Attached | 0 | 0.0% |
| 2 Unit Apartments | 0 | 0.0% |
| 3 or 4 Unit Apartments | 0 | 0.0% |
| 5 to 9 Unit Apartments | 0 | 0.0% |
| 10 or more Apartments | 0 | 0.0% |
| Mobile Home / Other | 141 | 37.4% |
| Total | 377 | 100.0% |
Housing Structures by Occupancy in Center Hill
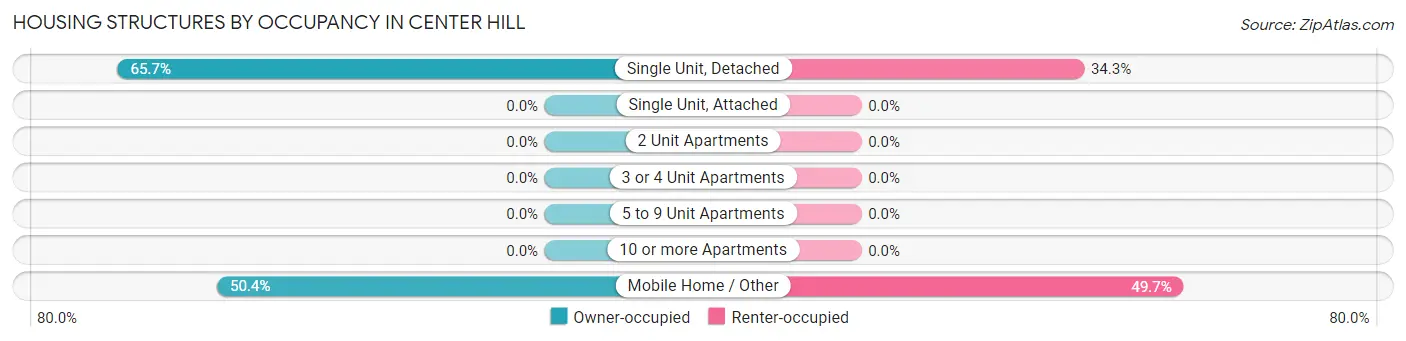
| Structure Type | Owner-occupied | Renter-occupied |
| Single Unit, Detached | 155 (65.7%) | 81 (34.3%) |
| Single Unit, Attached | 0 (0.0%) | 0 (0.0%) |
| 2 Unit Apartments | 0 (0.0%) | 0 (0.0%) |
| 3 or 4 Unit Apartments | 0 (0.0%) | 0 (0.0%) |
| 5 to 9 Unit Apartments | 0 (0.0%) | 0 (0.0%) |
| 10 or more Apartments | 0 (0.0%) | 0 (0.0%) |
| Mobile Home / Other | 71 (50.3%) | 70 (49.6%) |
| Total | 226 (60.0%) | 151 (40.1%) |
Housing Structures by Number of Rooms in Center Hill
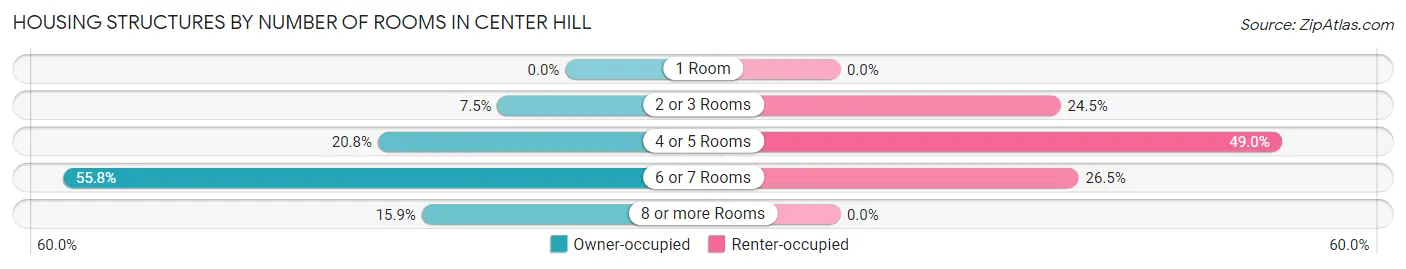
| Number of Rooms | Owner-occupied | Renter-occupied |
| 1 Room | 0 (0.0%) | 0 (0.0%) |
| 2 or 3 Rooms | 17 (7.5%) | 37 (24.5%) |
| 4 or 5 Rooms | 47 (20.8%) | 74 (49.0%) |
| 6 or 7 Rooms | 126 (55.7%) | 40 (26.5%) |
| 8 or more Rooms | 36 (15.9%) | 0 (0.0%) |
| Total | 226 (100.0%) | 151 (100.0%) |
Housing Structure by Heating Type in Center Hill
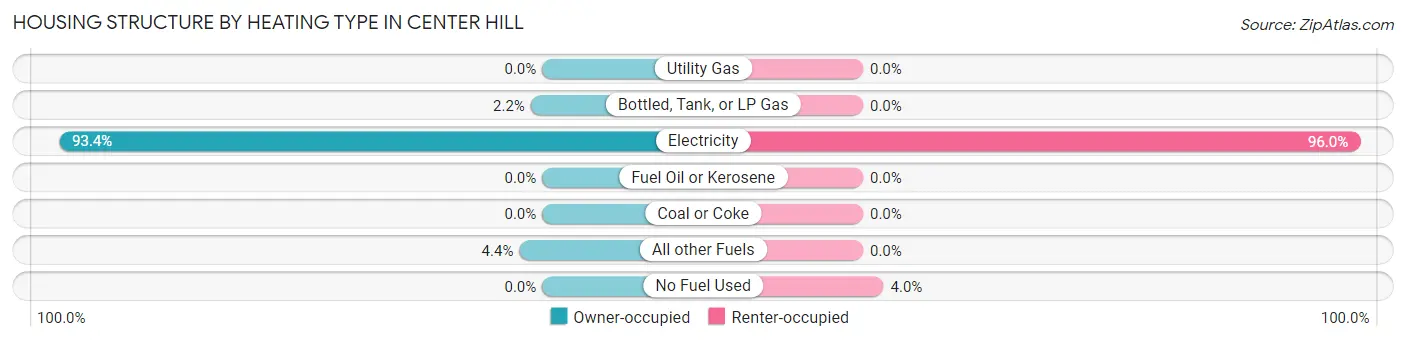
| Heating Type | Owner-occupied | Renter-occupied |
| Utility Gas | 0 (0.0%) | 0 (0.0%) |
| Bottled, Tank, or LP Gas | 5 (2.2%) | 0 (0.0%) |
| Electricity | 211 (93.4%) | 145 (96.0%) |
| Fuel Oil or Kerosene | 0 (0.0%) | 0 (0.0%) |
| Coal or Coke | 0 (0.0%) | 0 (0.0%) |
| All other Fuels | 10 (4.4%) | 0 (0.0%) |
| No Fuel Used | 0 (0.0%) | 6 (4.0%) |
| Total | 226 (100.0%) | 151 (100.0%) |
Household Vehicle Usage in Center Hill
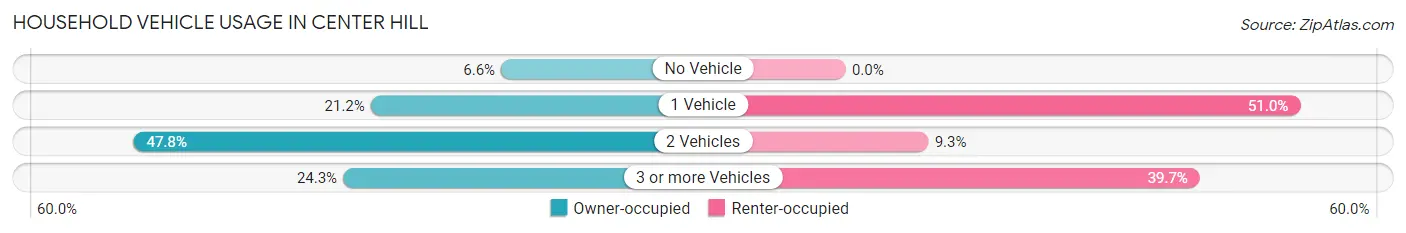
| Vehicles per Household | Owner-occupied | Renter-occupied |
| No Vehicle | 15 (6.6%) | 0 (0.0%) |
| 1 Vehicle | 48 (21.2%) | 77 (51.0%) |
| 2 Vehicles | 108 (47.8%) | 14 (9.3%) |
| 3 or more Vehicles | 55 (24.3%) | 60 (39.7%) |
| Total | 226 (100.0%) | 151 (100.0%) |
Real Estate & Mortgages in Center Hill
Real Estate and Mortgage Overview in Center Hill
| Characteristic | Without Mortgage | With Mortgage |
| Housing Units | 103 | 123 |
| Median Property Value | $55,000 | $214,900 |
| Median Household Income | $41,188 | $8 |
| Monthly Housing Costs | $358 | $0 |
| Real Estate Taxes | $380 | $3 |
Property Value by Mortgage Status in Center Hill
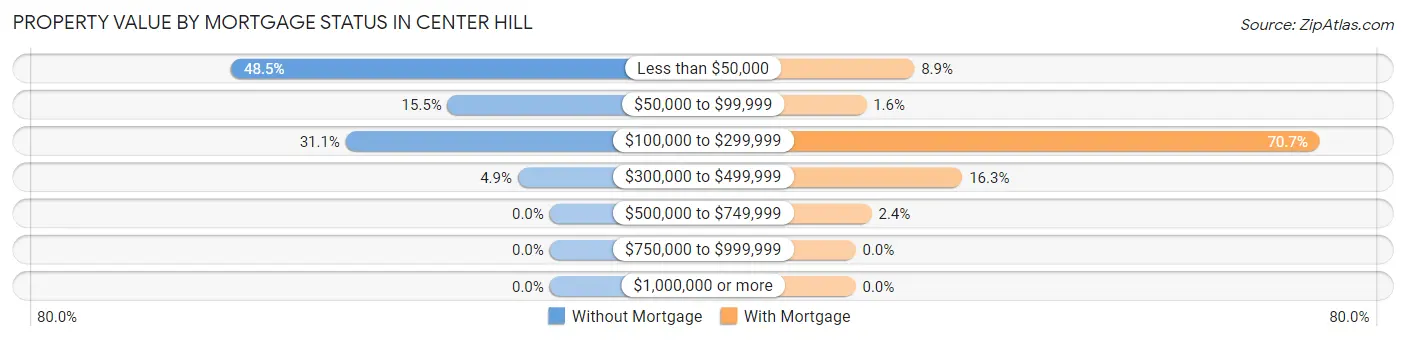
| Property Value | Without Mortgage | With Mortgage |
| Less than $50,000 | 50 (48.5%) | 11 (8.9%) |
| $50,000 to $99,999 | 16 (15.5%) | 2 (1.6%) |
| $100,000 to $299,999 | 32 (31.1%) | 87 (70.7%) |
| $300,000 to $499,999 | 5 (4.9%) | 20 (16.3%) |
| $500,000 to $749,999 | 0 (0.0%) | 3 (2.4%) |
| $750,000 to $999,999 | 0 (0.0%) | 0 (0.0%) |
| $1,000,000 or more | 0 (0.0%) | 0 (0.0%) |
| Total | 103 (100.0%) | 123 (100.0%) |
Household Income by Mortgage Status in Center Hill
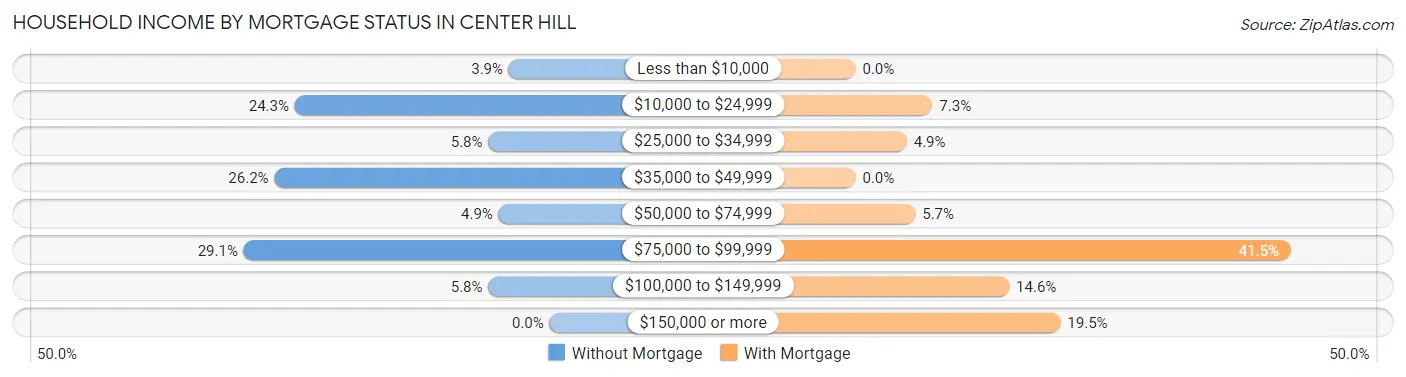
| Household Income | Without Mortgage | With Mortgage |
| Less than $10,000 | 4 (3.9%) | 0 (0.0%) |
| $10,000 to $24,999 | 25 (24.3%) | 9 (7.3%) |
| $25,000 to $34,999 | 6 (5.8%) | 6 (4.9%) |
| $35,000 to $49,999 | 27 (26.2%) | 0 (0.0%) |
| $50,000 to $74,999 | 5 (4.9%) | 7 (5.7%) |
| $75,000 to $99,999 | 30 (29.1%) | 51 (41.5%) |
| $100,000 to $149,999 | 6 (5.8%) | 18 (14.6%) |
| $150,000 or more | 0 (0.0%) | 24 (19.5%) |
| Total | 103 (100.0%) | 123 (100.0%) |
Property Value to Household Income Ratio in Center Hill
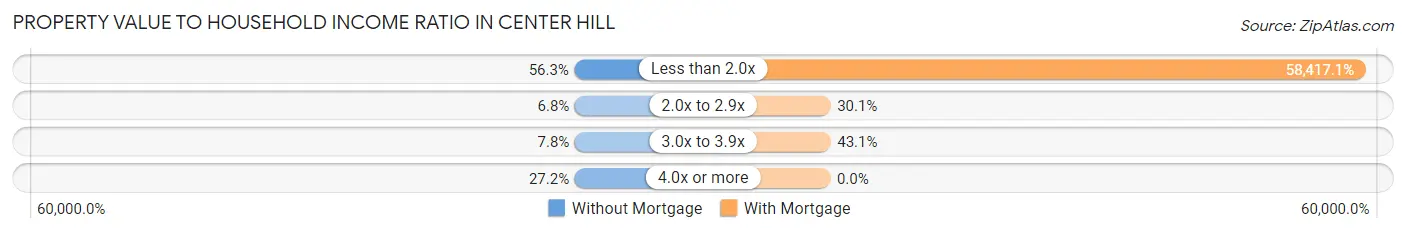
| Value-to-Income Ratio | Without Mortgage | With Mortgage |
| Less than 2.0x | 58 (56.3%) | 71,853 (58,417.1%) |
| 2.0x to 2.9x | 7 (6.8%) | 37 (30.1%) |
| 3.0x to 3.9x | 8 (7.8%) | 53 (43.1%) |
| 4.0x or more | 28 (27.2%) | 0 (0.0%) |
| Total | 103 (100.0%) | 123 (100.0%) |
Real Estate Taxes by Mortgage Status in Center Hill
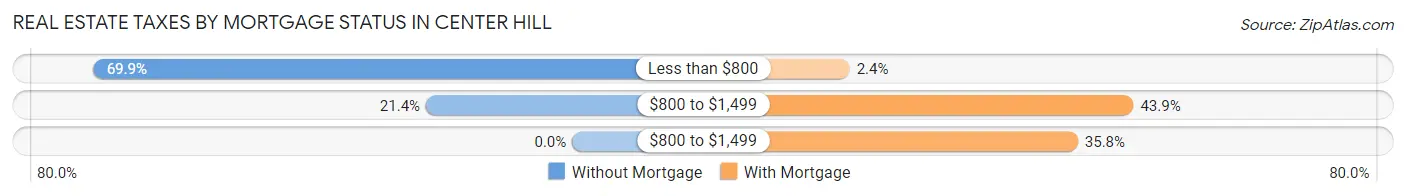
| Property Taxes | Without Mortgage | With Mortgage |
| Less than $800 | 72 (69.9%) | 3 (2.4%) |
| $800 to $1,499 | 22 (21.4%) | 54 (43.9%) |
| $800 to $1,499 | 0 (0.0%) | 44 (35.8%) |
| Total | 103 (100.0%) | 123 (100.0%) |
Health & Disability in Center Hill
Health Insurance Coverage by Age in Center Hill
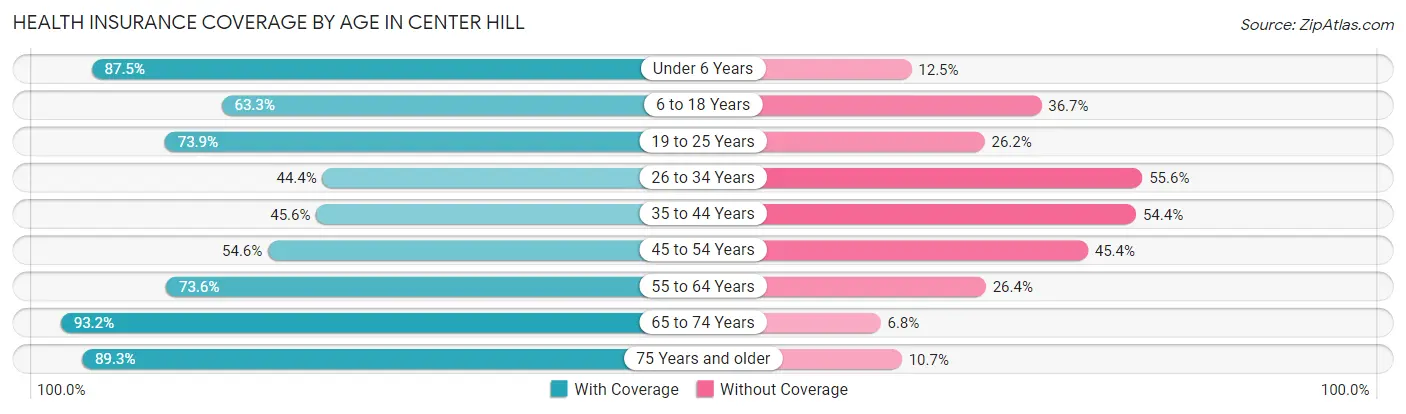
| Age Bracket | With Coverage | Without Coverage |
| Under 6 Years | 63 (87.5%) | 9 (12.5%) |
| 6 to 18 Years | 124 (63.3%) | 72 (36.7%) |
| 19 to 25 Years | 48 (73.9%) | 17 (26.2%) |
| 26 to 34 Years | 40 (44.4%) | 50 (55.6%) |
| 35 to 44 Years | 104 (45.6%) | 124 (54.4%) |
| 45 to 54 Years | 101 (54.6%) | 84 (45.4%) |
| 55 to 64 Years | 120 (73.6%) | 43 (26.4%) |
| 65 to 74 Years | 69 (93.2%) | 5 (6.8%) |
| 75 Years and older | 50 (89.3%) | 6 (10.7%) |
| Total | 719 (63.7%) | 410 (36.3%) |
Health Insurance Coverage by Citizenship Status in Center Hill
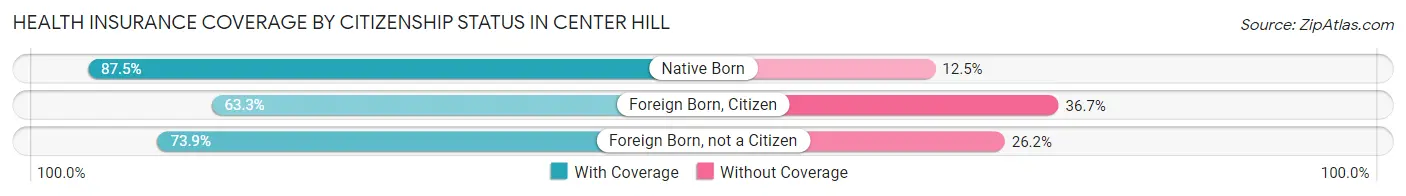
| Citizenship Status | With Coverage | Without Coverage |
| Native Born | 63 (87.5%) | 9 (12.5%) |
| Foreign Born, Citizen | 124 (63.3%) | 72 (36.7%) |
| Foreign Born, not a Citizen | 48 (73.9%) | 17 (26.2%) |
Health Insurance Coverage by Household Income in Center Hill
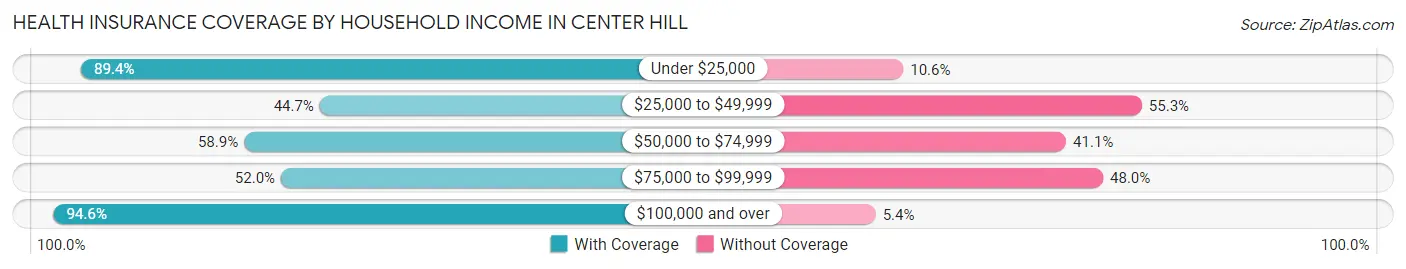
| Household Income | With Coverage | Without Coverage |
| Under $25,000 | 93 (89.4%) | 11 (10.6%) |
| $25,000 to $49,999 | 114 (44.7%) | 141 (55.3%) |
| $50,000 to $74,999 | 215 (58.9%) | 150 (41.1%) |
| $75,000 to $99,999 | 105 (52.0%) | 97 (48.0%) |
| $100,000 and over | 192 (94.6%) | 11 (5.4%) |
Public vs Private Health Insurance Coverage by Age in Center Hill
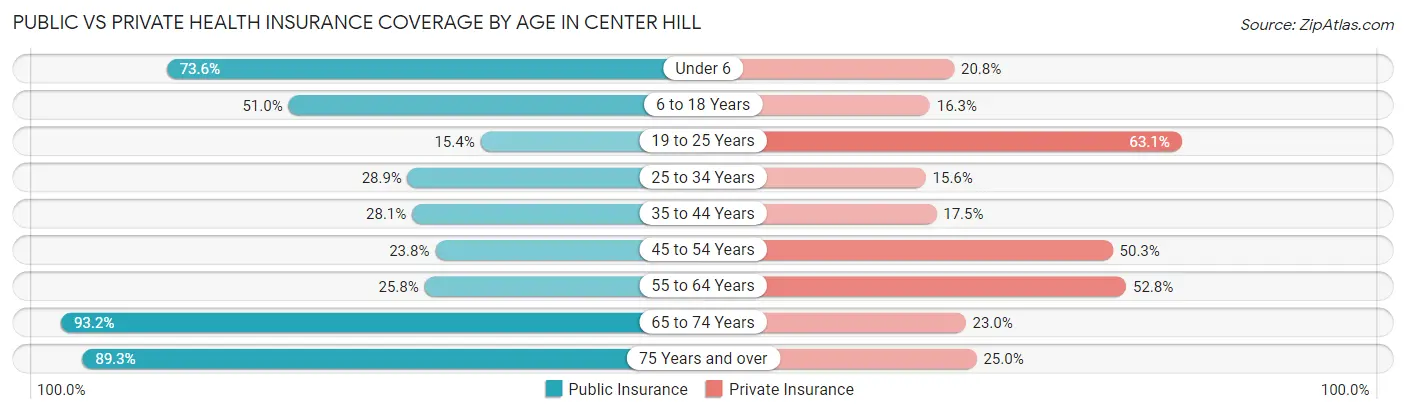
| Age Bracket | Public Insurance | Private Insurance |
| Under 6 | 53 (73.6%) | 15 (20.8%) |
| 6 to 18 Years | 100 (51.0%) | 32 (16.3%) |
| 19 to 25 Years | 10 (15.4%) | 41 (63.1%) |
| 25 to 34 Years | 26 (28.9%) | 14 (15.6%) |
| 35 to 44 Years | 64 (28.1%) | 40 (17.5%) |
| 45 to 54 Years | 44 (23.8%) | 93 (50.3%) |
| 55 to 64 Years | 42 (25.8%) | 86 (52.8%) |
| 65 to 74 Years | 69 (93.2%) | 17 (23.0%) |
| 75 Years and over | 50 (89.3%) | 14 (25.0%) |
| Total | 458 (40.6%) | 352 (31.2%) |
Disability Status by Sex by Age in Center Hill
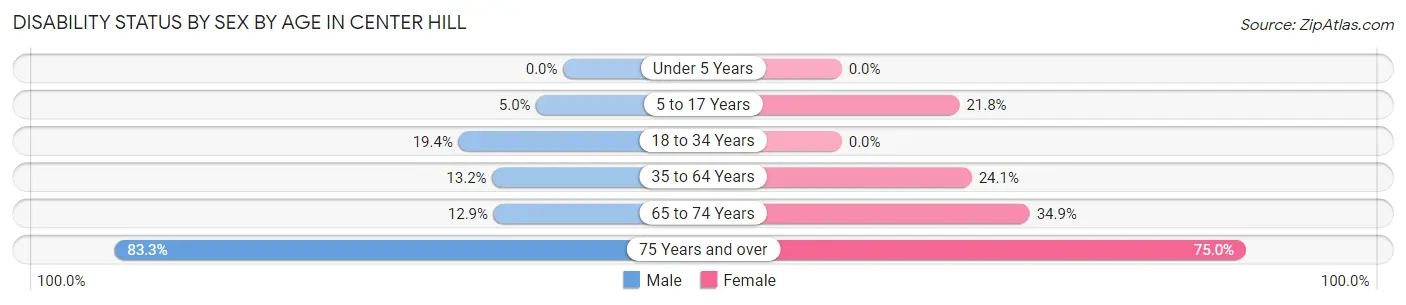
| Age Bracket | Male | Female |
| Under 5 Years | 0 (0.0%) | 0 (0.0%) |
| 5 to 17 Years | 5 (5.0%) | 19 (21.8%) |
| 18 to 34 Years | 20 (19.4%) | 0 (0.0%) |
| 35 to 64 Years | 42 (13.2%) | 62 (24.1%) |
| 65 to 74 Years | 4 (12.9%) | 15 (34.9%) |
| 75 Years and over | 20 (83.3%) | 24 (75.0%) |
Disability Class by Sex by Age in Center Hill
Disability Class: Hearing Difficulty
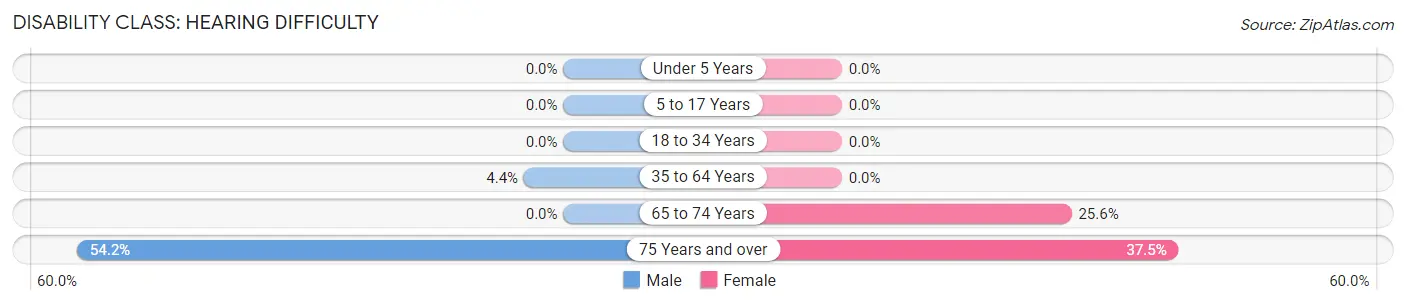
| Age Bracket | Male | Female |
| Under 5 Years | 0 (0.0%) | 0 (0.0%) |
| 5 to 17 Years | 0 (0.0%) | 0 (0.0%) |
| 18 to 34 Years | 0 (0.0%) | 0 (0.0%) |
| 35 to 64 Years | 14 (4.4%) | 0 (0.0%) |
| 65 to 74 Years | 0 (0.0%) | 11 (25.6%) |
| 75 Years and over | 13 (54.2%) | 12 (37.5%) |
Disability Class: Vision Difficulty
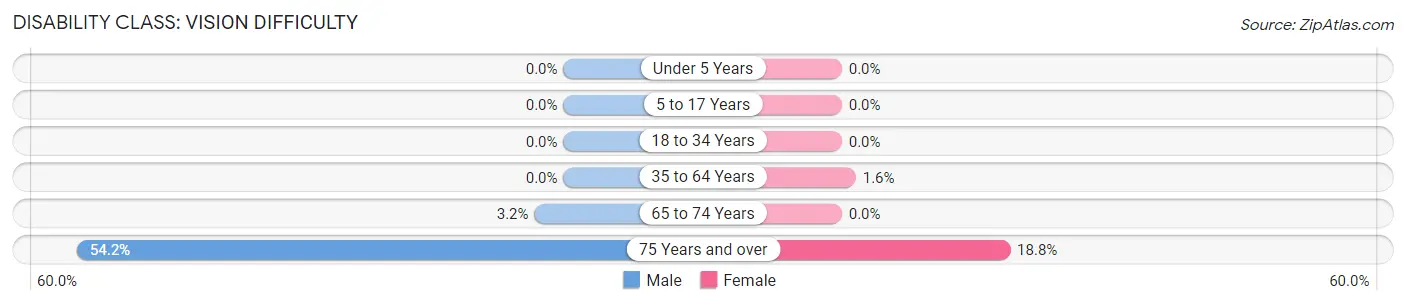
| Age Bracket | Male | Female |
| Under 5 Years | 0 (0.0%) | 0 (0.0%) |
| 5 to 17 Years | 0 (0.0%) | 0 (0.0%) |
| 18 to 34 Years | 0 (0.0%) | 0 (0.0%) |
| 35 to 64 Years | 0 (0.0%) | 4 (1.6%) |
| 65 to 74 Years | 1 (3.2%) | 0 (0.0%) |
| 75 Years and over | 13 (54.2%) | 6 (18.8%) |
Disability Class: Cognitive Difficulty
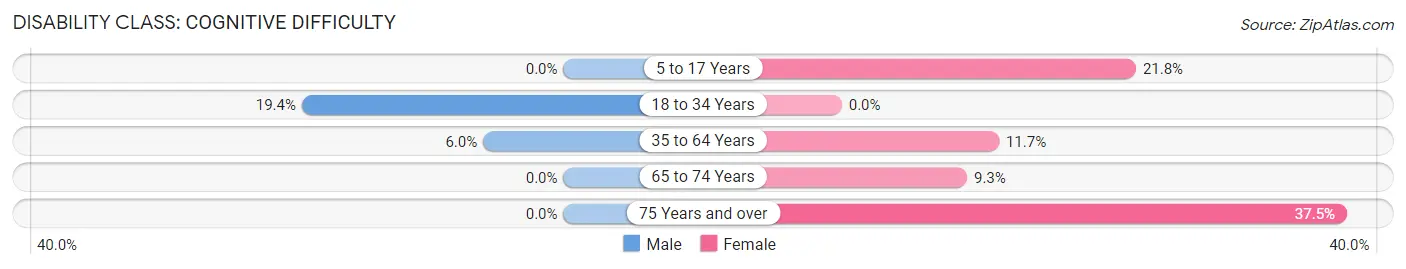
| Age Bracket | Male | Female |
| 5 to 17 Years | 0 (0.0%) | 19 (21.8%) |
| 18 to 34 Years | 20 (19.4%) | 0 (0.0%) |
| 35 to 64 Years | 19 (6.0%) | 30 (11.7%) |
| 65 to 74 Years | 0 (0.0%) | 4 (9.3%) |
| 75 Years and over | 0 (0.0%) | 12 (37.5%) |
Disability Class: Ambulatory Difficulty
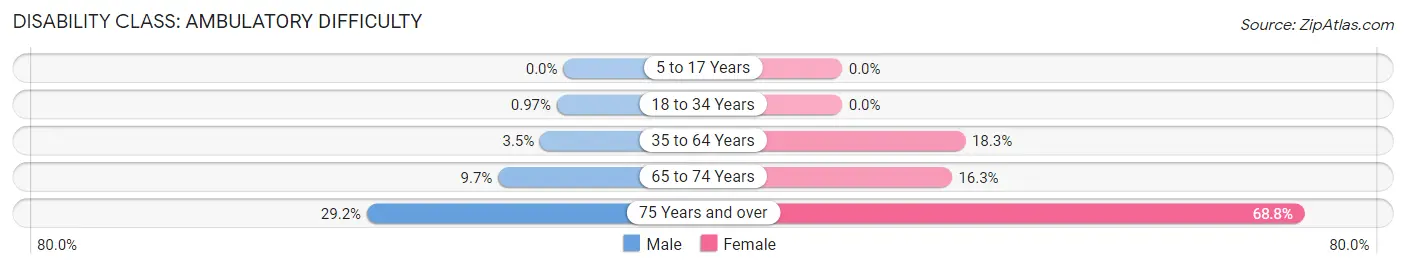
| Age Bracket | Male | Female |
| 5 to 17 Years | 0 (0.0%) | 0 (0.0%) |
| 18 to 34 Years | 1 (1.0%) | 0 (0.0%) |
| 35 to 64 Years | 11 (3.5%) | 47 (18.3%) |
| 65 to 74 Years | 3 (9.7%) | 7 (16.3%) |
| 75 Years and over | 7 (29.2%) | 22 (68.8%) |
Disability Class: Self-Care Difficulty
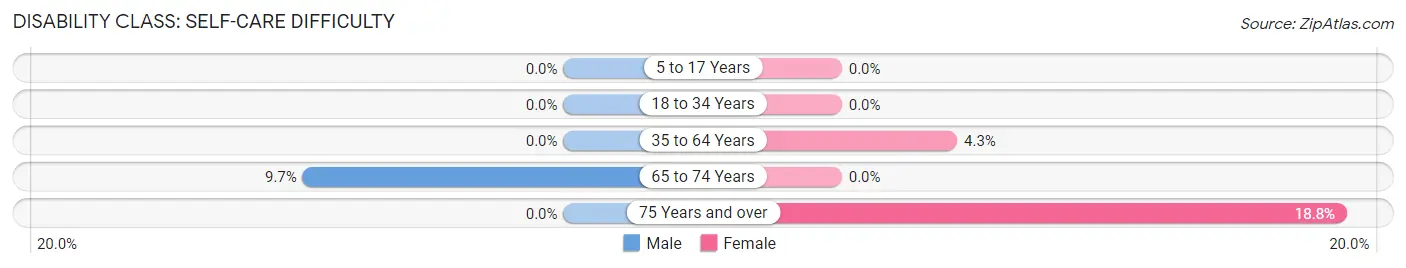
| Age Bracket | Male | Female |
| 5 to 17 Years | 0 (0.0%) | 0 (0.0%) |
| 18 to 34 Years | 0 (0.0%) | 0 (0.0%) |
| 35 to 64 Years | 0 (0.0%) | 11 (4.3%) |
| 65 to 74 Years | 3 (9.7%) | 0 (0.0%) |
| 75 Years and over | 0 (0.0%) | 6 (18.8%) |
Technology Access in Center Hill
Computing Device Access in Center Hill
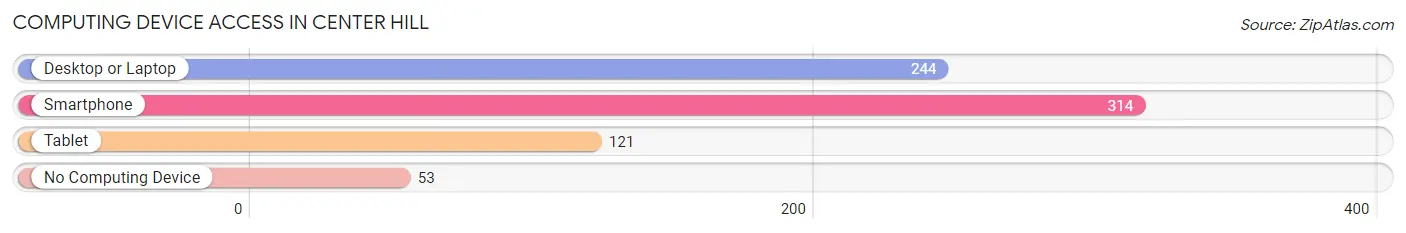
| Device Type | # Households | % Households |
| Desktop or Laptop | 244 | 64.7% |
| Smartphone | 314 | 83.3% |
| Tablet | 121 | 32.1% |
| No Computing Device | 53 | 14.1% |
| Total | 377 | 100.0% |
Internet Access in Center Hill
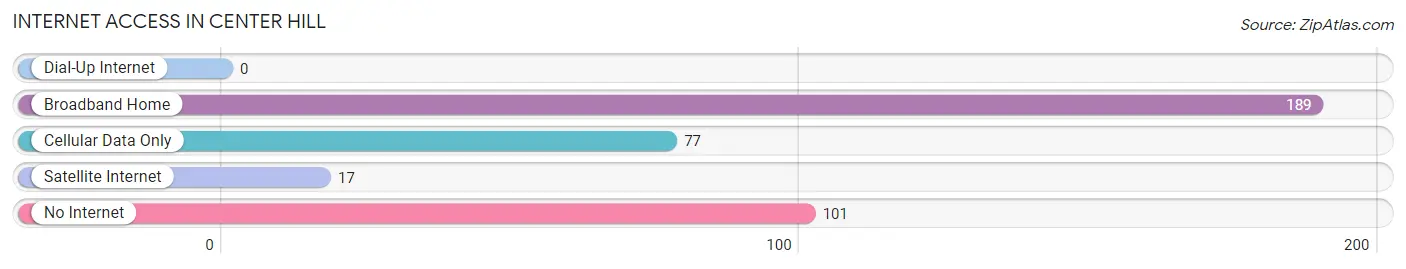
| Internet Type | # Households | % Households |
| Dial-Up Internet | 0 | 0.0% |
| Broadband Home | 189 | 50.1% |
| Cellular Data Only | 77 | 20.4% |
| Satellite Internet | 17 | 4.5% |
| No Internet | 101 | 26.8% |
| Total | 377 | 100.0% |
Center Hill Summary
History
The small town of Center Hill, Florida is located in Sumter County, in the central part of the state. It is situated on the banks of the Withlacoochee River, and is part of the Lake Panasoffkee area. The town was founded in 1883 by a group of settlers from Georgia, who were looking for a place to settle and start a new life. The town was named after the nearby hill, which was the highest point in the area.
The town was originally a farming community, and the main crops grown were cotton, corn, and peanuts. The town also had a sawmill, which provided lumber for the local area. In the early 1900s, the town began to grow and develop, and by the 1920s, it had become a thriving community.
The town was also home to a number of businesses, including a general store, a post office, a bank, and a hotel. The town also had a school, which was built in the late 1800s. The school was later replaced by a larger school in the 1950s.
In the late 1950s, the town began to decline, as many of the businesses closed and the population began to move away. The town was eventually abandoned in the 1970s, and the buildings were left to decay.
In the late 1990s, the town was rediscovered by a group of local residents, who began to restore the buildings and revitalize the town. Today, Center Hill is a small, rural community with a population of just over 500 people.
Geography
Center Hill is located in Sumter County, in the central part of the state of Florida. It is situated on the banks of the Withlacoochee River, and is part of the Lake Panasoffkee area. The town is located about 25 miles east of Ocala, and about 50 miles northwest of Orlando.
The town is located in a flat, low-lying area, with an elevation of just over 100 feet. The area is mostly covered in pine and oak forests, and is home to a variety of wildlife, including deer, wild turkeys, and bald eagles.
Economy
The economy of Center Hill is largely based on agriculture and tourism. The town is home to a number of farms, which produce a variety of crops, including corn, cotton, and peanuts. The town is also home to a number of small businesses, including a general store, a post office, and a bank.
The town is also a popular tourist destination, as it is located near a number of popular attractions, including the Withlacoochee State Forest, the Silver Springs State Park, and the Rainbow Springs State Park. The town is also home to a number of festivals and events, including the annual Center Hill Festival, which is held every year in October.
Demographics
As of the 2010 census, the population of Center Hill was 517 people. The racial makeup of the town was 94.2% White, 2.3% African American, 0.4% Native American, 0.4% Asian, 0.2% from other races, and 2.5% from two or more races. Hispanic or Latino of any race were 1.2% of the population.
The median income for a household in the town was $31,250, and the median income for a family was $37,500. The per capita income for the town was $15,945. About 15.2% of families and 17.2% of the population were below the poverty line, including 25.0% of those under age 18 and 8.3% of those age 65 or over.
Common Questions
What is Per Capita Income in Center Hill?
Per Capita income in Center Hill is $21,600.
What is the Median Family Income in Center Hill?
Median Family Income in Center Hill is $58,264.
What is the Median Household income in Center Hill?
Median Household Income in Center Hill is $59,514.
What is Income or Wage Gap in Center Hill?
Income or Wage Gap in Center Hill is 33.0%.
Women in Center Hill earn 67.0 cents for every dollar earned by a man.
What is Inequality or Gini Index in Center Hill?
Inequality or Gini Index in Center Hill is 0.35.
What is the Total Population of Center Hill?
Total Population of Center Hill is 1,129.
What is the Total Male Population of Center Hill?
Total Male Population of Center Hill is 618.
What is the Total Female Population of Center Hill?
Total Female Population of Center Hill is 511.
What is the Ratio of Males per 100 Females in Center Hill?
There are 120.94 Males per 100 Females in Center Hill.
What is the Ratio of Females per 100 Males in Center Hill?
There are 82.69 Females per 100 Males in Center Hill.
What is the Median Population Age in Center Hill?
Median Population Age in Center Hill is 40.0 Years.
What is the Average Family Size in Center Hill
Average Family Size in Center Hill is 3.3 People.
What is the Average Household Size in Center Hill
Average Household Size in Center Hill is 3.0 People.
How Large is the Labor Force in Center Hill?
There are 492 People in the Labor Forcein in Center Hill.
What is the Percentage of People in the Labor Force in Center Hill?
54.7% of People are in the Labor Force in Center Hill.
What is the Unemployment Rate in Center Hill?
Unemployment Rate in Center Hill is 7.3%.