Bushnell, FL Map & Demographics
Bushnell Map
Bushnell Overview
$22,621
PER CAPITA INCOME
$47,917
AVG FAMILY INCOME
$41,700
AVG HOUSEHOLD INCOME
43.8%
WAGE / INCOME GAP [ % ]
56.2¢/ $1
WAGE / INCOME GAP [ $ ]
0.43
INEQUALITY / GINI INDEX
3,081
TOTAL POPULATION
1,630
MALE POPULATION
1,451
FEMALE POPULATION
112.34
MALES / 100 FEMALES
89.02
FEMALES / 100 MALES
41.7
MEDIAN AGE
3.0
AVG FAMILY SIZE
2.2
AVG HOUSEHOLD SIZE
917
LABOR FORCE [ PEOPLE ]
37.2%
PERCENT IN LABOR FORCE
Bushnell Zip Codes
Bushnell Area Codes
Income in Bushnell
Income Overview in Bushnell
Per Capita Income in Bushnell is $22,621, while median incomes of families and households are $47,917 and $41,700 respectively.
| Characteristic | Number | Measure |
| Per Capita Income | 3,081 | $22,621 |
| Median Family Income | 616 | $47,917 |
| Mean Family Income | 616 | $61,525 |
| Median Household Income | 1,182 | $41,700 |
| Mean Household Income | 1,182 | $52,273 |
| Income Deficit | 616 | $0 |
| Wage / Income Gap (%) | 3,081 | 43.83% |
| Wage / Income Gap ($) | 3,081 | 56.17¢ per $1 |
| Gini / Inequality Index | 3,081 | 0.43 |
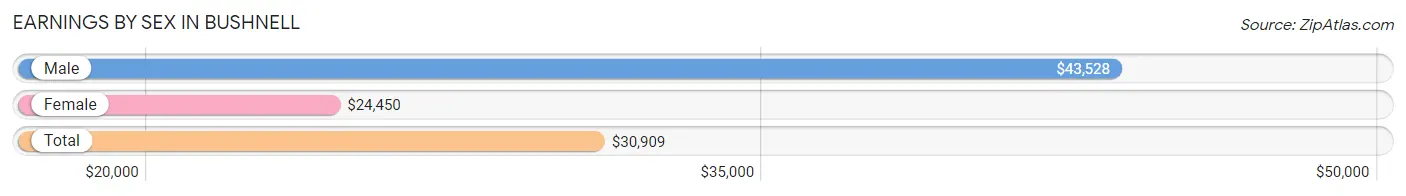
Earnings by Sex in Bushnell
Average Earnings in Bushnell are $30,909, $43,528 for men and $24,450 for women, a difference of 43.8%.
| Sex | Number | Average Earnings |
| Male | 541 (50.7%) | $43,528 |
| Female | 527 (49.3%) | $24,450 |
| Total | 1,068 (100.0%) | $30,909 |
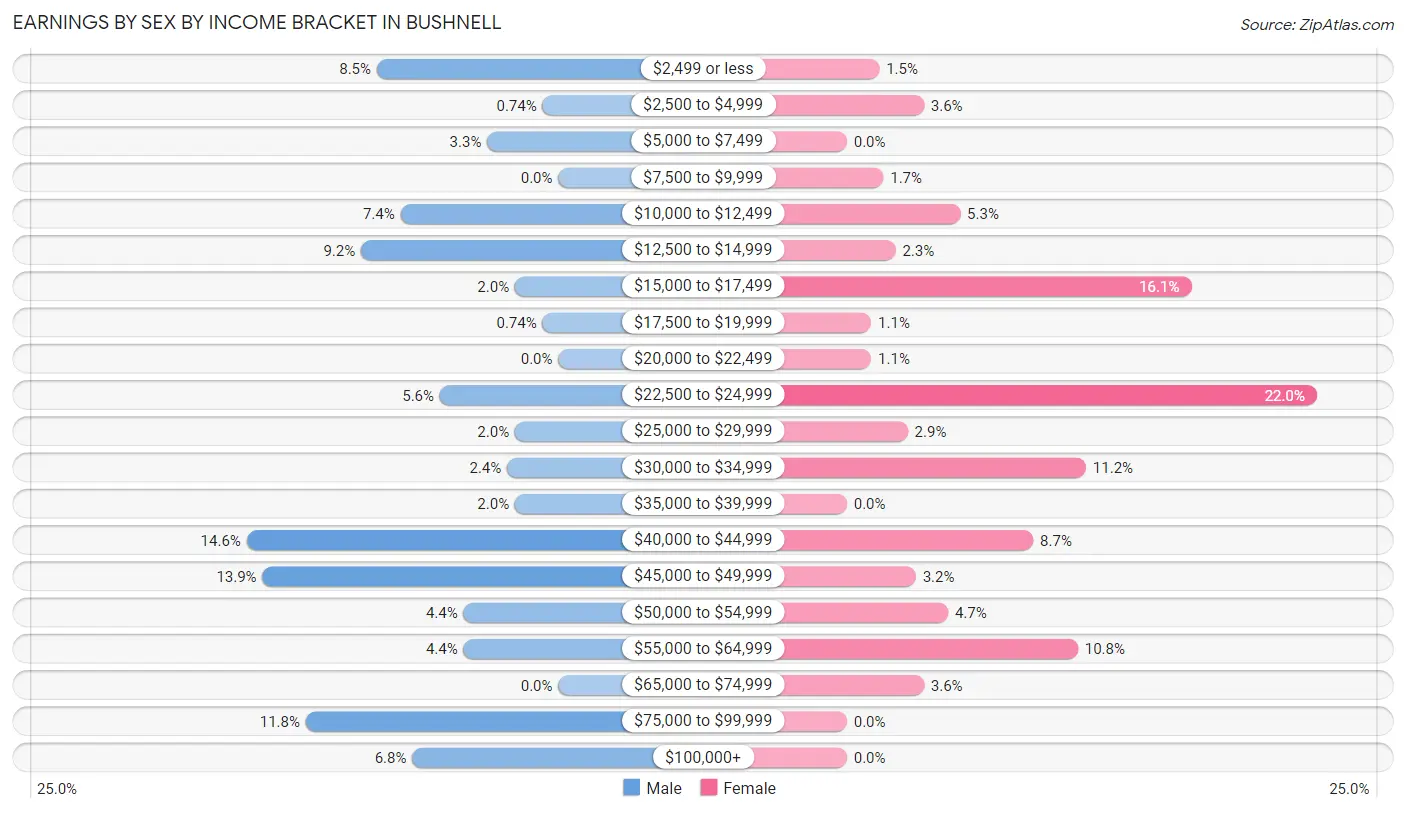
Earnings by Sex by Income Bracket in Bushnell
The most common earnings brackets in Bushnell are $40,000 to $44,999 for men (79 | 14.6%) and $22,500 to $24,999 for women (116 | 22.0%).
| Income | Male | Female |
| $2,499 or less | 46 (8.5%) | 8 (1.5%) |
| $2,500 to $4,999 | 4 (0.7%) | 19 (3.6%) |
| $5,000 to $7,499 | 18 (3.3%) | 0 (0.0%) |
| $7,500 to $9,999 | 0 (0.0%) | 9 (1.7%) |
| $10,000 to $12,499 | 40 (7.4%) | 28 (5.3%) |
| $12,500 to $14,999 | 50 (9.2%) | 12 (2.3%) |
| $15,000 to $17,499 | 11 (2.0%) | 85 (16.1%) |
| $17,500 to $19,999 | 4 (0.7%) | 6 (1.1%) |
| $20,000 to $22,499 | 0 (0.0%) | 6 (1.1%) |
| $22,500 to $24,999 | 30 (5.6%) | 116 (22.0%) |
| $25,000 to $29,999 | 11 (2.0%) | 15 (2.9%) |
| $30,000 to $34,999 | 13 (2.4%) | 59 (11.2%) |
| $35,000 to $39,999 | 11 (2.0%) | 0 (0.0%) |
| $40,000 to $44,999 | 79 (14.6%) | 46 (8.7%) |
| $45,000 to $49,999 | 75 (13.9%) | 17 (3.2%) |
| $50,000 to $54,999 | 24 (4.4%) | 25 (4.7%) |
| $55,000 to $64,999 | 24 (4.4%) | 57 (10.8%) |
| $65,000 to $74,999 | 0 (0.0%) | 19 (3.6%) |
| $75,000 to $99,999 | 64 (11.8%) | 0 (0.0%) |
| $100,000+ | 37 (6.8%) | 0 (0.0%) |
| Total | 541 (100.0%) | 527 (100.0%) |
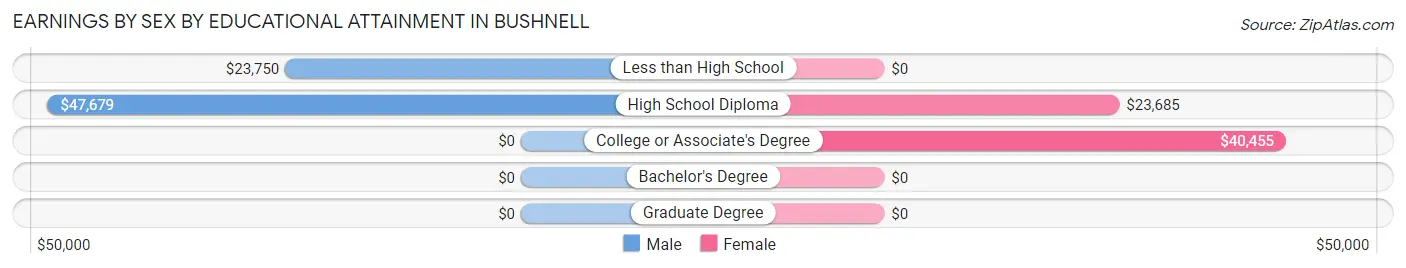
Earnings by Sex by Educational Attainment in Bushnell
Average earnings in Bushnell are $45,265 for men and $24,504 for women, a difference of 45.9%. Men with an educational attainment of high school diploma enjoy the highest average annual earnings of $47,679, while those with less than high school education earn the least with $23,750. Women with an educational attainment of college or associate's degree earn the most with the average annual earnings of $40,455, while those with high school diploma education have the smallest earnings of $23,685.
| Educational Attainment | Male Income | Female Income |
| Less than High School | $23,750 | $0 |
| High School Diploma | $47,679 | $23,685 |
| College or Associate's Degree | - | - |
| Bachelor's Degree | - | - |
| Graduate Degree | - | - |
| Total | $45,265 | $24,504 |
Family Income in Bushnell
Family Income Brackets in Bushnell
According to the Bushnell family income data, there are 162 families falling into the $25,000 to $34,999 income range, which is the most common income bracket and makes up 26.3% of all families.
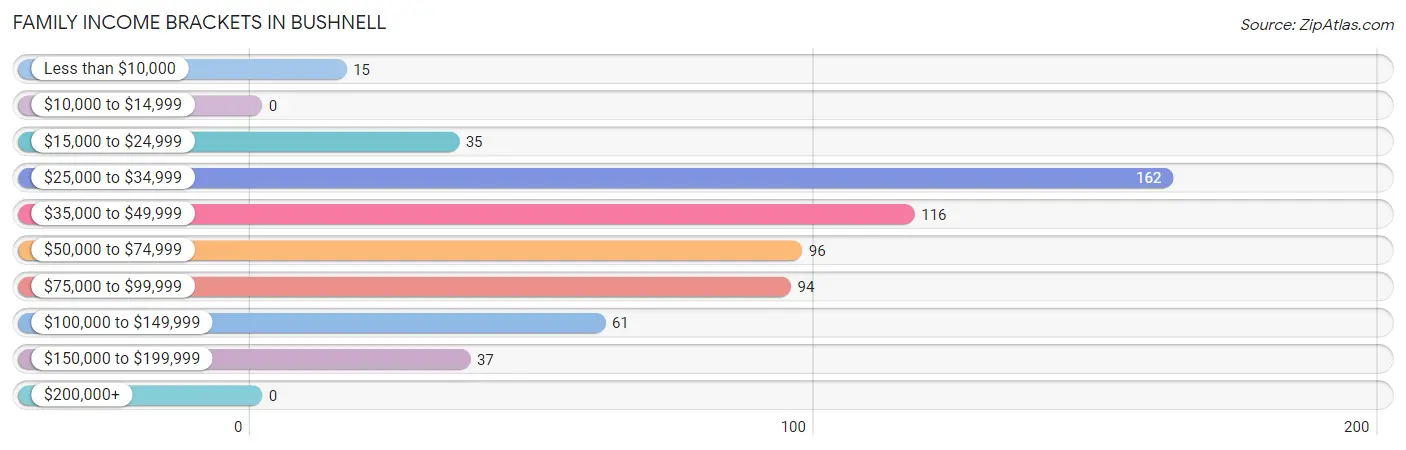
| Income Bracket | # Families | % Families |
| Less than $10,000 | 15 | 2.4% |
| $10,000 to $14,999 | 0 | 0.0% |
| $15,000 to $24,999 | 35 | 5.7% |
| $25,000 to $34,999 | 162 | 26.3% |
| $35,000 to $49,999 | 116 | 18.8% |
| $50,000 to $74,999 | 96 | 15.6% |
| $75,000 to $99,999 | 94 | 15.3% |
| $100,000 to $149,999 | 61 | 9.9% |
| $150,000 to $199,999 | 37 | 6.0% |
| $200,000+ | 0 | 0.0% |
Family Income by Famaliy Size in Bushnell
4-person families (54 | 8.8%) account for the highest median family income in Bushnell with $68,462 per family, while 2-person families (371 | 60.2%) have the highest median income of $23,062 per family member.
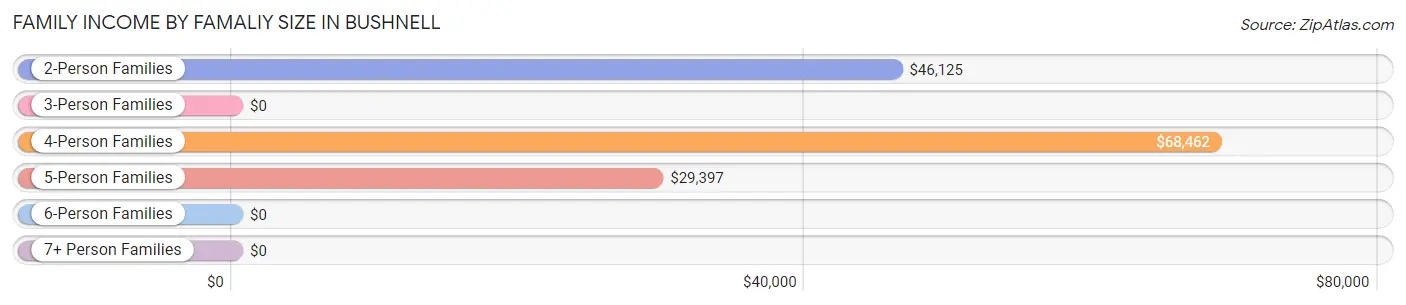
| Income Bracket | # Families | Median Income |
| 2-Person Families | 371 (60.2%) | $46,125 |
| 3-Person Families | 38 (6.2%) | $0 |
| 4-Person Families | 54 (8.8%) | $68,462 |
| 5-Person Families | 129 (20.9%) | $29,397 |
| 6-Person Families | 24 (3.9%) | $0 |
| 7+ Person Families | 0 (0.0%) | $0 |
| Total | 616 (100.0%) | $47,917 |
Family Income by Number of Earners in Bushnell
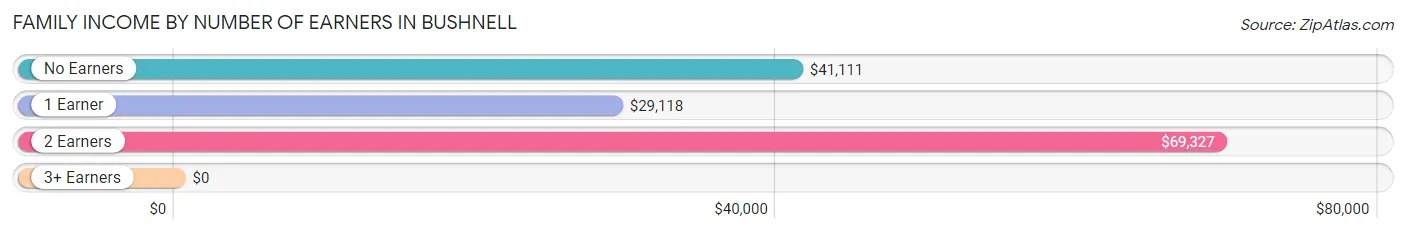
| Number of Earners | # Families | Median Income |
| No Earners | 246 (39.9%) | $41,111 |
| 1 Earner | 206 (33.4%) | $29,118 |
| 2 Earners | 157 (25.5%) | $69,327 |
| 3+ Earners | 7 (1.1%) | $0 |
| Total | 616 (100.0%) | $47,917 |
Household Income in Bushnell
Household Income Brackets in Bushnell
With 228 households falling in the category, the $50,000 to $74,999 income range is the most frequent in Bushnell, accounting for 19.3% of all households. In contrast, only 8 households (0.7%) fall into the $200,000+ income bracket, making it the least populous group.
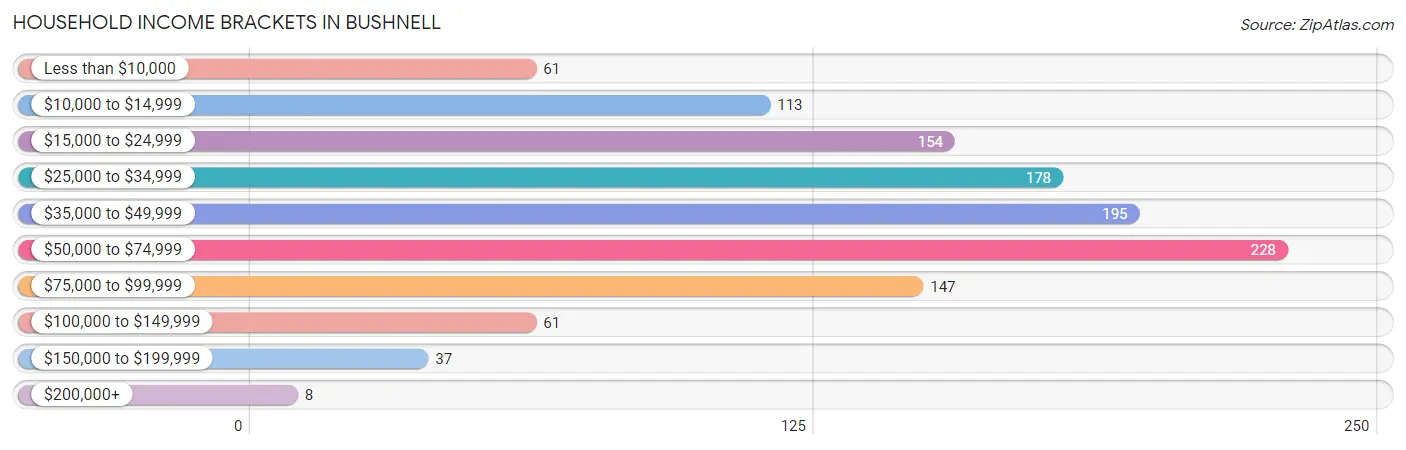
| Income Bracket | # Households | % Households |
| Less than $10,000 | 61 | 5.2% |
| $10,000 to $14,999 | 113 | 9.6% |
| $15,000 to $24,999 | 154 | 13.0% |
| $25,000 to $34,999 | 178 | 15.1% |
| $35,000 to $49,999 | 195 | 16.5% |
| $50,000 to $74,999 | 228 | 19.3% |
| $75,000 to $99,999 | 147 | 12.4% |
| $100,000 to $149,999 | 61 | 5.2% |
| $150,000 to $199,999 | 37 | 3.1% |
| $200,000+ | 8 | 0.7% |
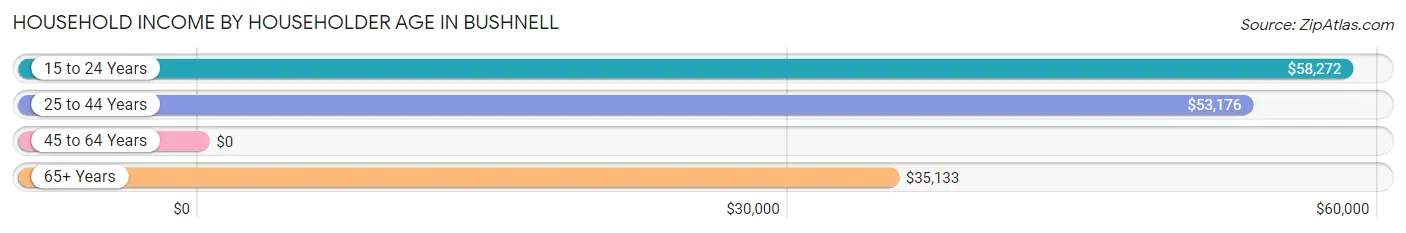
Household Income by Householder Age in Bushnell
The median household income in Bushnell is $41,700, with the highest median household income of $58,272 found in the 15 to 24 years age bracket for the primary householder. A total of 77 households (6.5%) fall into this category. Meanwhile, the 45 to 64 years age bracket for the primary householder has the lowest median household income of $0, with 292 households (24.7%) in this group.
| Income Bracket | # Households | Median Income |
| 15 to 24 Years | 77 (6.5%) | $58,272 |
| 25 to 44 Years | 312 (26.4%) | $53,176 |
| 45 to 64 Years | 292 (24.7%) | $0 |
| 65+ Years | 501 (42.4%) | $35,133 |
| Total | 1,182 (100.0%) | $41,700 |
Poverty in Bushnell
Income Below Poverty by Sex and Age in Bushnell
With 33.8% poverty level for males and 23.5% for females among the residents of Bushnell, 6 to 11 year old males and under 5 year old females are the most vulnerable to poverty, with 188 males (79.0%) and 78 females (62.9%) in their respective age groups living below the poverty level.
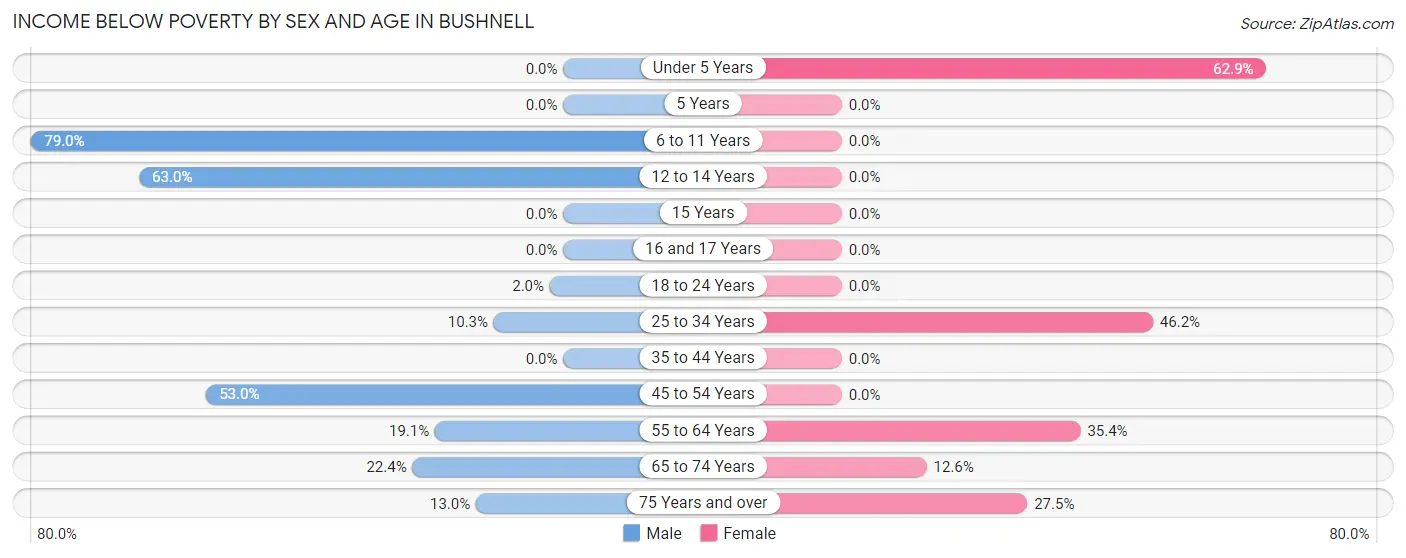
| Age Bracket | Male | Female |
| Under 5 Years | 0 (0.0%) | 78 (62.9%) |
| 5 Years | 0 (0.0%) | 0 (0.0%) |
| 6 to 11 Years | 188 (79.0%) | 0 (0.0%) |
| 12 to 14 Years | 97 (63.0%) | 0 (0.0%) |
| 15 Years | 0 (0.0%) | 0 (0.0%) |
| 16 and 17 Years | 0 (0.0%) | 0 (0.0%) |
| 18 to 24 Years | 3 (2.0%) | 0 (0.0%) |
| 25 to 34 Years | 13 (10.3%) | 85 (46.2%) |
| 35 to 44 Years | 0 (0.0%) | 0 (0.0%) |
| 45 to 54 Years | 70 (53.0%) | 0 (0.0%) |
| 55 to 64 Years | 16 (19.1%) | 73 (35.4%) |
| 65 to 74 Years | 28 (22.4%) | 34 (12.6%) |
| 75 Years and over | 28 (13.0%) | 46 (27.5%) |
| Total | 443 (33.8%) | 316 (23.5%) |
Income Above Poverty by Sex and Age in Bushnell
According to the poverty statistics in Bushnell, males aged under 5 years and females aged 6 to 11 years are the age groups that are most secure financially, with 100.0% of males and 100.0% of females in these age groups living above the poverty line.
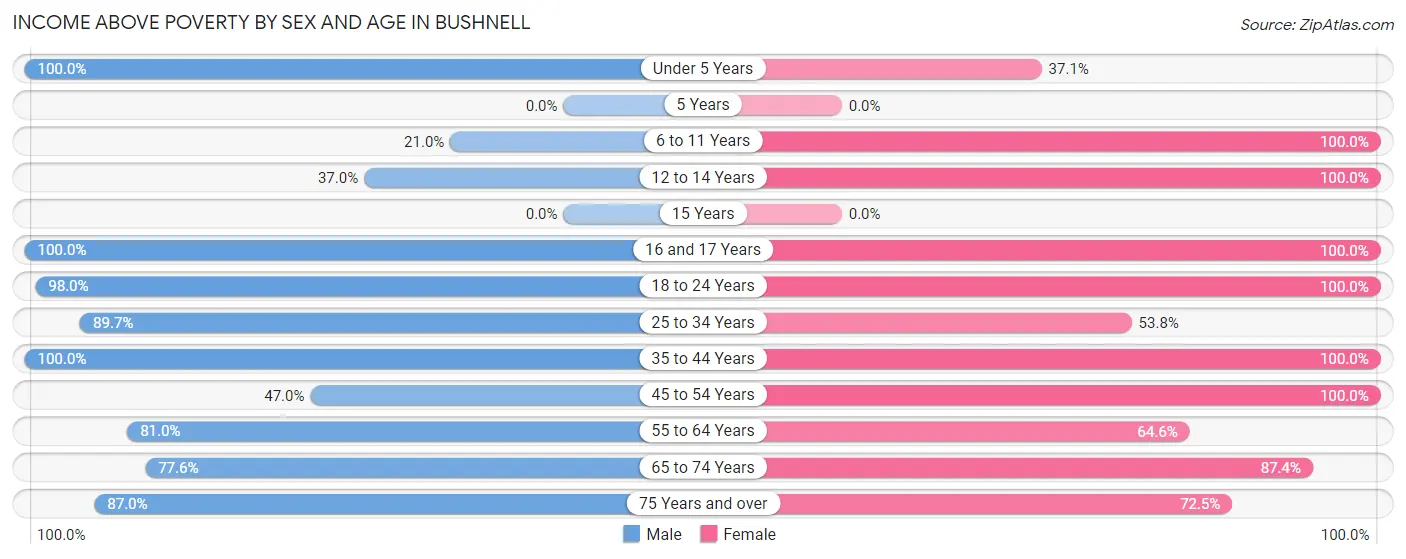
| Age Bracket | Male | Female |
| Under 5 Years | 27 (100.0%) | 46 (37.1%) |
| 5 Years | 0 (0.0%) | 0 (0.0%) |
| 6 to 11 Years | 50 (21.0%) | 39 (100.0%) |
| 12 to 14 Years | 57 (37.0%) | 35 (100.0%) |
| 15 Years | 0 (0.0%) | 0 (0.0%) |
| 16 and 17 Years | 16 (100.0%) | 68 (100.0%) |
| 18 to 24 Years | 147 (98.0%) | 83 (100.0%) |
| 25 to 34 Years | 113 (89.7%) | 99 (53.8%) |
| 35 to 44 Years | 44 (100.0%) | 125 (100.0%) |
| 45 to 54 Years | 62 (47.0%) | 42 (100.0%) |
| 55 to 64 Years | 68 (80.9%) | 133 (64.6%) |
| 65 to 74 Years | 97 (77.6%) | 236 (87.4%) |
| 75 Years and over | 188 (87.0%) | 121 (72.5%) |
| Total | 869 (66.2%) | 1,027 (76.5%) |
Income Below Poverty Among Married-Couple Families in Bushnell
The poverty statistics for married-couple families in Bushnell show that 3.4% or 15 of the total 438 families live below the poverty line. Families with no children have the highest poverty rate of 5.1%, comprising of 15 families. On the other hand, families with 1 or 2 children have the lowest poverty rate of 0.0%, which includes 0 families.
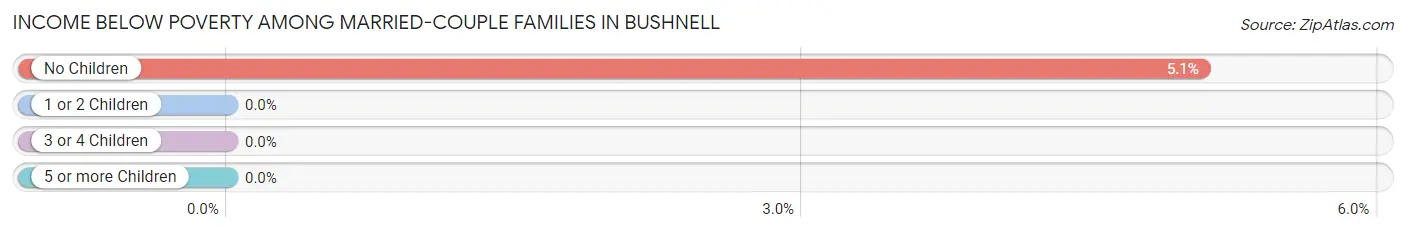
| Children | Above Poverty | Below Poverty |
| No Children | 280 (94.9%) | 15 (5.1%) |
| 1 or 2 Children | 75 (100.0%) | 0 (0.0%) |
| 3 or 4 Children | 68 (100.0%) | 0 (0.0%) |
| 5 or more Children | 0 (0.0%) | 0 (0.0%) |
| Total | 423 (96.6%) | 15 (3.4%) |
Income Below Poverty Among Single-Parent Households in Bushnell
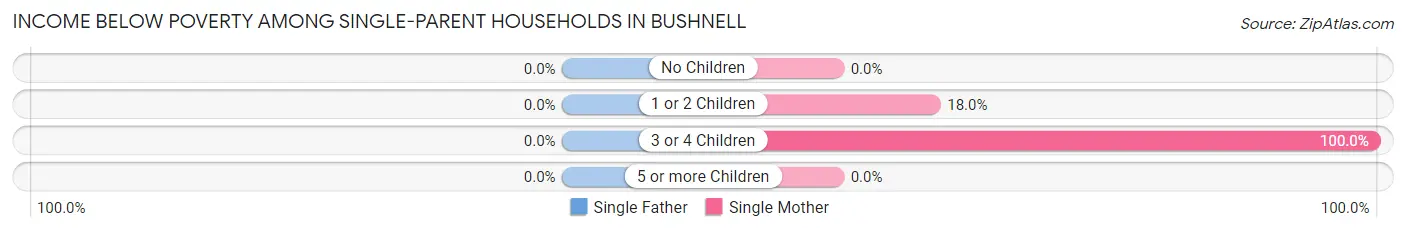
| Children | Single Father | Single Mother |
| No Children | 0 (0.0%) | 0 (0.0%) |
| 1 or 2 Children | 0 (0.0%) | 9 (18.0%) |
| 3 or 4 Children | 0 (0.0%) | 85 (100.0%) |
| 5 or more Children | 0 (0.0%) | 0 (0.0%) |
| Total | 0 (0.0%) | 94 (59.5%) |
Income Below Poverty Among Married-Couple vs Single-Parent Households in Bushnell
The poverty data for Bushnell shows that 15 of the married-couple family households (3.4%) and 94 of the single-parent households (52.8%) are living below the poverty level. Within the married-couple family households, those with no children have the highest poverty rate, with 15 households (5.1%) falling below the poverty line. Among the single-parent households, those with 3 or 4 children have the highest poverty rate, with 85 household (100.0%) living below poverty.
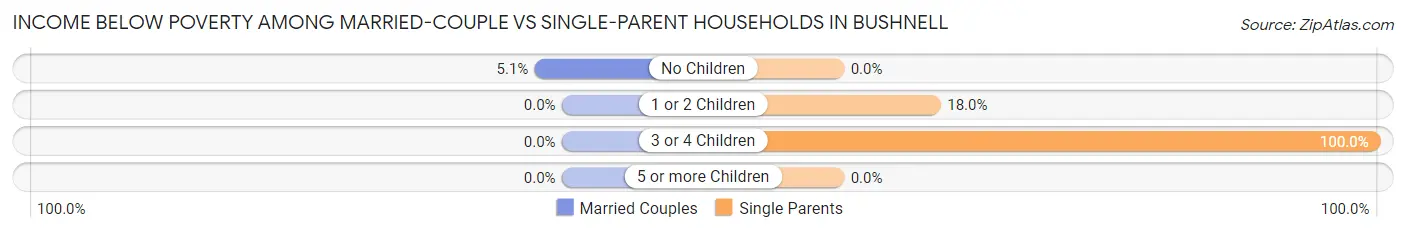
| Children | Married-Couple Families | Single-Parent Households |
| No Children | 15 (5.1%) | 0 (0.0%) |
| 1 or 2 Children | 0 (0.0%) | 9 (18.0%) |
| 3 or 4 Children | 0 (0.0%) | 85 (100.0%) |
| 5 or more Children | 0 (0.0%) | 0 (0.0%) |
| Total | 15 (3.4%) | 94 (52.8%) |
Race in Bushnell
The most populous races in Bushnell are White / Caucasian (2,622 | 85.1%), Hispanic or Latino (379 | 12.3%), and Black / African American (245 | 8.0%).
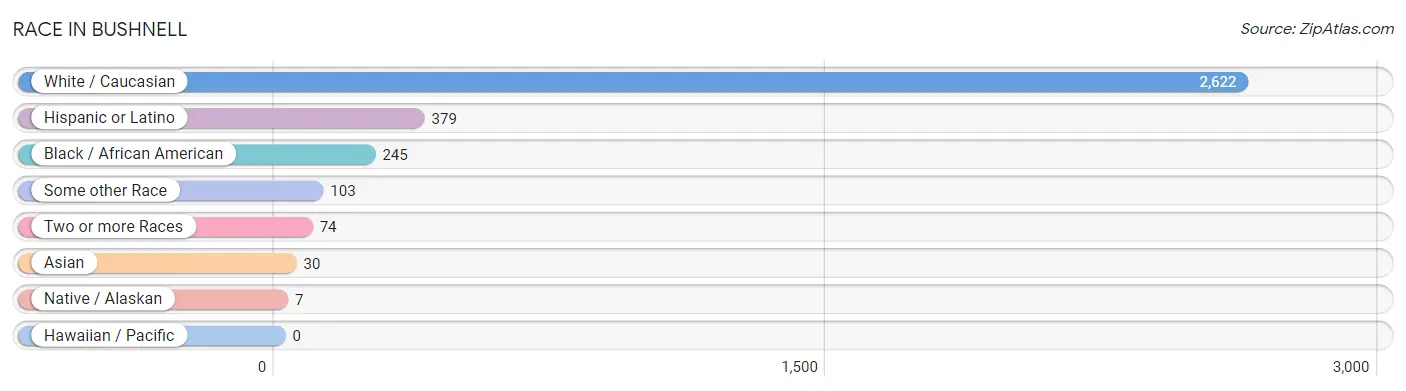
| Race | # Population | % Population |
| Asian | 30 | 1.0% |
| Black / African American | 245 | 8.0% |
| Hawaiian / Pacific | 0 | 0.0% |
| Hispanic or Latino | 379 | 12.3% |
| Native / Alaskan | 7 | 0.2% |
| White / Caucasian | 2,622 | 85.1% |
| Two or more Races | 74 | 2.4% |
| Some other Race | 103 | 3.3% |
| Total | 3,081 | 100.0% |
Ancestry in Bushnell
The most populous ancestries reported in Bushnell are American (526 | 17.1%), English (374 | 12.1%), African (360 | 11.7%), Subsaharan African (360 | 11.7%), and Mexican (314 | 10.2%), together accounting for 62.8% of all Bushnell residents.
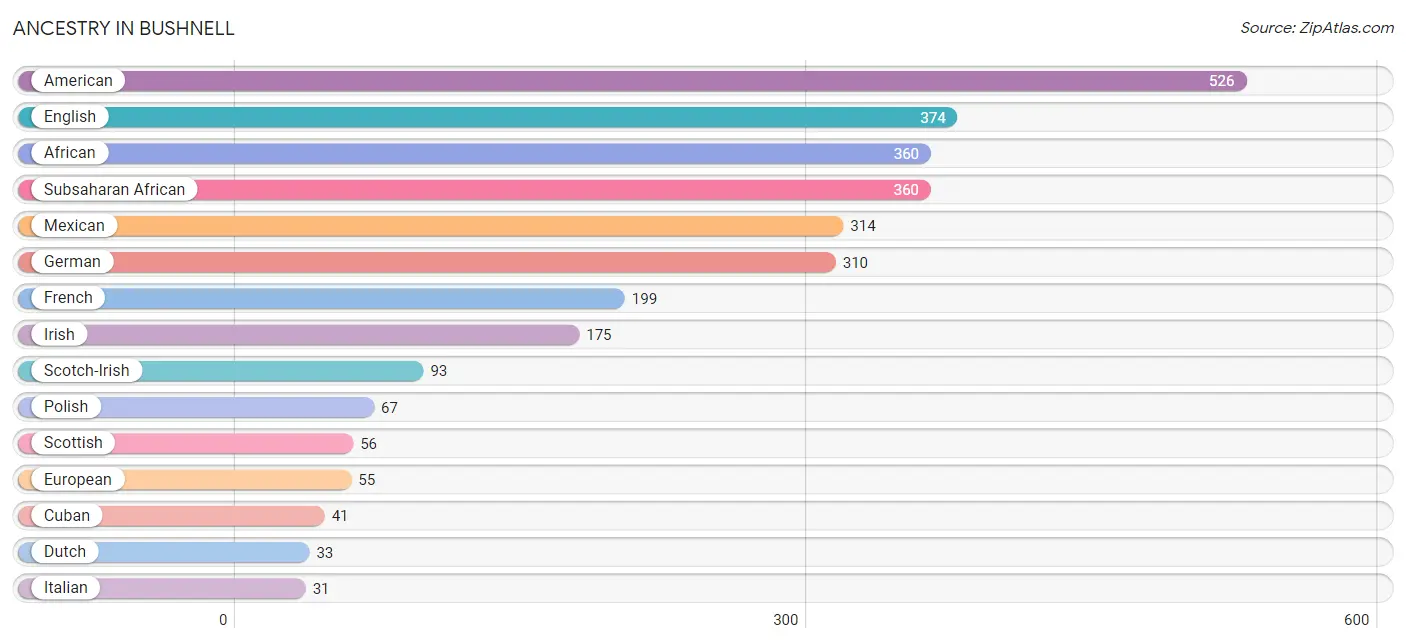
| Ancestry | # Population | % Population |
| African | 360 | 11.7% |
| American | 526 | 17.1% |
| Blackfeet | 7 | 0.2% |
| British | 7 | 0.2% |
| Canadian | 24 | 0.8% |
| Cuban | 41 | 1.3% |
| Danish | 8 | 0.3% |
| Dutch | 33 | 1.1% |
| Eastern European | 9 | 0.3% |
| English | 374 | 12.1% |
| European | 55 | 1.8% |
| French | 199 | 6.5% |
| German | 310 | 10.1% |
| Indian (Asian) | 30 | 1.0% |
| Irish | 175 | 5.7% |
| Italian | 31 | 1.0% |
| Mexican | 314 | 10.2% |
| Polish | 67 | 2.2% |
| Portuguese | 8 | 0.3% |
| Russian | 20 | 0.6% |
| Scotch-Irish | 93 | 3.0% |
| Scottish | 56 | 1.8% |
| Subsaharan African | 360 | 11.7% |
| Welsh | 7 | 0.2% | View All 24 Rows |
Immigrants in Bushnell
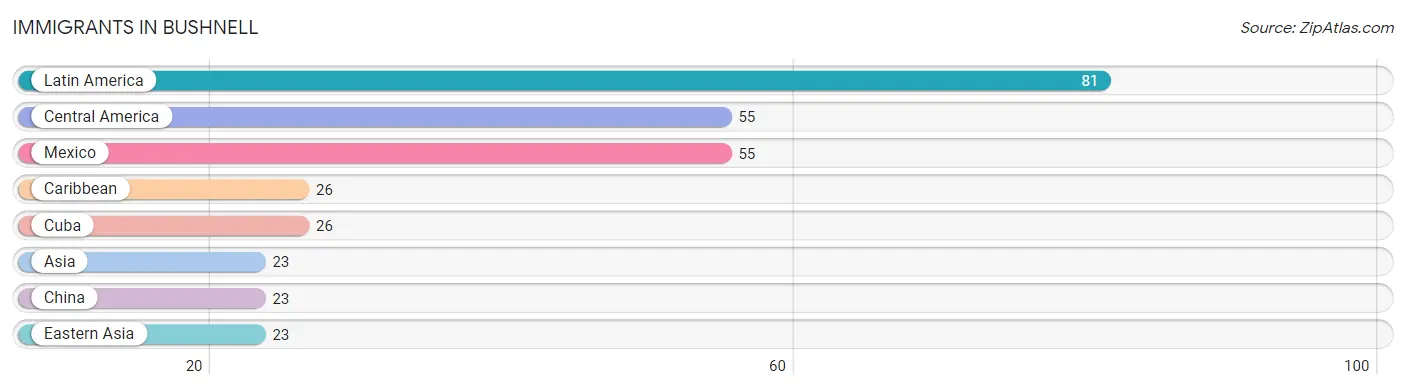
The most numerous immigrant groups reported in Bushnell came from Latin America (81 | 2.6%), Central America (55 | 1.8%), Mexico (55 | 1.8%), Caribbean (26 | 0.8%), and Cuba (26 | 0.8%), together accounting for 7.9% of all Bushnell residents.
| Immigration Origin | # Population | % Population |
| Asia | 23 | 0.7% |
| Caribbean | 26 | 0.8% |
| Central America | 55 | 1.8% |
| China | 23 | 0.7% |
| Cuba | 26 | 0.8% |
| Eastern Asia | 23 | 0.7% |
| Latin America | 81 | 2.6% |
| Mexico | 55 | 1.8% | View All 8 Rows |
Sex and Age in Bushnell
Sex and Age in Bushnell
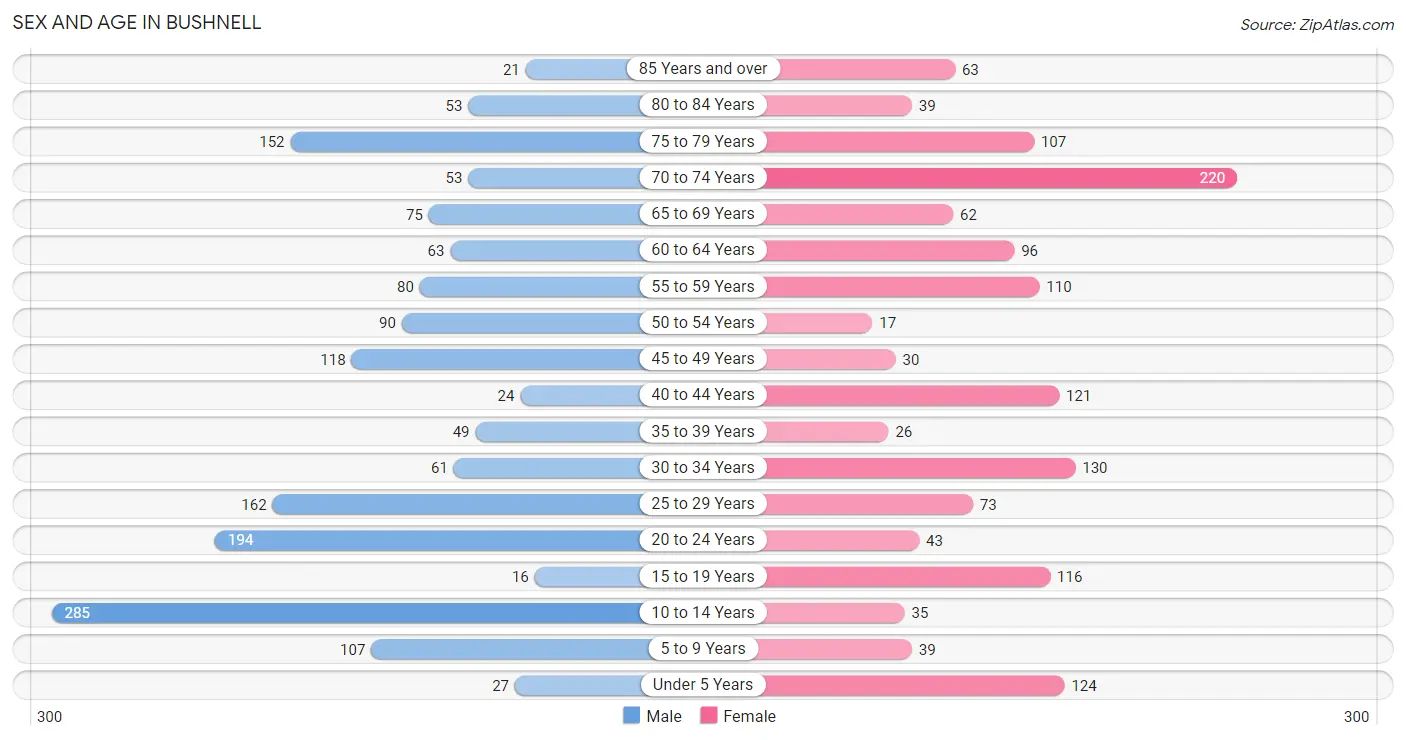
The most populous age groups in Bushnell are 10 to 14 Years (285 | 17.5%) for men and 70 to 74 Years (220 | 15.2%) for women.
| Age Bracket | Male | Female |
| Under 5 Years | 27 (1.7%) | 124 (8.6%) |
| 5 to 9 Years | 107 (6.6%) | 39 (2.7%) |
| 10 to 14 Years | 285 (17.5%) | 35 (2.4%) |
| 15 to 19 Years | 16 (1.0%) | 116 (8.0%) |
| 20 to 24 Years | 194 (11.9%) | 43 (3.0%) |
| 25 to 29 Years | 162 (9.9%) | 73 (5.0%) |
| 30 to 34 Years | 61 (3.7%) | 130 (9.0%) |
| 35 to 39 Years | 49 (3.0%) | 26 (1.8%) |
| 40 to 44 Years | 24 (1.5%) | 121 (8.3%) |
| 45 to 49 Years | 118 (7.2%) | 30 (2.1%) |
| 50 to 54 Years | 90 (5.5%) | 17 (1.2%) |
| 55 to 59 Years | 80 (4.9%) | 110 (7.6%) |
| 60 to 64 Years | 63 (3.9%) | 96 (6.6%) |
| 65 to 69 Years | 75 (4.6%) | 62 (4.3%) |
| 70 to 74 Years | 53 (3.3%) | 220 (15.2%) |
| 75 to 79 Years | 152 (9.3%) | 107 (7.4%) |
| 80 to 84 Years | 53 (3.3%) | 39 (2.7%) |
| 85 Years and over | 21 (1.3%) | 63 (4.3%) |
| Total | 1,630 (100.0%) | 1,451 (100.0%) |
Families and Households in Bushnell
Median Family Size in Bushnell
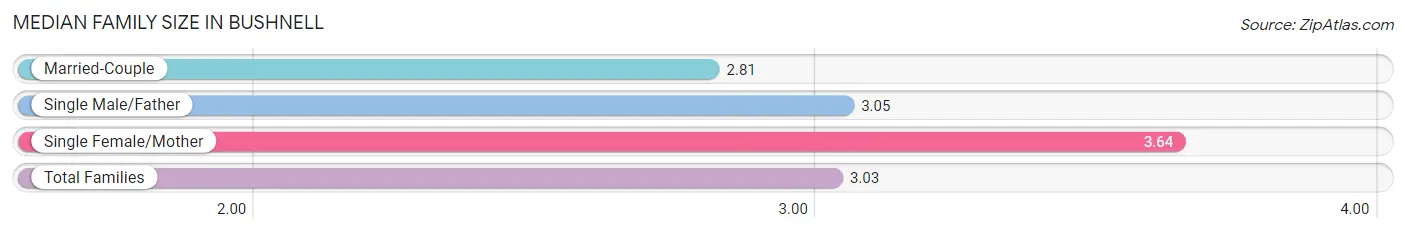
The median family size in Bushnell is 3.03 persons per family, with single female/mother families (158 | 25.7%) accounting for the largest median family size of 3.64 persons per family. On the other hand, married-couple families (438 | 71.1%) represent the smallest median family size with 2.81 persons per family.
| Family Type | # Families | Family Size |
| Married-Couple | 438 (71.1%) | 2.81 |
| Single Male/Father | 20 (3.3%) | 3.05 |
| Single Female/Mother | 158 (25.7%) | 3.64 |
| Total Families | 616 (100.0%) | 3.03 |
Median Household Size in Bushnell
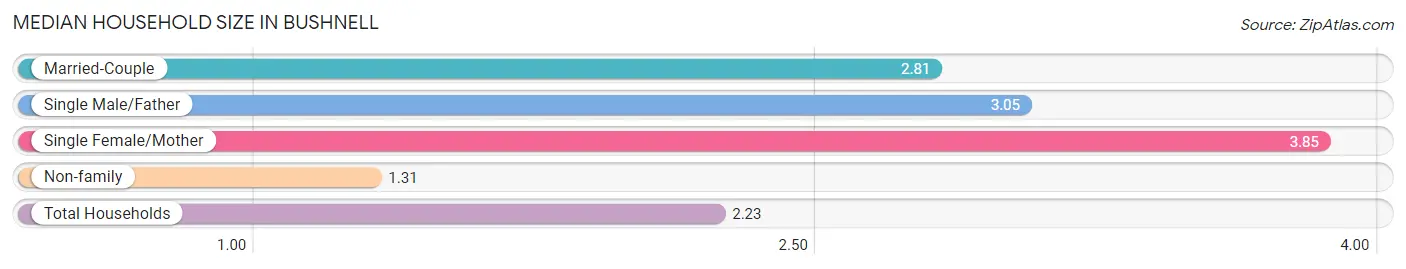
The median household size in Bushnell is 2.23 persons per household, with single female/mother households (158 | 13.4%) accounting for the largest median household size of 3.85 persons per household. non-family households (566 | 47.9%) represent the smallest median household size with 1.31 persons per household.
| Household Type | # Households | Household Size |
| Married-Couple | 438 (37.1%) | 2.81 |
| Single Male/Father | 20 (1.7%) | 3.05 |
| Single Female/Mother | 158 (13.4%) | 3.85 |
| Non-family | 566 (47.9%) | 1.31 |
| Total Households | 1,182 (100.0%) | 2.23 |
Household Size by Marriage Status in Bushnell
Out of a total of 1,182 households in Bushnell, 616 (52.1%) are family households, while 566 (47.9%) are nonfamily households. The most numerous type of family households are 2-person households, comprising 340, and the most common type of nonfamily households are 1-person households, comprising 413.
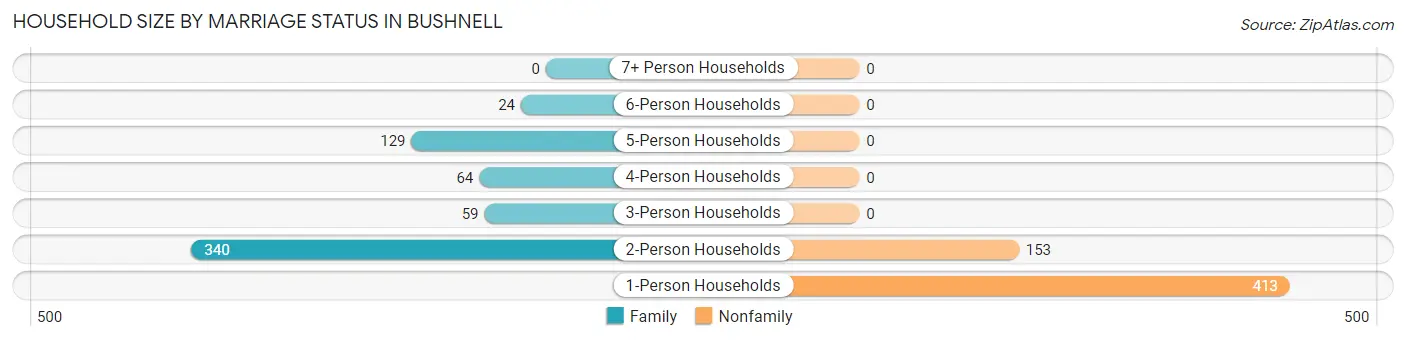
| Household Size | Family Households | Nonfamily Households |
| 1-Person Households | - | 413 (34.9%) |
| 2-Person Households | 340 (28.8%) | 153 (12.9%) |
| 3-Person Households | 59 (5.0%) | 0 (0.0%) |
| 4-Person Households | 64 (5.4%) | 0 (0.0%) |
| 5-Person Households | 129 (10.9%) | 0 (0.0%) |
| 6-Person Households | 24 (2.0%) | 0 (0.0%) |
| 7+ Person Households | 0 (0.0%) | 0 (0.0%) |
| Total | 616 (52.1%) | 566 (47.9%) |
Female Fertility in Bushnell
Fertility by Age in Bushnell
Average fertility rate in Bushnell is 95.0 births per 1,000 women. Women in the age bracket of 35 to 50 years have the highest fertility rate with 129.0 births per 1,000 women. Women in the age bracket of 20 to 34 years acount for 52.8% of all women with births.
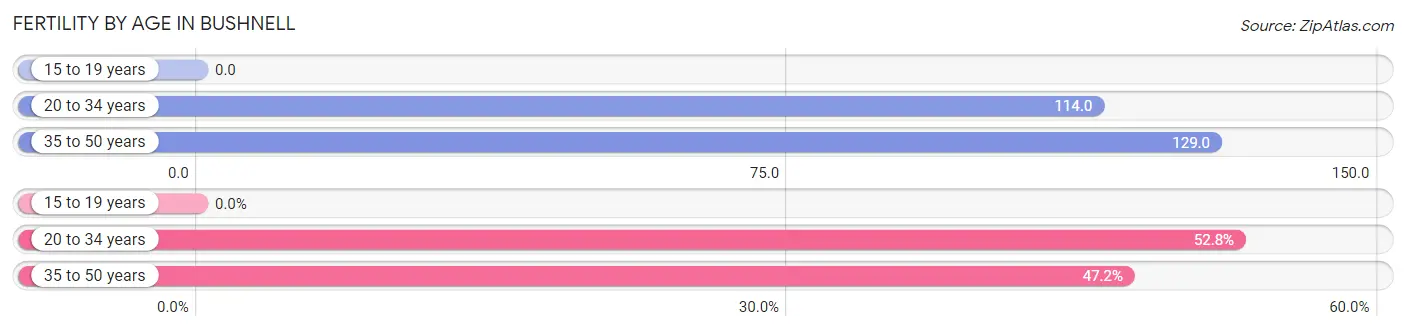
| Age Bracket | Women with Births | Births / 1,000 Women |
| 15 to 19 years | 0 (0.0%) | 0.0 |
| 20 to 34 years | 28 (52.8%) | 114.0 |
| 35 to 50 years | 25 (47.2%) | 129.0 |
| Total | 53 (100.0%) | 95.0 |
Fertility by Age by Marriage Status in Bushnell
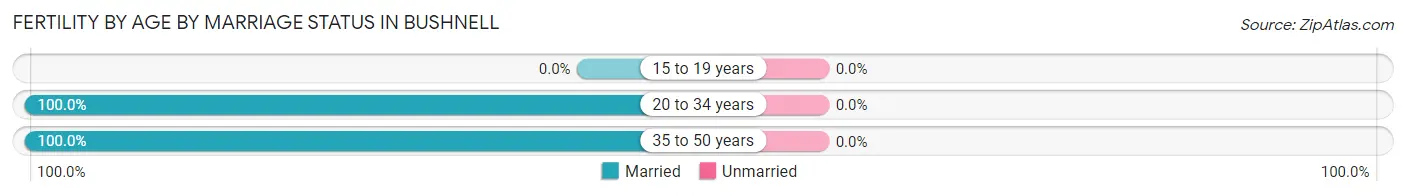
| Age Bracket | Married | Unmarried |
| 15 to 19 years | 0 (0.0%) | 0 (0.0%) |
| 20 to 34 years | 28 (100.0%) | 0 (0.0%) |
| 35 to 50 years | 25 (100.0%) | 0 (0.0%) |
| Total | 53 (100.0%) | 0 (0.0%) |
Fertility by Education in Bushnell
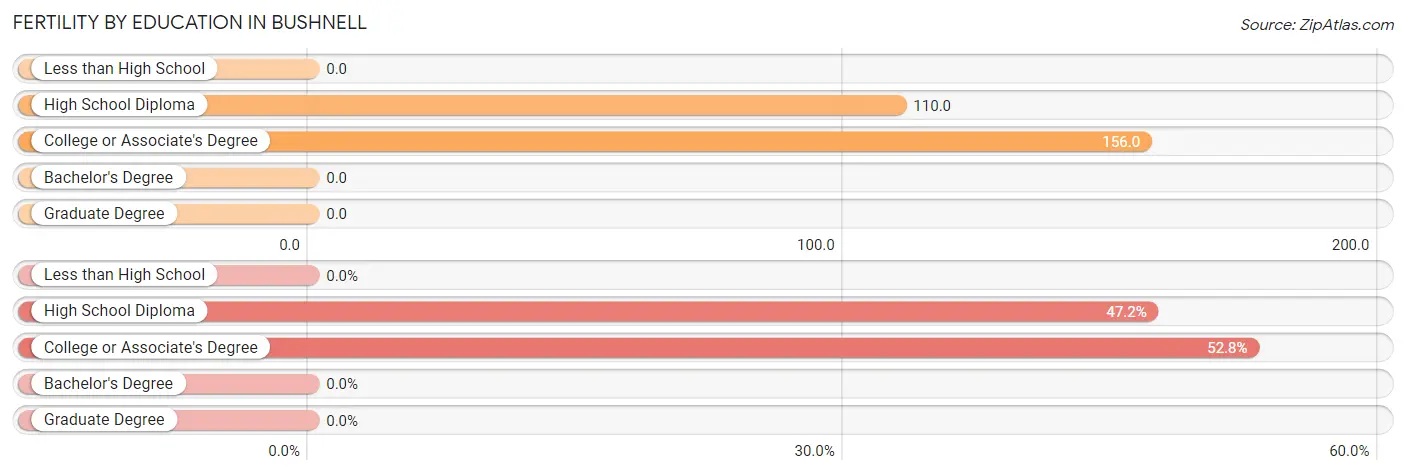
| Educational Attainment | Women with Births | Births / 1,000 Women |
| Less than High School | 0 (0.0%) | 0.0 |
| High School Diploma | 25 (47.2%) | 110.0 |
| College or Associate's Degree | 28 (52.8%) | 156.0 |
| Bachelor's Degree | 0 (0.0%) | 0.0 |
| Graduate Degree | 0 (0.0%) | 0.0 |
| Total | 53 (100.0%) | 95.0 |
Fertility by Education by Marriage Status in Bushnell
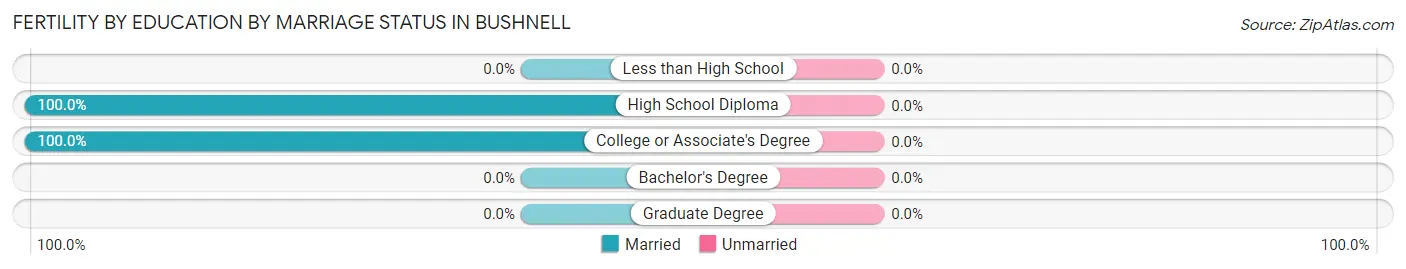
| Educational Attainment | Married | Unmarried |
| Less than High School | 0 (0.0%) | 0 (0.0%) |
| High School Diploma | 25 (100.0%) | 0 (0.0%) |
| College or Associate's Degree | 28 (100.0%) | 0 (0.0%) |
| Bachelor's Degree | 0 (0.0%) | 0 (0.0%) |
| Graduate Degree | 0 (0.0%) | 0 (0.0%) |
| Total | 53 (100.0%) | 0 (0.0%) |
Employment Characteristics in Bushnell
Employment by Class of Employer in Bushnell
Among the 907 employed individuals in Bushnell, private company employees (708 | 78.1%), self-employed (not incorporated) (103 | 11.4%), and federal government employees (43 | 4.7%) make up the most common classes of employment.
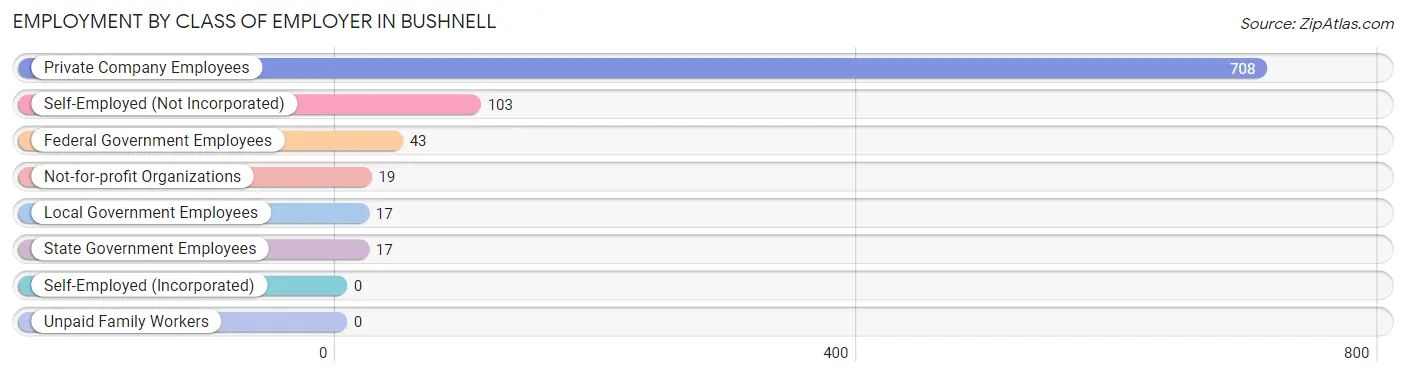
| Employer Class | # Employees | % Employees |
| Private Company Employees | 708 | 78.1% |
| Self-Employed (Incorporated) | 0 | 0.0% |
| Self-Employed (Not Incorporated) | 103 | 11.4% |
| Not-for-profit Organizations | 19 | 2.1% |
| Local Government Employees | 17 | 1.9% |
| State Government Employees | 17 | 1.9% |
| Federal Government Employees | 43 | 4.7% |
| Unpaid Family Workers | 0 | 0.0% |
| Total | 907 | 100.0% |
Employment Status by Age in Bushnell
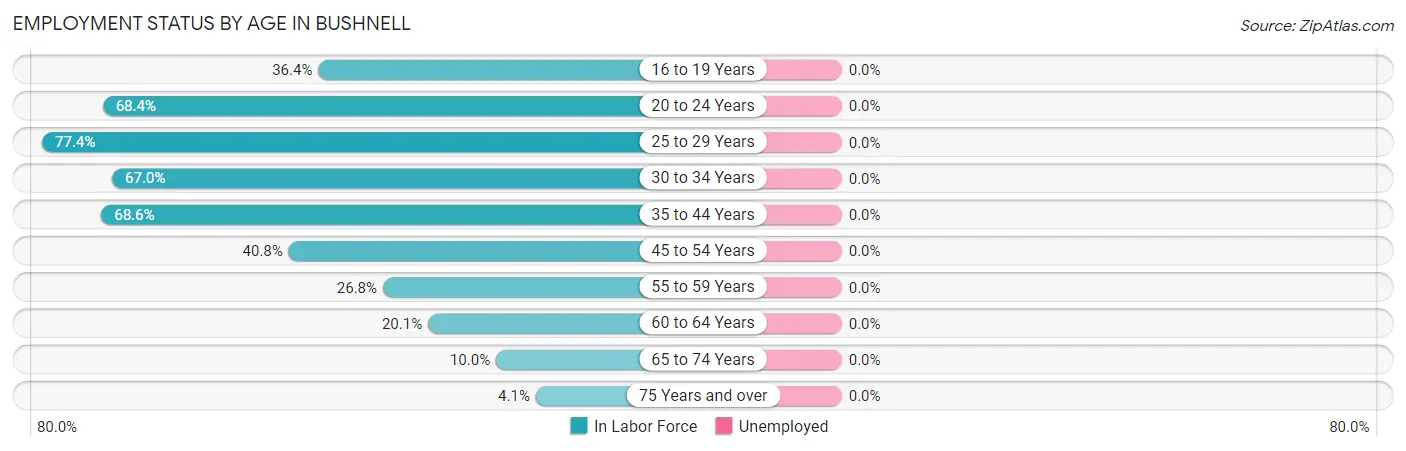
| Age Bracket | In Labor Force | Unemployed |
| 16 to 19 Years | 48 (36.4%) | 0 (0.0%) |
| 20 to 24 Years | 162 (68.4%) | 0 (0.0%) |
| 25 to 29 Years | 182 (77.4%) | 0 (0.0%) |
| 30 to 34 Years | 128 (67.0%) | 0 (0.0%) |
| 35 to 44 Years | 151 (68.6%) | 0 (0.0%) |
| 45 to 54 Years | 104 (40.8%) | 0 (0.0%) |
| 55 to 59 Years | 51 (26.8%) | 0 (0.0%) |
| 60 to 64 Years | 32 (20.1%) | 0 (0.0%) |
| 65 to 74 Years | 41 (10.0%) | 0 (0.0%) |
| 75 Years and over | 18 (4.1%) | 0 (0.0%) |
| Total | 917 (37.2%) | 0 (0.0%) |
Employment Status by Educational Attainment in Bushnell
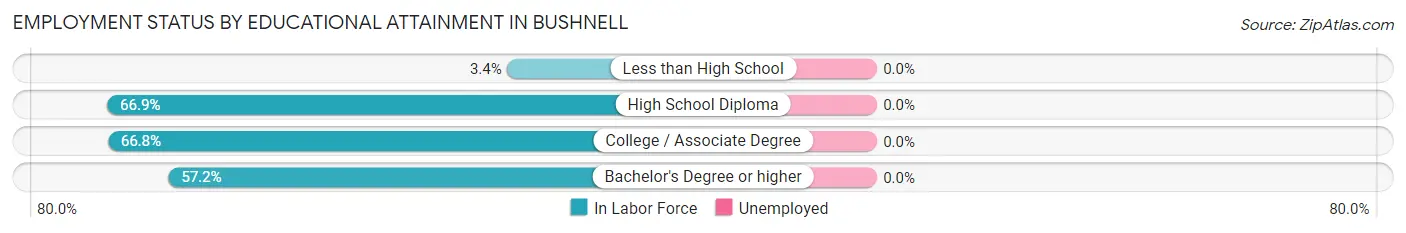
| Educational Attainment | In Labor Force | Unemployed |
| Less than High School | 9 (3.4%) | 0 (0.0%) |
| High School Diploma | 341 (66.9%) | 0 (0.0%) |
| College / Associate Degree | 195 (66.8%) | 0 (0.0%) |
| Bachelor's Degree or higher | 103 (57.2%) | 0 (0.0%) |
| Total | 648 (51.8%) | 0 (0.0%) |
Employment Occupations by Sex in Bushnell
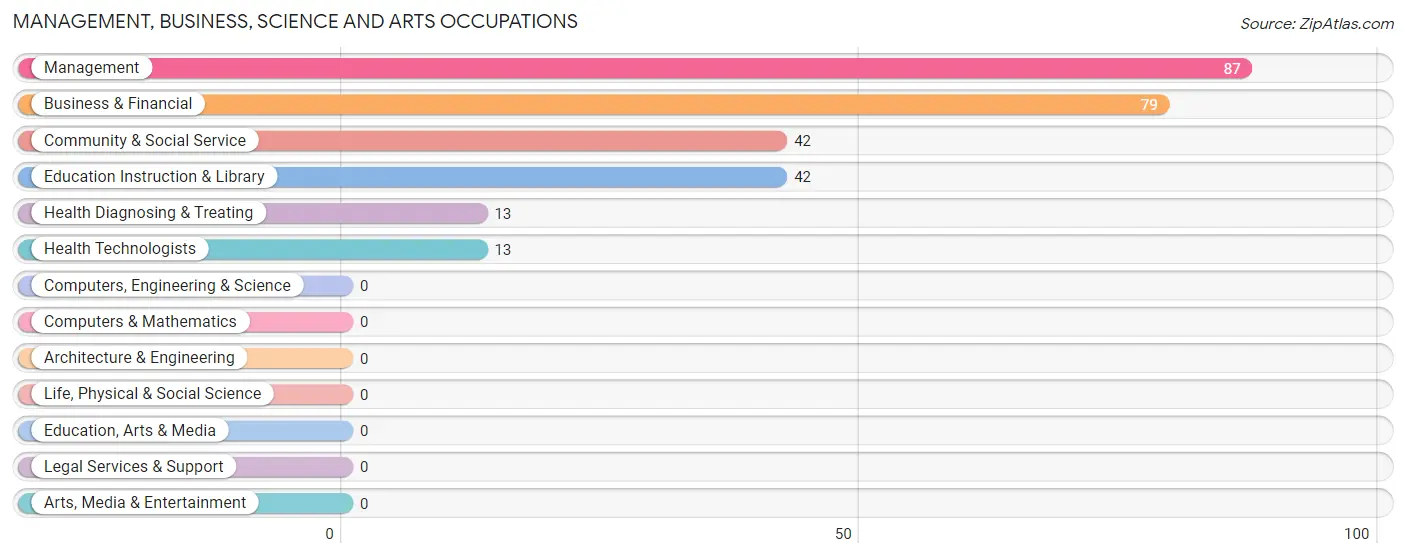
Management, Business, Science and Arts Occupations
The most common Management, Business, Science and Arts occupations in Bushnell are Management (87 | 9.5%), Business & Financial (79 | 8.6%), Community & Social Service (42 | 4.6%), Education Instruction & Library (42 | 4.6%), and Health Diagnosing & Treating (13 | 1.4%).
Management, Business, Science and Arts Occupations by Sex
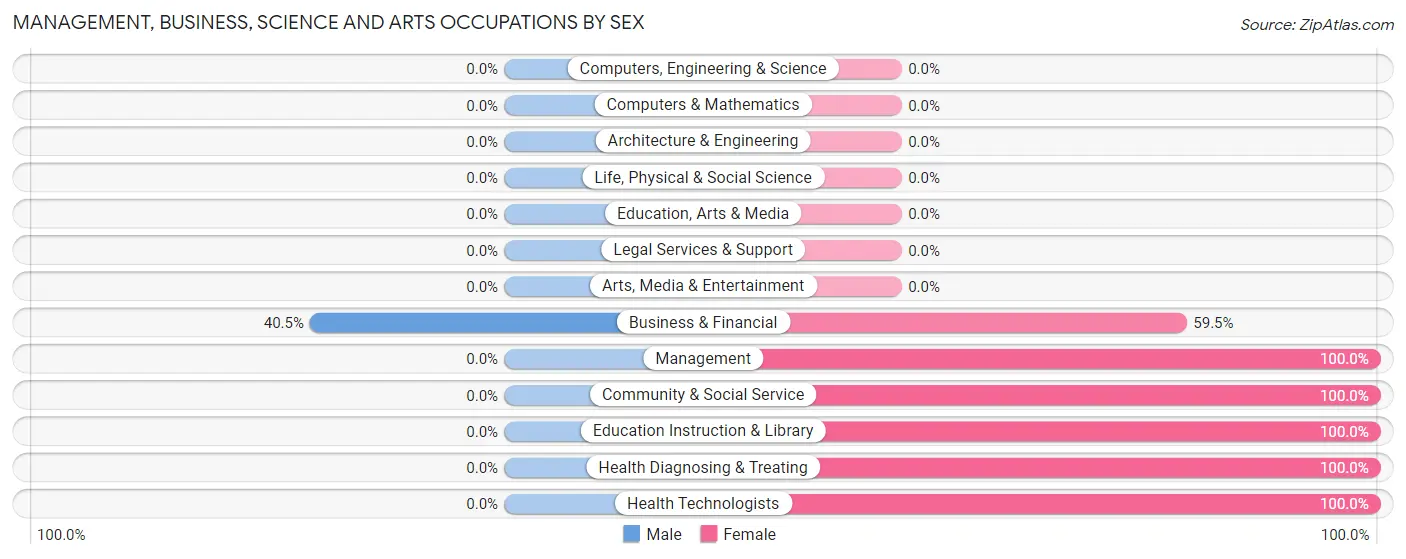
| Occupation | Male | Female |
| Management | 0 (0.0%) | 87 (100.0%) |
| Business & Financial | 32 (40.5%) | 47 (59.5%) |
| Computers, Engineering & Science | 0 (0.0%) | 0 (0.0%) |
| Computers & Mathematics | 0 (0.0%) | 0 (0.0%) |
| Architecture & Engineering | 0 (0.0%) | 0 (0.0%) |
| Life, Physical & Social Science | 0 (0.0%) | 0 (0.0%) |
| Community & Social Service | 0 (0.0%) | 42 (100.0%) |
| Education, Arts & Media | 0 (0.0%) | 0 (0.0%) |
| Legal Services & Support | 0 (0.0%) | 0 (0.0%) |
| Education Instruction & Library | 0 (0.0%) | 42 (100.0%) |
| Arts, Media & Entertainment | 0 (0.0%) | 0 (0.0%) |
| Health Diagnosing & Treating | 0 (0.0%) | 13 (100.0%) |
| Health Technologists | 0 (0.0%) | 13 (100.0%) |
| Total (Category) | 32 (14.5%) | 189 (85.5%) |
| Total (Overall) | 425 (46.4%) | 492 (53.6%) |
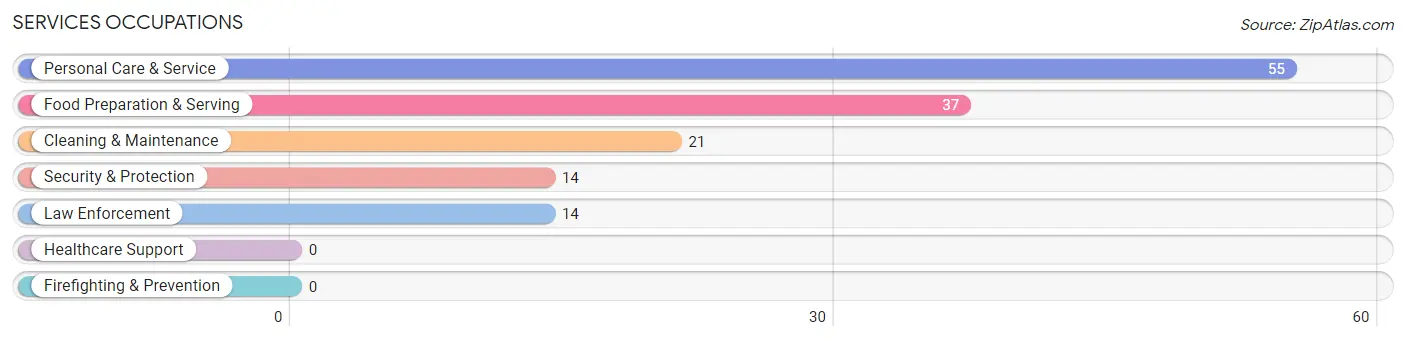
Services Occupations
The most common Services occupations in Bushnell are Personal Care & Service (55 | 6.0%), Food Preparation & Serving (37 | 4.0%), Cleaning & Maintenance (21 | 2.3%), Security & Protection (14 | 1.5%), and Law Enforcement (14 | 1.5%).
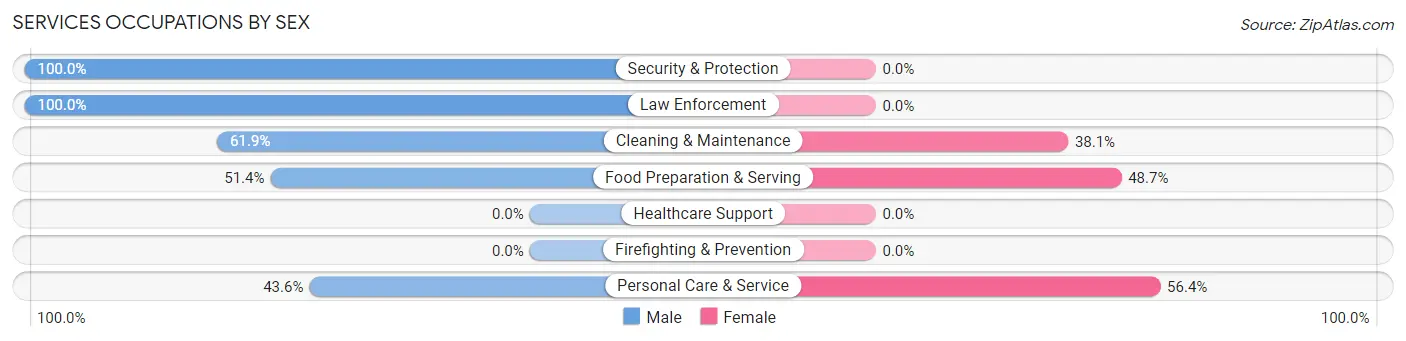
Services Occupations by Sex
Within the Services occupations in Bushnell, the most male-oriented occupations are Security & Protection (100.0%), Law Enforcement (100.0%), and Cleaning & Maintenance (61.9%), while the most female-oriented occupations are Personal Care & Service (56.4%), Food Preparation & Serving (48.6%), and Cleaning & Maintenance (38.1%).
| Occupation | Male | Female |
| Healthcare Support | 0 (0.0%) | 0 (0.0%) |
| Security & Protection | 14 (100.0%) | 0 (0.0%) |
| Firefighting & Prevention | 0 (0.0%) | 0 (0.0%) |
| Law Enforcement | 14 (100.0%) | 0 (0.0%) |
| Food Preparation & Serving | 19 (51.3%) | 18 (48.6%) |
| Cleaning & Maintenance | 13 (61.9%) | 8 (38.1%) |
| Personal Care & Service | 24 (43.6%) | 31 (56.4%) |
| Total (Category) | 70 (55.1%) | 57 (44.9%) |
| Total (Overall) | 425 (46.4%) | 492 (53.6%) |
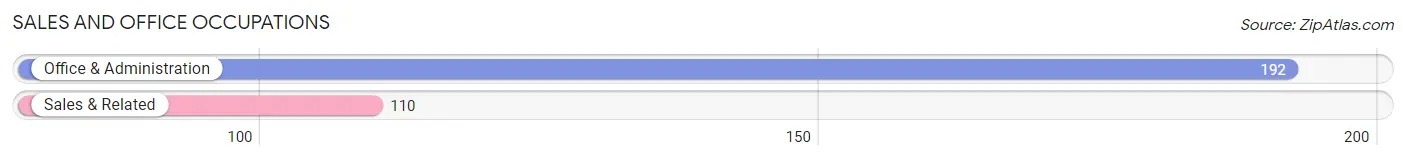
Sales and Office Occupations
The most common Sales and Office occupations in Bushnell are Office & Administration (192 | 20.9%), and Sales & Related (110 | 12.0%).
Sales and Office Occupations by Sex
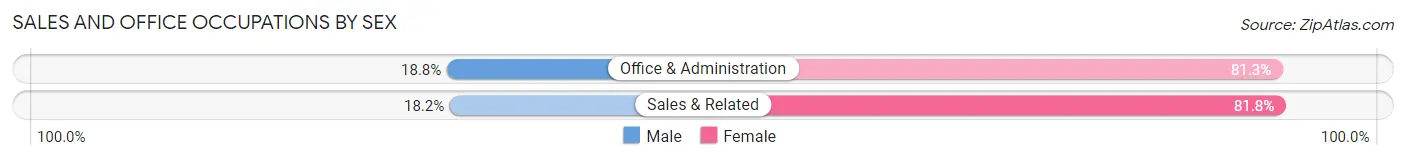
| Occupation | Male | Female |
| Sales & Related | 20 (18.2%) | 90 (81.8%) |
| Office & Administration | 36 (18.8%) | 156 (81.2%) |
| Total (Category) | 56 (18.5%) | 246 (81.5%) |
| Total (Overall) | 425 (46.4%) | 492 (53.6%) |
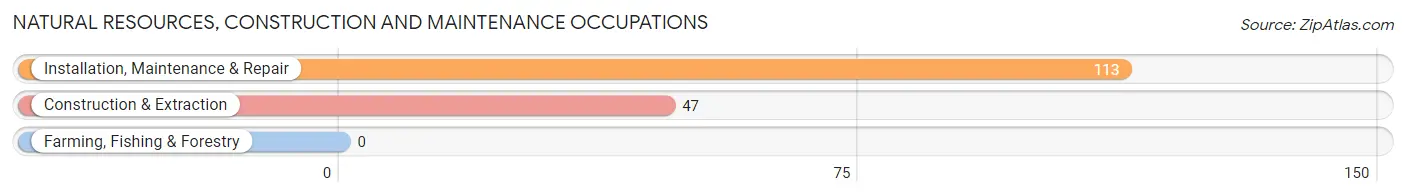
Natural Resources, Construction and Maintenance Occupations
The most common Natural Resources, Construction and Maintenance occupations in Bushnell are Installation, Maintenance & Repair (113 | 12.3%), and Construction & Extraction (47 | 5.1%).
Natural Resources, Construction and Maintenance Occupations by Sex
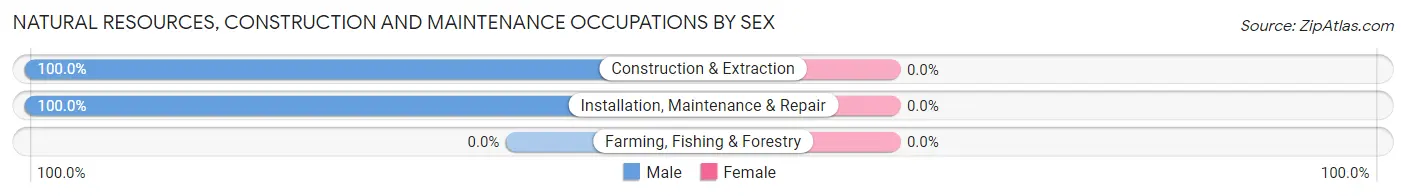
| Occupation | Male | Female |
| Farming, Fishing & Forestry | 0 (0.0%) | 0 (0.0%) |
| Construction & Extraction | 47 (100.0%) | 0 (0.0%) |
| Installation, Maintenance & Repair | 113 (100.0%) | 0 (0.0%) |
| Total (Category) | 160 (100.0%) | 0 (0.0%) |
| Total (Overall) | 425 (46.4%) | 492 (53.6%) |
Production, Transportation and Moving Occupations
The most common Production, Transportation and Moving occupations in Bushnell are Production (92 | 10.0%), and Transportation (15 | 1.6%).
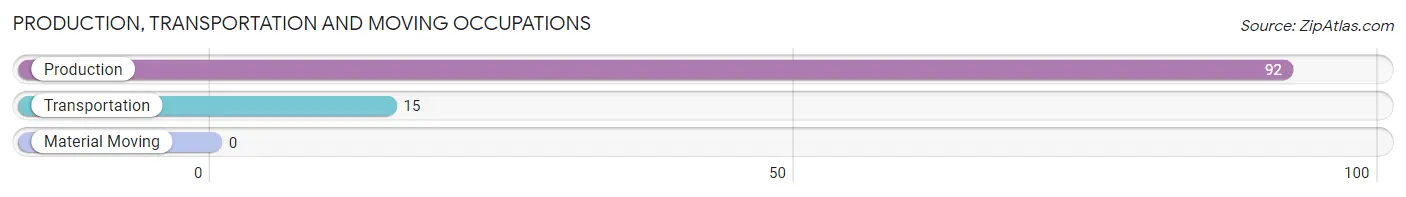
Production, Transportation and Moving Occupations by Sex
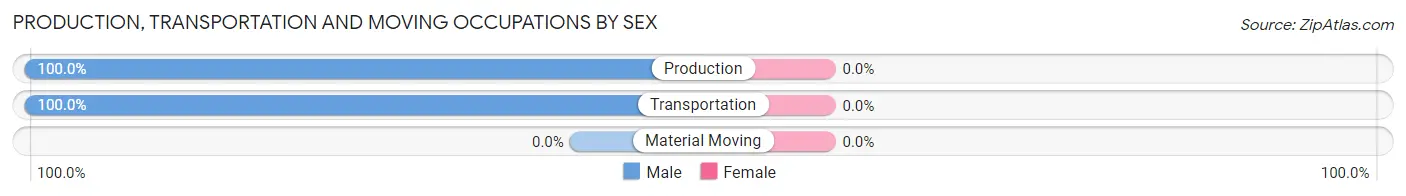
| Occupation | Male | Female |
| Production | 92 (100.0%) | 0 (0.0%) |
| Transportation | 15 (100.0%) | 0 (0.0%) |
| Material Moving | 0 (0.0%) | 0 (0.0%) |
| Total (Category) | 107 (100.0%) | 0 (0.0%) |
| Total (Overall) | 425 (46.4%) | 492 (53.6%) |
Employment Industries by Sex in Bushnell
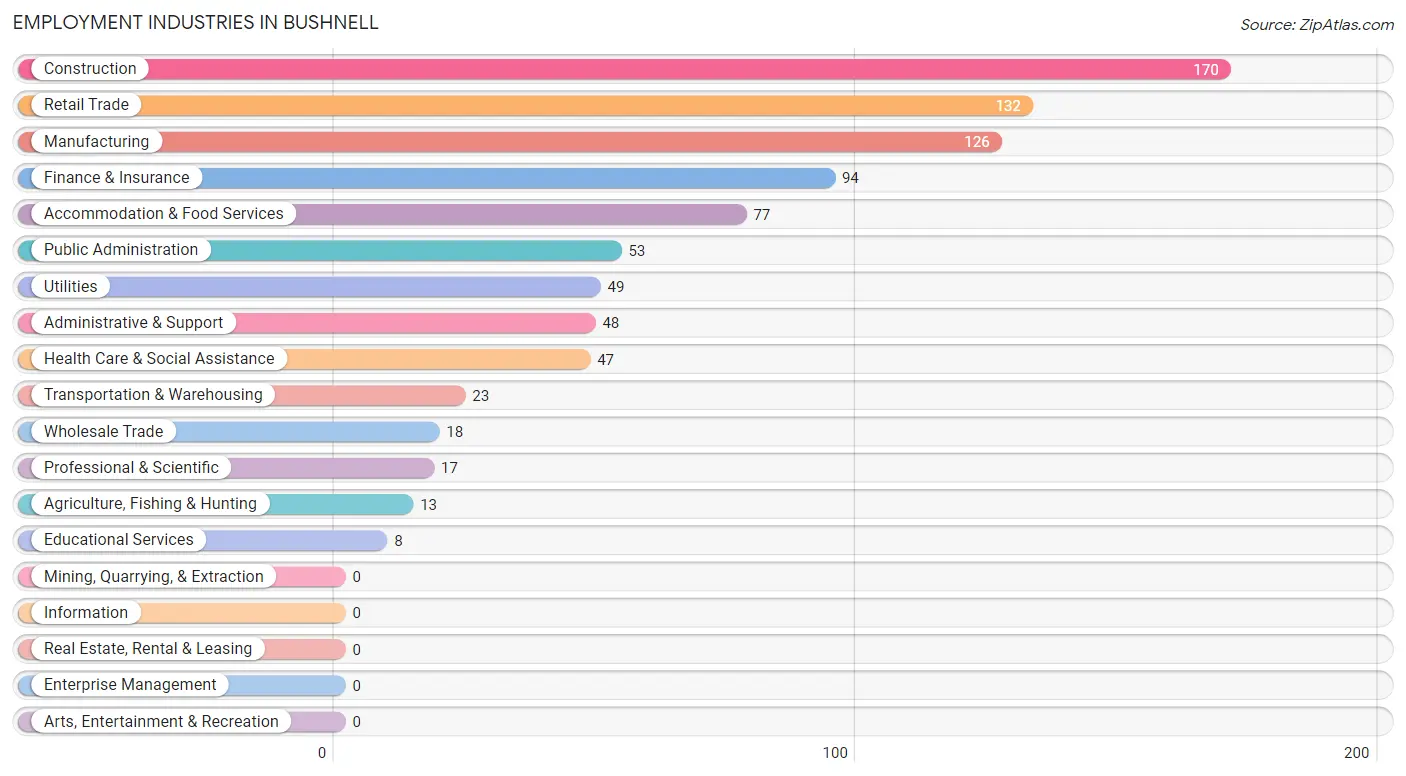
Employment Industries in Bushnell
The major employment industries in Bushnell include Construction (170 | 18.5%), Retail Trade (132 | 14.4%), Manufacturing (126 | 13.7%), Finance & Insurance (94 | 10.2%), and Accommodation & Food Services (77 | 8.4%).
Employment Industries by Sex in Bushnell
The Bushnell industries that see more men than women are Agriculture, Fishing & Hunting (100.0%), Manufacturing (100.0%), and Utilities (100.0%), whereas the industries that tend to have a higher number of women are Wholesale Trade (100.0%), Educational Services (100.0%), and Health Care & Social Assistance (100.0%).
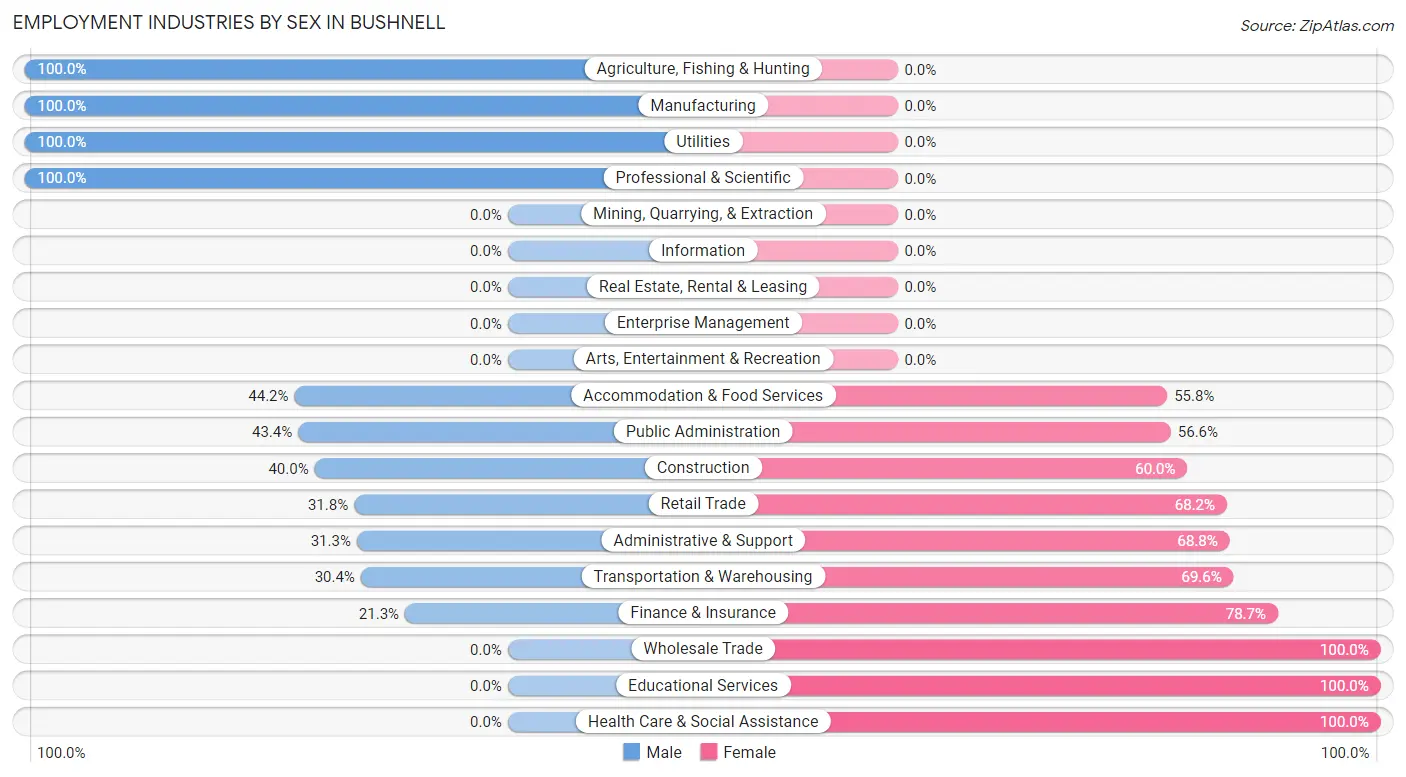
| Industry | Male | Female |
| Agriculture, Fishing & Hunting | 13 (100.0%) | 0 (0.0%) |
| Mining, Quarrying, & Extraction | 0 (0.0%) | 0 (0.0%) |
| Construction | 68 (40.0%) | 102 (60.0%) |
| Manufacturing | 126 (100.0%) | 0 (0.0%) |
| Wholesale Trade | 0 (0.0%) | 18 (100.0%) |
| Retail Trade | 42 (31.8%) | 90 (68.2%) |
| Transportation & Warehousing | 7 (30.4%) | 16 (69.6%) |
| Utilities | 49 (100.0%) | 0 (0.0%) |
| Information | 0 (0.0%) | 0 (0.0%) |
| Finance & Insurance | 20 (21.3%) | 74 (78.7%) |
| Real Estate, Rental & Leasing | 0 (0.0%) | 0 (0.0%) |
| Professional & Scientific | 17 (100.0%) | 0 (0.0%) |
| Enterprise Management | 0 (0.0%) | 0 (0.0%) |
| Administrative & Support | 15 (31.2%) | 33 (68.8%) |
| Educational Services | 0 (0.0%) | 8 (100.0%) |
| Health Care & Social Assistance | 0 (0.0%) | 47 (100.0%) |
| Arts, Entertainment & Recreation | 0 (0.0%) | 0 (0.0%) |
| Accommodation & Food Services | 34 (44.2%) | 43 (55.8%) |
| Public Administration | 23 (43.4%) | 30 (56.6%) |
| Total | 425 (46.4%) | 492 (53.6%) |
Education in Bushnell
School Enrollment in Bushnell
The most common levels of schooling among the 646 students in Bushnell are middle school (298 | 46.1%), elementary school (124 | 19.2%), and high school (112 | 17.3%).
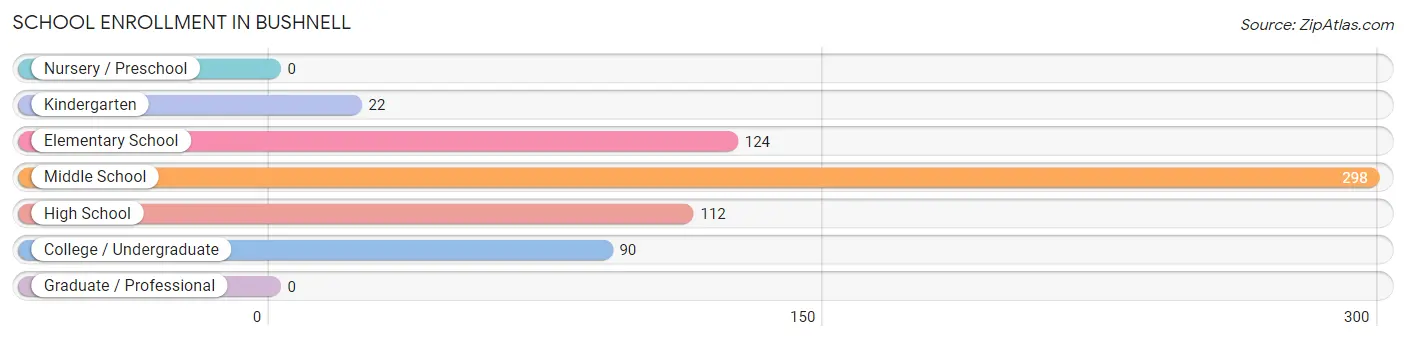
| School Level | # Students | % Students |
| Nursery / Preschool | 0 | 0.0% |
| Kindergarten | 22 | 3.4% |
| Elementary School | 124 | 19.2% |
| Middle School | 298 | 46.1% |
| High School | 112 | 17.3% |
| College / Undergraduate | 90 | 13.9% |
| Graduate / Professional | 0 | 0.0% |
| Total | 646 | 100.0% |
School Enrollment by Age by Funding Source in Bushnell
Out of a total of 646 students who are enrolled in schools in Bushnell, 52 (8.0%) attend a private institution, while the remaining 594 (92.0%) are enrolled in public schools. The age group of 18 to 19 year olds has the highest likelihood of being enrolled in private schools, with 8 (57.1% in the age bracket) enrolled. Conversely, the age group of 10 to 14 year olds has the lowest likelihood of being enrolled in a private school, with 320 (100.0% in the age bracket) attending a public institution.
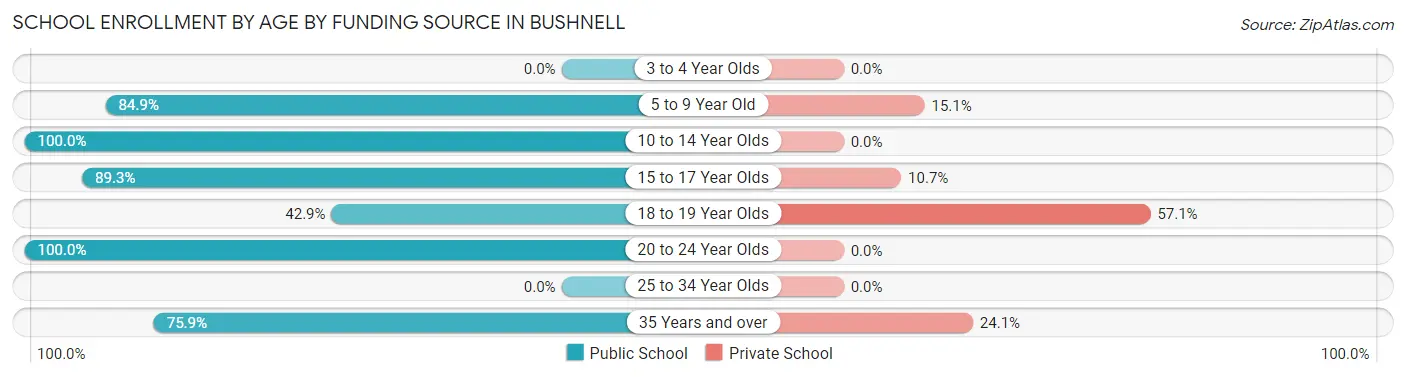
| Age Bracket | Public School | Private School |
| 3 to 4 Year Olds | 0 (0.0%) | 0 (0.0%) |
| 5 to 9 Year Old | 124 (84.9%) | 22 (15.1%) |
| 10 to 14 Year Olds | 320 (100.0%) | 0 (0.0%) |
| 15 to 17 Year Olds | 75 (89.3%) | 9 (10.7%) |
| 18 to 19 Year Olds | 6 (42.9%) | 8 (57.1%) |
| 20 to 24 Year Olds | 28 (100.0%) | 0 (0.0%) |
| 25 to 34 Year Olds | 0 (0.0%) | 0 (0.0%) |
| 35 Years and over | 41 (75.9%) | 13 (24.1%) |
| Total | 594 (92.0%) | 52 (8.0%) |
Educational Attainment by Field of Study in Bushnell
Psychology (45 | 19.5%), business (42 | 18.2%), communications (31 | 13.4%), education (27 | 11.7%), and engineering (17 | 7.4%) are the most common fields of study among 231 individuals in Bushnell who have obtained a bachelor's degree or higher.
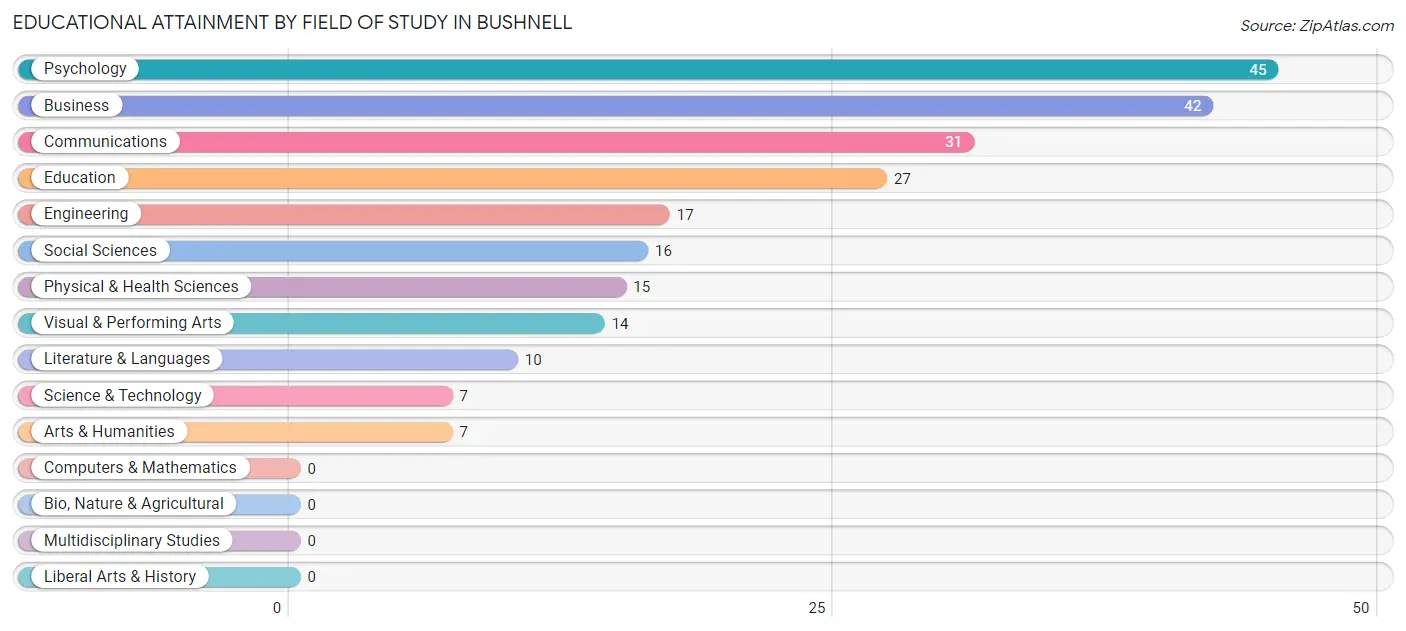
| Field of Study | # Graduates | % Graduates |
| Computers & Mathematics | 0 | 0.0% |
| Bio, Nature & Agricultural | 0 | 0.0% |
| Physical & Health Sciences | 15 | 6.5% |
| Psychology | 45 | 19.5% |
| Social Sciences | 16 | 6.9% |
| Engineering | 17 | 7.4% |
| Multidisciplinary Studies | 0 | 0.0% |
| Science & Technology | 7 | 3.0% |
| Business | 42 | 18.2% |
| Education | 27 | 11.7% |
| Literature & Languages | 10 | 4.3% |
| Liberal Arts & History | 0 | 0.0% |
| Visual & Performing Arts | 14 | 6.1% |
| Communications | 31 | 13.4% |
| Arts & Humanities | 7 | 3.0% |
| Total | 231 | 100.0% |
Transportation & Commute in Bushnell
Vehicle Availability by Sex in Bushnell
The most prevalent vehicle ownership categories in Bushnell are males with 2 vehicles (267, accounting for 64.8%) and females with 2 vehicles (259, making up 56.3%).
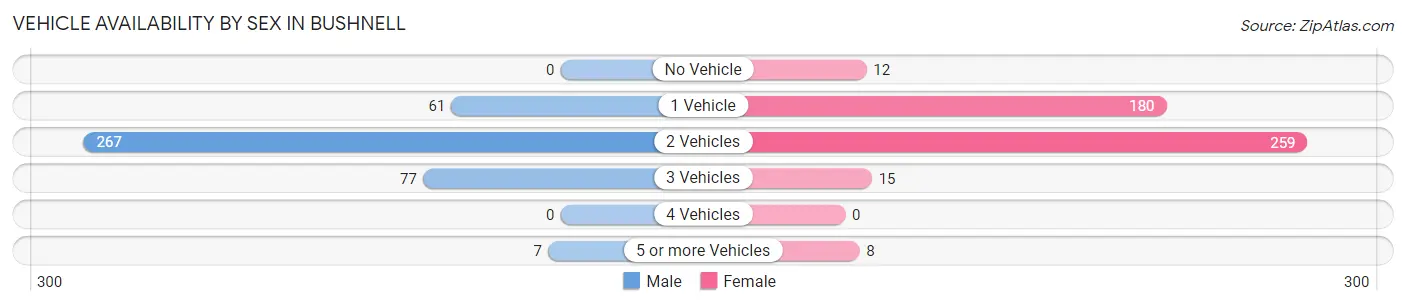
| Vehicles Available | Male | Female |
| No Vehicle | 0 (0.0%) | 12 (2.5%) |
| 1 Vehicle | 61 (14.8%) | 180 (38.0%) |
| 2 Vehicles | 267 (64.8%) | 259 (54.6%) |
| 3 Vehicles | 77 (18.7%) | 15 (3.2%) |
| 4 Vehicles | 0 (0.0%) | 0 (0.0%) |
| 5 or more Vehicles | 7 (1.7%) | 8 (1.7%) |
| Total | 412 (100.0%) | 474 (100.0%) |
Commute Time in Bushnell
The most frequently occuring commute durations in Bushnell are 30 to 34 minutes (152 commuters, 17.3%), 45 to 59 minutes (121 commuters, 13.8%), and 15 to 19 minutes (119 commuters, 13.5%).
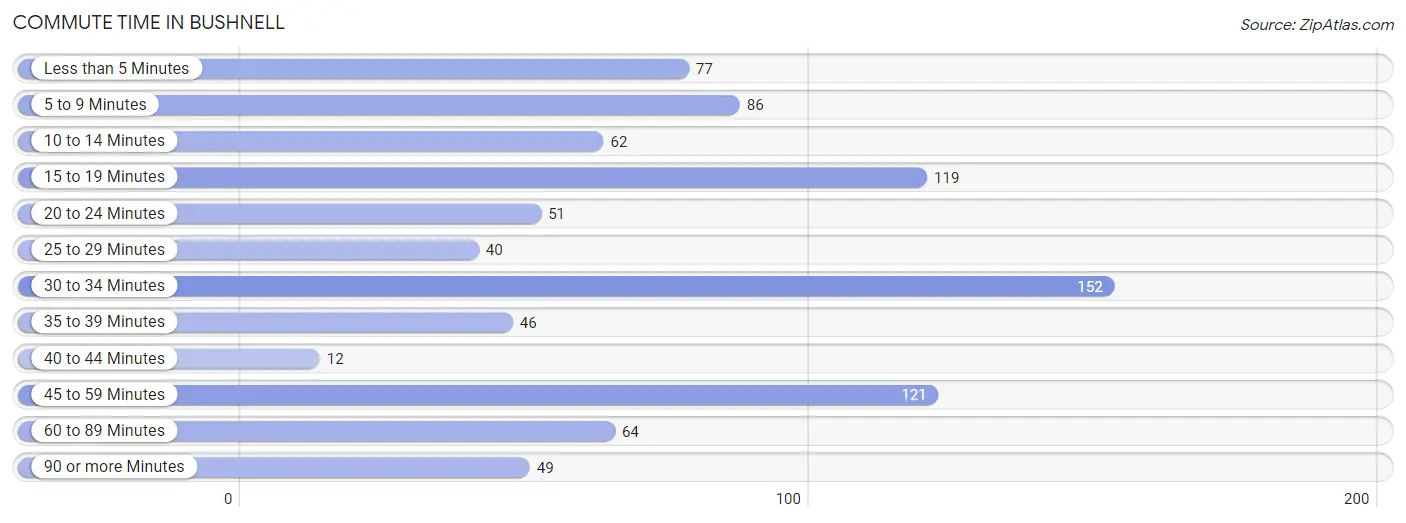
| Commute Time | # Commuters | % Commuters |
| Less than 5 Minutes | 77 | 8.8% |
| 5 to 9 Minutes | 86 | 9.8% |
| 10 to 14 Minutes | 62 | 7.0% |
| 15 to 19 Minutes | 119 | 13.5% |
| 20 to 24 Minutes | 51 | 5.8% |
| 25 to 29 Minutes | 40 | 4.5% |
| 30 to 34 Minutes | 152 | 17.3% |
| 35 to 39 Minutes | 46 | 5.2% |
| 40 to 44 Minutes | 12 | 1.4% |
| 45 to 59 Minutes | 121 | 13.8% |
| 60 to 89 Minutes | 64 | 7.3% |
| 90 or more Minutes | 49 | 5.6% |
Commute Time by Sex in Bushnell
The most common commute times in Bushnell are 45 to 59 minutes (90 commuters, 22.2%) for males and 15 to 19 minutes (97 commuters, 20.5%) for females.
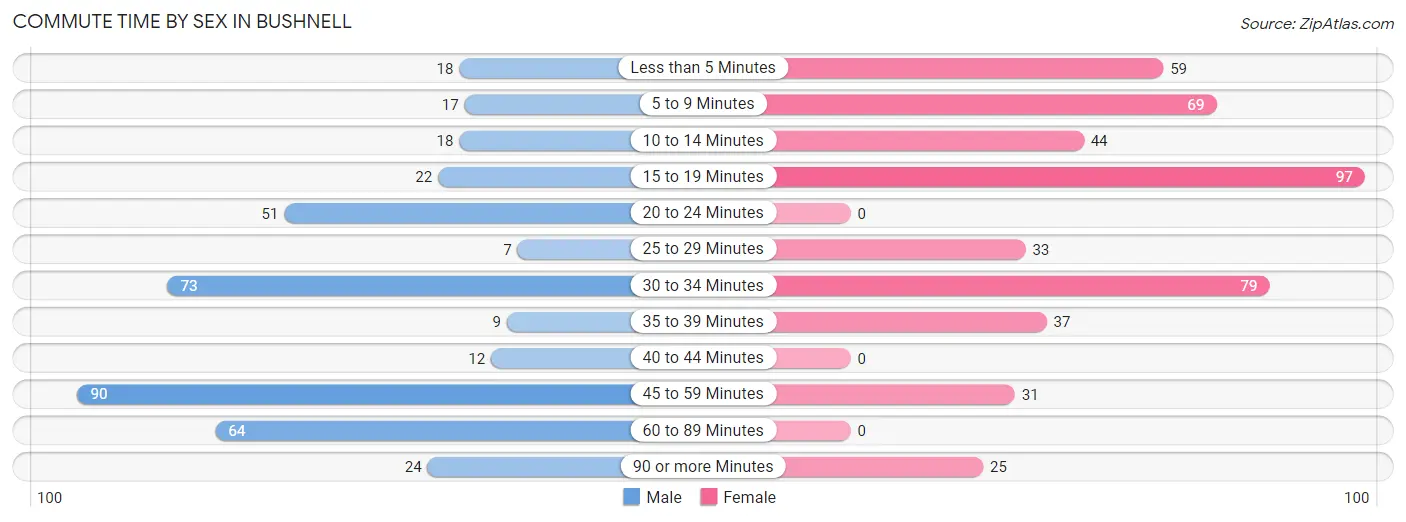
| Commute Time | Male | Female |
| Less than 5 Minutes | 18 (4.4%) | 59 (12.4%) |
| 5 to 9 Minutes | 17 (4.2%) | 69 (14.6%) |
| 10 to 14 Minutes | 18 (4.4%) | 44 (9.3%) |
| 15 to 19 Minutes | 22 (5.4%) | 97 (20.5%) |
| 20 to 24 Minutes | 51 (12.6%) | 0 (0.0%) |
| 25 to 29 Minutes | 7 (1.7%) | 33 (7.0%) |
| 30 to 34 Minutes | 73 (18.0%) | 79 (16.7%) |
| 35 to 39 Minutes | 9 (2.2%) | 37 (7.8%) |
| 40 to 44 Minutes | 12 (3.0%) | 0 (0.0%) |
| 45 to 59 Minutes | 90 (22.2%) | 31 (6.5%) |
| 60 to 89 Minutes | 64 (15.8%) | 0 (0.0%) |
| 90 or more Minutes | 24 (5.9%) | 25 (5.3%) |
Time of Departure to Work by Sex in Bushnell
The most frequent times of departure to work in Bushnell are 6:30 AM to 6:59 AM (79, 19.5%) for males and 6:30 AM to 6:59 AM (135, 28.5%) for females.
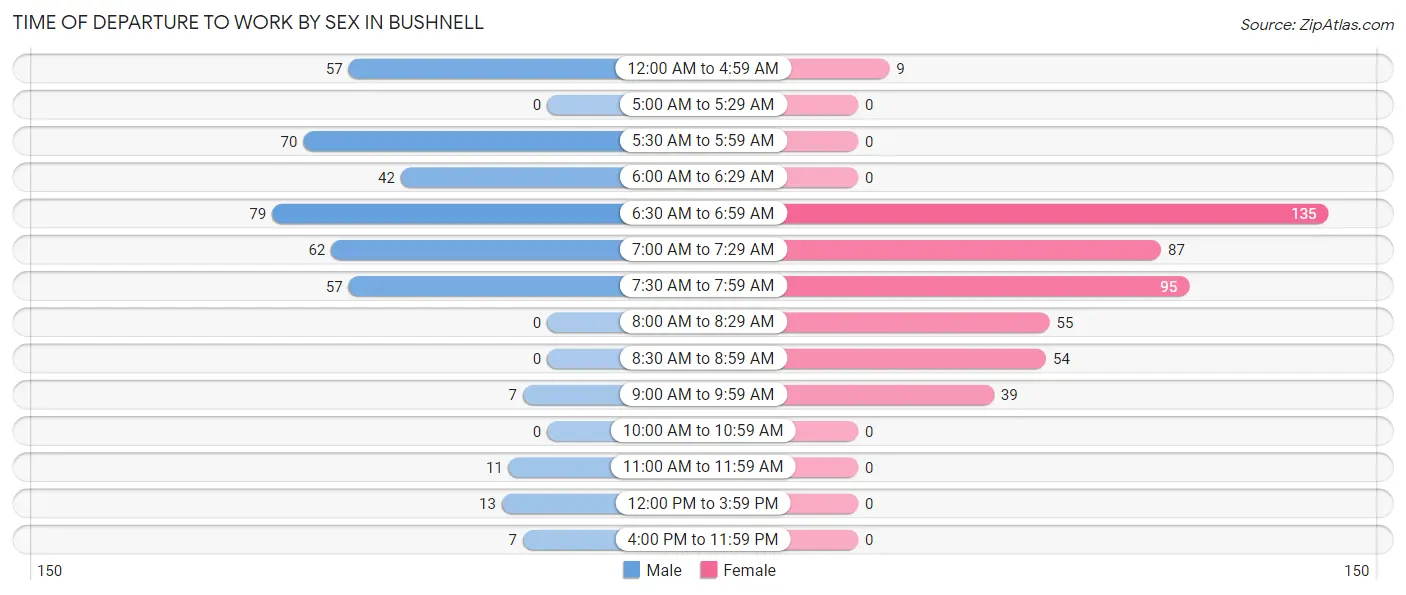
| Time of Departure | Male | Female |
| 12:00 AM to 4:59 AM | 57 (14.1%) | 9 (1.9%) |
| 5:00 AM to 5:29 AM | 0 (0.0%) | 0 (0.0%) |
| 5:30 AM to 5:59 AM | 70 (17.3%) | 0 (0.0%) |
| 6:00 AM to 6:29 AM | 42 (10.4%) | 0 (0.0%) |
| 6:30 AM to 6:59 AM | 79 (19.5%) | 135 (28.5%) |
| 7:00 AM to 7:29 AM | 62 (15.3%) | 87 (18.3%) |
| 7:30 AM to 7:59 AM | 57 (14.1%) | 95 (20.0%) |
| 8:00 AM to 8:29 AM | 0 (0.0%) | 55 (11.6%) |
| 8:30 AM to 8:59 AM | 0 (0.0%) | 54 (11.4%) |
| 9:00 AM to 9:59 AM | 7 (1.7%) | 39 (8.2%) |
| 10:00 AM to 10:59 AM | 0 (0.0%) | 0 (0.0%) |
| 11:00 AM to 11:59 AM | 11 (2.7%) | 0 (0.0%) |
| 12:00 PM to 3:59 PM | 13 (3.2%) | 0 (0.0%) |
| 4:00 PM to 11:59 PM | 7 (1.7%) | 0 (0.0%) |
| Total | 405 (100.0%) | 474 (100.0%) |
Housing Occupancy in Bushnell
Occupancy by Ownership in Bushnell
Of the total 1,182 dwellings in Bushnell, owner-occupied units account for 828 (70.1%), while renter-occupied units make up 354 (29.9%).
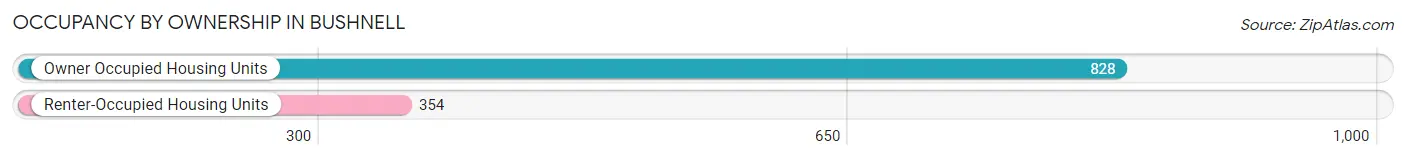
| Occupancy | # Housing Units | % Housing Units |
| Owner Occupied Housing Units | 828 | 70.1% |
| Renter-Occupied Housing Units | 354 | 29.9% |
| Total Occupied Housing Units | 1,182 | 100.0% |
Occupancy by Household Size in Bushnell
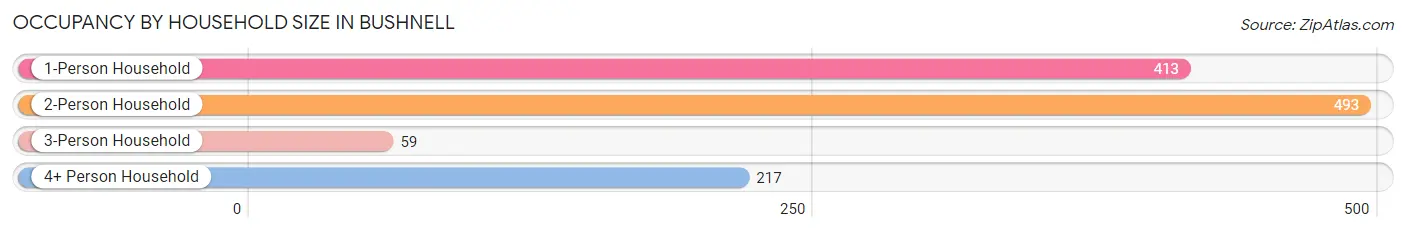
| Household Size | # Housing Units | % Housing Units |
| 1-Person Household | 413 | 34.9% |
| 2-Person Household | 493 | 41.7% |
| 3-Person Household | 59 | 5.0% |
| 4+ Person Household | 217 | 18.4% |
| Total Housing Units | 1,182 | 100.0% |
Occupancy by Ownership by Household Size in Bushnell
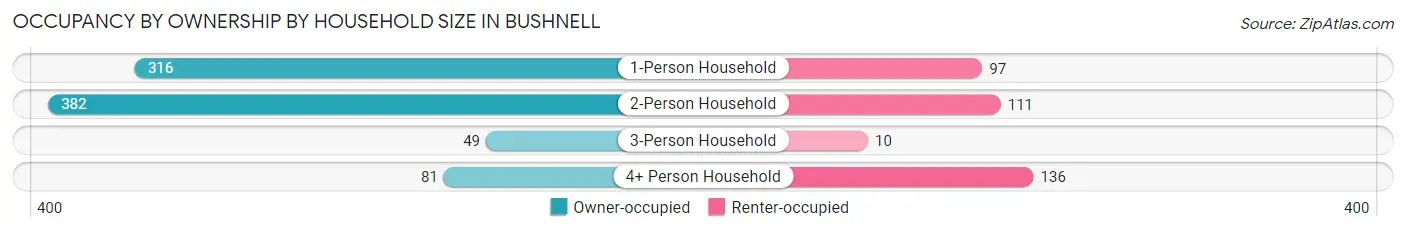
| Household Size | Owner-occupied | Renter-occupied |
| 1-Person Household | 316 (76.5%) | 97 (23.5%) |
| 2-Person Household | 382 (77.5%) | 111 (22.5%) |
| 3-Person Household | 49 (83.1%) | 10 (17.0%) |
| 4+ Person Household | 81 (37.3%) | 136 (62.7%) |
| Total Housing Units | 828 (70.1%) | 354 (29.9%) |
Occupancy by Educational Attainment in Bushnell
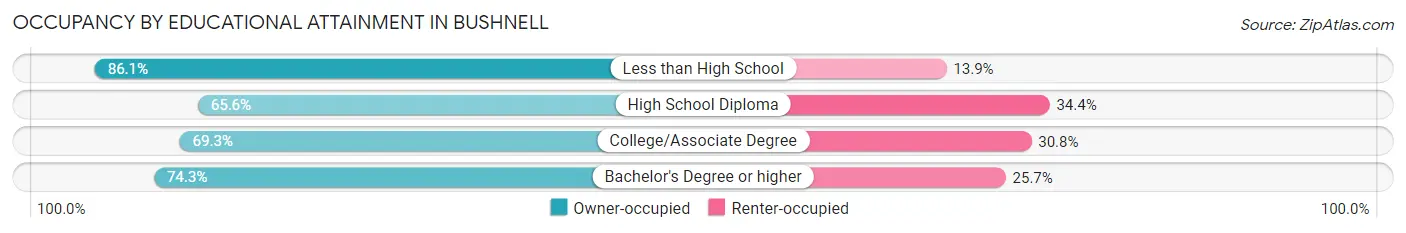
| Household Size | Owner-occupied | Renter-occupied |
| Less than High School | 105 (86.1%) | 17 (13.9%) |
| High School Diploma | 342 (65.6%) | 179 (34.4%) |
| College/Associate Degree | 268 (69.3%) | 119 (30.7%) |
| Bachelor's Degree or higher | 113 (74.3%) | 39 (25.7%) |
Occupancy by Age of Householder in Bushnell
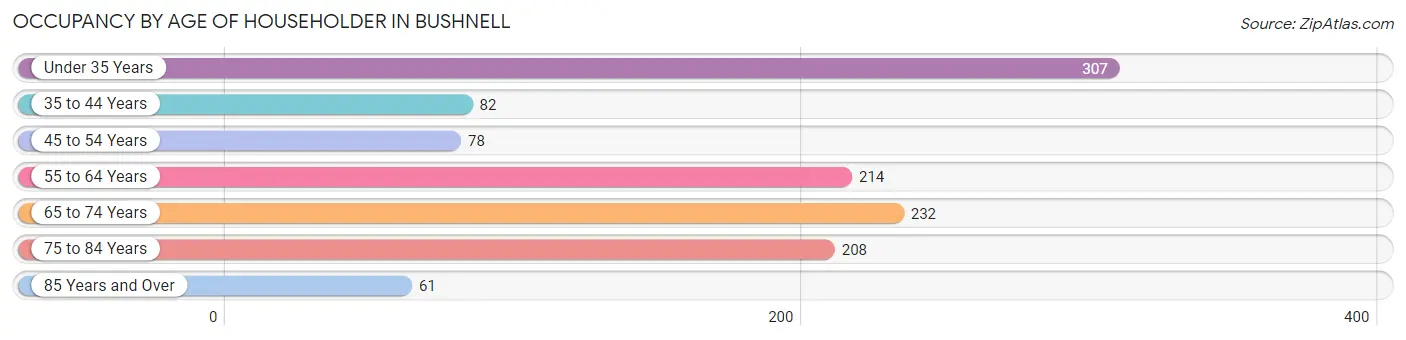
| Age Bracket | # Households | % Households |
| Under 35 Years | 307 | 26.0% |
| 35 to 44 Years | 82 | 6.9% |
| 45 to 54 Years | 78 | 6.6% |
| 55 to 64 Years | 214 | 18.1% |
| 65 to 74 Years | 232 | 19.6% |
| 75 to 84 Years | 208 | 17.6% |
| 85 Years and Over | 61 | 5.2% |
| Total | 1,182 | 100.0% |
Housing Finances in Bushnell
Median Income by Occupancy in Bushnell
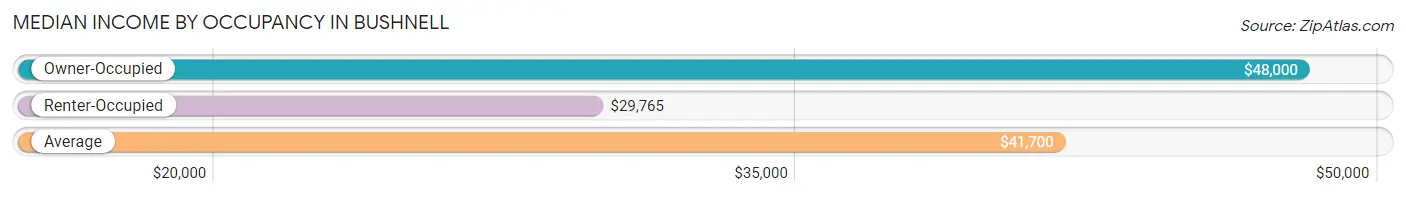
| Occupancy Type | # Households | Median Income |
| Owner-Occupied | 828 (70.1%) | $48,000 |
| Renter-Occupied | 354 (29.9%) | $29,765 |
| Average | 1,182 (100.0%) | $41,700 |
Occupancy by Householder Income Bracket in Bushnell
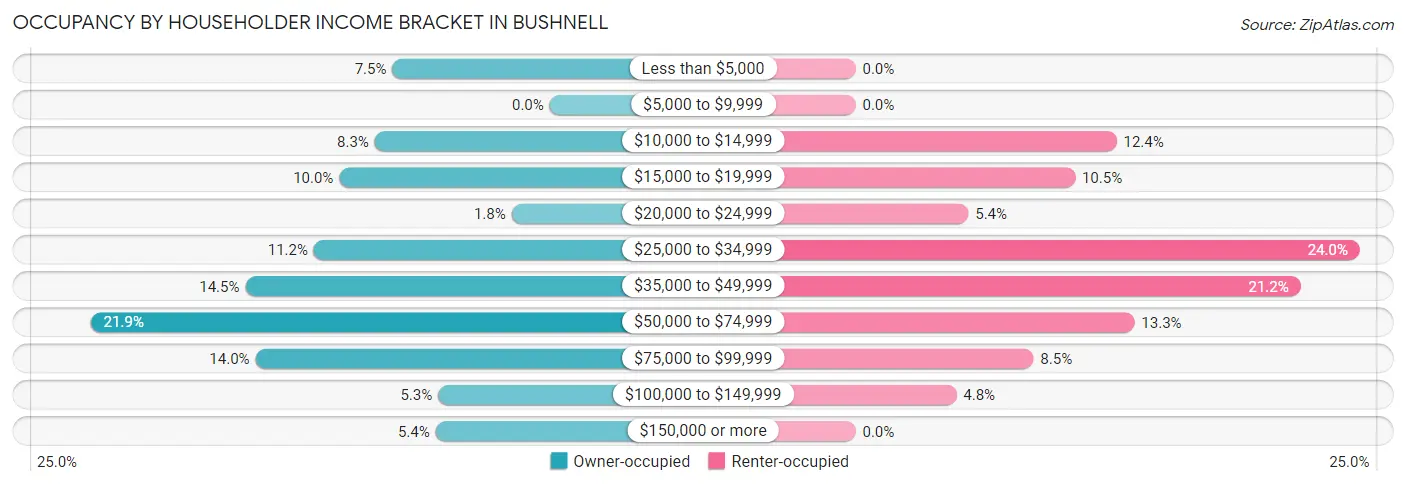
| Income Bracket | Owner-occupied | Renter-occupied |
| Less than $5,000 | 62 (7.5%) | 0 (0.0%) |
| $5,000 to $9,999 | 0 (0.0%) | 0 (0.0%) |
| $10,000 to $14,999 | 69 (8.3%) | 44 (12.4%) |
| $15,000 to $19,999 | 83 (10.0%) | 37 (10.4%) |
| $20,000 to $24,999 | 15 (1.8%) | 19 (5.4%) |
| $25,000 to $34,999 | 93 (11.2%) | 85 (24.0%) |
| $35,000 to $49,999 | 120 (14.5%) | 75 (21.2%) |
| $50,000 to $74,999 | 181 (21.9%) | 47 (13.3%) |
| $75,000 to $99,999 | 116 (14.0%) | 30 (8.5%) |
| $100,000 to $149,999 | 44 (5.3%) | 17 (4.8%) |
| $150,000 or more | 45 (5.4%) | 0 (0.0%) |
| Total | 828 (100.0%) | 354 (100.0%) |
Monthly Housing Cost Tiers in Bushnell
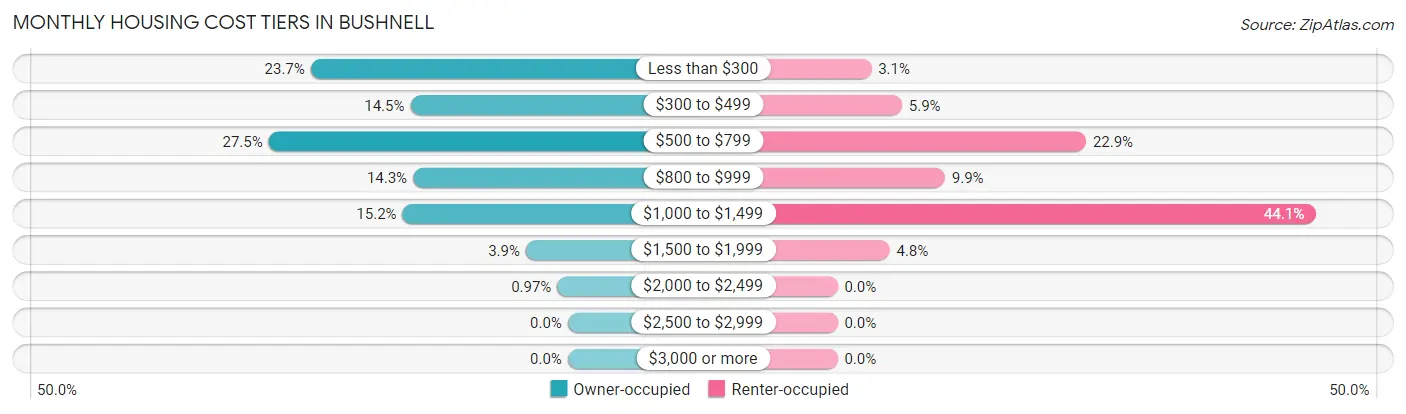
| Monthly Cost | Owner-occupied | Renter-occupied |
| Less than $300 | 196 (23.7%) | 11 (3.1%) |
| $300 to $499 | 120 (14.5%) | 21 (5.9%) |
| $500 to $799 | 228 (27.5%) | 81 (22.9%) |
| $800 to $999 | 118 (14.2%) | 35 (9.9%) |
| $1,000 to $1,499 | 126 (15.2%) | 156 (44.1%) |
| $1,500 to $1,999 | 32 (3.9%) | 17 (4.8%) |
| $2,000 to $2,499 | 8 (1.0%) | 0 (0.0%) |
| $2,500 to $2,999 | 0 (0.0%) | 0 (0.0%) |
| $3,000 or more | 0 (0.0%) | 0 (0.0%) |
| Total | 828 (100.0%) | 354 (100.0%) |
Physical Housing Characteristics in Bushnell
Housing Structures in Bushnell
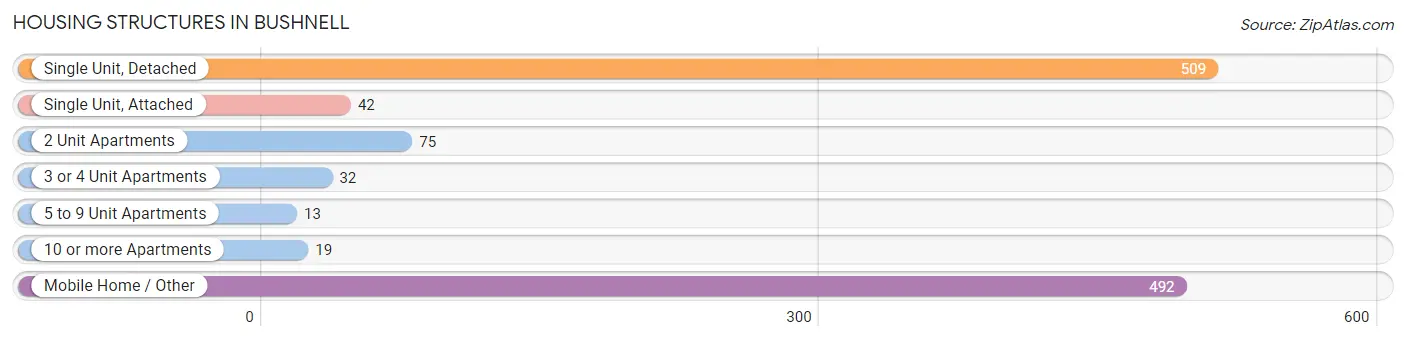
| Structure Type | # Housing Units | % Housing Units |
| Single Unit, Detached | 509 | 43.1% |
| Single Unit, Attached | 42 | 3.5% |
| 2 Unit Apartments | 75 | 6.4% |
| 3 or 4 Unit Apartments | 32 | 2.7% |
| 5 to 9 Unit Apartments | 13 | 1.1% |
| 10 or more Apartments | 19 | 1.6% |
| Mobile Home / Other | 492 | 41.6% |
| Total | 1,182 | 100.0% |
Housing Structures by Occupancy in Bushnell
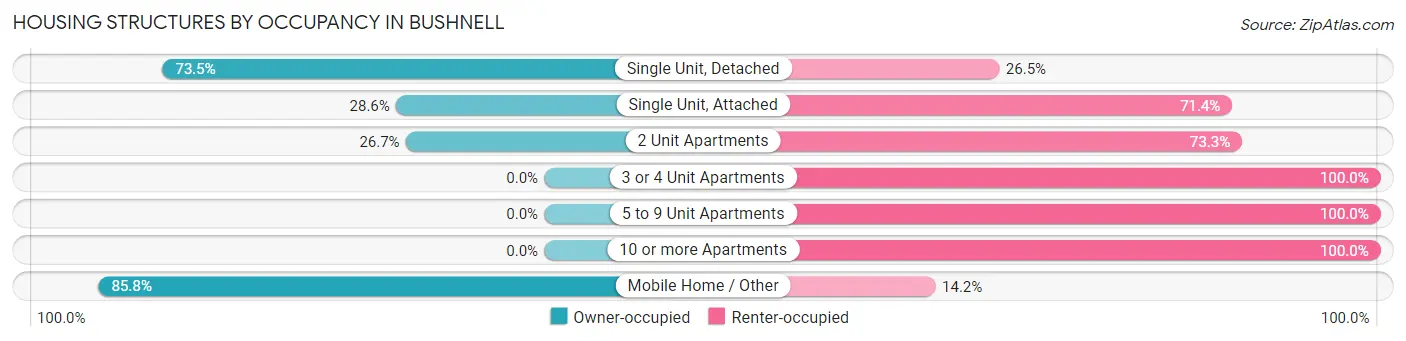
| Structure Type | Owner-occupied | Renter-occupied |
| Single Unit, Detached | 374 (73.5%) | 135 (26.5%) |
| Single Unit, Attached | 12 (28.6%) | 30 (71.4%) |
| 2 Unit Apartments | 20 (26.7%) | 55 (73.3%) |
| 3 or 4 Unit Apartments | 0 (0.0%) | 32 (100.0%) |
| 5 to 9 Unit Apartments | 0 (0.0%) | 13 (100.0%) |
| 10 or more Apartments | 0 (0.0%) | 19 (100.0%) |
| Mobile Home / Other | 422 (85.8%) | 70 (14.2%) |
| Total | 828 (70.1%) | 354 (29.9%) |
Housing Structures by Number of Rooms in Bushnell
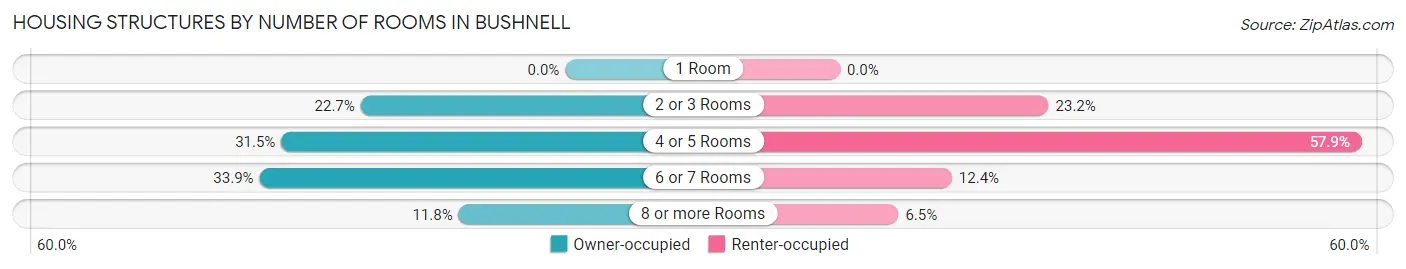
| Number of Rooms | Owner-occupied | Renter-occupied |
| 1 Room | 0 (0.0%) | 0 (0.0%) |
| 2 or 3 Rooms | 188 (22.7%) | 82 (23.2%) |
| 4 or 5 Rooms | 261 (31.5%) | 205 (57.9%) |
| 6 or 7 Rooms | 281 (33.9%) | 44 (12.4%) |
| 8 or more Rooms | 98 (11.8%) | 23 (6.5%) |
| Total | 828 (100.0%) | 354 (100.0%) |
Housing Structure by Heating Type in Bushnell
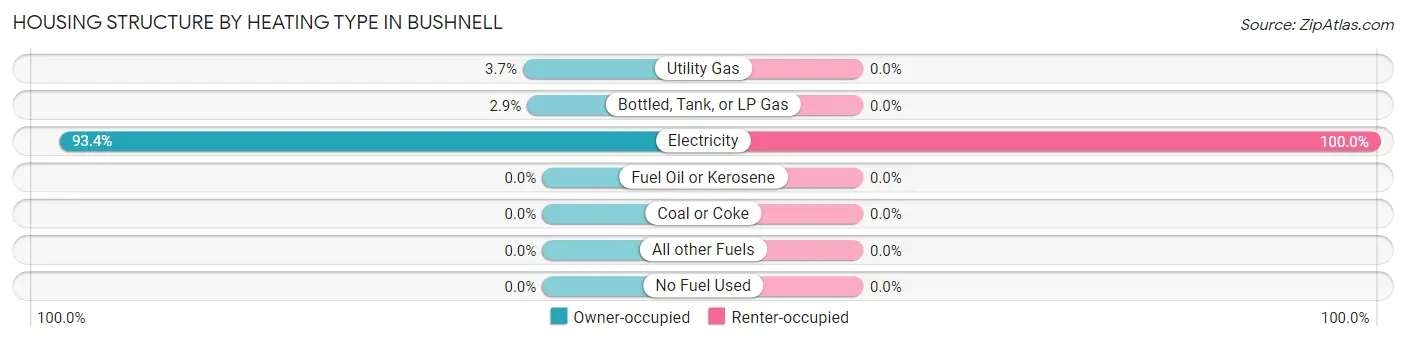
| Heating Type | Owner-occupied | Renter-occupied |
| Utility Gas | 31 (3.7%) | 0 (0.0%) |
| Bottled, Tank, or LP Gas | 24 (2.9%) | 0 (0.0%) |
| Electricity | 773 (93.4%) | 354 (100.0%) |
| Fuel Oil or Kerosene | 0 (0.0%) | 0 (0.0%) |
| Coal or Coke | 0 (0.0%) | 0 (0.0%) |
| All other Fuels | 0 (0.0%) | 0 (0.0%) |
| No Fuel Used | 0 (0.0%) | 0 (0.0%) |
| Total | 828 (100.0%) | 354 (100.0%) |
Household Vehicle Usage in Bushnell
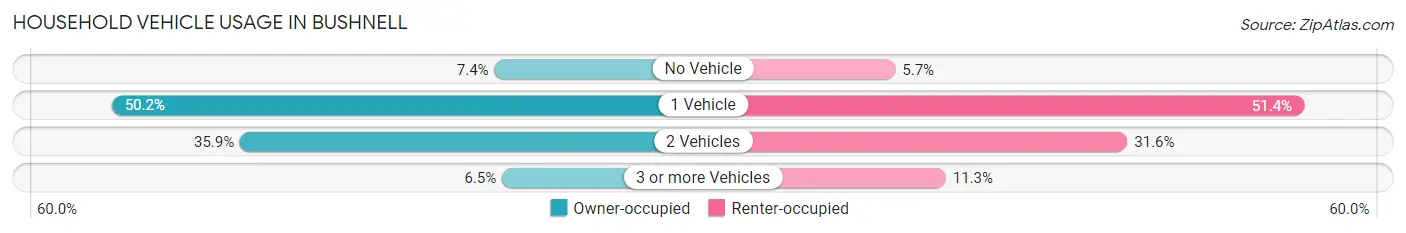
| Vehicles per Household | Owner-occupied | Renter-occupied |
| No Vehicle | 61 (7.4%) | 20 (5.7%) |
| 1 Vehicle | 416 (50.2%) | 182 (51.4%) |
| 2 Vehicles | 297 (35.9%) | 112 (31.6%) |
| 3 or more Vehicles | 54 (6.5%) | 40 (11.3%) |
| Total | 828 (100.0%) | 354 (100.0%) |
Real Estate & Mortgages in Bushnell
Real Estate and Mortgage Overview in Bushnell
| Characteristic | Without Mortgage | With Mortgage |
| Housing Units | 492 | 336 |
| Median Property Value | $26,800 | $142,200 |
| Median Household Income | $37,000 | $37 |
| Monthly Housing Costs | $407 | $0 |
| Real Estate Taxes | - | - |
Property Value by Mortgage Status in Bushnell
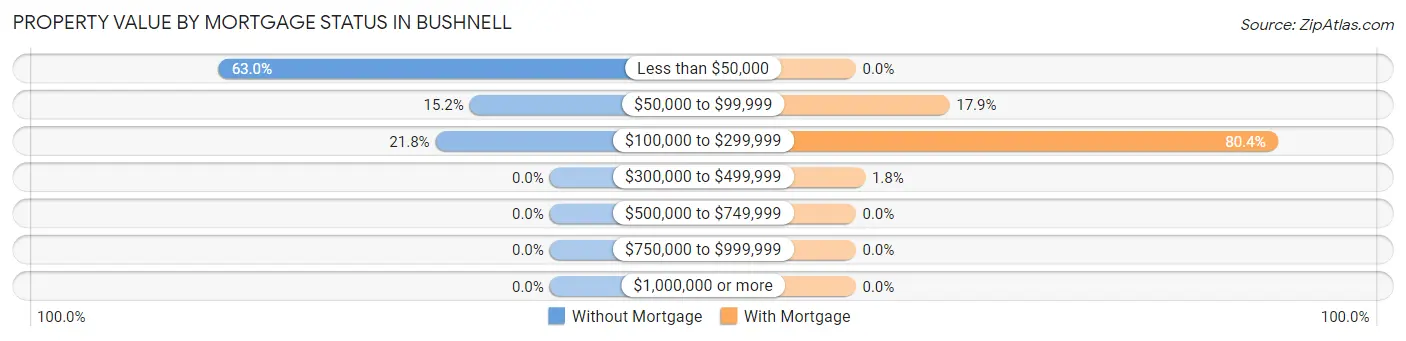
| Property Value | Without Mortgage | With Mortgage |
| Less than $50,000 | 310 (63.0%) | 0 (0.0%) |
| $50,000 to $99,999 | 75 (15.2%) | 60 (17.9%) |
| $100,000 to $299,999 | 107 (21.7%) | 270 (80.4%) |
| $300,000 to $499,999 | 0 (0.0%) | 6 (1.8%) |
| $500,000 to $749,999 | 0 (0.0%) | 0 (0.0%) |
| $750,000 to $999,999 | 0 (0.0%) | 0 (0.0%) |
| $1,000,000 or more | 0 (0.0%) | 0 (0.0%) |
| Total | 492 (100.0%) | 336 (100.0%) |
Household Income by Mortgage Status in Bushnell
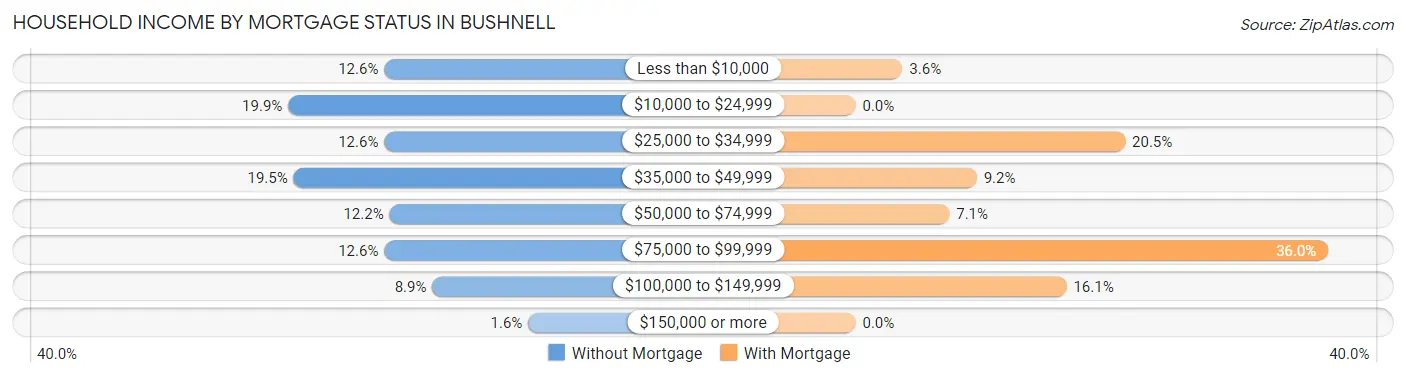
| Household Income | Without Mortgage | With Mortgage |
| Less than $10,000 | 62 (12.6%) | 12 (3.6%) |
| $10,000 to $24,999 | 98 (19.9%) | 0 (0.0%) |
| $25,000 to $34,999 | 62 (12.6%) | 69 (20.5%) |
| $35,000 to $49,999 | 96 (19.5%) | 31 (9.2%) |
| $50,000 to $74,999 | 60 (12.2%) | 24 (7.1%) |
| $75,000 to $99,999 | 62 (12.6%) | 121 (36.0%) |
| $100,000 to $149,999 | 44 (8.9%) | 54 (16.1%) |
| $150,000 or more | 8 (1.6%) | 0 (0.0%) |
| Total | 492 (100.0%) | 336 (100.0%) |
Property Value to Household Income Ratio in Bushnell
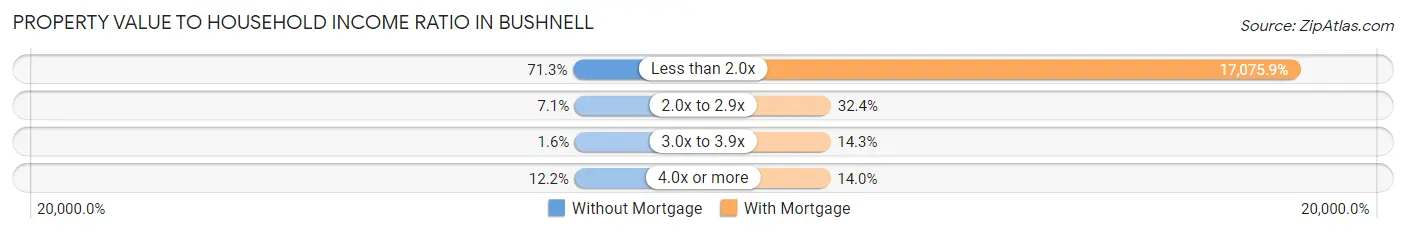
| Value-to-Income Ratio | Without Mortgage | With Mortgage |
| Less than 2.0x | 351 (71.3%) | 57,375 (17,075.9%) |
| 2.0x to 2.9x | 35 (7.1%) | 109 (32.4%) |
| 3.0x to 3.9x | 8 (1.6%) | 48 (14.3%) |
| 4.0x or more | 60 (12.2%) | 47 (14.0%) |
| Total | 492 (100.0%) | 336 (100.0%) |
Real Estate Taxes by Mortgage Status in Bushnell
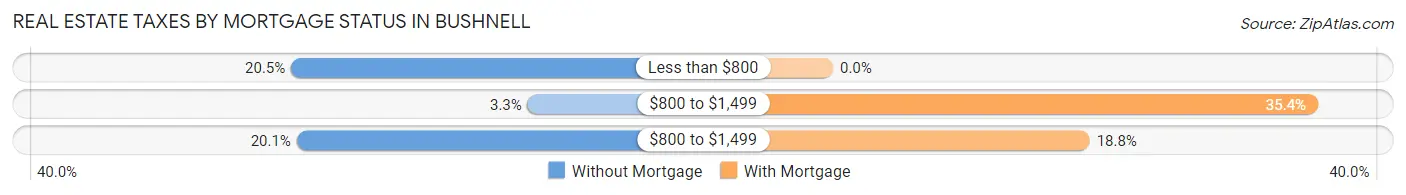
| Property Taxes | Without Mortgage | With Mortgage |
| Less than $800 | 101 (20.5%) | 0 (0.0%) |
| $800 to $1,499 | 16 (3.3%) | 119 (35.4%) |
| $800 to $1,499 | 99 (20.1%) | 63 (18.8%) |
| Total | 492 (100.0%) | 336 (100.0%) |
Health & Disability in Bushnell
Health Insurance Coverage by Age in Bushnell
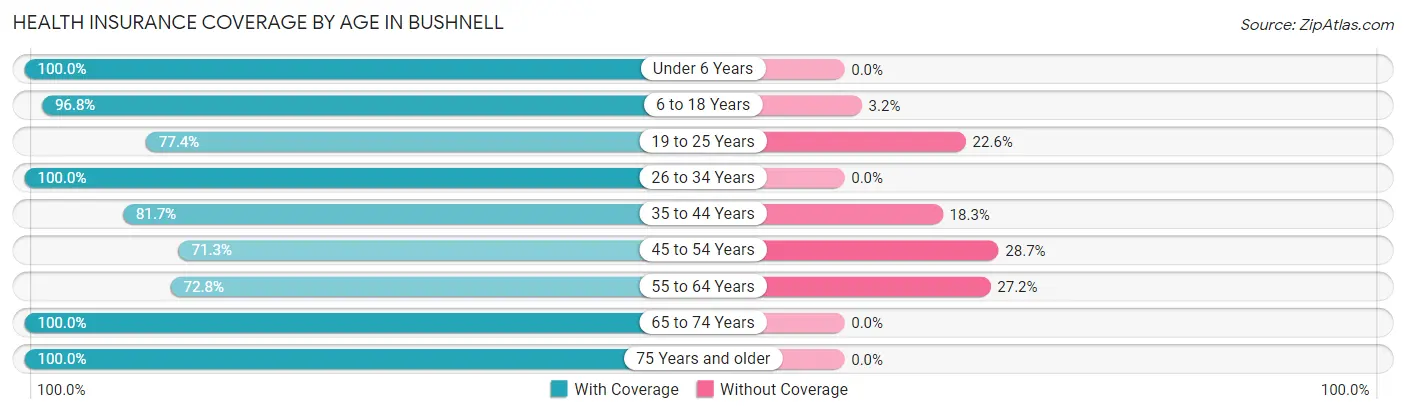
| Age Bracket | With Coverage | Without Coverage |
| Under 6 Years | 151 (100.0%) | 0 (0.0%) |
| 6 to 18 Years | 538 (96.8%) | 18 (3.2%) |
| 19 to 25 Years | 212 (77.4%) | 62 (22.6%) |
| 26 to 34 Years | 299 (100.0%) | 0 (0.0%) |
| 35 to 44 Years | 138 (81.7%) | 31 (18.3%) |
| 45 to 54 Years | 124 (71.3%) | 50 (28.7%) |
| 55 to 64 Years | 211 (72.8%) | 79 (27.2%) |
| 65 to 74 Years | 395 (100.0%) | 0 (0.0%) |
| 75 Years and older | 383 (100.0%) | 0 (0.0%) |
| Total | 2,451 (91.1%) | 240 (8.9%) |
Health Insurance Coverage by Citizenship Status in Bushnell
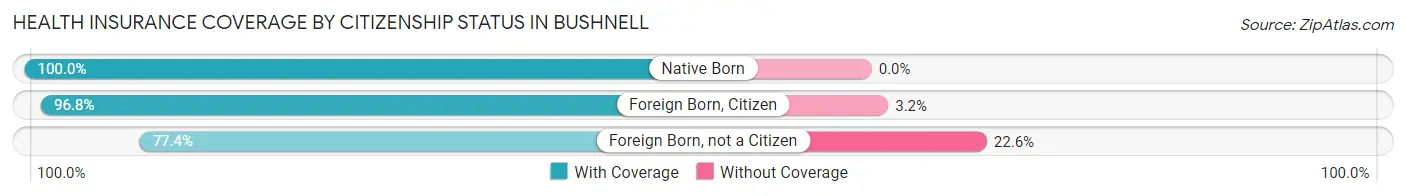
| Citizenship Status | With Coverage | Without Coverage |
| Native Born | 151 (100.0%) | 0 (0.0%) |
| Foreign Born, Citizen | 538 (96.8%) | 18 (3.2%) |
| Foreign Born, not a Citizen | 212 (77.4%) | 62 (22.6%) |
Health Insurance Coverage by Household Income in Bushnell
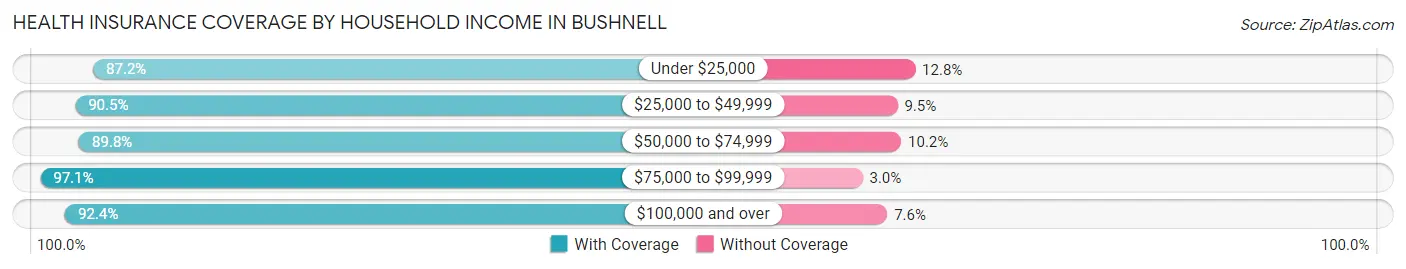
| Household Income | With Coverage | Without Coverage |
| Under $25,000 | 381 (87.2%) | 56 (12.8%) |
| $25,000 to $49,999 | 992 (90.5%) | 104 (9.5%) |
| $50,000 to $74,999 | 406 (89.8%) | 46 (10.2%) |
| $75,000 to $99,999 | 329 (97.1%) | 10 (2.9%) |
| $100,000 and over | 293 (92.4%) | 24 (7.6%) |
Public vs Private Health Insurance Coverage by Age in Bushnell
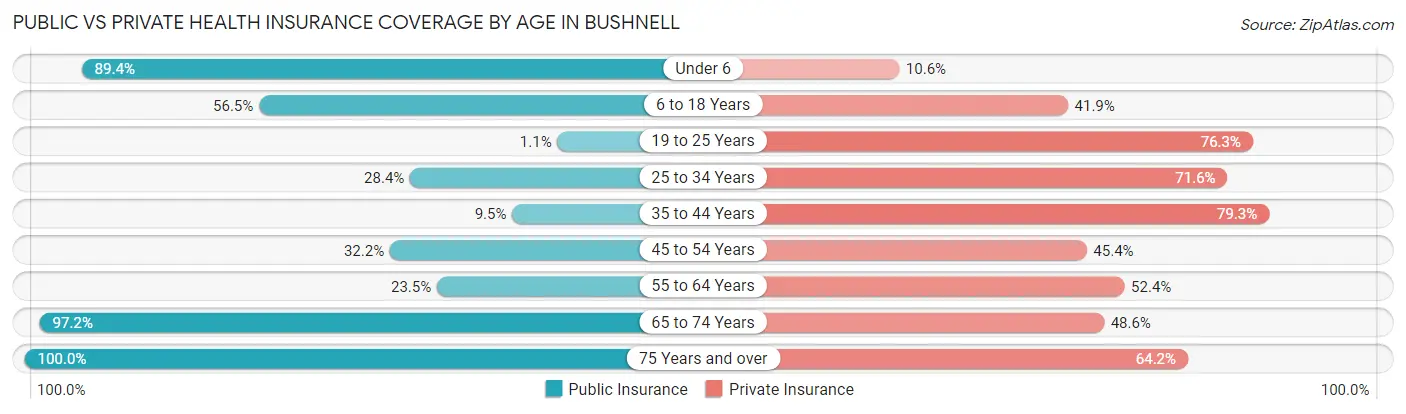
| Age Bracket | Public Insurance | Private Insurance |
| Under 6 | 135 (89.4%) | 16 (10.6%) |
| 6 to 18 Years | 314 (56.5%) | 233 (41.9%) |
| 19 to 25 Years | 3 (1.1%) | 209 (76.3%) |
| 25 to 34 Years | 85 (28.4%) | 214 (71.6%) |
| 35 to 44 Years | 16 (9.5%) | 134 (79.3%) |
| 45 to 54 Years | 56 (32.2%) | 79 (45.4%) |
| 55 to 64 Years | 68 (23.4%) | 152 (52.4%) |
| 65 to 74 Years | 384 (97.2%) | 192 (48.6%) |
| 75 Years and over | 383 (100.0%) | 246 (64.2%) |
| Total | 1,444 (53.7%) | 1,475 (54.8%) |
Disability Status by Sex by Age in Bushnell
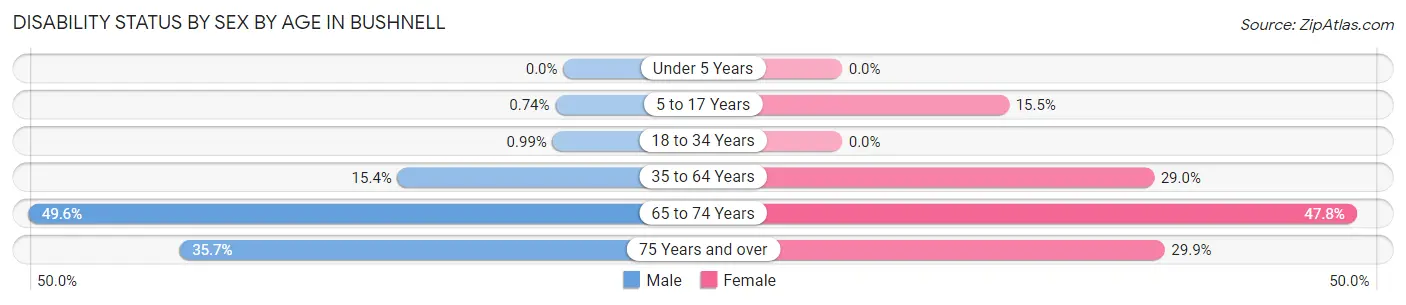
| Age Bracket | Male | Female |
| Under 5 Years | 0 (0.0%) | 0 (0.0%) |
| 5 to 17 Years | 3 (0.7%) | 22 (15.5%) |
| 18 to 34 Years | 3 (1.0%) | 0 (0.0%) |
| 35 to 64 Years | 40 (15.4%) | 108 (28.9%) |
| 65 to 74 Years | 62 (49.6%) | 129 (47.8%) |
| 75 Years and over | 77 (35.6%) | 50 (29.9%) |
Disability Class by Sex by Age in Bushnell
Disability Class: Hearing Difficulty
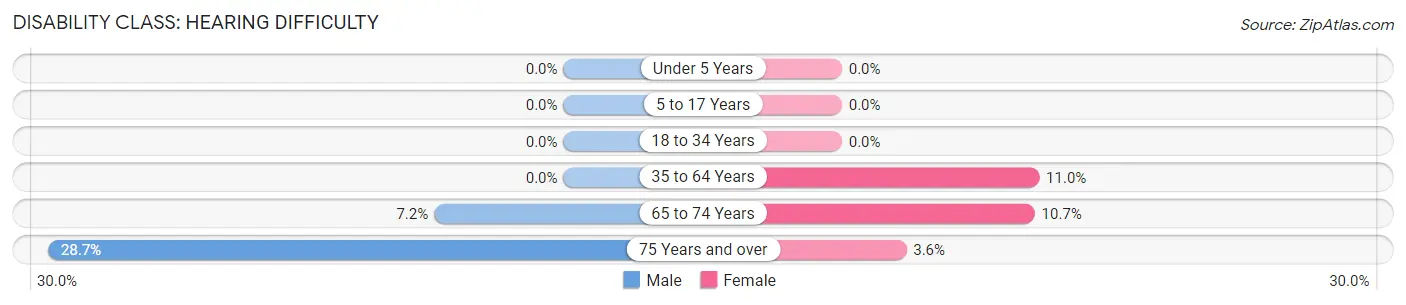
| Age Bracket | Male | Female |
| Under 5 Years | 0 (0.0%) | 0 (0.0%) |
| 5 to 17 Years | 0 (0.0%) | 0 (0.0%) |
| 18 to 34 Years | 0 (0.0%) | 0 (0.0%) |
| 35 to 64 Years | 0 (0.0%) | 41 (11.0%) |
| 65 to 74 Years | 9 (7.2%) | 29 (10.7%) |
| 75 Years and over | 62 (28.7%) | 6 (3.6%) |
Disability Class: Vision Difficulty
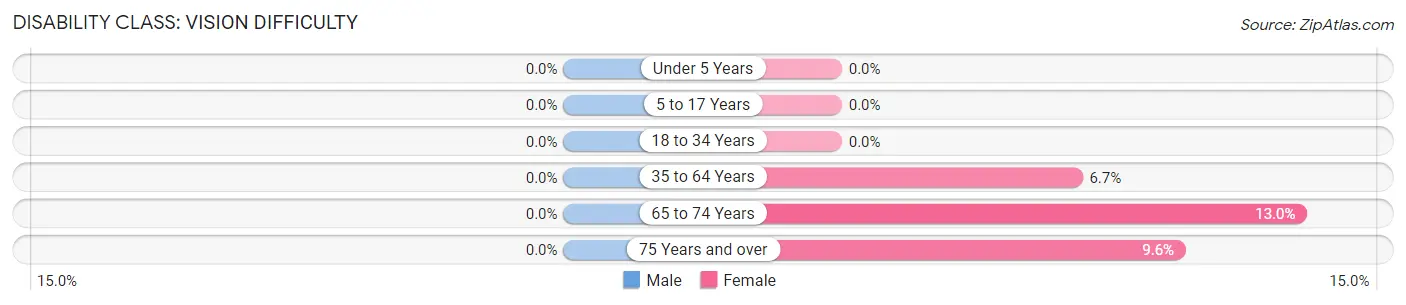
| Age Bracket | Male | Female |
| Under 5 Years | 0 (0.0%) | 0 (0.0%) |
| 5 to 17 Years | 0 (0.0%) | 0 (0.0%) |
| 18 to 34 Years | 0 (0.0%) | 0 (0.0%) |
| 35 to 64 Years | 0 (0.0%) | 25 (6.7%) |
| 65 to 74 Years | 0 (0.0%) | 35 (13.0%) |
| 75 Years and over | 0 (0.0%) | 16 (9.6%) |
Disability Class: Cognitive Difficulty
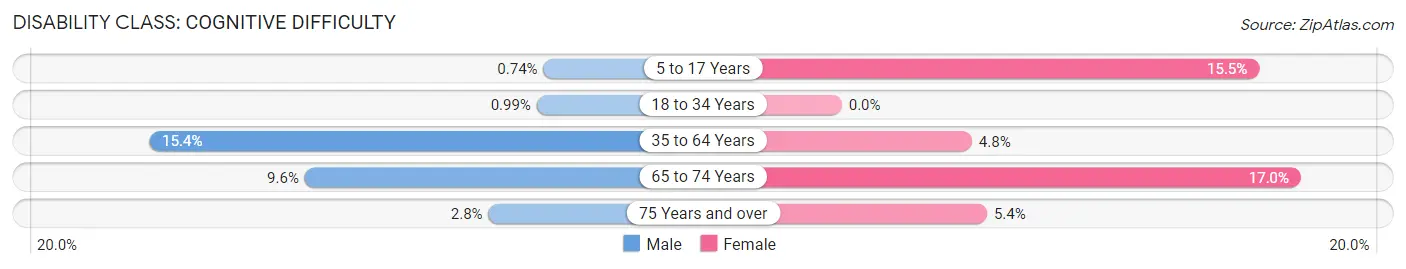
| Age Bracket | Male | Female |
| 5 to 17 Years | 3 (0.7%) | 22 (15.5%) |
| 18 to 34 Years | 3 (1.0%) | 0 (0.0%) |
| 35 to 64 Years | 40 (15.4%) | 18 (4.8%) |
| 65 to 74 Years | 12 (9.6%) | 46 (17.0%) |
| 75 Years and over | 6 (2.8%) | 9 (5.4%) |
Disability Class: Ambulatory Difficulty
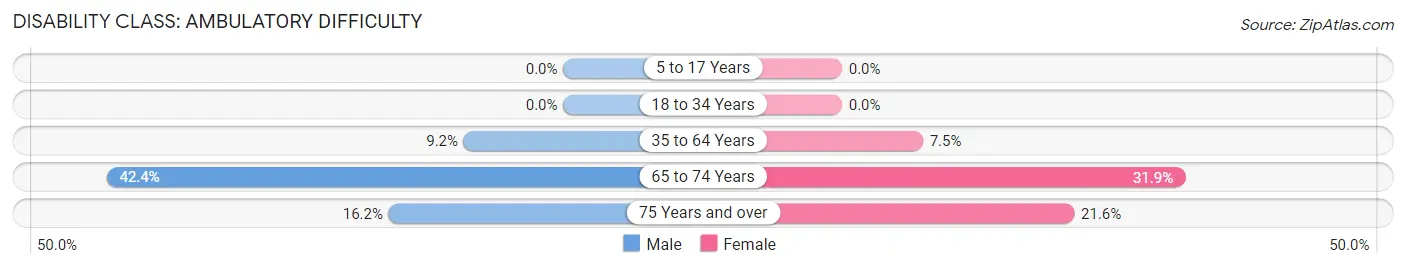
| Age Bracket | Male | Female |
| 5 to 17 Years | 0 (0.0%) | 0 (0.0%) |
| 18 to 34 Years | 0 (0.0%) | 0 (0.0%) |
| 35 to 64 Years | 24 (9.2%) | 28 (7.5%) |
| 65 to 74 Years | 53 (42.4%) | 86 (31.9%) |
| 75 Years and over | 35 (16.2%) | 36 (21.6%) |
Disability Class: Self-Care Difficulty
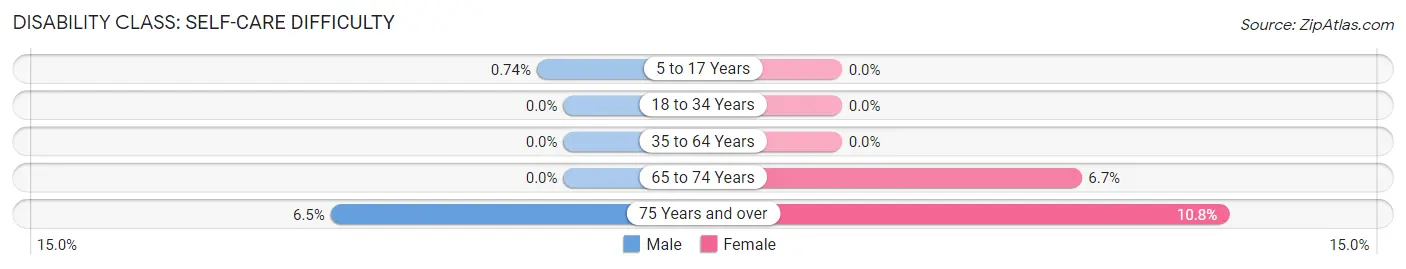
| Age Bracket | Male | Female |
| 5 to 17 Years | 3 (0.7%) | 0 (0.0%) |
| 18 to 34 Years | 0 (0.0%) | 0 (0.0%) |
| 35 to 64 Years | 0 (0.0%) | 0 (0.0%) |
| 65 to 74 Years | 0 (0.0%) | 18 (6.7%) |
| 75 Years and over | 14 (6.5%) | 18 (10.8%) |
Technology Access in Bushnell
Computing Device Access in Bushnell
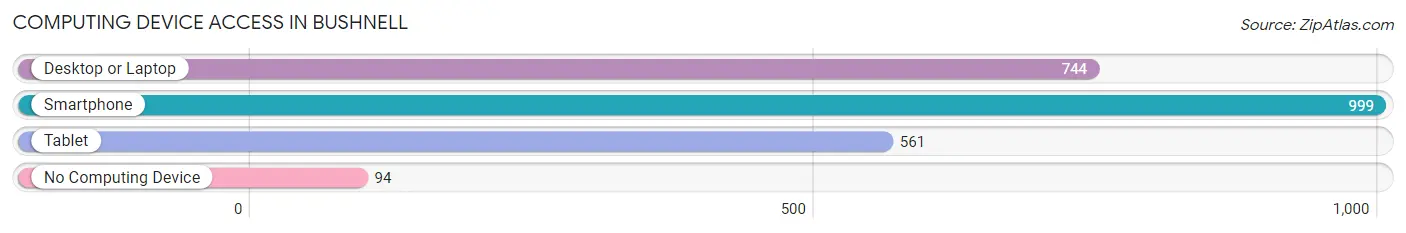
| Device Type | # Households | % Households |
| Desktop or Laptop | 744 | 62.9% |
| Smartphone | 999 | 84.5% |
| Tablet | 561 | 47.5% |
| No Computing Device | 94 | 8.0% |
| Total | 1,182 | 100.0% |
Internet Access in Bushnell
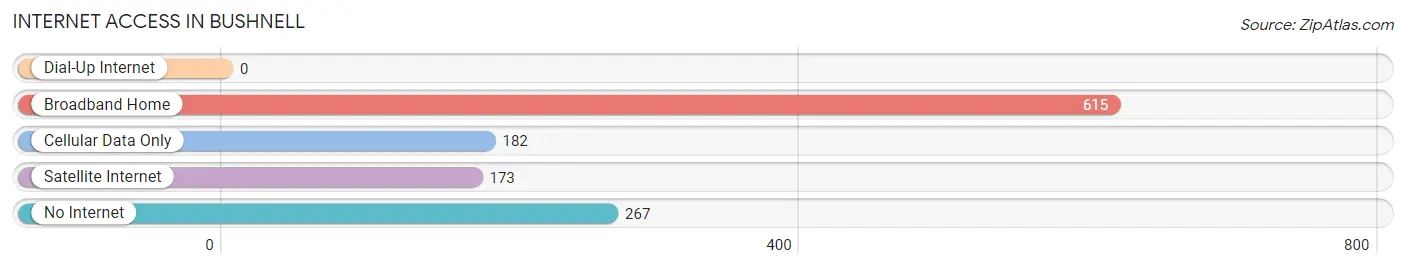
| Internet Type | # Households | % Households |
| Dial-Up Internet | 0 | 0.0% |
| Broadband Home | 615 | 52.0% |
| Cellular Data Only | 182 | 15.4% |
| Satellite Internet | 173 | 14.6% |
| No Internet | 267 | 22.6% |
| Total | 1,182 | 100.0% |
Bushnell Summary
History
The city of Bushnell, Florida is located in Sumter County, in the central part of the state. It is situated about an hour and a half from both Tampa and Orlando. The city was founded in 1883 by Captain J.B. Bushnell, a Civil War veteran who had moved to the area from Connecticut. He purchased a large tract of land and began to develop it into a town. The town was originally called Bushnell Station, but the name was changed to Bushnell in 1887.
The city of Bushnell was incorporated in 1891 and has since grown to a population of over 2,000 people. The city is home to several historic sites, including the Bushnell Depot, which was built in 1883 and is now a museum. The city also has a number of parks, including the Bushnell City Park, which was established in 1891 and is the oldest park in the city.
The city of Bushnell has a rich history of agriculture, with many of the local farms producing citrus fruits, vegetables, and other crops. The city is also home to several manufacturing companies, including a paper mill and a furniture factory.
Geography
Bushnell is located in Sumter County, in the central part of the state of Florida. The city is situated about an hour and a half from both Tampa and Orlando. The city is located in the Withlacoochee River Valley, which is a major agricultural region in the state. The city is surrounded by rolling hills and is home to several lakes, including Lake Panasoffkee, Lake Okahumpka, and Lake Sumter.
The city of Bushnell has a total area of 4.2 square miles, of which 4.1 square miles is land and 0.1 square miles is water. The city is located at an elevation of approximately 100 feet above sea level. The climate in Bushnell is classified as humid subtropical, with hot, humid summers and mild winters.
Economy
The economy of Bushnell is largely based on agriculture and manufacturing. The city is home to several farms, which produce citrus fruits, vegetables, and other crops. The city is also home to several manufacturing companies, including a paper mill and a furniture factory.
The city of Bushnell is also home to several businesses, including restaurants, retail stores, and other services. The city is also home to a number of government offices, including the Sumter County Courthouse and the Sumter County Sheriff's Office.
Demographics
As of the 2010 census, the city of Bushnell had a population of 2,073 people. The racial makeup of the city was 79.2% White, 15.3% African American, 0.4% Native American, 0.7% Asian, 0.1% Pacific Islander, 2.2% from other races, and 2.2% from two or more races. Hispanic or Latino of any race were 5.3% of the population.
The median income for a household in the city was $30,938, and the median income for a family was $37,917. The per capita income for the city was $15,945. About 17.2% of the population was below the poverty line.
Common Questions
What is Per Capita Income in Bushnell?
Per Capita income in Bushnell is $22,621.
What is the Median Family Income in Bushnell?
Median Family Income in Bushnell is $47,917.
What is the Median Household income in Bushnell?
Median Household Income in Bushnell is $41,700.
What is Income or Wage Gap in Bushnell?
Income or Wage Gap in Bushnell is 43.8%.
Women in Bushnell earn 56.2 cents for every dollar earned by a man.
What is Inequality or Gini Index in Bushnell?
Inequality or Gini Index in Bushnell is 0.43.
What is the Total Population of Bushnell?
Total Population of Bushnell is 3,081.
What is the Total Male Population of Bushnell?
Total Male Population of Bushnell is 1,630.
What is the Total Female Population of Bushnell?
Total Female Population of Bushnell is 1,451.
What is the Ratio of Males per 100 Females in Bushnell?
There are 112.34 Males per 100 Females in Bushnell.
What is the Ratio of Females per 100 Males in Bushnell?
There are 89.02 Females per 100 Males in Bushnell.
What is the Median Population Age in Bushnell?
Median Population Age in Bushnell is 41.7 Years.
What is the Average Family Size in Bushnell
Average Family Size in Bushnell is 3.0 People.
What is the Average Household Size in Bushnell
Average Household Size in Bushnell is 2.2 People.
How Large is the Labor Force in Bushnell?
There are 917 People in the Labor Forcein in Bushnell.
What is the Percentage of People in the Labor Force in Bushnell?
37.2% of People are in the Labor Force in Bushnell.