Alachua, FL Map & Demographics
Alachua Map
Alachua Overview
$36,206
PER CAPITA INCOME
$91,275
AVG FAMILY INCOME
$72,491
AVG HOUSEHOLD INCOME
25.6%
WAGE / INCOME GAP [ % ]
74.4¢/ $1
WAGE / INCOME GAP [ $ ]
$12,693
FAMILY INCOME DEFICIT
0.37
INEQUALITY / GINI INDEX
10,570
TOTAL POPULATION
4,349
MALE POPULATION
6,221
FEMALE POPULATION
69.91
MALES / 100 FEMALES
143.04
FEMALES / 100 MALES
39.9
MEDIAN AGE
3.1
AVG FAMILY SIZE
2.5
AVG HOUSEHOLD SIZE
5,048
LABOR FORCE [ PEOPLE ]
60.7%
PERCENT IN LABOR FORCE
3.9%
UNEMPLOYMENT RATE
Alachua Area Codes
Income in Alachua
Income Overview in Alachua
Per Capita Income in Alachua is $36,206, while median incomes of families and households are $91,275 and $72,491 respectively.
| Characteristic | Number | Measure |
| Per Capita Income | 10,570 | $36,206 |
| Median Family Income | 2,862 | $91,275 |
| Mean Family Income | 2,862 | $103,116 |
| Median Household Income | 4,249 | $72,491 |
| Mean Household Income | 4,249 | $86,985 |
| Income Deficit | 2,862 | $12,693 |
| Wage / Income Gap (%) | 10,570 | 25.55% |
| Wage / Income Gap ($) | 10,570 | 74.45¢ per $1 |
| Gini / Inequality Index | 10,570 | 0.37 |
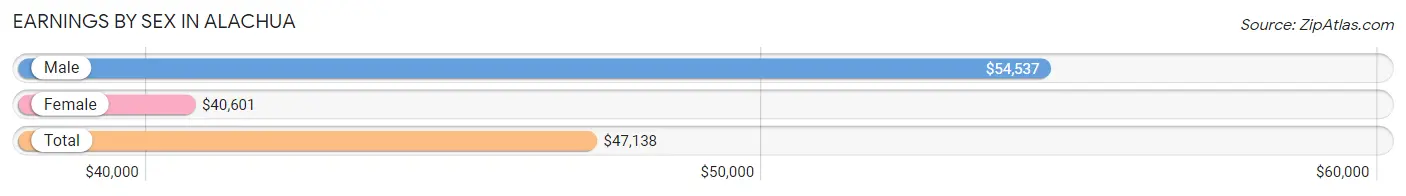
Earnings by Sex in Alachua
Average Earnings in Alachua are $47,138, $54,537 for men and $40,601 for women, a difference of 25.6%.
| Sex | Number | Average Earnings |
| Male | 2,198 (42.6%) | $54,537 |
| Female | 2,961 (57.4%) | $40,601 |
| Total | 5,159 (100.0%) | $47,138 |
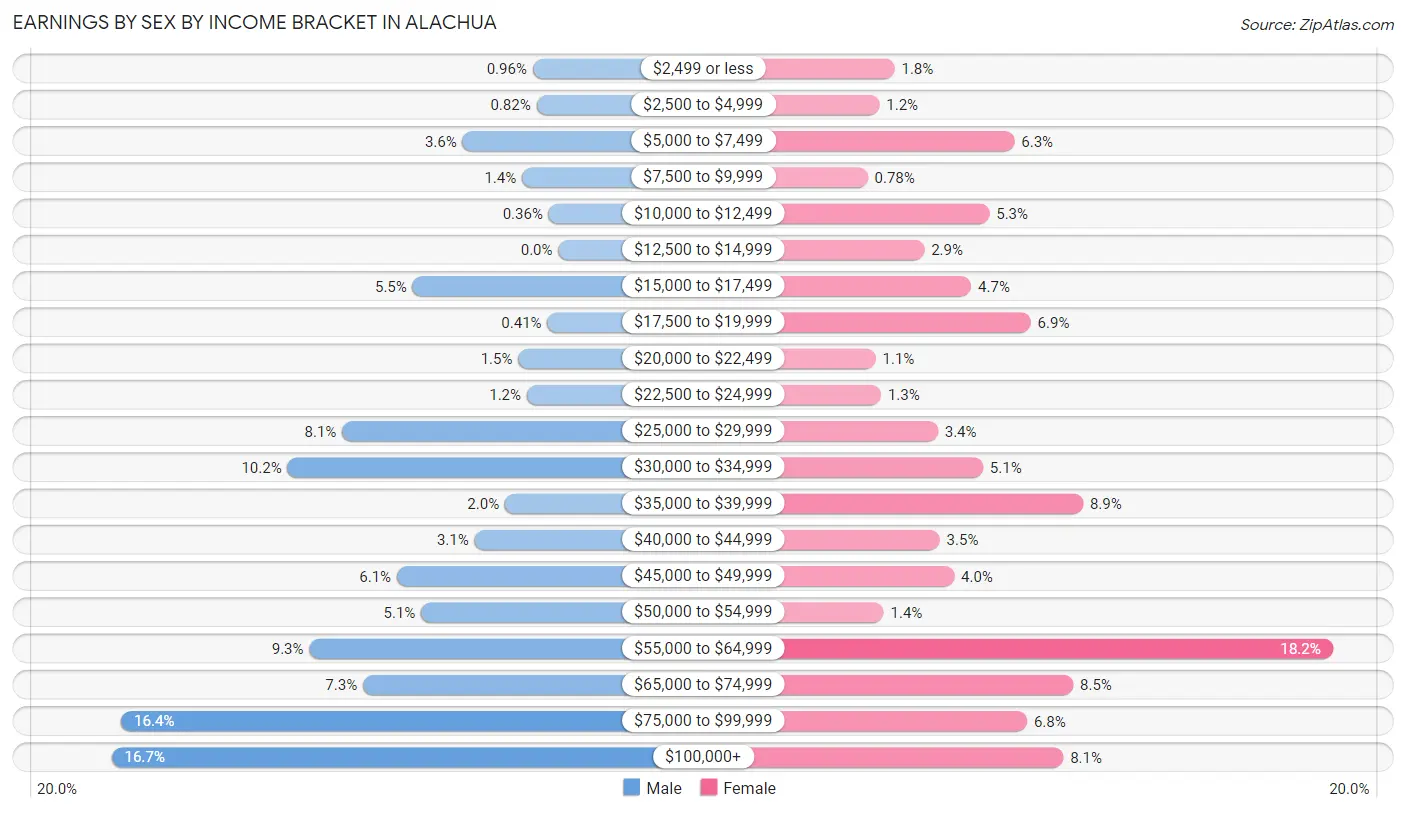
Earnings by Sex by Income Bracket in Alachua
The most common earnings brackets in Alachua are $100,000+ for men (368 | 16.7%) and $55,000 to $64,999 for women (539 | 18.2%).
| Income | Male | Female |
| $2,499 or less | 21 (1.0%) | 53 (1.8%) |
| $2,500 to $4,999 | 18 (0.8%) | 36 (1.2%) |
| $5,000 to $7,499 | 79 (3.6%) | 186 (6.3%) |
| $7,500 to $9,999 | 30 (1.4%) | 23 (0.8%) |
| $10,000 to $12,499 | 8 (0.4%) | 158 (5.3%) |
| $12,500 to $14,999 | 0 (0.0%) | 86 (2.9%) |
| $15,000 to $17,499 | 120 (5.5%) | 138 (4.7%) |
| $17,500 to $19,999 | 9 (0.4%) | 204 (6.9%) |
| $20,000 to $22,499 | 33 (1.5%) | 32 (1.1%) |
| $22,500 to $24,999 | 26 (1.2%) | 38 (1.3%) |
| $25,000 to $29,999 | 178 (8.1%) | 101 (3.4%) |
| $30,000 to $34,999 | 223 (10.2%) | 151 (5.1%) |
| $35,000 to $39,999 | 44 (2.0%) | 262 (8.8%) |
| $40,000 to $44,999 | 69 (3.1%) | 103 (3.5%) |
| $45,000 to $49,999 | 133 (6.0%) | 119 (4.0%) |
| $50,000 to $54,999 | 113 (5.1%) | 41 (1.4%) |
| $55,000 to $64,999 | 205 (9.3%) | 539 (18.2%) |
| $65,000 to $74,999 | 161 (7.3%) | 251 (8.5%) |
| $75,000 to $99,999 | 360 (16.4%) | 200 (6.8%) |
| $100,000+ | 368 (16.7%) | 240 (8.1%) |
| Total | 2,198 (100.0%) | 2,961 (100.0%) |
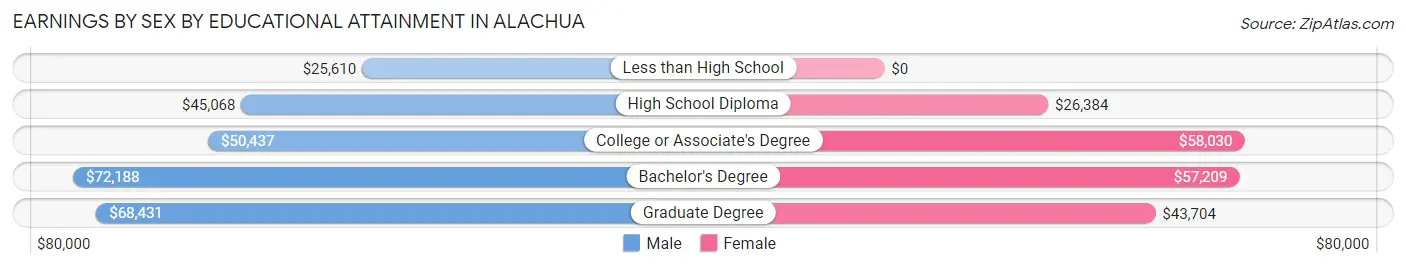
Earnings by Sex by Educational Attainment in Alachua
Average earnings in Alachua are $58,815 for men and $49,419 for women, a difference of 16.0%. Men with an educational attainment of bachelor's degree enjoy the highest average annual earnings of $72,188, while those with less than high school education earn the least with $25,610. Women with an educational attainment of college or associate's degree earn the most with the average annual earnings of $58,030, while those with high school diploma education have the smallest earnings of $26,384.
| Educational Attainment | Male Income | Female Income |
| Less than High School | $25,610 | $0 |
| High School Diploma | $45,068 | $26,384 |
| College or Associate's Degree | $50,437 | $58,030 |
| Bachelor's Degree | $72,188 | $57,209 |
| Graduate Degree | $68,431 | $43,704 |
| Total | $58,815 | $49,419 |
Family Income in Alachua
Family Income Brackets in Alachua
According to the Alachua family income data, there are 804 families falling into the $100,000 to $149,999 income range, which is the most common income bracket and makes up 28.1% of all families.
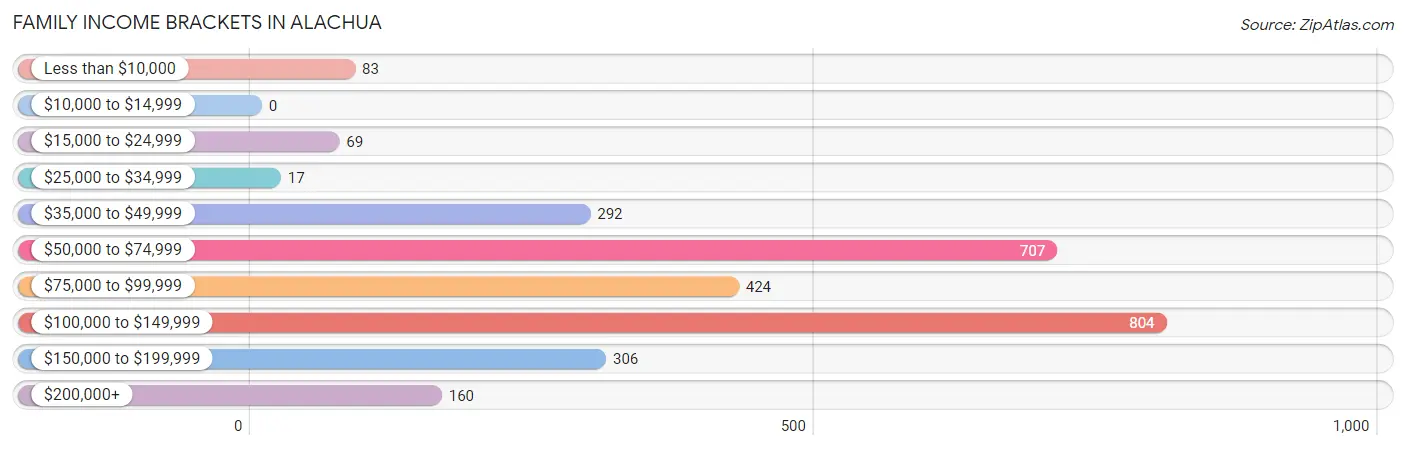
| Income Bracket | # Families | % Families |
| Less than $10,000 | 83 | 2.9% |
| $10,000 to $14,999 | 0 | 0.0% |
| $15,000 to $24,999 | 69 | 2.4% |
| $25,000 to $34,999 | 17 | 0.6% |
| $35,000 to $49,999 | 292 | 10.2% |
| $50,000 to $74,999 | 707 | 24.7% |
| $75,000 to $99,999 | 424 | 14.8% |
| $100,000 to $149,999 | 804 | 28.1% |
| $150,000 to $199,999 | 306 | 10.7% |
| $200,000+ | 160 | 5.6% |
Family Income by Famaliy Size in Alachua
4-person families (426 | 14.9%) account for the highest median family income in Alachua with $124,808 per family, while 2-person families (1,482 | 51.8%) have the highest median income of $43,112 per family member.
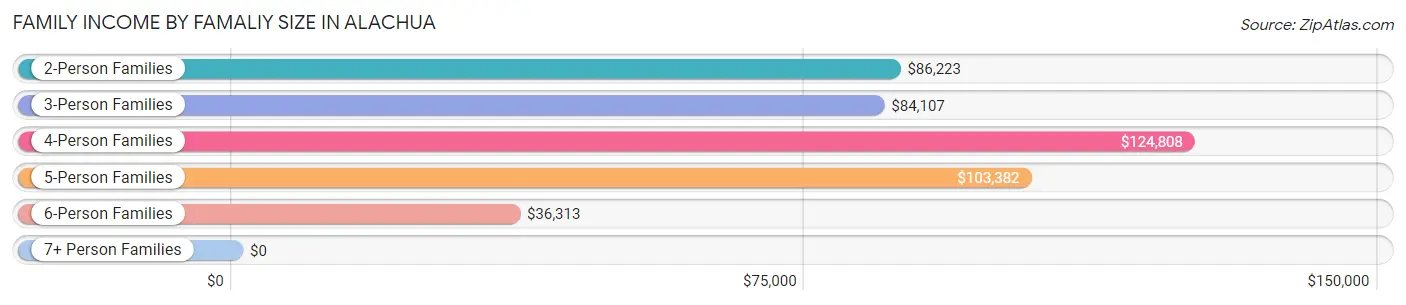
| Income Bracket | # Families | Median Income |
| 2-Person Families | 1,482 (51.8%) | $86,223 |
| 3-Person Families | 713 (24.9%) | $84,107 |
| 4-Person Families | 426 (14.9%) | $124,808 |
| 5-Person Families | 138 (4.8%) | $103,382 |
| 6-Person Families | 74 (2.6%) | $36,313 |
| 7+ Person Families | 29 (1.0%) | $0 |
| Total | 2,862 (100.0%) | $91,275 |
Family Income by Number of Earners in Alachua
The median family income in Alachua is $91,275, with families comprising 3+ earners (190) having the highest median family income of $183,509, while families with no earners (557) have the lowest median family income of $71,056, accounting for 6.6% and 19.5% of families, respectively.
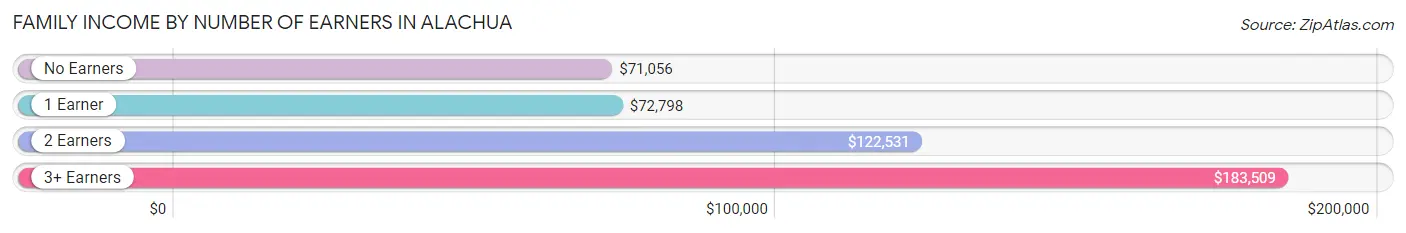
| Number of Earners | # Families | Median Income |
| No Earners | 557 (19.5%) | $71,056 |
| 1 Earner | 1,008 (35.2%) | $72,798 |
| 2 Earners | 1,107 (38.7%) | $122,531 |
| 3+ Earners | 190 (6.6%) | $183,509 |
| Total | 2,862 (100.0%) | $91,275 |
Household Income in Alachua
Household Income Brackets in Alachua
With 1,190 households falling in the category, the $50,000 to $74,999 income range is the most frequent in Alachua, accounting for 28.0% of all households. In contrast, only 76 households (1.8%) fall into the $10,000 to $14,999 income bracket, making it the least populous group.
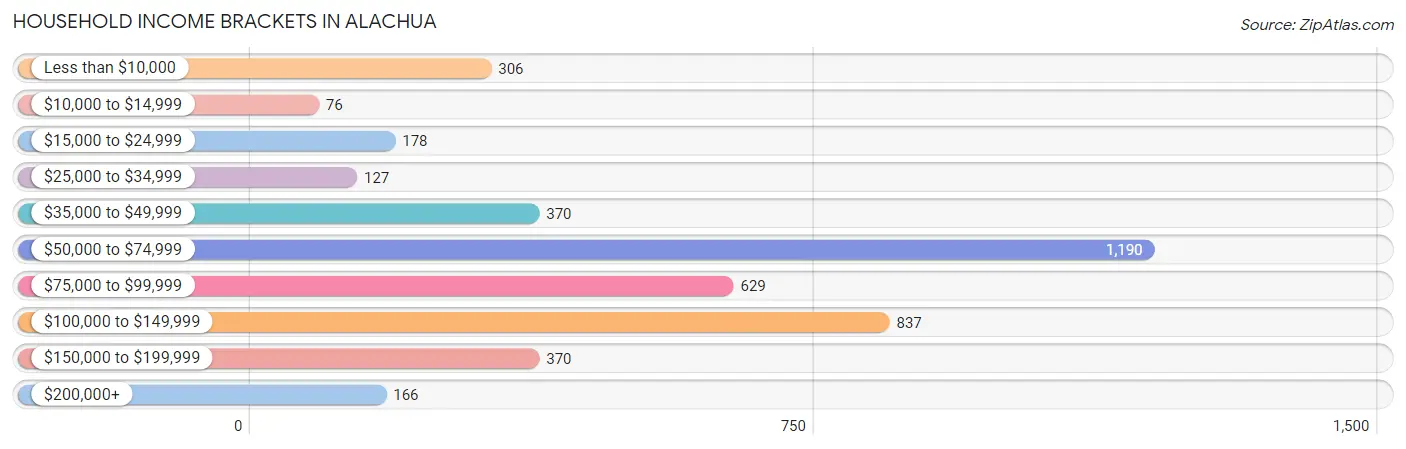
| Income Bracket | # Households | % Households |
| Less than $10,000 | 306 | 7.2% |
| $10,000 to $14,999 | 76 | 1.8% |
| $15,000 to $24,999 | 178 | 4.2% |
| $25,000 to $34,999 | 127 | 3.0% |
| $35,000 to $49,999 | 370 | 8.7% |
| $50,000 to $74,999 | 1,190 | 28.0% |
| $75,000 to $99,999 | 629 | 14.8% |
| $100,000 to $149,999 | 837 | 19.7% |
| $150,000 to $199,999 | 370 | 8.7% |
| $200,000+ | 166 | 3.9% |
Household Income by Householder Age in Alachua
The median household income in Alachua is $72,491, with the highest median household income of $85,486 found in the 45 to 64 years age bracket for the primary householder. A total of 1,477 households (34.8%) fall into this category. Meanwhile, the 15 to 24 years age bracket for the primary householder has the lowest median household income of $0, with 80 households (1.9%) in this group.
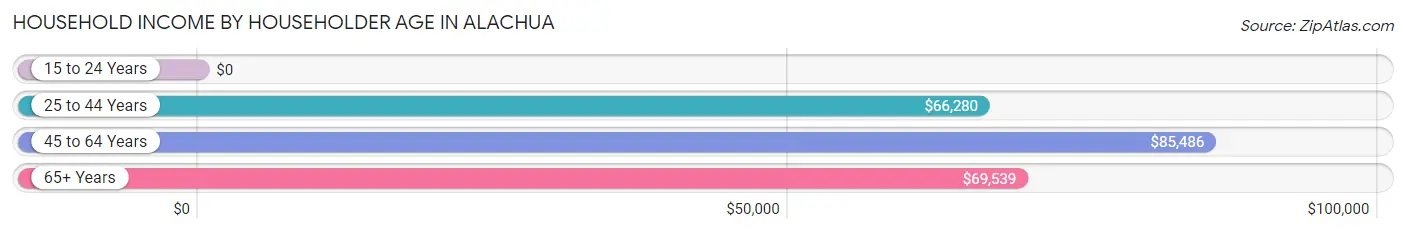
| Income Bracket | # Households | Median Income |
| 15 to 24 Years | 80 (1.9%) | $0 |
| 25 to 44 Years | 1,383 (32.6%) | $66,280 |
| 45 to 64 Years | 1,477 (34.8%) | $85,486 |
| 65+ Years | 1,309 (30.8%) | $69,539 |
| Total | 4,249 (100.0%) | $72,491 |
Poverty in Alachua
Income Below Poverty by Sex and Age in Alachua
With 6.6% poverty level for males and 17.2% for females among the residents of Alachua, 15 year old males and 15 year old females are the most vulnerable to poverty, with 20 males (32.8%) and 24 females (61.5%) in their respective age groups living below the poverty level.
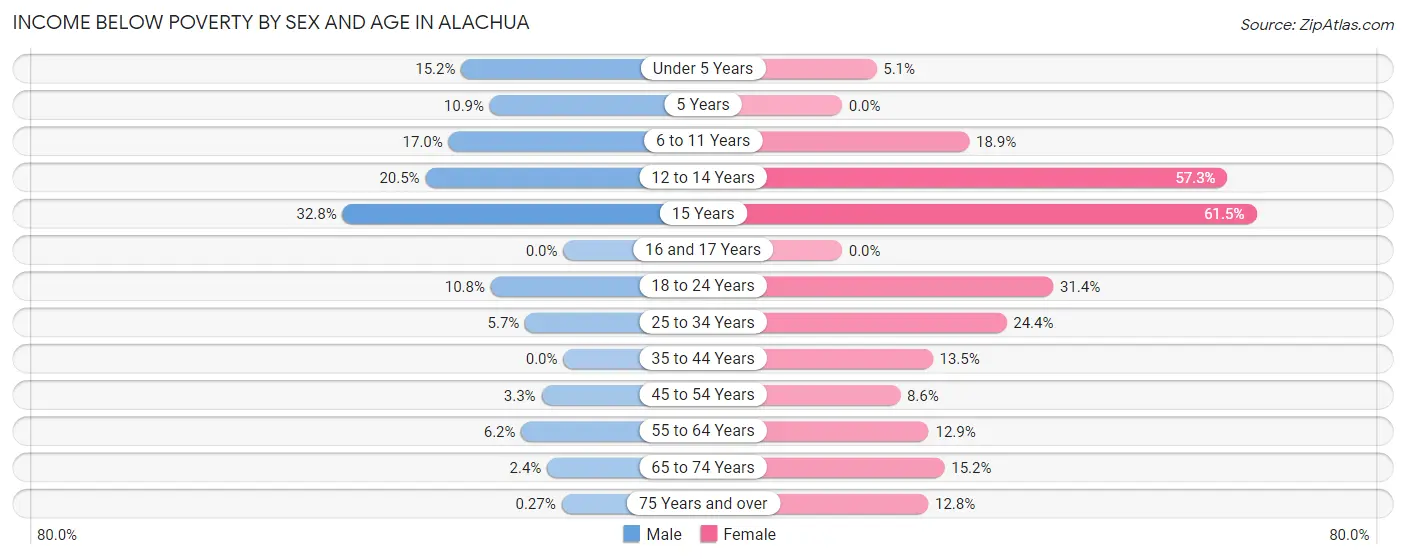
| Age Bracket | Male | Female |
| Under 5 Years | 45 (15.1%) | 23 (5.1%) |
| 5 Years | 6 (10.9%) | 0 (0.0%) |
| 6 to 11 Years | 77 (17.0%) | 86 (18.9%) |
| 12 to 14 Years | 17 (20.5%) | 138 (57.3%) |
| 15 Years | 20 (32.8%) | 24 (61.5%) |
| 16 and 17 Years | 0 (0.0%) | 0 (0.0%) |
| 18 to 24 Years | 18 (10.8%) | 144 (31.4%) |
| 25 to 34 Years | 31 (5.7%) | 222 (24.4%) |
| 35 to 44 Years | 0 (0.0%) | 98 (13.5%) |
| 45 to 54 Years | 12 (3.3%) | 64 (8.6%) |
| 55 to 64 Years | 45 (6.2%) | 98 (12.9%) |
| 65 to 74 Years | 14 (2.4%) | 128 (15.2%) |
| 75 Years and over | 1 (0.3%) | 41 (12.8%) |
| Total | 286 (6.6%) | 1,066 (17.2%) |
Income Above Poverty by Sex and Age in Alachua
According to the poverty statistics in Alachua, males aged 16 and 17 years and females aged 5 years are the age groups that are most secure financially, with 100.0% of males and 100.0% of females in these age groups living above the poverty line.
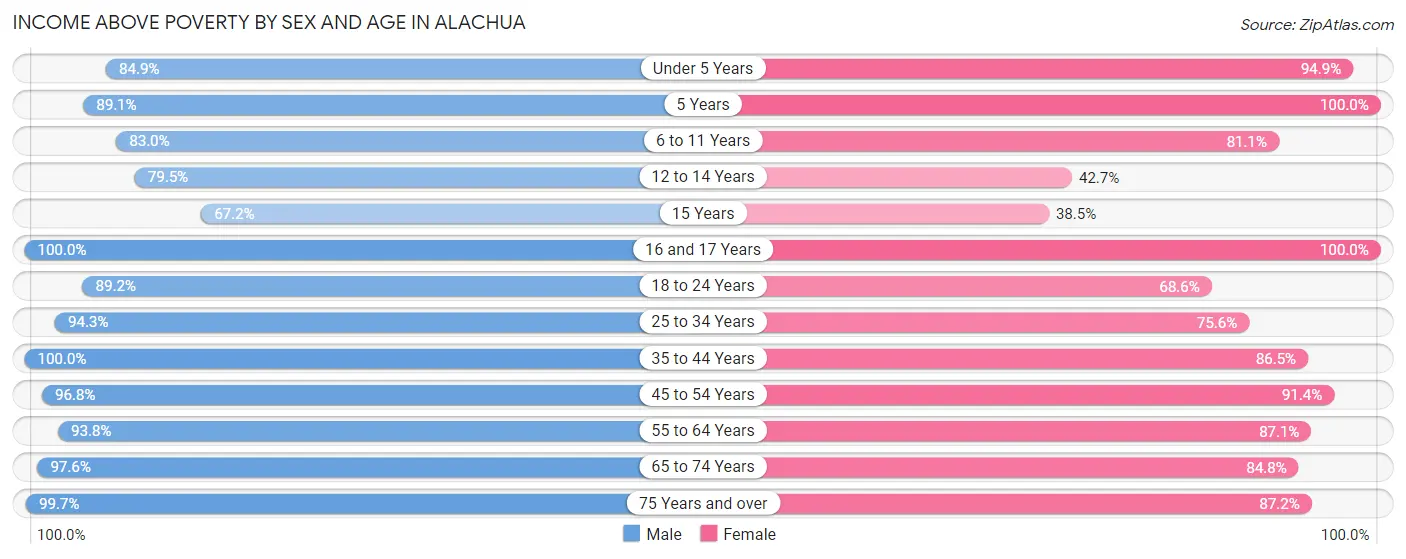
| Age Bracket | Male | Female |
| Under 5 Years | 252 (84.9%) | 426 (94.9%) |
| 5 Years | 49 (89.1%) | 72 (100.0%) |
| 6 to 11 Years | 375 (83.0%) | 369 (81.1%) |
| 12 to 14 Years | 66 (79.5%) | 103 (42.7%) |
| 15 Years | 41 (67.2%) | 15 (38.5%) |
| 16 and 17 Years | 82 (100.0%) | 180 (100.0%) |
| 18 to 24 Years | 149 (89.2%) | 315 (68.6%) |
| 25 to 34 Years | 516 (94.3%) | 687 (75.6%) |
| 35 to 44 Years | 531 (100.0%) | 629 (86.5%) |
| 45 to 54 Years | 357 (96.8%) | 677 (91.4%) |
| 55 to 64 Years | 677 (93.8%) | 663 (87.1%) |
| 65 to 74 Years | 570 (97.6%) | 713 (84.8%) |
| 75 Years and over | 375 (99.7%) | 279 (87.2%) |
| Total | 4,040 (93.4%) | 5,128 (82.8%) |
Income Below Poverty Among Married-Couple Families in Alachua
The poverty statistics for married-couple families in Alachua show that 4.2% or 90 of the total 2,160 families live below the poverty line. Families with 3 or 4 children have the highest poverty rate of 32.8%, comprising of 40 families. On the other hand, families with no children have the lowest poverty rate of 0.4%, which includes 6 families.
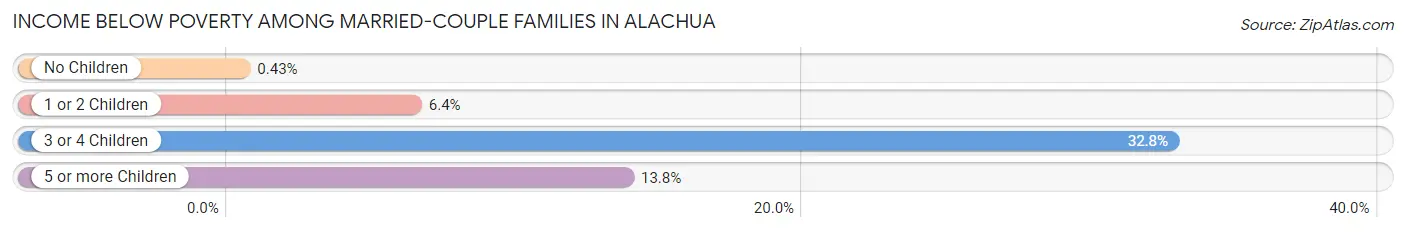
| Children | Above Poverty | Below Poverty |
| No Children | 1,378 (99.6%) | 6 (0.4%) |
| 1 or 2 Children | 585 (93.6%) | 40 (6.4%) |
| 3 or 4 Children | 82 (67.2%) | 40 (32.8%) |
| 5 or more Children | 25 (86.2%) | 4 (13.8%) |
| Total | 2,070 (95.8%) | 90 (4.2%) |
Income Below Poverty Among Single-Parent Households in Alachua
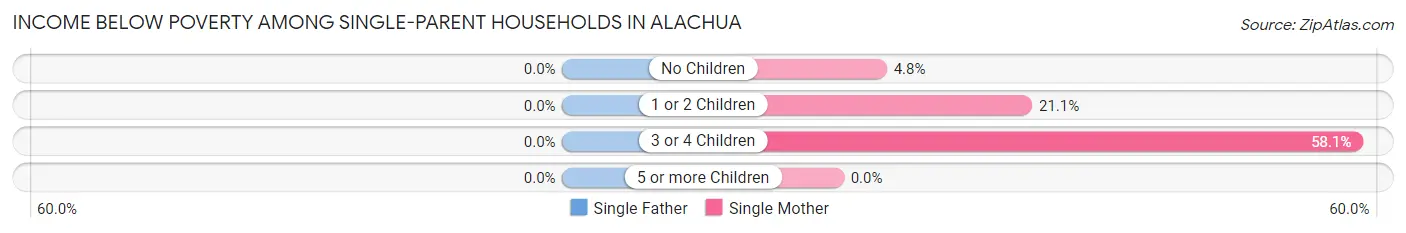
| Children | Single Father | Single Mother |
| No Children | 0 (0.0%) | 9 (4.8%) |
| 1 or 2 Children | 0 (0.0%) | 64 (21.0%) |
| 3 or 4 Children | 0 (0.0%) | 18 (58.1%) |
| 5 or more Children | 0 (0.0%) | 0 (0.0%) |
| Total | 0 (0.0%) | 91 (17.4%) |
Income Below Poverty Among Married-Couple vs Single-Parent Households in Alachua
The poverty data for Alachua shows that 90 of the married-couple family households (4.2%) and 91 of the single-parent households (13.0%) are living below the poverty level. Within the married-couple family households, those with 3 or 4 children have the highest poverty rate, with 40 households (32.8%) falling below the poverty line. Among the single-parent households, those with 3 or 4 children have the highest poverty rate, with 18 household (35.3%) living below poverty.
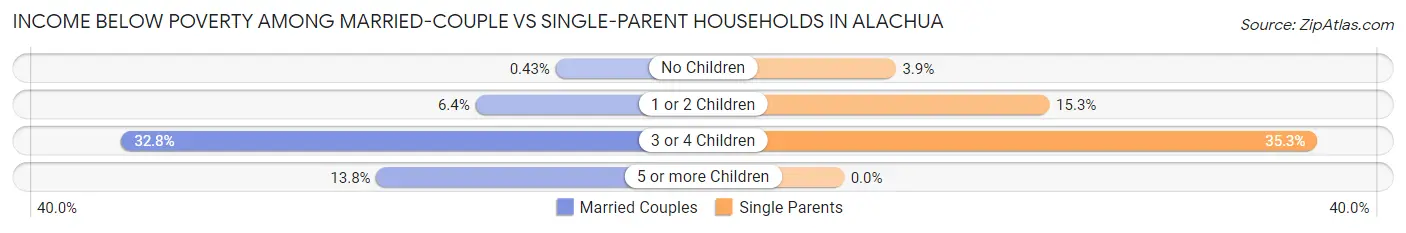
| Children | Married-Couple Families | Single-Parent Households |
| No Children | 6 (0.4%) | 9 (3.9%) |
| 1 or 2 Children | 40 (6.4%) | 64 (15.3%) |
| 3 or 4 Children | 40 (32.8%) | 18 (35.3%) |
| 5 or more Children | 4 (13.8%) | 0 (0.0%) |
| Total | 90 (4.2%) | 91 (13.0%) |
Race in Alachua
The most populous races in Alachua are White / Caucasian (6,575 | 62.2%), Black / African American (2,758 | 26.1%), and Hispanic or Latino (1,291 | 12.2%).
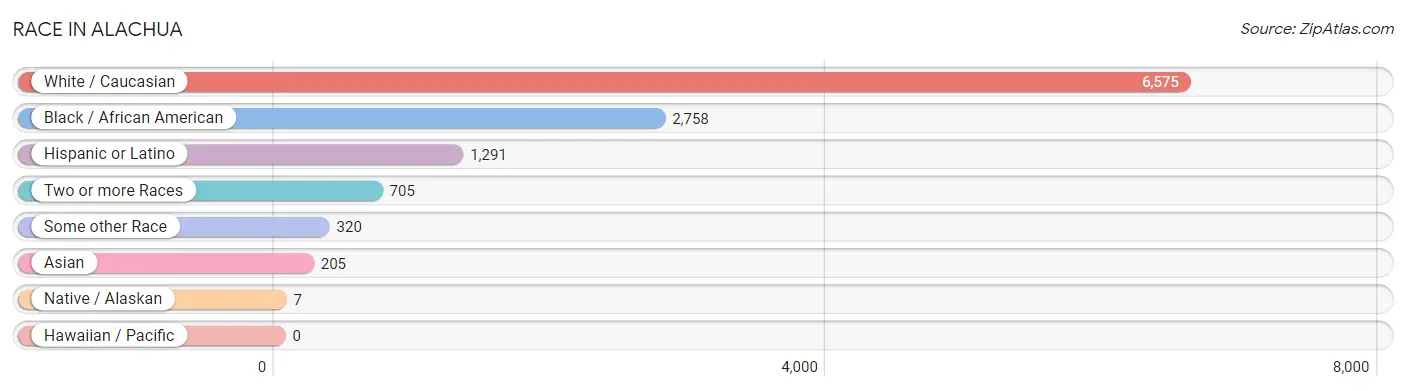
| Race | # Population | % Population |
| Asian | 205 | 1.9% |
| Black / African American | 2,758 | 26.1% |
| Hawaiian / Pacific | 0 | 0.0% |
| Hispanic or Latino | 1,291 | 12.2% |
| Native / Alaskan | 7 | 0.1% |
| White / Caucasian | 6,575 | 62.2% |
| Two or more Races | 705 | 6.7% |
| Some other Race | 320 | 3.0% |
| Total | 10,570 | 100.0% |
Ancestry in Alachua
The most populous ancestries reported in Alachua are German (1,364 | 12.9%), Irish (1,292 | 12.2%), English (1,219 | 11.5%), Italian (500 | 4.7%), and American (451 | 4.3%), together accounting for 45.7% of all Alachua residents.
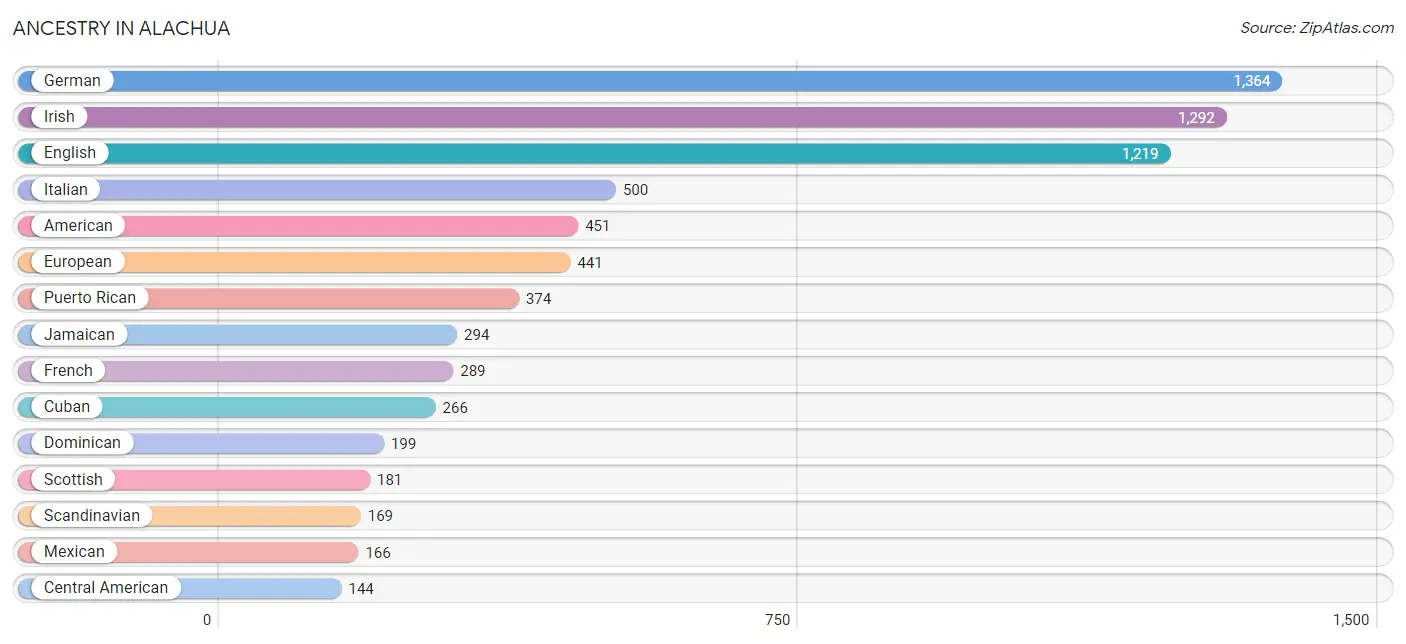
| Ancestry | # Population | % Population |
| African | 74 | 0.7% |
| American | 451 | 4.3% |
| Arab | 47 | 0.4% |
| Bahamian | 33 | 0.3% |
| Basque | 22 | 0.2% |
| Belgian | 45 | 0.4% |
| Bhutanese | 39 | 0.4% |
| Brazilian | 40 | 0.4% |
| British | 103 | 1.0% |
| Canadian | 107 | 1.0% |
| Central American | 144 | 1.4% |
| Colombian | 23 | 0.2% |
| Cuban | 266 | 2.5% |
| Dominican | 199 | 1.9% |
| Dutch | 19 | 0.2% |
| Eastern European | 6 | 0.1% |
| Ecuadorian | 25 | 0.2% |
| English | 1,219 | 11.5% |
| European | 441 | 4.2% |
| French | 289 | 2.7% |
| French Canadian | 95 | 0.9% |
| German | 1,364 | 12.9% |
| Greek | 17 | 0.2% |
| Guatemalan | 110 | 1.0% |
| Guyanese | 8 | 0.1% |
| Hungarian | 66 | 0.6% |
| Irish | 1,292 | 12.2% |
| Italian | 500 | 4.7% |
| Jamaican | 294 | 2.8% |
| Korean | 66 | 0.6% |
| Lithuanian | 9 | 0.1% |
| Mexican | 166 | 1.6% |
| Nicaraguan | 16 | 0.2% |
| Norwegian | 116 | 1.1% |
| Peruvian | 62 | 0.6% |
| Polish | 126 | 1.2% |
| Portuguese | 89 | 0.8% |
| Pueblo | 105 | 1.0% |
| Puerto Rican | 374 | 3.5% |
| Russian | 43 | 0.4% |
| Salvadoran | 18 | 0.2% |
| Scandinavian | 169 | 1.6% |
| Scotch-Irish | 65 | 0.6% |
| Scottish | 181 | 1.7% |
| Slovene | 18 | 0.2% |
| South American | 110 | 1.0% |
| Spaniard | 32 | 0.3% |
| Subsaharan African | 74 | 0.7% |
| Swedish | 30 | 0.3% |
| Swiss | 20 | 0.2% |
| Thai | 114 | 1.1% |
| Trinidadian and Tobagonian | 10 | 0.1% |
| Ukrainian | 34 | 0.3% |
| Welsh | 32 | 0.3% | View All 54 Rows |
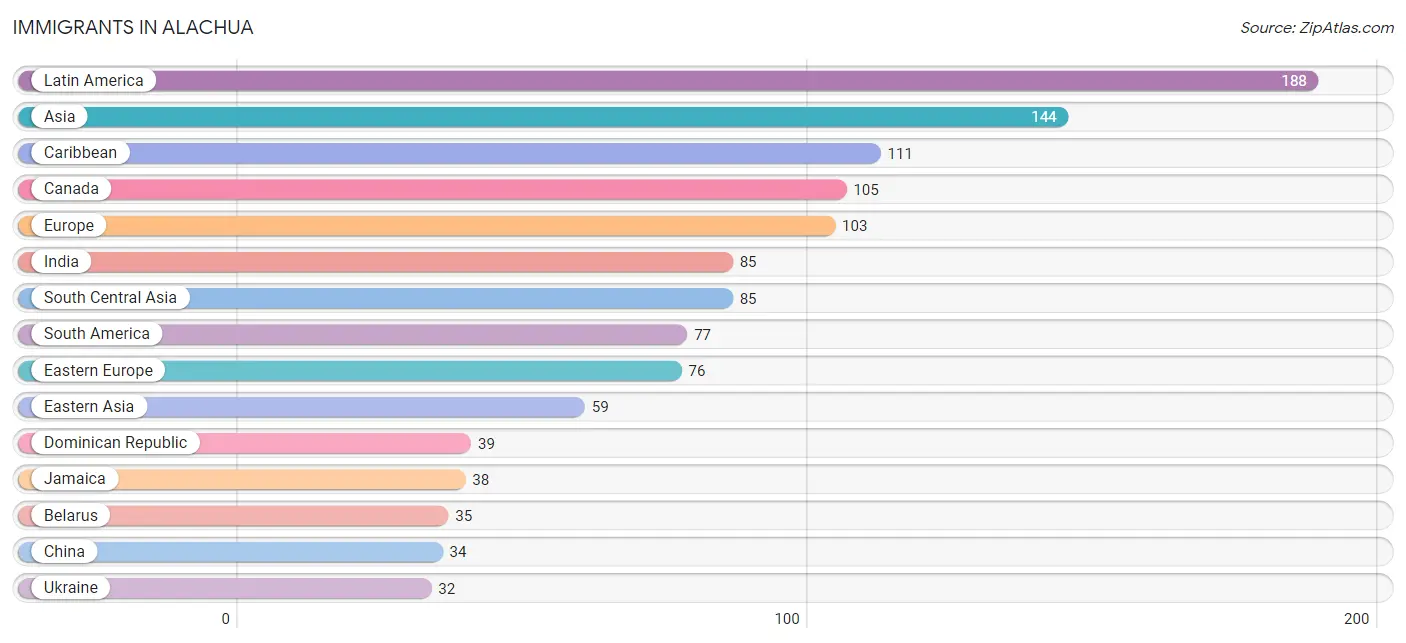
Immigrants in Alachua
The most numerous immigrant groups reported in Alachua came from Latin America (188 | 1.8%), Asia (144 | 1.4%), Caribbean (111 | 1.1%), Canada (105 | 1.0%), and Europe (103 | 1.0%), together accounting for 6.1% of all Alachua residents.
| Immigration Origin | # Population | % Population |
| Asia | 144 | 1.4% |
| Belarus | 35 | 0.3% |
| Brazil | 14 | 0.1% |
| Canada | 105 | 1.0% |
| Caribbean | 111 | 1.1% |
| China | 34 | 0.3% |
| Colombia | 16 | 0.2% |
| Cuba | 4 | 0.0% |
| Dominican Republic | 39 | 0.4% |
| Eastern Asia | 59 | 0.6% |
| Eastern Europe | 76 | 0.7% |
| Ecuador | 11 | 0.1% |
| England | 23 | 0.2% |
| Europe | 103 | 1.0% |
| Germany | 4 | 0.0% |
| Guyana | 8 | 0.1% |
| India | 85 | 0.8% |
| Jamaica | 38 | 0.4% |
| Japan | 25 | 0.2% |
| Latin America | 188 | 1.8% |
| Northern Europe | 23 | 0.2% |
| Peru | 17 | 0.2% |
| Poland | 9 | 0.1% |
| South America | 77 | 0.7% |
| South Central Asia | 85 | 0.8% |
| Trinidad and Tobago | 30 | 0.3% |
| Ukraine | 32 | 0.3% |
| Venezuela | 11 | 0.1% |
| Western Europe | 4 | 0.0% | View All 29 Rows |
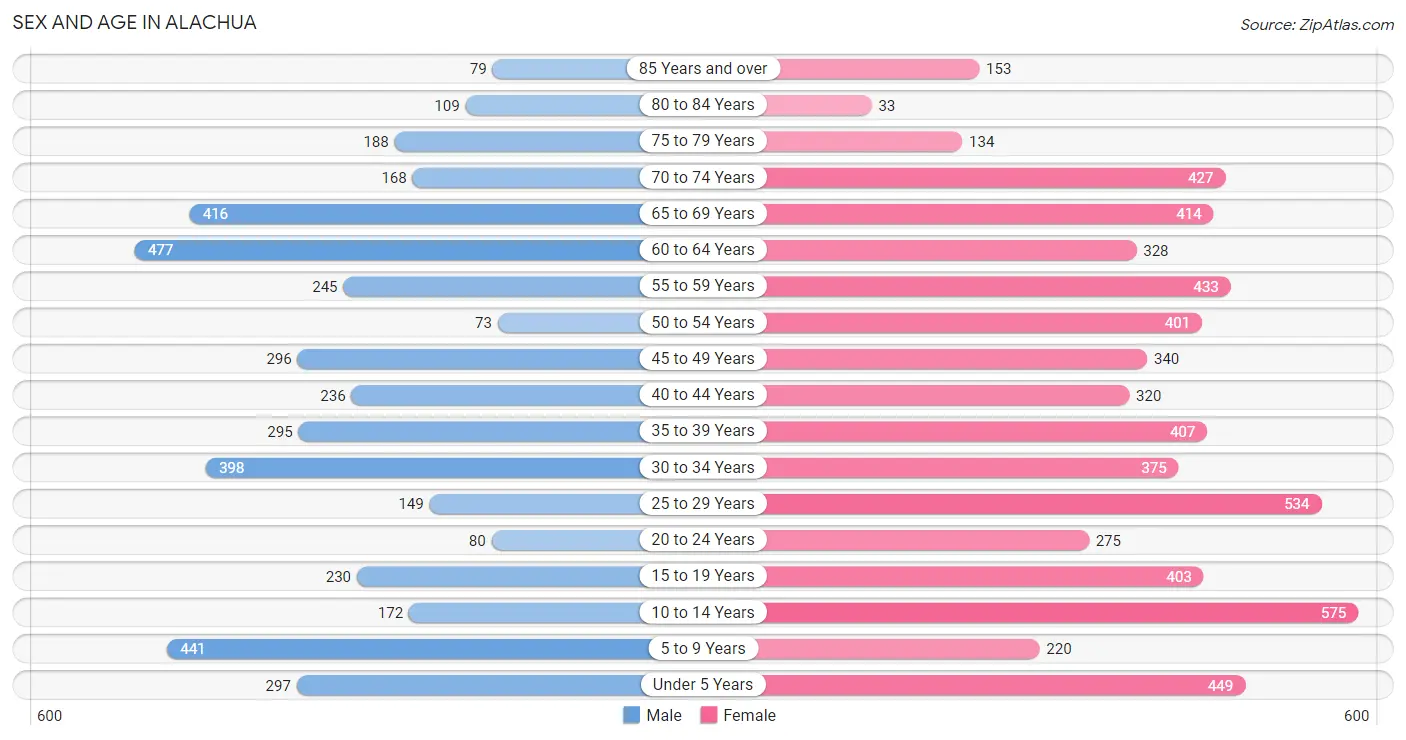
Sex and Age in Alachua
Sex and Age in Alachua
The most populous age groups in Alachua are 60 to 64 Years (477 | 11.0%) for men and 10 to 14 Years (575 | 9.2%) for women.
| Age Bracket | Male | Female |
| Under 5 Years | 297 (6.8%) | 449 (7.2%) |
| 5 to 9 Years | 441 (10.1%) | 220 (3.5%) |
| 10 to 14 Years | 172 (4.0%) | 575 (9.2%) |
| 15 to 19 Years | 230 (5.3%) | 403 (6.5%) |
| 20 to 24 Years | 80 (1.8%) | 275 (4.4%) |
| 25 to 29 Years | 149 (3.4%) | 534 (8.6%) |
| 30 to 34 Years | 398 (9.1%) | 375 (6.0%) |
| 35 to 39 Years | 295 (6.8%) | 407 (6.5%) |
| 40 to 44 Years | 236 (5.4%) | 320 (5.1%) |
| 45 to 49 Years | 296 (6.8%) | 340 (5.5%) |
| 50 to 54 Years | 73 (1.7%) | 401 (6.5%) |
| 55 to 59 Years | 245 (5.6%) | 433 (7.0%) |
| 60 to 64 Years | 477 (11.0%) | 328 (5.3%) |
| 65 to 69 Years | 416 (9.6%) | 414 (6.7%) |
| 70 to 74 Years | 168 (3.9%) | 427 (6.9%) |
| 75 to 79 Years | 188 (4.3%) | 134 (2.1%) |
| 80 to 84 Years | 109 (2.5%) | 33 (0.5%) |
| 85 Years and over | 79 (1.8%) | 153 (2.5%) |
| Total | 4,349 (100.0%) | 6,221 (100.0%) |
Families and Households in Alachua
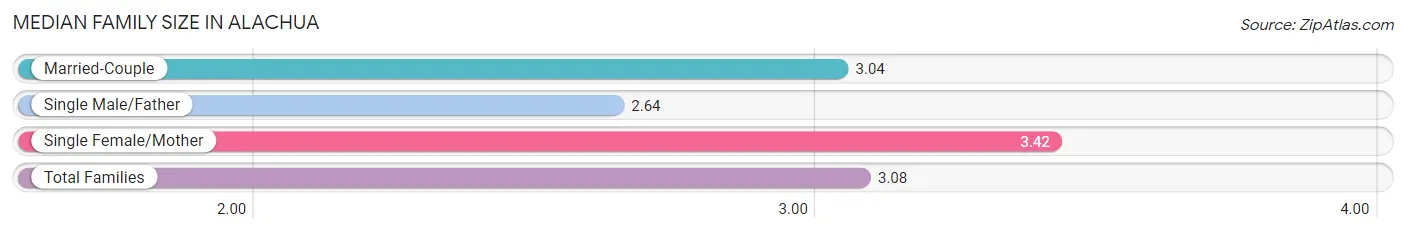
Median Family Size in Alachua
The median family size in Alachua is 3.08 persons per family, with single female/mother families (522 | 18.2%) accounting for the largest median family size of 3.42 persons per family. On the other hand, single male/father families (180 | 6.3%) represent the smallest median family size with 2.64 persons per family.
| Family Type | # Families | Family Size |
| Married-Couple | 2,160 (75.5%) | 3.04 |
| Single Male/Father | 180 (6.3%) | 2.64 |
| Single Female/Mother | 522 (18.2%) | 3.42 |
| Total Families | 2,862 (100.0%) | 3.08 |
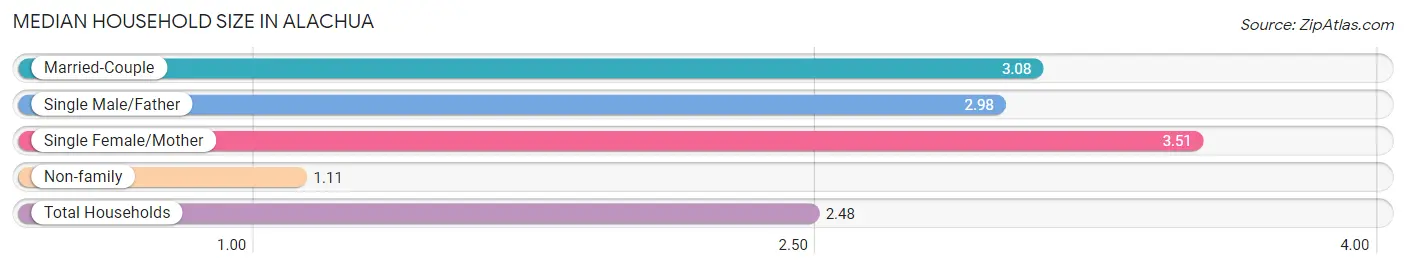
Median Household Size in Alachua
The median household size in Alachua is 2.48 persons per household, with single female/mother households (522 | 12.3%) accounting for the largest median household size of 3.51 persons per household. non-family households (1,387 | 32.6%) represent the smallest median household size with 1.11 persons per household.
| Household Type | # Households | Household Size |
| Married-Couple | 2,160 (50.8%) | 3.08 |
| Single Male/Father | 180 (4.2%) | 2.98 |
| Single Female/Mother | 522 (12.3%) | 3.51 |
| Non-family | 1,387 (32.6%) | 1.11 |
| Total Households | 4,249 (100.0%) | 2.48 |
Household Size by Marriage Status in Alachua
Out of a total of 4,249 households in Alachua, 2,862 (67.4%) are family households, while 1,387 (32.6%) are nonfamily households. The most numerous type of family households are 2-person households, comprising 1,372, and the most common type of nonfamily households are 1-person households, comprising 1,290.
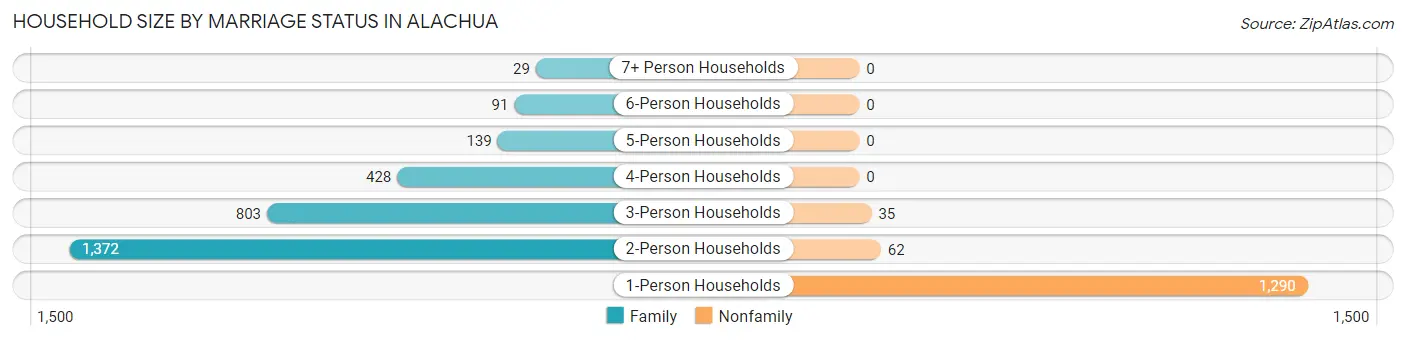
| Household Size | Family Households | Nonfamily Households |
| 1-Person Households | - | 1,290 (30.4%) |
| 2-Person Households | 1,372 (32.3%) | 62 (1.5%) |
| 3-Person Households | 803 (18.9%) | 35 (0.8%) |
| 4-Person Households | 428 (10.1%) | 0 (0.0%) |
| 5-Person Households | 139 (3.3%) | 0 (0.0%) |
| 6-Person Households | 91 (2.1%) | 0 (0.0%) |
| 7+ Person Households | 29 (0.7%) | 0 (0.0%) |
| Total | 2,862 (67.4%) | 1,387 (32.6%) |
Female Fertility in Alachua
Fertility by Age in Alachua
Average fertility rate in Alachua is 38.0 births per 1,000 women. Women in the age bracket of 20 to 34 years have the highest fertility rate with 88.0 births per 1,000 women. Women in the age bracket of 20 to 34 years acount for 100.0% of all women with births.
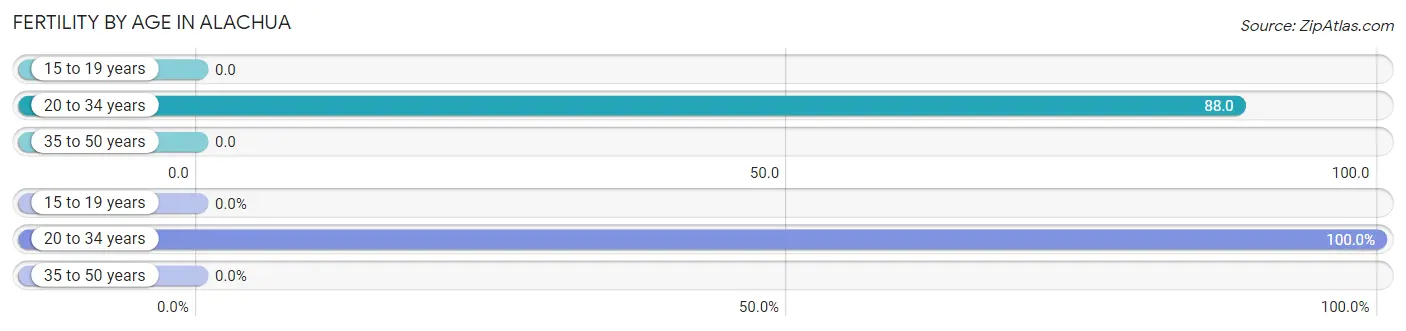
| Age Bracket | Women with Births | Births / 1,000 Women |
| 15 to 19 years | 0 (0.0%) | 0.0 |
| 20 to 34 years | 104 (100.0%) | 88.0 |
| 35 to 50 years | 0 (0.0%) | 0.0 |
| Total | 104 (100.0%) | 38.0 |
Fertility by Age by Marriage Status in Alachua
90.4% of women with births (104) in Alachua are married. The highest percentage of unmarried women with births falls into 20 to 34 years age bracket with 9.6% of them unmarried at the time of birth, while the lowest percentage of unmarried women with births belong to 20 to 34 years age bracket with 9.6% of them unmarried.
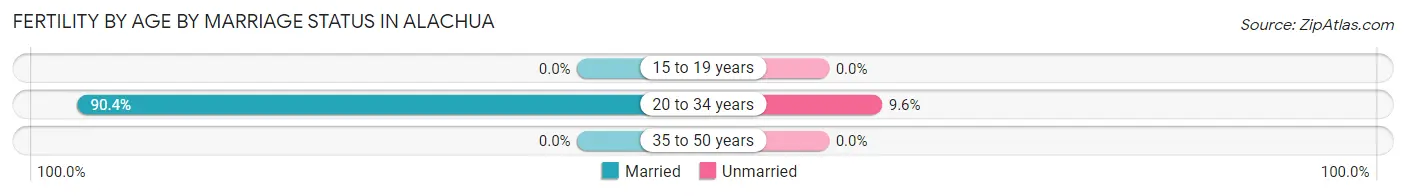
| Age Bracket | Married | Unmarried |
| 15 to 19 years | 0 (0.0%) | 0 (0.0%) |
| 20 to 34 years | 94 (90.4%) | 10 (9.6%) |
| 35 to 50 years | 0 (0.0%) | 0 (0.0%) |
| Total | 94 (90.4%) | 10 (9.6%) |
Fertility by Education in Alachua
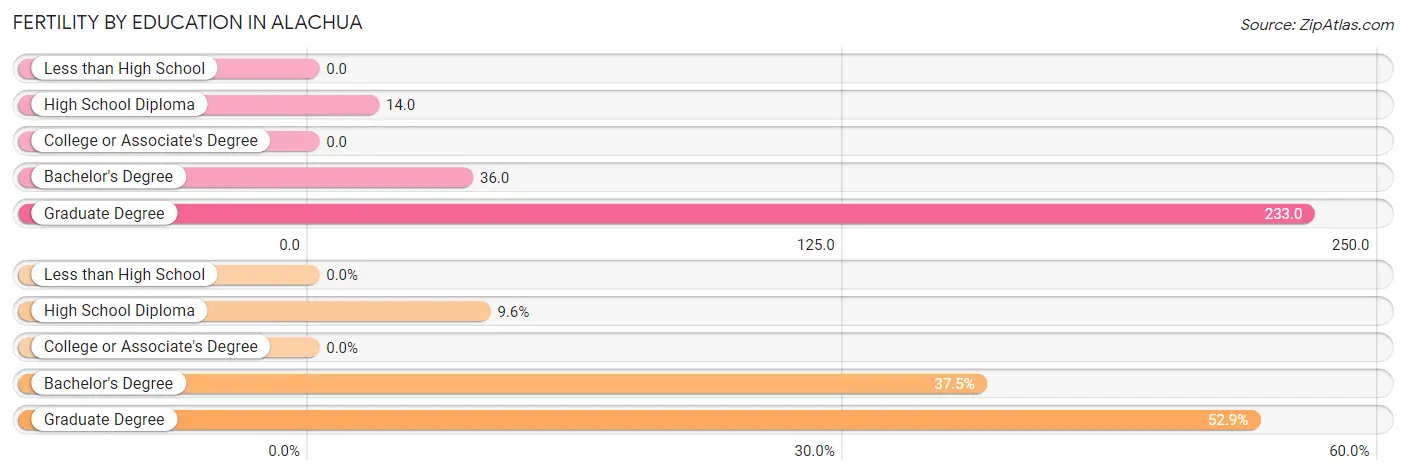
| Educational Attainment | Women with Births | Births / 1,000 Women |
| Less than High School | 0 (0.0%) | 0.0 |
| High School Diploma | 10 (9.6%) | 14.0 |
| College or Associate's Degree | 0 (0.0%) | 0.0 |
| Bachelor's Degree | 39 (37.5%) | 36.0 |
| Graduate Degree | 55 (52.9%) | 233.0 |
| Total | 104 (100.0%) | 38.0 |
Fertility by Education by Marriage Status in Alachua
9.6% of women with births in Alachua are unmarried. Women with the educational attainment of bachelor's degree are most likely to be married with 100.0% of them married at childbirth, while women with the educational attainment of high school diploma are least likely to be married with 100.0% of them unmarried at childbirth.
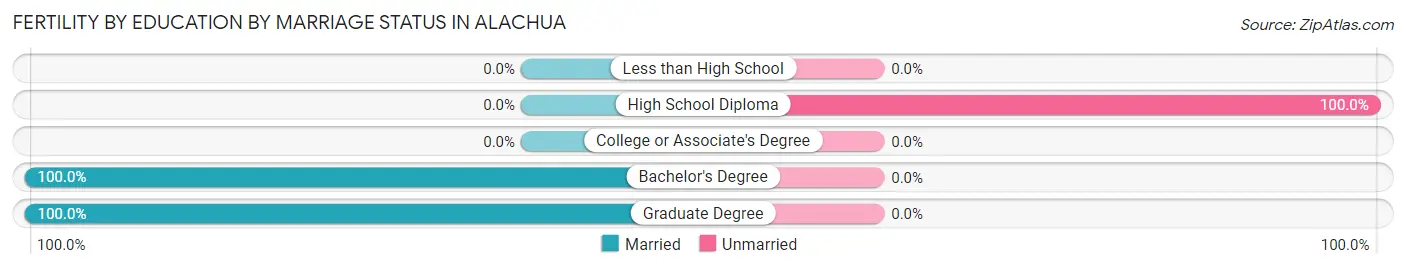
| Educational Attainment | Married | Unmarried |
| Less than High School | 0 (0.0%) | 0 (0.0%) |
| High School Diploma | 0 (0.0%) | 10 (100.0%) |
| College or Associate's Degree | 0 (0.0%) | 0 (0.0%) |
| Bachelor's Degree | 39 (100.0%) | 0 (0.0%) |
| Graduate Degree | 55 (100.0%) | 0 (0.0%) |
| Total | 94 (90.4%) | 10 (9.6%) |
Employment Characteristics in Alachua
Employment by Class of Employer in Alachua
Among the 4,773 employed individuals in Alachua, private company employees (2,664 | 55.8%), not-for-profit organizations (572 | 12.0%), and state government employees (497 | 10.4%) make up the most common classes of employment.
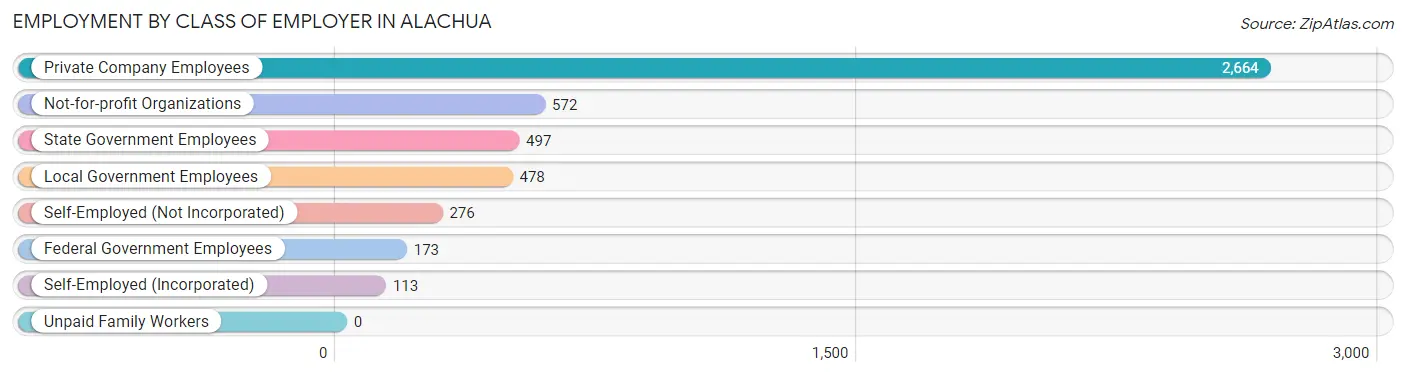
| Employer Class | # Employees | % Employees |
| Private Company Employees | 2,664 | 55.8% |
| Self-Employed (Incorporated) | 113 | 2.4% |
| Self-Employed (Not Incorporated) | 276 | 5.8% |
| Not-for-profit Organizations | 572 | 12.0% |
| Local Government Employees | 478 | 10.0% |
| State Government Employees | 497 | 10.4% |
| Federal Government Employees | 173 | 3.6% |
| Unpaid Family Workers | 0 | 0.0% |
| Total | 4,773 | 100.0% |
Employment Status by Age in Alachua
According to the labor force statistics for Alachua, out of the total population over 16 years of age (8,316), 60.7% or 5,048 individuals are in the labor force, with 3.9% or 197 of them unemployed. The age group with the highest labor force participation rate is 35 to 44 years, with 84.3% or 1,060 individuals in the labor force. Within the labor force, the 16 to 19 years age range has the highest percentage of unemployed individuals, with 29.7% or 88 of them being unemployed.
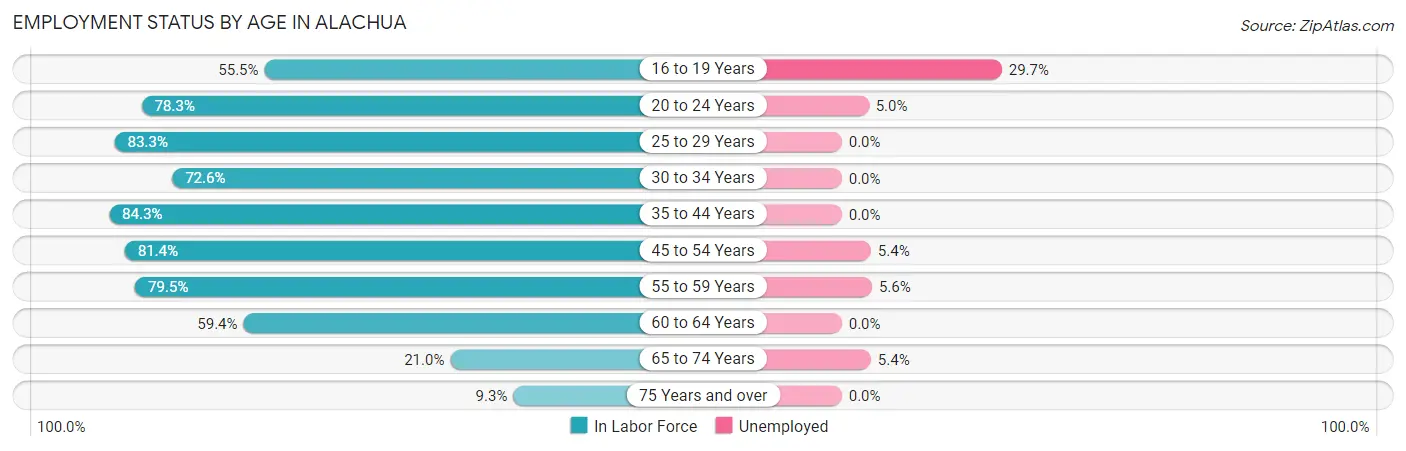
| Age Bracket | In Labor Force | Unemployed |
| 16 to 19 Years | 296 (55.5%) | 88 (29.7%) |
| 20 to 24 Years | 278 (78.3%) | 14 (5.0%) |
| 25 to 29 Years | 569 (83.3%) | 0 (0.0%) |
| 30 to 34 Years | 561 (72.6%) | 0 (0.0%) |
| 35 to 44 Years | 1,060 (84.3%) | 0 (0.0%) |
| 45 to 54 Years | 904 (81.4%) | 49 (5.4%) |
| 55 to 59 Years | 539 (79.5%) | 30 (5.6%) |
| 60 to 64 Years | 478 (59.4%) | 0 (0.0%) |
| 65 to 74 Years | 299 (21.0%) | 16 (5.4%) |
| 75 Years and over | 65 (9.3%) | 0 (0.0%) |
| Total | 5,048 (60.7%) | 197 (3.9%) |
Employment Status by Educational Attainment in Alachua
According to labor force statistics for Alachua, 77.5% of individuals (4,113) out of the total population between 25 and 64 years of age (5,307) are in the labor force, with 1.9% or 78 of them being unemployed. The group with the highest labor force participation rate are those with the educational attainment of bachelor's degree or higher, with 90.5% or 2,384 individuals in the labor force. Within the labor force, individuals with college / associate degree education have the highest percentage of unemployment, with 5.5% or 49 of them being unemployed.
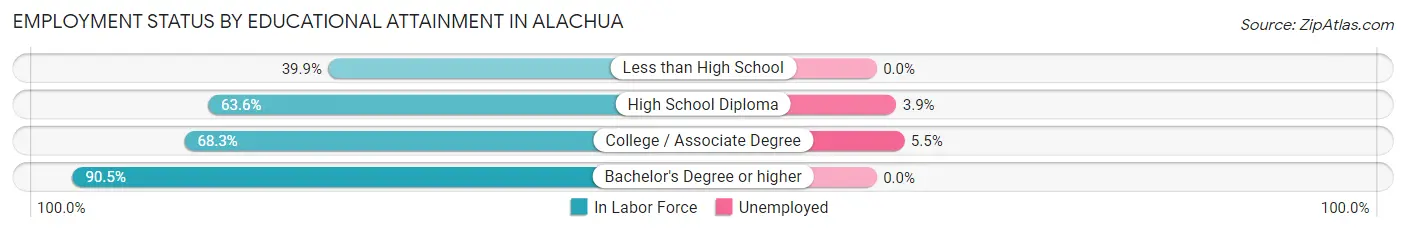
| Educational Attainment | In Labor Force | Unemployed |
| Less than High School | 57 (39.9%) | 0 (0.0%) |
| High School Diploma | 778 (63.6%) | 48 (3.9%) |
| College / Associate Degree | 892 (68.3%) | 72 (5.5%) |
| Bachelor's Degree or higher | 2,384 (90.5%) | 0 (0.0%) |
| Total | 4,113 (77.5%) | 101 (1.9%) |
Employment Occupations by Sex in Alachua
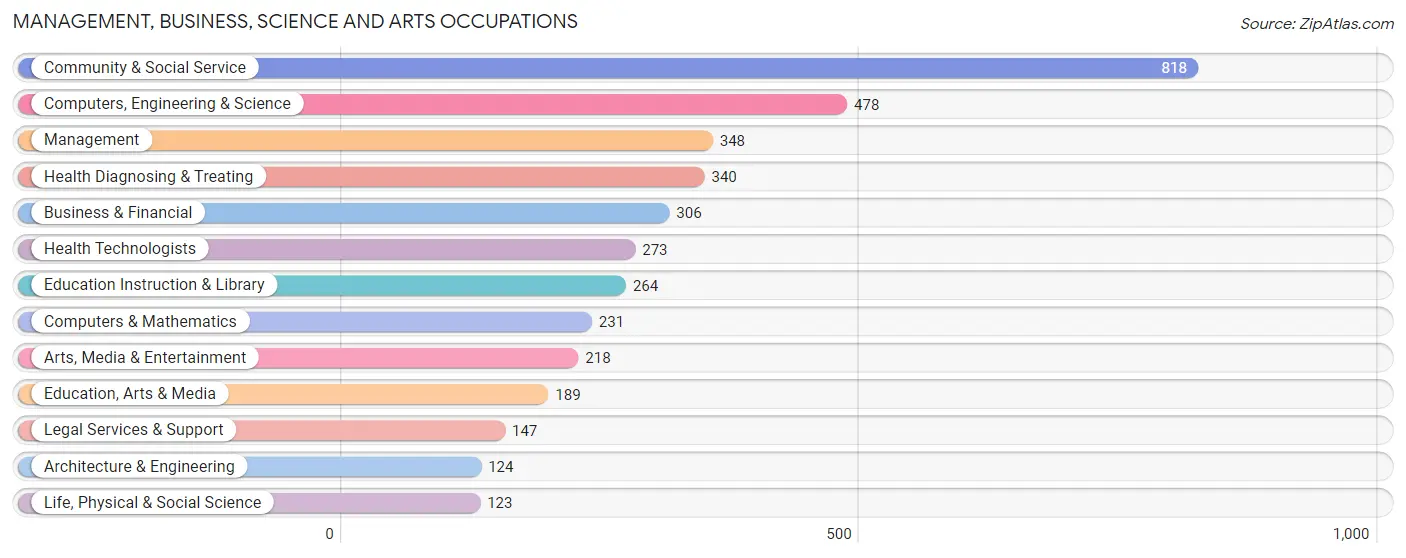
Management, Business, Science and Arts Occupations
The most common Management, Business, Science and Arts occupations in Alachua are Community & Social Service (818 | 16.9%), Computers, Engineering & Science (478 | 9.9%), Management (348 | 7.2%), Health Diagnosing & Treating (340 | 7.0%), and Business & Financial (306 | 6.3%).
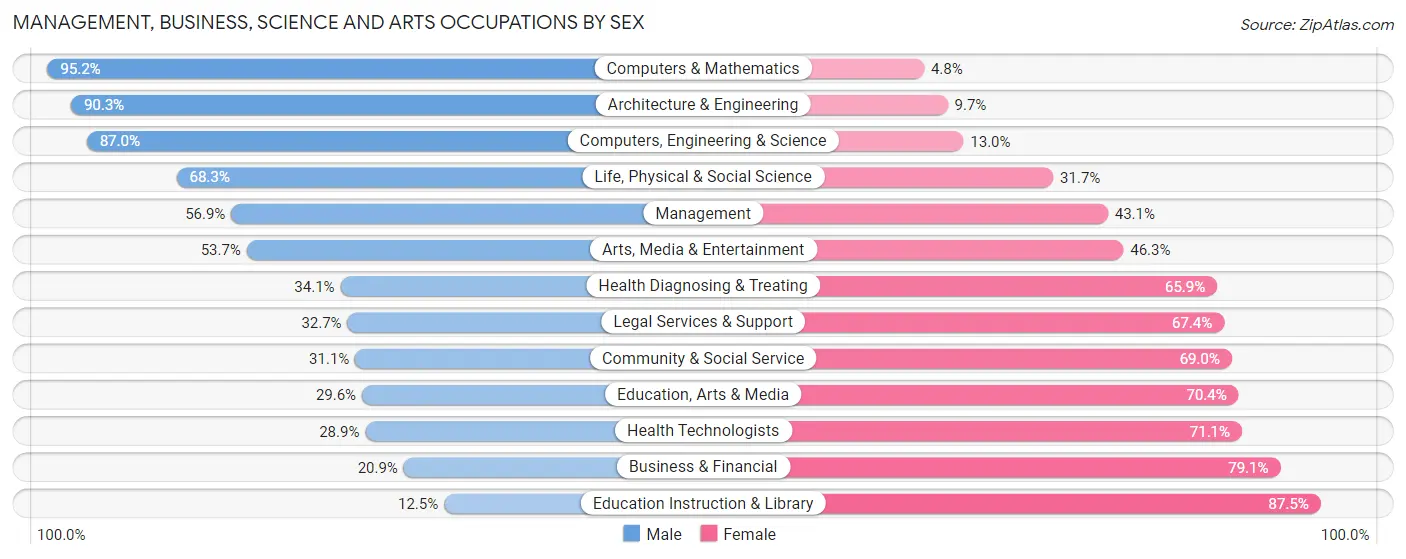
Management, Business, Science and Arts Occupations by Sex
Within the Management, Business, Science and Arts occupations in Alachua, the most male-oriented occupations are Computers & Mathematics (95.2%), Architecture & Engineering (90.3%), and Computers, Engineering & Science (87.0%), while the most female-oriented occupations are Education Instruction & Library (87.5%), Business & Financial (79.1%), and Health Technologists (71.1%).
| Occupation | Male | Female |
| Management | 198 (56.9%) | 150 (43.1%) |
| Business & Financial | 64 (20.9%) | 242 (79.1%) |
| Computers, Engineering & Science | 416 (87.0%) | 62 (13.0%) |
| Computers & Mathematics | 220 (95.2%) | 11 (4.8%) |
| Architecture & Engineering | 112 (90.3%) | 12 (9.7%) |
| Life, Physical & Social Science | 84 (68.3%) | 39 (31.7%) |
| Community & Social Service | 254 (31.0%) | 564 (69.0%) |
| Education, Arts & Media | 56 (29.6%) | 133 (70.4%) |
| Legal Services & Support | 48 (32.7%) | 99 (67.3%) |
| Education Instruction & Library | 33 (12.5%) | 231 (87.5%) |
| Arts, Media & Entertainment | 117 (53.7%) | 101 (46.3%) |
| Health Diagnosing & Treating | 116 (34.1%) | 224 (65.9%) |
| Health Technologists | 79 (28.9%) | 194 (71.1%) |
| Total (Category) | 1,048 (45.8%) | 1,242 (54.2%) |
| Total (Overall) | 2,085 (43.0%) | 2,768 (57.0%) |
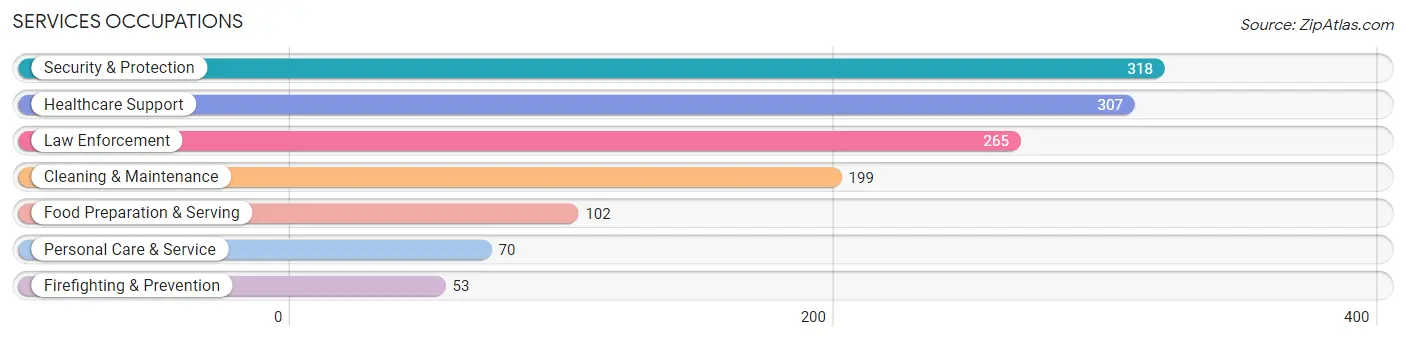
Services Occupations
The most common Services occupations in Alachua are Security & Protection (318 | 6.6%), Healthcare Support (307 | 6.3%), Law Enforcement (265 | 5.5%), Cleaning & Maintenance (199 | 4.1%), and Food Preparation & Serving (102 | 2.1%).
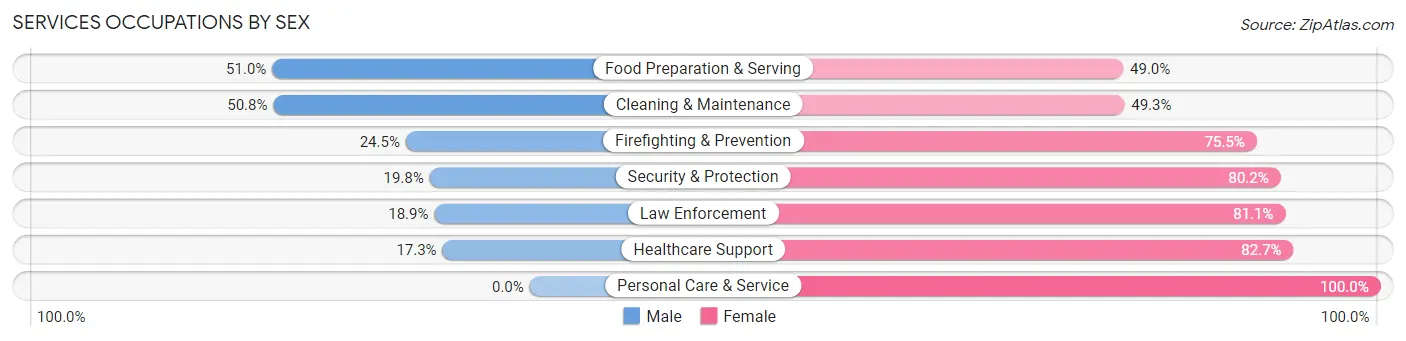
Services Occupations by Sex
Within the Services occupations in Alachua, the most male-oriented occupations are Food Preparation & Serving (51.0%), Cleaning & Maintenance (50.7%), and Firefighting & Prevention (24.5%), while the most female-oriented occupations are Personal Care & Service (100.0%), Healthcare Support (82.7%), and Law Enforcement (81.1%).
| Occupation | Male | Female |
| Healthcare Support | 53 (17.3%) | 254 (82.7%) |
| Security & Protection | 63 (19.8%) | 255 (80.2%) |
| Firefighting & Prevention | 13 (24.5%) | 40 (75.5%) |
| Law Enforcement | 50 (18.9%) | 215 (81.1%) |
| Food Preparation & Serving | 52 (51.0%) | 50 (49.0%) |
| Cleaning & Maintenance | 101 (50.7%) | 98 (49.2%) |
| Personal Care & Service | 0 (0.0%) | 70 (100.0%) |
| Total (Category) | 269 (27.0%) | 727 (73.0%) |
| Total (Overall) | 2,085 (43.0%) | 2,768 (57.0%) |
Sales and Office Occupations
The most common Sales and Office occupations in Alachua are Sales & Related (586 | 12.1%), and Office & Administration (489 | 10.1%).
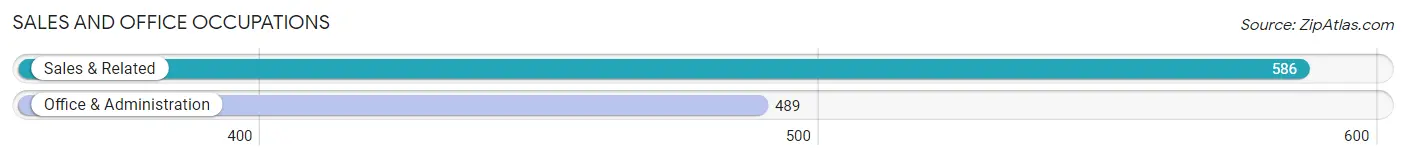
Sales and Office Occupations by Sex
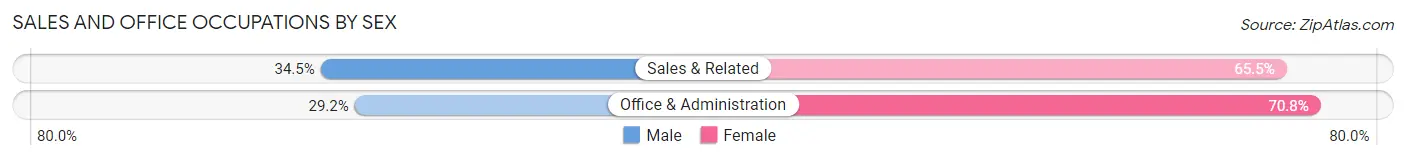
| Occupation | Male | Female |
| Sales & Related | 202 (34.5%) | 384 (65.5%) |
| Office & Administration | 143 (29.2%) | 346 (70.8%) |
| Total (Category) | 345 (32.1%) | 730 (67.9%) |
| Total (Overall) | 2,085 (43.0%) | 2,768 (57.0%) |
Natural Resources, Construction and Maintenance Occupations
The most common Natural Resources, Construction and Maintenance occupations in Alachua are Construction & Extraction (91 | 1.9%), Installation, Maintenance & Repair (85 | 1.8%), and Farming, Fishing & Forestry (26 | 0.5%).
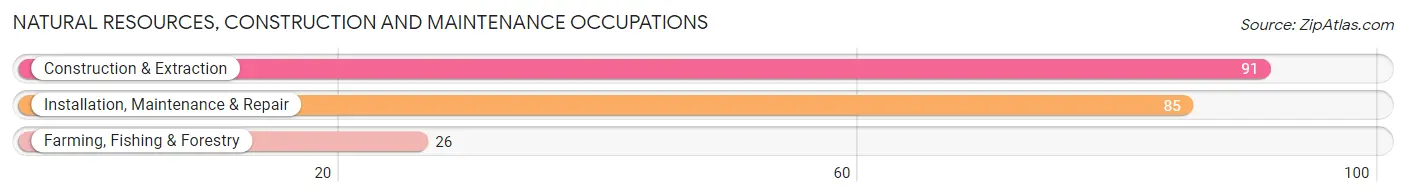
Natural Resources, Construction and Maintenance Occupations by Sex
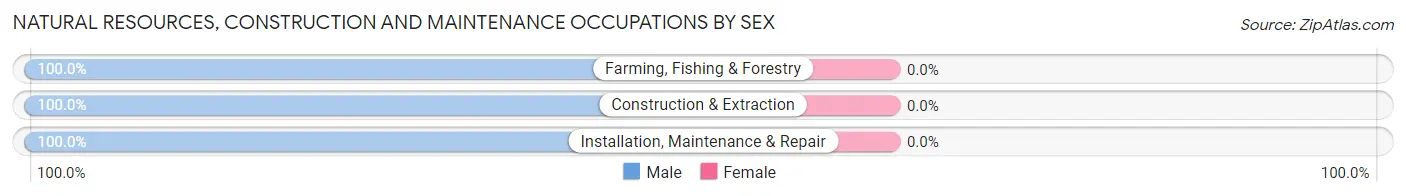
| Occupation | Male | Female |
| Farming, Fishing & Forestry | 26 (100.0%) | 0 (0.0%) |
| Construction & Extraction | 91 (100.0%) | 0 (0.0%) |
| Installation, Maintenance & Repair | 85 (100.0%) | 0 (0.0%) |
| Total (Category) | 202 (100.0%) | 0 (0.0%) |
| Total (Overall) | 2,085 (43.0%) | 2,768 (57.0%) |
Production, Transportation and Moving Occupations
The most common Production, Transportation and Moving occupations in Alachua are Transportation (107 | 2.2%), Material Moving (98 | 2.0%), and Production (85 | 1.8%).
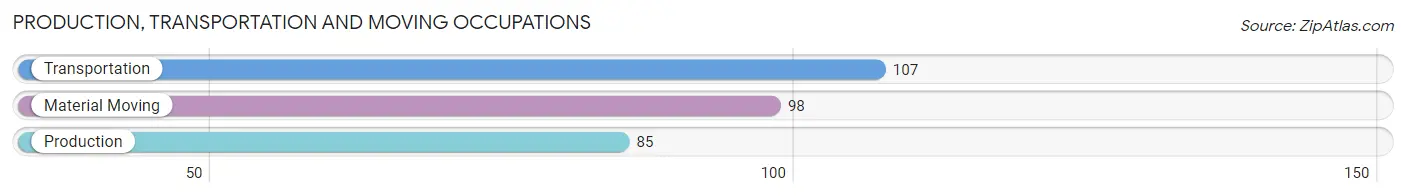
Production, Transportation and Moving Occupations by Sex
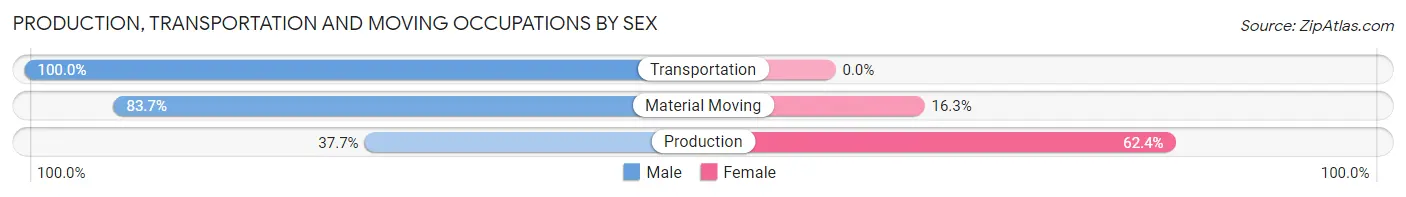
| Occupation | Male | Female |
| Production | 32 (37.7%) | 53 (62.4%) |
| Transportation | 107 (100.0%) | 0 (0.0%) |
| Material Moving | 82 (83.7%) | 16 (16.3%) |
| Total (Category) | 221 (76.2%) | 69 (23.8%) |
| Total (Overall) | 2,085 (43.0%) | 2,768 (57.0%) |
Employment Industries by Sex in Alachua
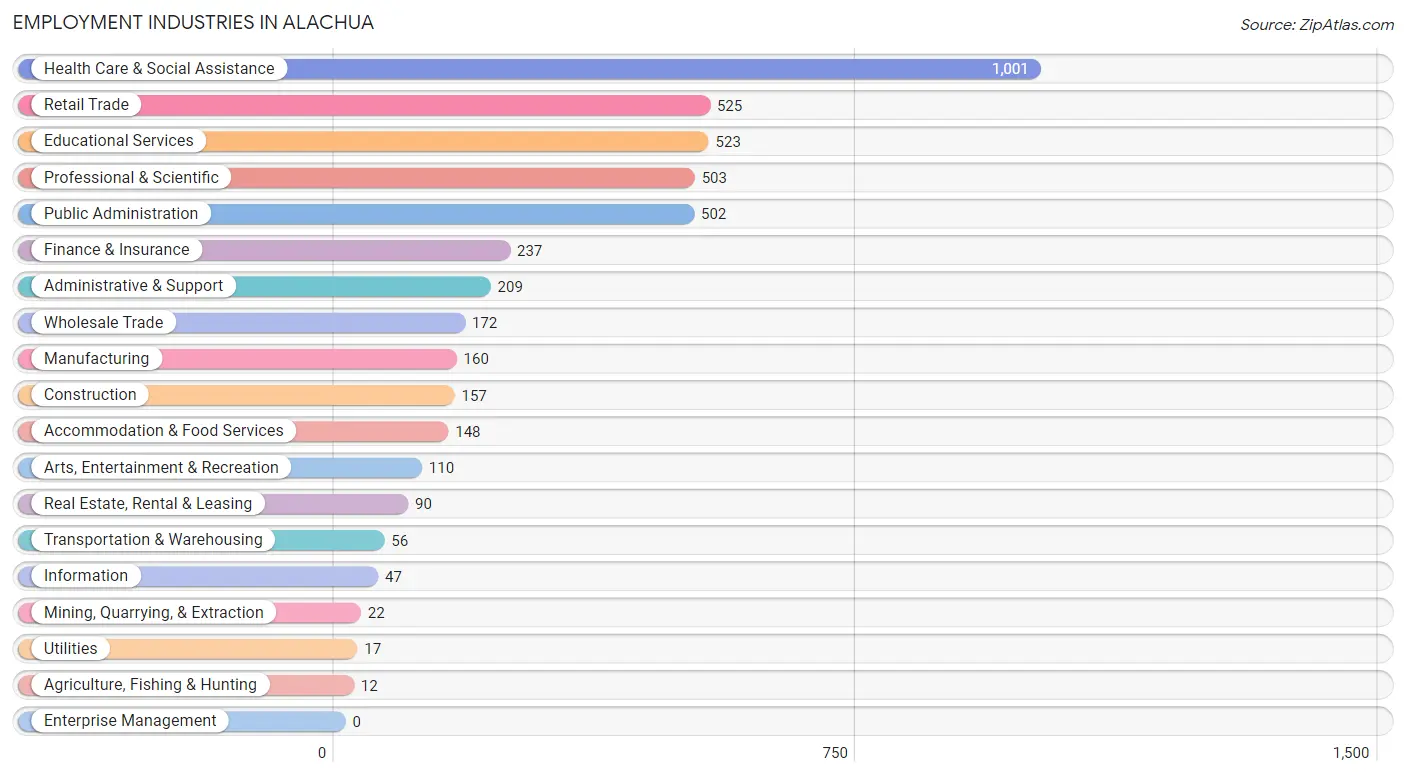
Employment Industries in Alachua
The major employment industries in Alachua include Health Care & Social Assistance (1,001 | 20.6%), Retail Trade (525 | 10.8%), Educational Services (523 | 10.8%), Professional & Scientific (503 | 10.4%), and Public Administration (502 | 10.3%).
Employment Industries by Sex in Alachua
The Alachua industries that see more men than women are Mining, Quarrying, & Extraction (100.0%), Construction (100.0%), and Transportation & Warehousing (100.0%), whereas the industries that tend to have a higher number of women are Agriculture, Fishing & Hunting (100.0%), Information (100.0%), and Real Estate, Rental & Leasing (88.9%).
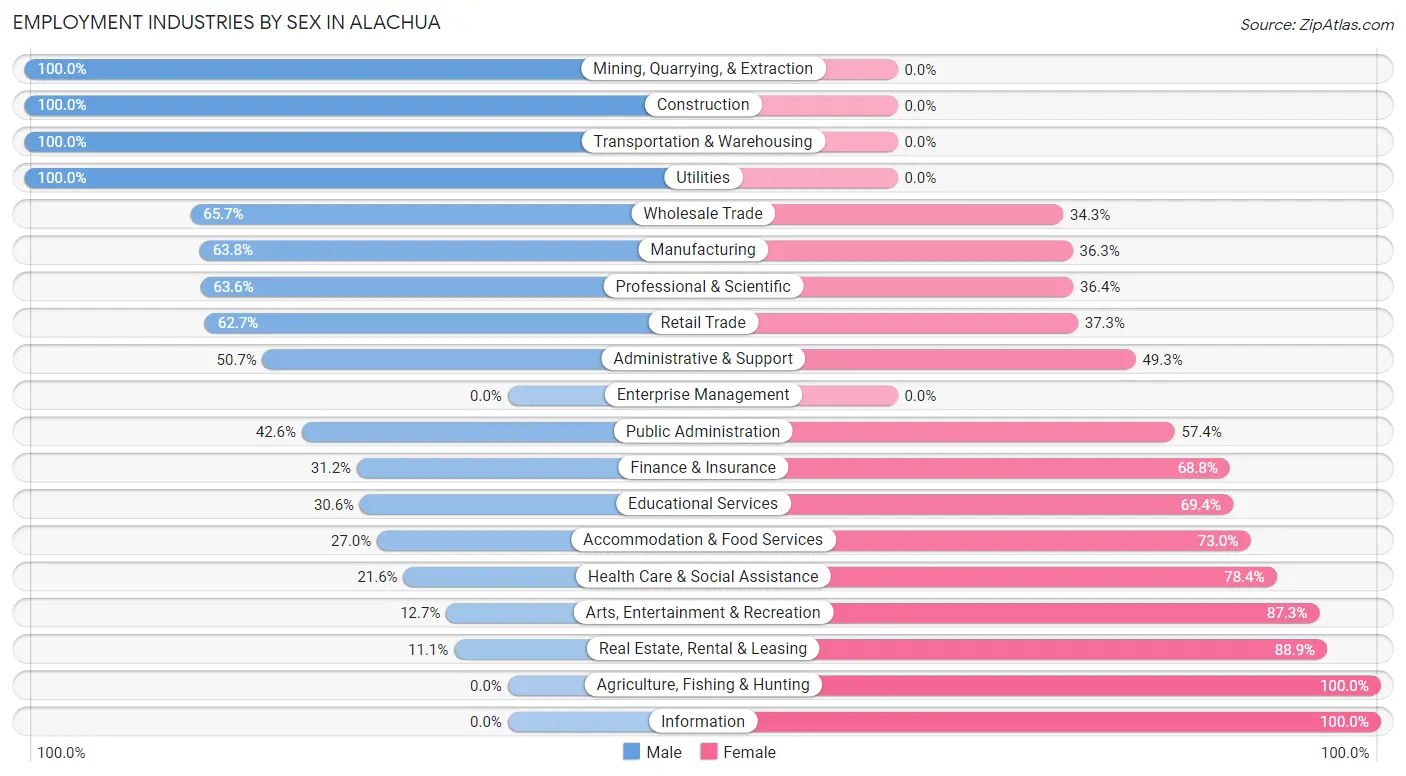
| Industry | Male | Female |
| Agriculture, Fishing & Hunting | 0 (0.0%) | 12 (100.0%) |
| Mining, Quarrying, & Extraction | 22 (100.0%) | 0 (0.0%) |
| Construction | 157 (100.0%) | 0 (0.0%) |
| Manufacturing | 102 (63.7%) | 58 (36.2%) |
| Wholesale Trade | 113 (65.7%) | 59 (34.3%) |
| Retail Trade | 329 (62.7%) | 196 (37.3%) |
| Transportation & Warehousing | 56 (100.0%) | 0 (0.0%) |
| Utilities | 17 (100.0%) | 0 (0.0%) |
| Information | 0 (0.0%) | 47 (100.0%) |
| Finance & Insurance | 74 (31.2%) | 163 (68.8%) |
| Real Estate, Rental & Leasing | 10 (11.1%) | 80 (88.9%) |
| Professional & Scientific | 320 (63.6%) | 183 (36.4%) |
| Enterprise Management | 0 (0.0%) | 0 (0.0%) |
| Administrative & Support | 106 (50.7%) | 103 (49.3%) |
| Educational Services | 160 (30.6%) | 363 (69.4%) |
| Health Care & Social Assistance | 216 (21.6%) | 785 (78.4%) |
| Arts, Entertainment & Recreation | 14 (12.7%) | 96 (87.3%) |
| Accommodation & Food Services | 40 (27.0%) | 108 (73.0%) |
| Public Administration | 214 (42.6%) | 288 (57.4%) |
| Total | 2,085 (43.0%) | 2,768 (57.0%) |
Education in Alachua
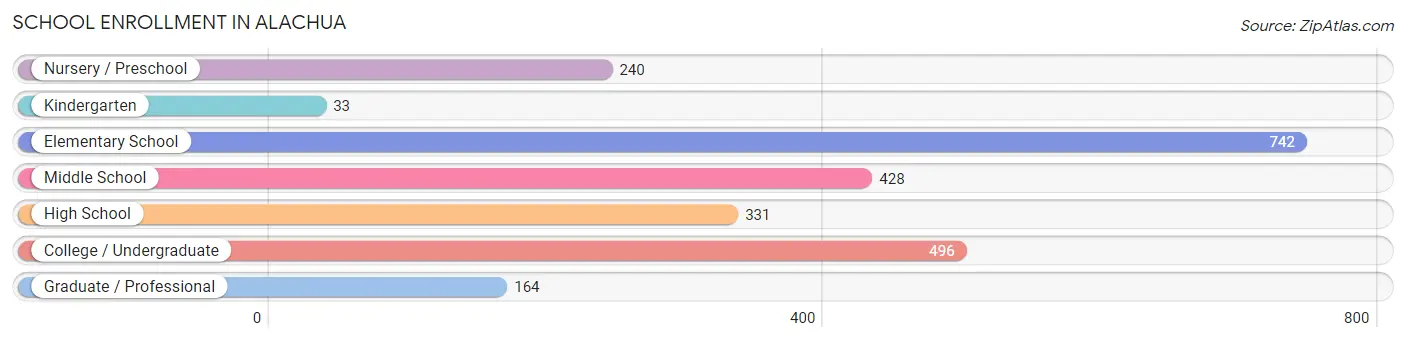
School Enrollment in Alachua
The most common levels of schooling among the 2,434 students in Alachua are elementary school (742 | 30.5%), college / undergraduate (496 | 20.4%), and middle school (428 | 17.6%).
| School Level | # Students | % Students |
| Nursery / Preschool | 240 | 9.9% |
| Kindergarten | 33 | 1.4% |
| Elementary School | 742 | 30.5% |
| Middle School | 428 | 17.6% |
| High School | 331 | 13.6% |
| College / Undergraduate | 496 | 20.4% |
| Graduate / Professional | 164 | 6.7% |
| Total | 2,434 | 100.0% |
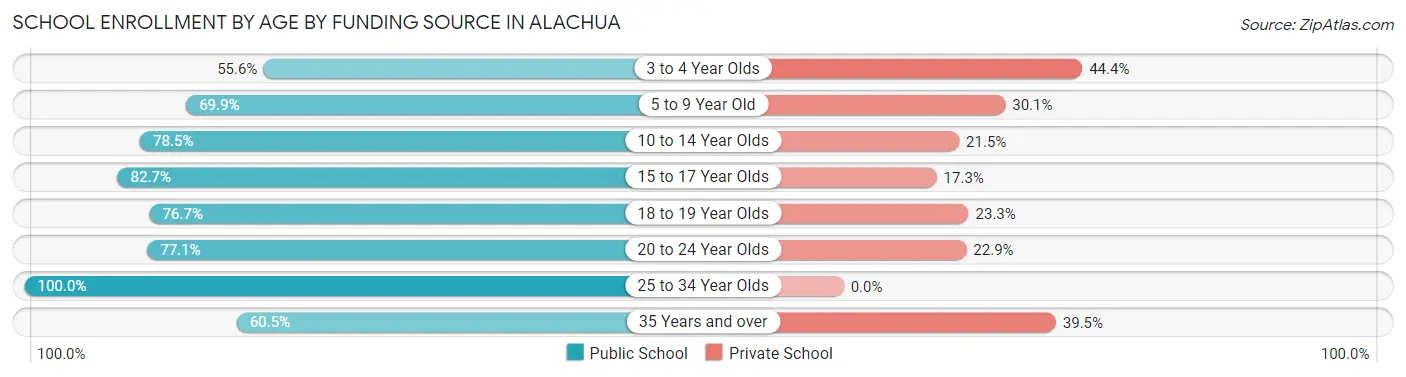
School Enrollment by Age by Funding Source in Alachua
Out of a total of 2,434 students who are enrolled in schools in Alachua, 591 (24.3%) attend a private institution, while the remaining 1,843 (75.7%) are enrolled in public schools. The age group of 3 to 4 year olds has the highest likelihood of being enrolled in private schools, with 72 (44.4% in the age bracket) enrolled. Conversely, the age group of 25 to 34 year olds has the lowest likelihood of being enrolled in a private school, with 189 (100.0% in the age bracket) attending a public institution.
| Age Bracket | Public School | Private School |
| 3 to 4 Year Olds | 90 (55.6%) | 72 (44.4%) |
| 5 to 9 Year Old | 462 (69.9%) | 199 (30.1%) |
| 10 to 14 Year Olds | 489 (78.5%) | 134 (21.5%) |
| 15 to 17 Year Olds | 253 (82.7%) | 53 (17.3%) |
| 18 to 19 Year Olds | 122 (76.7%) | 37 (23.3%) |
| 20 to 24 Year Olds | 162 (77.1%) | 48 (22.9%) |
| 25 to 34 Year Olds | 189 (100.0%) | 0 (0.0%) |
| 35 Years and over | 75 (60.5%) | 49 (39.5%) |
| Total | 1,843 (75.7%) | 591 (24.3%) |
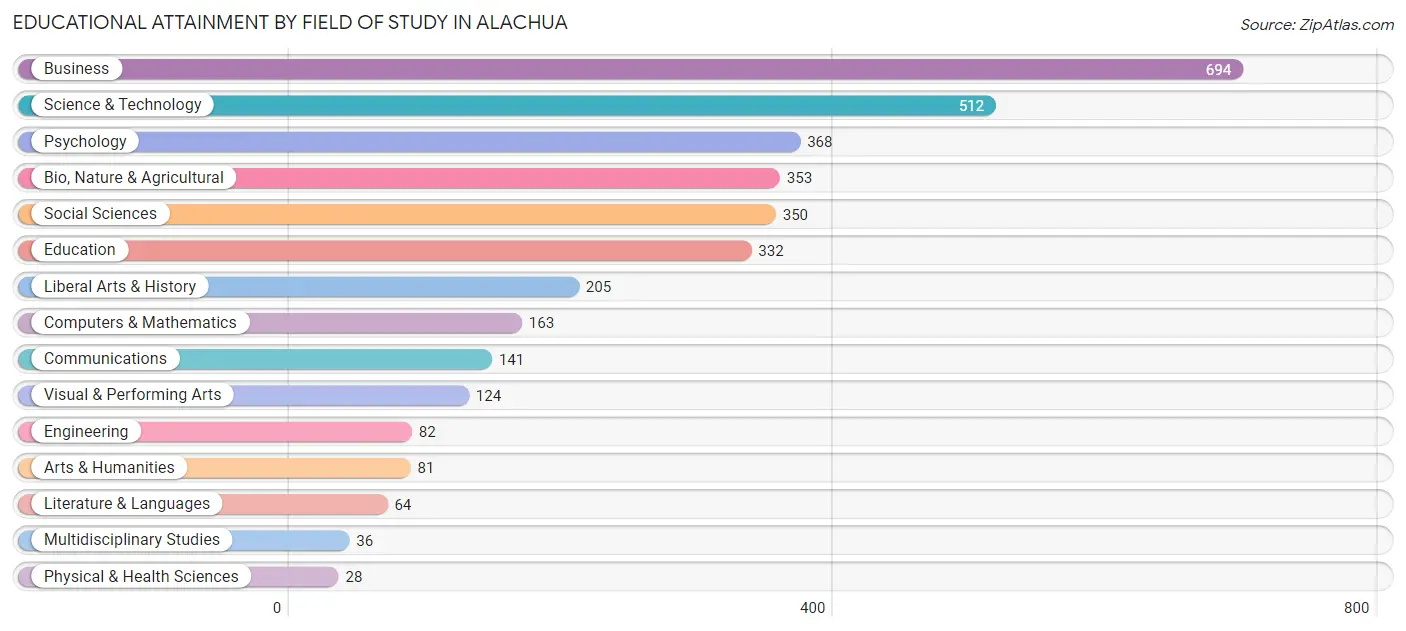
Educational Attainment by Field of Study in Alachua
Business (694 | 19.6%), science & technology (512 | 14.5%), psychology (368 | 10.4%), bio, nature & agricultural (353 | 10.0%), and social sciences (350 | 9.9%) are the most common fields of study among 3,533 individuals in Alachua who have obtained a bachelor's degree or higher.
| Field of Study | # Graduates | % Graduates |
| Computers & Mathematics | 163 | 4.6% |
| Bio, Nature & Agricultural | 353 | 10.0% |
| Physical & Health Sciences | 28 | 0.8% |
| Psychology | 368 | 10.4% |
| Social Sciences | 350 | 9.9% |
| Engineering | 82 | 2.3% |
| Multidisciplinary Studies | 36 | 1.0% |
| Science & Technology | 512 | 14.5% |
| Business | 694 | 19.6% |
| Education | 332 | 9.4% |
| Literature & Languages | 64 | 1.8% |
| Liberal Arts & History | 205 | 5.8% |
| Visual & Performing Arts | 124 | 3.5% |
| Communications | 141 | 4.0% |
| Arts & Humanities | 81 | 2.3% |
| Total | 3,533 | 100.0% |
Transportation & Commute in Alachua
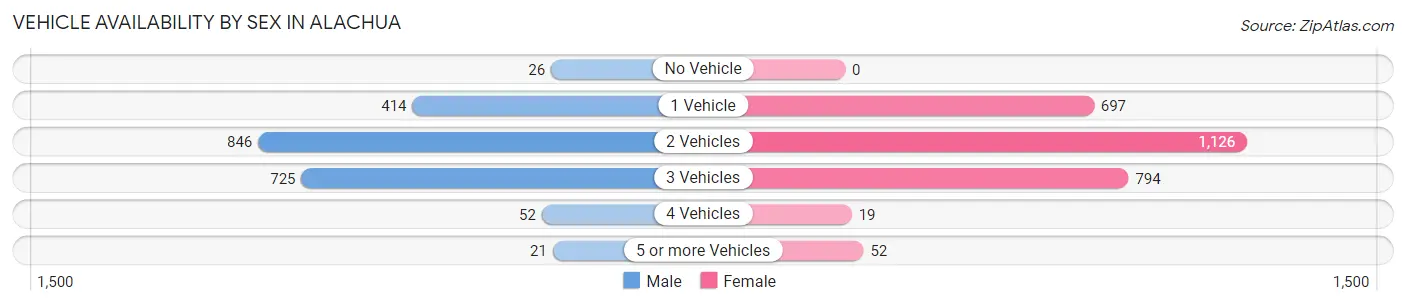
Vehicle Availability by Sex in Alachua
The most prevalent vehicle ownership categories in Alachua are males with 2 vehicles (846, accounting for 40.6%) and females with 2 vehicles (1,126, making up 31.5%).
| Vehicles Available | Male | Female |
| No Vehicle | 26 (1.3%) | 0 (0.0%) |
| 1 Vehicle | 414 (19.9%) | 697 (25.9%) |
| 2 Vehicles | 846 (40.6%) | 1,126 (41.9%) |
| 3 Vehicles | 725 (34.8%) | 794 (29.5%) |
| 4 Vehicles | 52 (2.5%) | 19 (0.7%) |
| 5 or more Vehicles | 21 (1.0%) | 52 (1.9%) |
| Total | 2,084 (100.0%) | 2,688 (100.0%) |
Commute Time in Alachua
The most frequently occuring commute durations in Alachua are 30 to 34 minutes (880 commuters, 21.1%), 20 to 24 minutes (861 commuters, 20.7%), and 15 to 19 minutes (587 commuters, 14.1%).
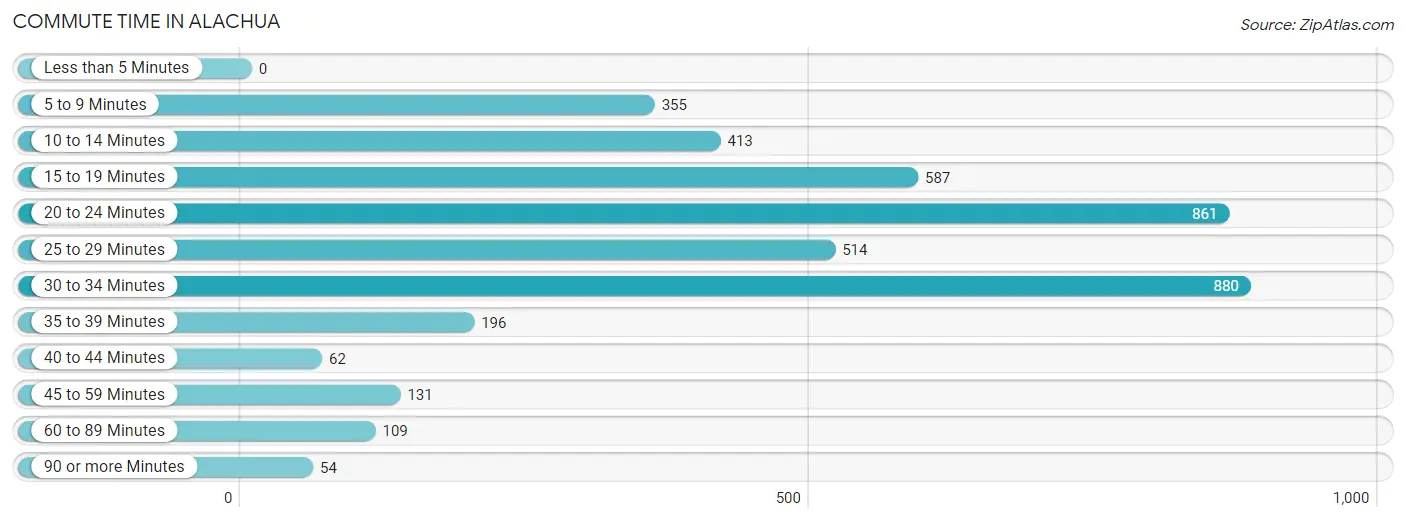
| Commute Time | # Commuters | % Commuters |
| Less than 5 Minutes | 0 | 0.0% |
| 5 to 9 Minutes | 355 | 8.5% |
| 10 to 14 Minutes | 413 | 9.9% |
| 15 to 19 Minutes | 587 | 14.1% |
| 20 to 24 Minutes | 861 | 20.7% |
| 25 to 29 Minutes | 514 | 12.3% |
| 30 to 34 Minutes | 880 | 21.1% |
| 35 to 39 Minutes | 196 | 4.7% |
| 40 to 44 Minutes | 62 | 1.5% |
| 45 to 59 Minutes | 131 | 3.2% |
| 60 to 89 Minutes | 109 | 2.6% |
| 90 or more Minutes | 54 | 1.3% |
Commute Time by Sex in Alachua
The most common commute times in Alachua are 30 to 34 minutes (414 commuters, 22.5%) for males and 20 to 24 minutes (678 commuters, 29.2%) for females.
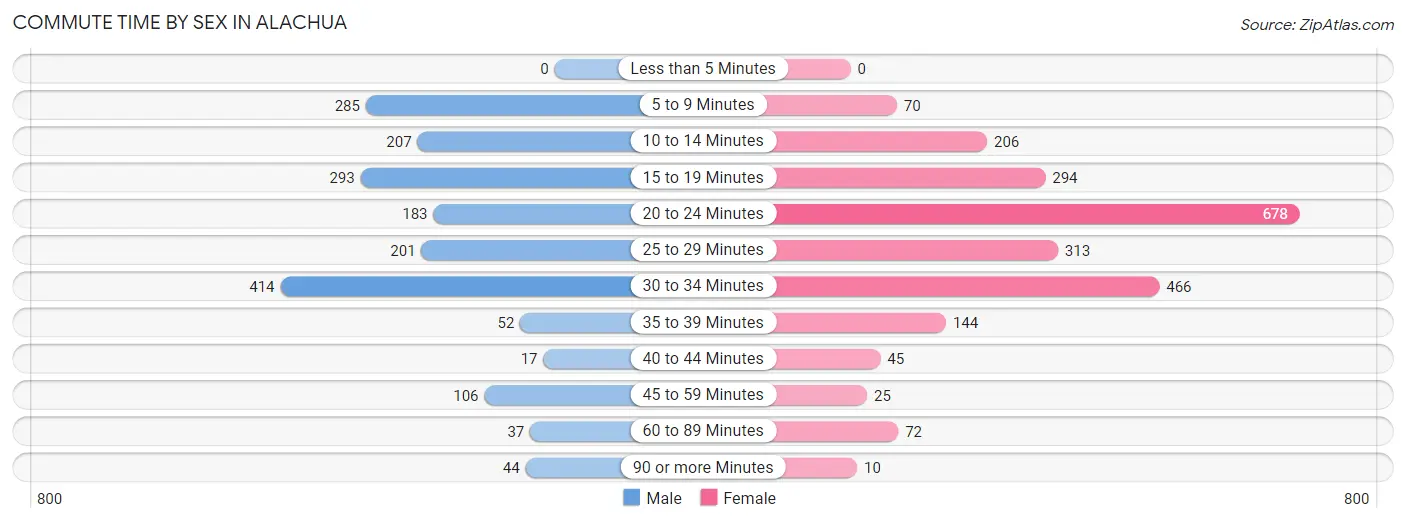
| Commute Time | Male | Female |
| Less than 5 Minutes | 0 (0.0%) | 0 (0.0%) |
| 5 to 9 Minutes | 285 (15.5%) | 70 (3.0%) |
| 10 to 14 Minutes | 207 (11.3%) | 206 (8.9%) |
| 15 to 19 Minutes | 293 (15.9%) | 294 (12.7%) |
| 20 to 24 Minutes | 183 (10.0%) | 678 (29.2%) |
| 25 to 29 Minutes | 201 (10.9%) | 313 (13.5%) |
| 30 to 34 Minutes | 414 (22.5%) | 466 (20.1%) |
| 35 to 39 Minutes | 52 (2.8%) | 144 (6.2%) |
| 40 to 44 Minutes | 17 (0.9%) | 45 (1.9%) |
| 45 to 59 Minutes | 106 (5.8%) | 25 (1.1%) |
| 60 to 89 Minutes | 37 (2.0%) | 72 (3.1%) |
| 90 or more Minutes | 44 (2.4%) | 10 (0.4%) |
Time of Departure to Work by Sex in Alachua
The most frequent times of departure to work in Alachua are 6:00 AM to 6:29 AM (277, 15.1%) for males and 7:00 AM to 7:29 AM (441, 19.0%) for females.
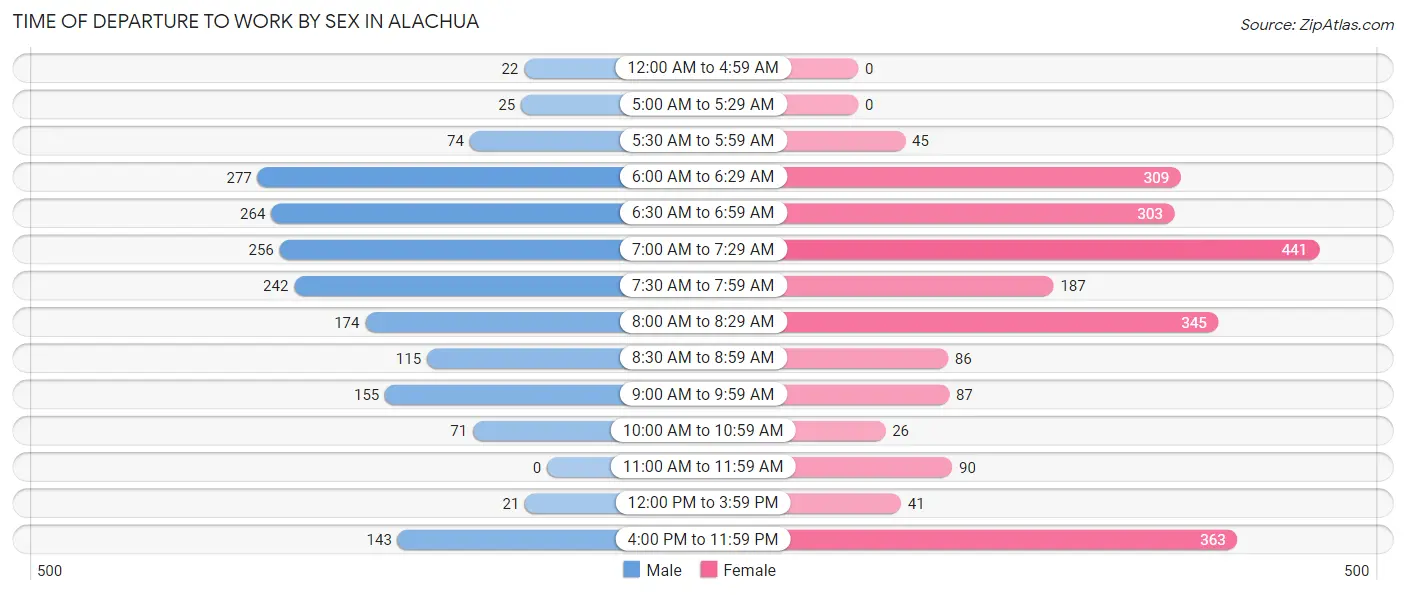
| Time of Departure | Male | Female |
| 12:00 AM to 4:59 AM | 22 (1.2%) | 0 (0.0%) |
| 5:00 AM to 5:29 AM | 25 (1.4%) | 0 (0.0%) |
| 5:30 AM to 5:59 AM | 74 (4.0%) | 45 (1.9%) |
| 6:00 AM to 6:29 AM | 277 (15.1%) | 309 (13.3%) |
| 6:30 AM to 6:59 AM | 264 (14.4%) | 303 (13.0%) |
| 7:00 AM to 7:29 AM | 256 (13.9%) | 441 (19.0%) |
| 7:30 AM to 7:59 AM | 242 (13.2%) | 187 (8.1%) |
| 8:00 AM to 8:29 AM | 174 (9.5%) | 345 (14.8%) |
| 8:30 AM to 8:59 AM | 115 (6.2%) | 86 (3.7%) |
| 9:00 AM to 9:59 AM | 155 (8.4%) | 87 (3.7%) |
| 10:00 AM to 10:59 AM | 71 (3.9%) | 26 (1.1%) |
| 11:00 AM to 11:59 AM | 0 (0.0%) | 90 (3.9%) |
| 12:00 PM to 3:59 PM | 21 (1.1%) | 41 (1.8%) |
| 4:00 PM to 11:59 PM | 143 (7.8%) | 363 (15.6%) |
| Total | 1,839 (100.0%) | 2,323 (100.0%) |
Housing Occupancy in Alachua
Occupancy by Ownership in Alachua
Of the total 4,249 dwellings in Alachua, owner-occupied units account for 3,045 (71.7%), while renter-occupied units make up 1,204 (28.3%).
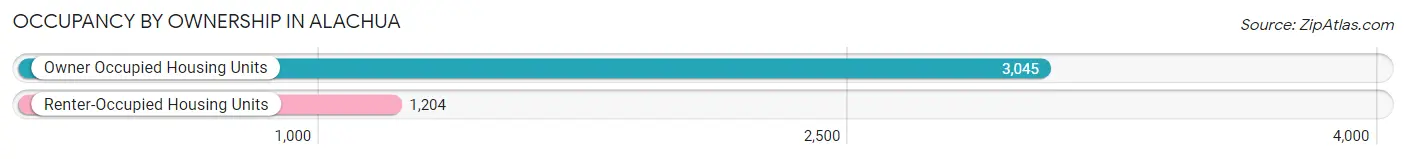
| Occupancy | # Housing Units | % Housing Units |
| Owner Occupied Housing Units | 3,045 | 71.7% |
| Renter-Occupied Housing Units | 1,204 | 28.3% |
| Total Occupied Housing Units | 4,249 | 100.0% |
Occupancy by Household Size in Alachua
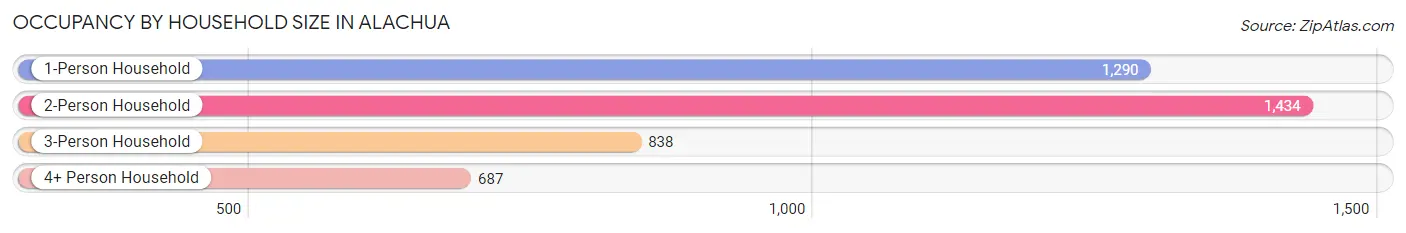
| Household Size | # Housing Units | % Housing Units |
| 1-Person Household | 1,290 | 30.4% |
| 2-Person Household | 1,434 | 33.8% |
| 3-Person Household | 838 | 19.7% |
| 4+ Person Household | 687 | 16.2% |
| Total Housing Units | 4,249 | 100.0% |
Occupancy by Ownership by Household Size in Alachua
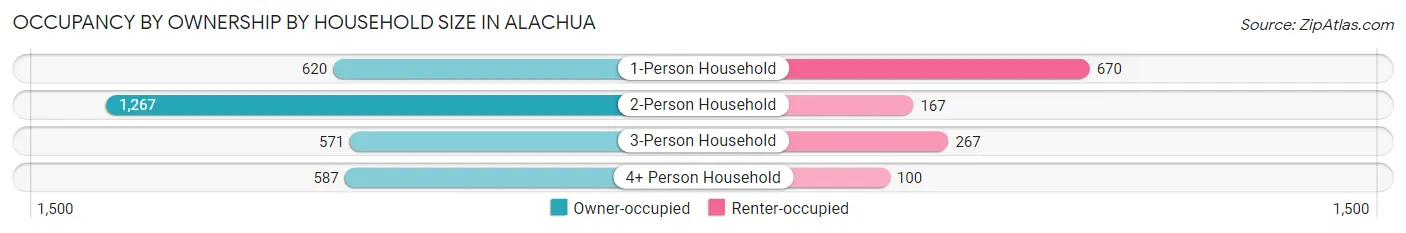
| Household Size | Owner-occupied | Renter-occupied |
| 1-Person Household | 620 (48.1%) | 670 (51.9%) |
| 2-Person Household | 1,267 (88.3%) | 167 (11.7%) |
| 3-Person Household | 571 (68.1%) | 267 (31.9%) |
| 4+ Person Household | 587 (85.4%) | 100 (14.6%) |
| Total Housing Units | 3,045 (71.7%) | 1,204 (28.3%) |
Occupancy by Educational Attainment in Alachua
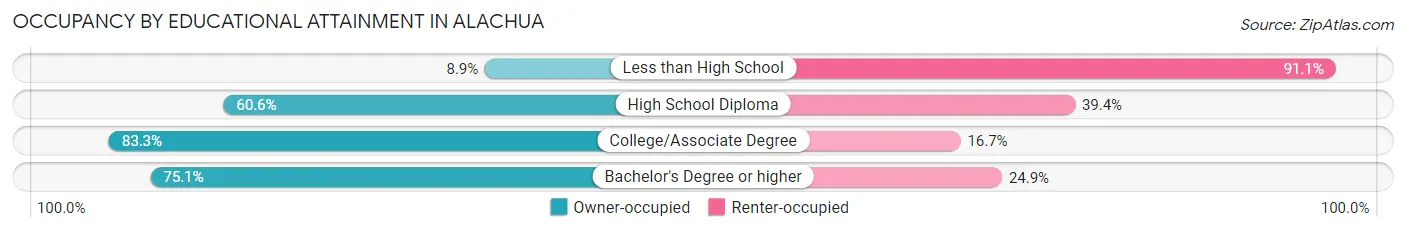
| Household Size | Owner-occupied | Renter-occupied |
| Less than High School | 12 (8.9%) | 123 (91.1%) |
| High School Diploma | 618 (60.6%) | 402 (39.4%) |
| College/Associate Degree | 937 (83.3%) | 188 (16.7%) |
| Bachelor's Degree or higher | 1,478 (75.1%) | 491 (24.9%) |
Occupancy by Age of Householder in Alachua
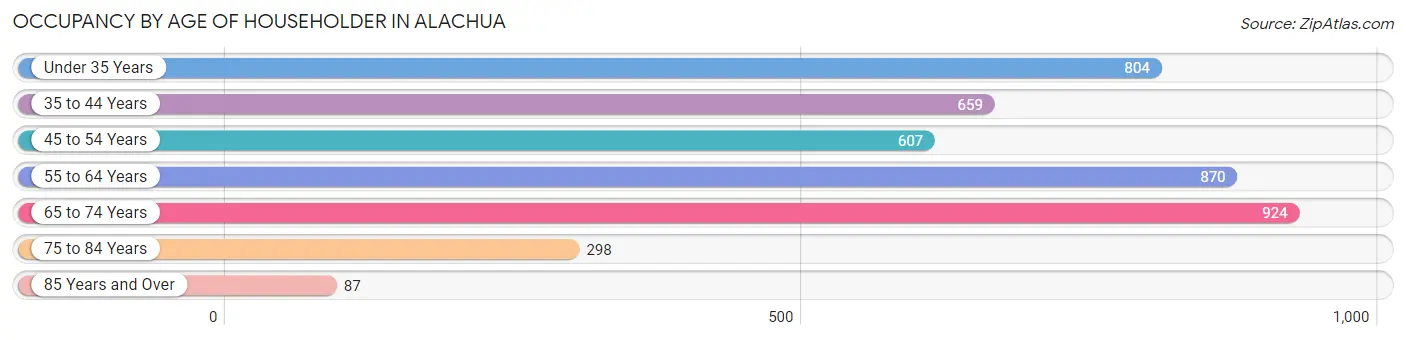
| Age Bracket | # Households | % Households |
| Under 35 Years | 804 | 18.9% |
| 35 to 44 Years | 659 | 15.5% |
| 45 to 54 Years | 607 | 14.3% |
| 55 to 64 Years | 870 | 20.5% |
| 65 to 74 Years | 924 | 21.7% |
| 75 to 84 Years | 298 | 7.0% |
| 85 Years and Over | 87 | 2.1% |
| Total | 4,249 | 100.0% |
Housing Finances in Alachua
Median Income by Occupancy in Alachua
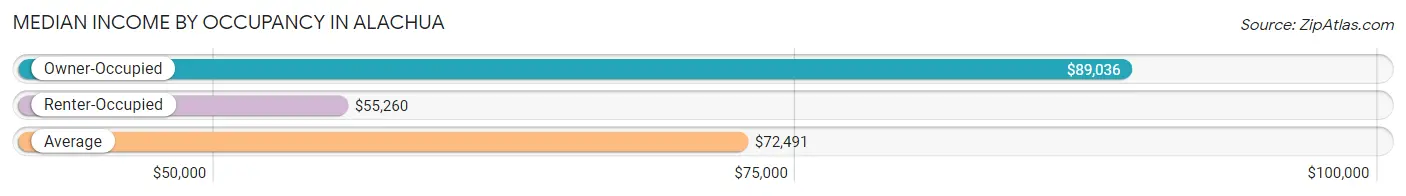
| Occupancy Type | # Households | Median Income |
| Owner-Occupied | 3,045 (71.7%) | $89,036 |
| Renter-Occupied | 1,204 (28.3%) | $55,260 |
| Average | 4,249 (100.0%) | $72,491 |
Occupancy by Householder Income Bracket in Alachua
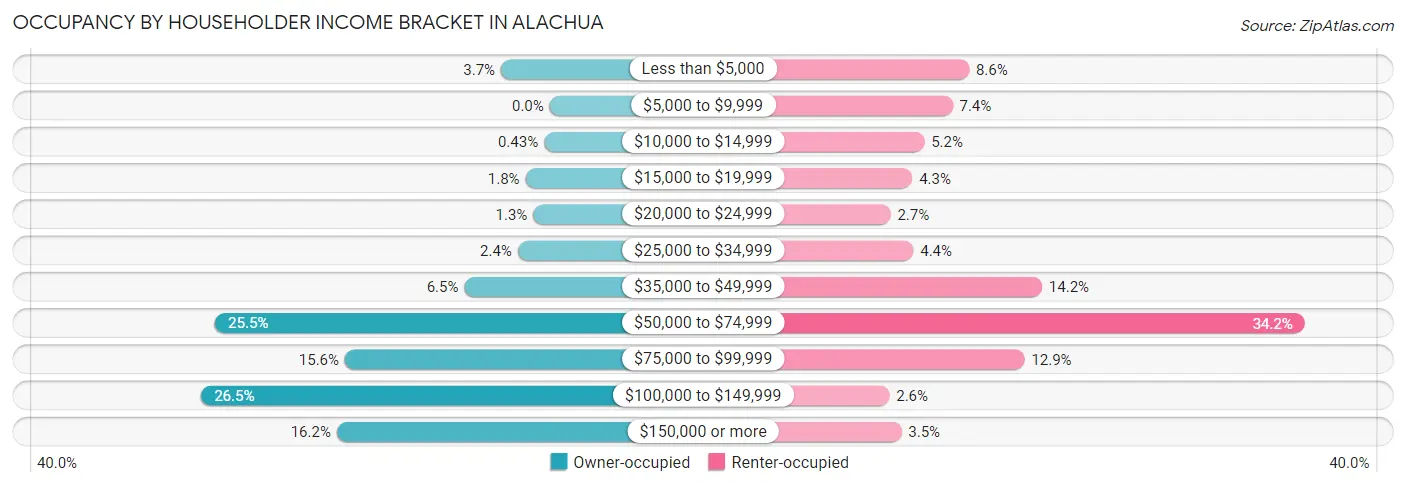
| Income Bracket | Owner-occupied | Renter-occupied |
| Less than $5,000 | 113 (3.7%) | 104 (8.6%) |
| $5,000 to $9,999 | 0 (0.0%) | 89 (7.4%) |
| $10,000 to $14,999 | 13 (0.4%) | 63 (5.2%) |
| $15,000 to $19,999 | 56 (1.8%) | 52 (4.3%) |
| $20,000 to $24,999 | 38 (1.3%) | 32 (2.7%) |
| $25,000 to $34,999 | 74 (2.4%) | 53 (4.4%) |
| $35,000 to $49,999 | 198 (6.5%) | 171 (14.2%) |
| $50,000 to $74,999 | 776 (25.5%) | 412 (34.2%) |
| $75,000 to $99,999 | 475 (15.6%) | 155 (12.9%) |
| $100,000 to $149,999 | 808 (26.5%) | 31 (2.6%) |
| $150,000 or more | 494 (16.2%) | 42 (3.5%) |
| Total | 3,045 (100.0%) | 1,204 (100.0%) |
Monthly Housing Cost Tiers in Alachua
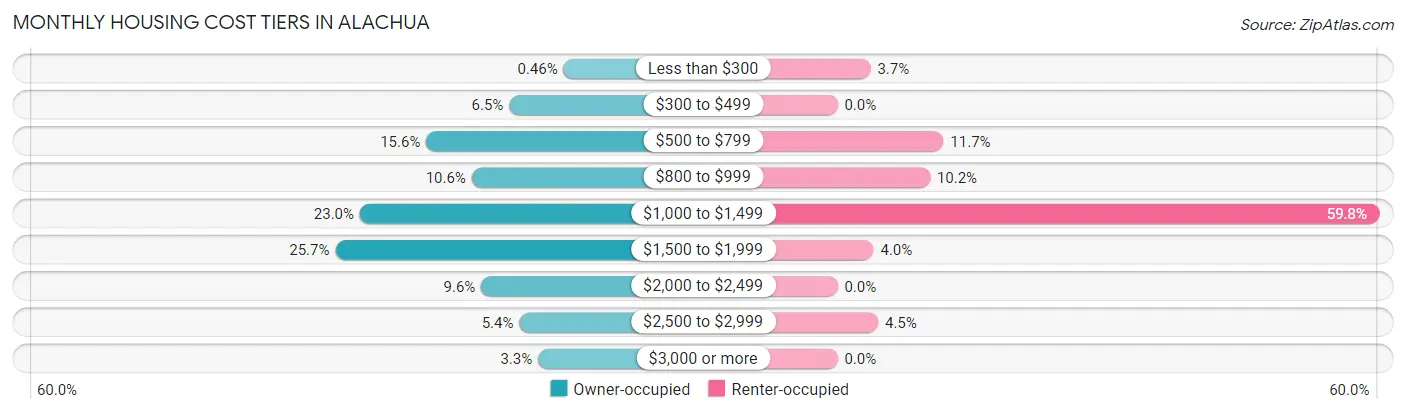
| Monthly Cost | Owner-occupied | Renter-occupied |
| Less than $300 | 14 (0.5%) | 44 (3.6%) |
| $300 to $499 | 197 (6.5%) | 0 (0.0%) |
| $500 to $799 | 476 (15.6%) | 141 (11.7%) |
| $800 to $999 | 323 (10.6%) | 123 (10.2%) |
| $1,000 to $1,499 | 699 (23.0%) | 720 (59.8%) |
| $1,500 to $1,999 | 782 (25.7%) | 48 (4.0%) |
| $2,000 to $2,499 | 291 (9.6%) | 0 (0.0%) |
| $2,500 to $2,999 | 163 (5.3%) | 54 (4.5%) |
| $3,000 or more | 100 (3.3%) | 0 (0.0%) |
| Total | 3,045 (100.0%) | 1,204 (100.0%) |
Physical Housing Characteristics in Alachua
Housing Structures in Alachua
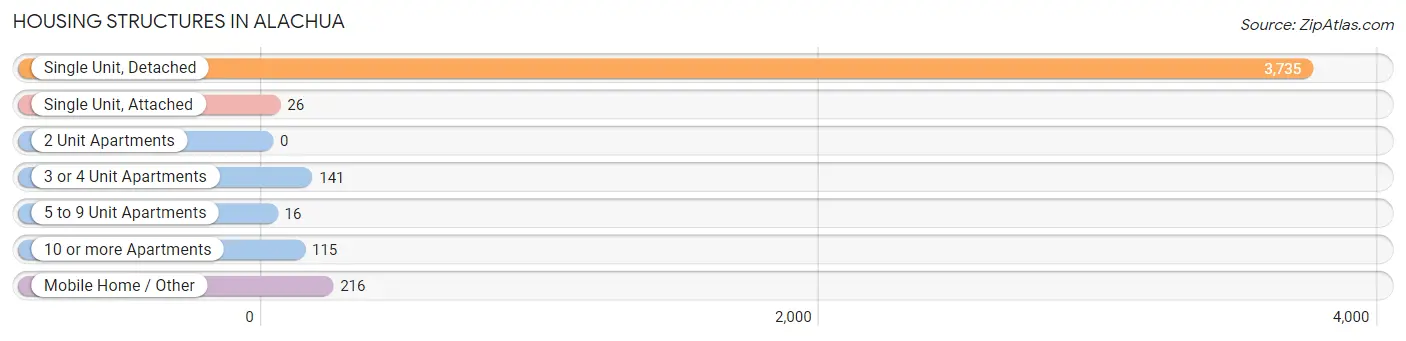
| Structure Type | # Housing Units | % Housing Units |
| Single Unit, Detached | 3,735 | 87.9% |
| Single Unit, Attached | 26 | 0.6% |
| 2 Unit Apartments | 0 | 0.0% |
| 3 or 4 Unit Apartments | 141 | 3.3% |
| 5 to 9 Unit Apartments | 16 | 0.4% |
| 10 or more Apartments | 115 | 2.7% |
| Mobile Home / Other | 216 | 5.1% |
| Total | 4,249 | 100.0% |
Housing Structures by Occupancy in Alachua
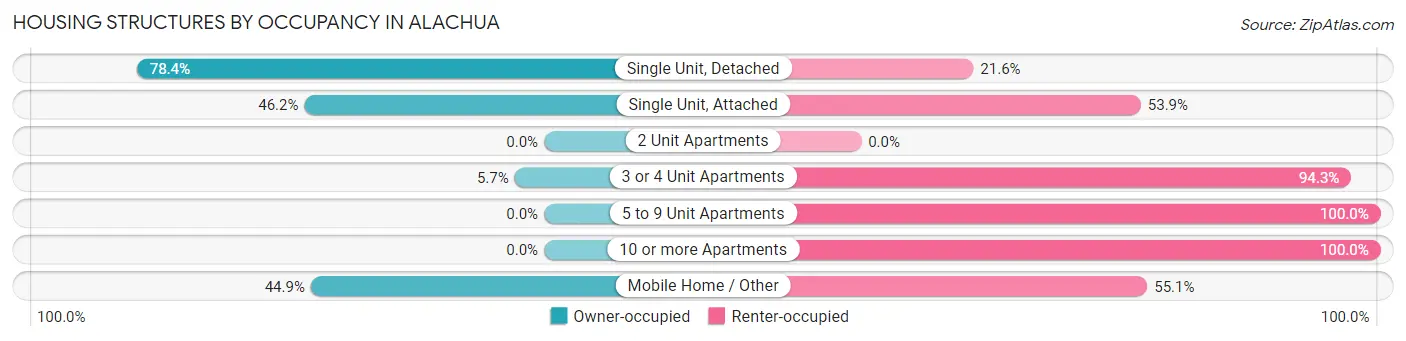
| Structure Type | Owner-occupied | Renter-occupied |
| Single Unit, Detached | 2,928 (78.4%) | 807 (21.6%) |
| Single Unit, Attached | 12 (46.2%) | 14 (53.8%) |
| 2 Unit Apartments | 0 (0.0%) | 0 (0.0%) |
| 3 or 4 Unit Apartments | 8 (5.7%) | 133 (94.3%) |
| 5 to 9 Unit Apartments | 0 (0.0%) | 16 (100.0%) |
| 10 or more Apartments | 0 (0.0%) | 115 (100.0%) |
| Mobile Home / Other | 97 (44.9%) | 119 (55.1%) |
| Total | 3,045 (71.7%) | 1,204 (28.3%) |
Housing Structures by Number of Rooms in Alachua
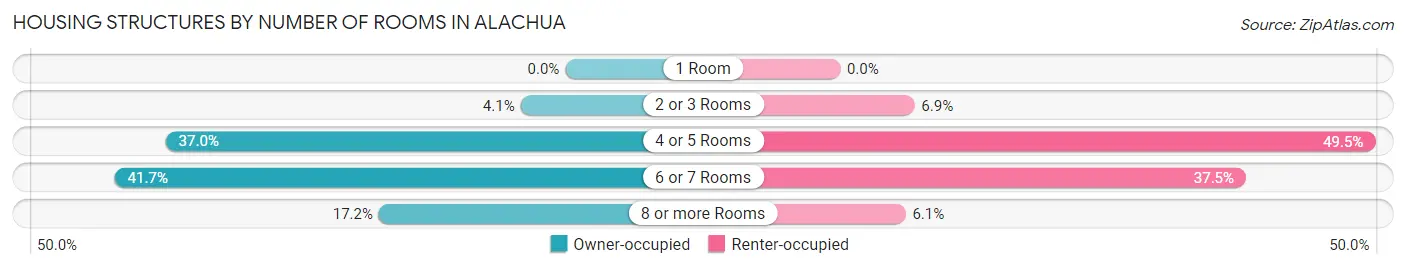
| Number of Rooms | Owner-occupied | Renter-occupied |
| 1 Room | 0 (0.0%) | 0 (0.0%) |
| 2 or 3 Rooms | 126 (4.1%) | 83 (6.9%) |
| 4 or 5 Rooms | 1,125 (36.9%) | 596 (49.5%) |
| 6 or 7 Rooms | 1,269 (41.7%) | 452 (37.5%) |
| 8 or more Rooms | 525 (17.2%) | 73 (6.1%) |
| Total | 3,045 (100.0%) | 1,204 (100.0%) |
Housing Structure by Heating Type in Alachua
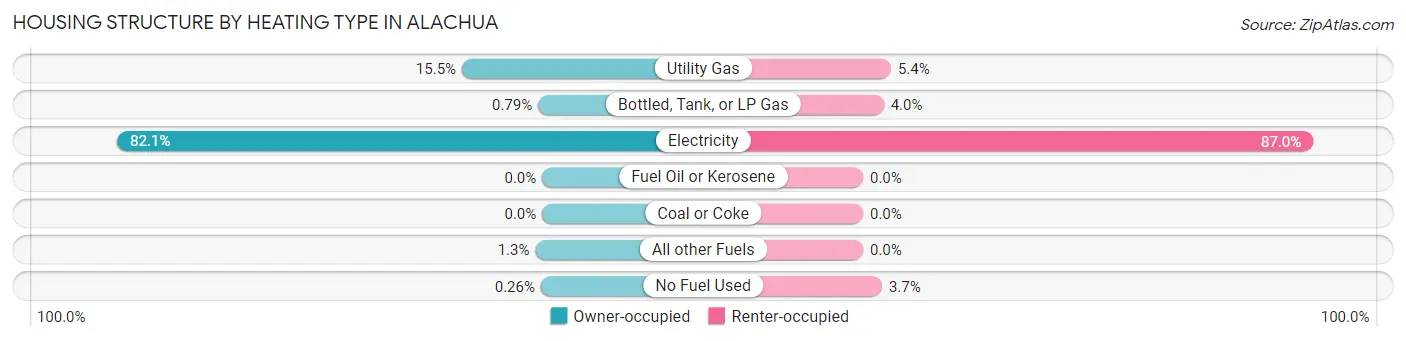
| Heating Type | Owner-occupied | Renter-occupied |
| Utility Gas | 472 (15.5%) | 65 (5.4%) |
| Bottled, Tank, or LP Gas | 24 (0.8%) | 48 (4.0%) |
| Electricity | 2,501 (82.1%) | 1,047 (87.0%) |
| Fuel Oil or Kerosene | 0 (0.0%) | 0 (0.0%) |
| Coal or Coke | 0 (0.0%) | 0 (0.0%) |
| All other Fuels | 40 (1.3%) | 0 (0.0%) |
| No Fuel Used | 8 (0.3%) | 44 (3.6%) |
| Total | 3,045 (100.0%) | 1,204 (100.0%) |
Household Vehicle Usage in Alachua
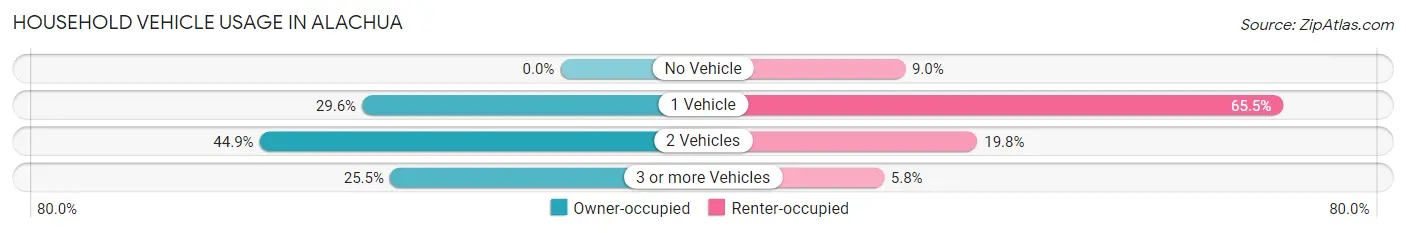
| Vehicles per Household | Owner-occupied | Renter-occupied |
| No Vehicle | 0 (0.0%) | 108 (9.0%) |
| 1 Vehicle | 902 (29.6%) | 788 (65.4%) |
| 2 Vehicles | 1,368 (44.9%) | 238 (19.8%) |
| 3 or more Vehicles | 775 (25.5%) | 70 (5.8%) |
| Total | 3,045 (100.0%) | 1,204 (100.0%) |
Real Estate & Mortgages in Alachua
Real Estate and Mortgage Overview in Alachua
| Characteristic | Without Mortgage | With Mortgage |
| Housing Units | 766 | 2,279 |
| Median Property Value | $281,000 | $264,100 |
| Median Household Income | $62,474 | $361 |
| Monthly Housing Costs | $619 | $100 |
| Real Estate Taxes | $2,812 | $75 |
Property Value by Mortgage Status in Alachua
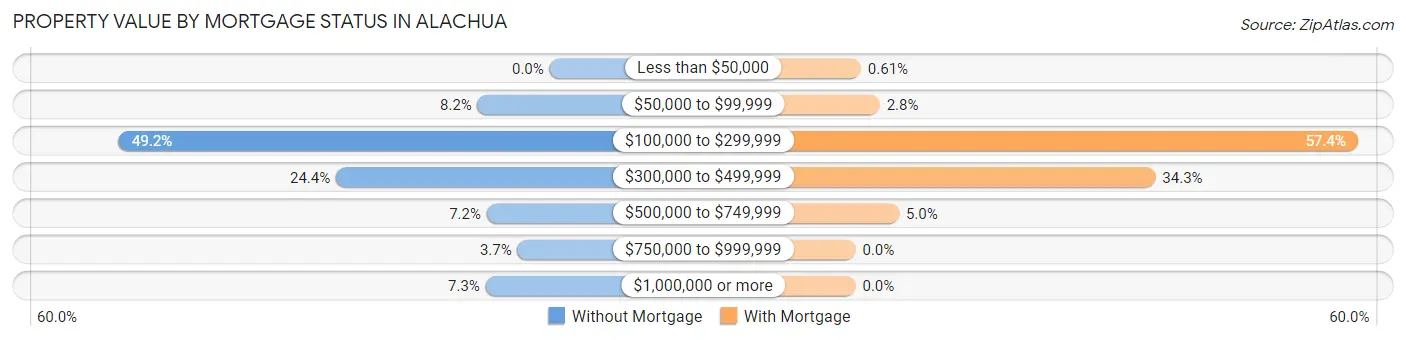
| Property Value | Without Mortgage | With Mortgage |
| Less than $50,000 | 0 (0.0%) | 14 (0.6%) |
| $50,000 to $99,999 | 63 (8.2%) | 63 (2.8%) |
| $100,000 to $299,999 | 377 (49.2%) | 1,308 (57.4%) |
| $300,000 to $499,999 | 187 (24.4%) | 781 (34.3%) |
| $500,000 to $749,999 | 55 (7.2%) | 113 (5.0%) |
| $750,000 to $999,999 | 28 (3.7%) | 0 (0.0%) |
| $1,000,000 or more | 56 (7.3%) | 0 (0.0%) |
| Total | 766 (100.0%) | 2,279 (100.0%) |
Household Income by Mortgage Status in Alachua
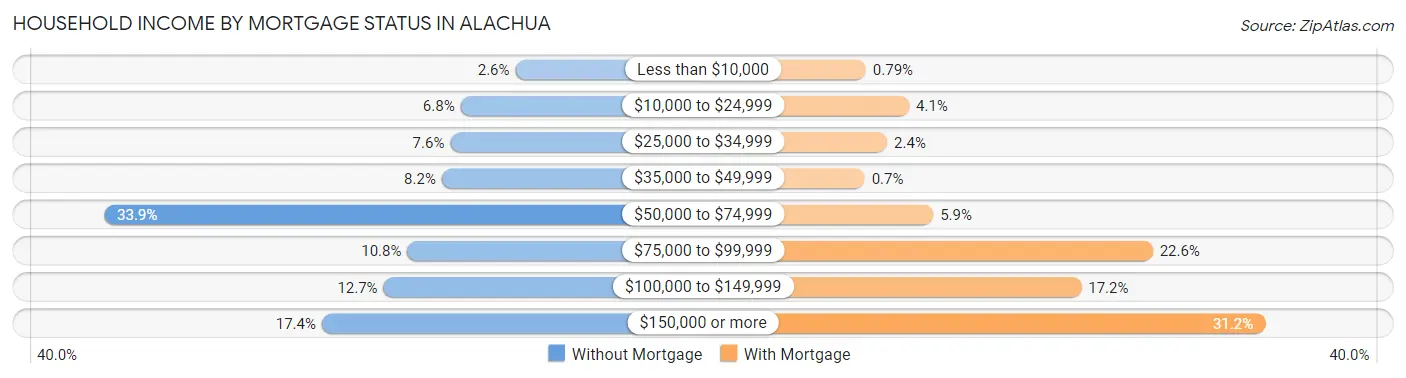
| Household Income | Without Mortgage | With Mortgage |
| Less than $10,000 | 20 (2.6%) | 18 (0.8%) |
| $10,000 to $24,999 | 52 (6.8%) | 93 (4.1%) |
| $25,000 to $34,999 | 58 (7.6%) | 55 (2.4%) |
| $35,000 to $49,999 | 63 (8.2%) | 16 (0.7%) |
| $50,000 to $74,999 | 260 (33.9%) | 135 (5.9%) |
| $75,000 to $99,999 | 83 (10.8%) | 516 (22.6%) |
| $100,000 to $149,999 | 97 (12.7%) | 392 (17.2%) |
| $150,000 or more | 133 (17.4%) | 711 (31.2%) |
| Total | 766 (100.0%) | 2,279 (100.0%) |
Property Value to Household Income Ratio in Alachua
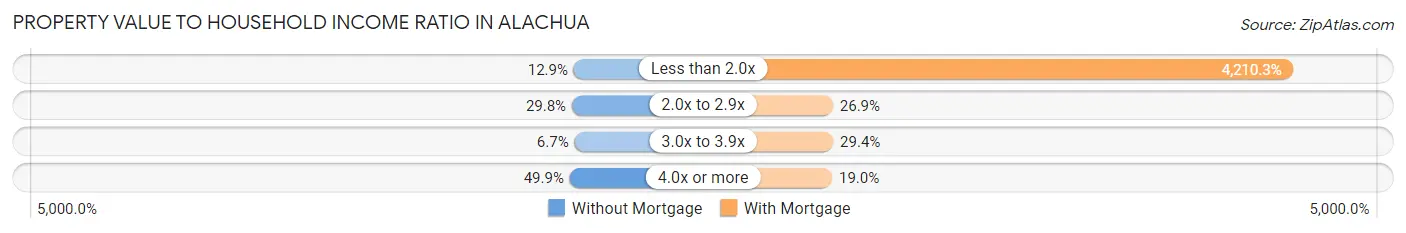
| Value-to-Income Ratio | Without Mortgage | With Mortgage |
| Less than 2.0x | 99 (12.9%) | 95,952 (4,210.3%) |
| 2.0x to 2.9x | 228 (29.8%) | 613 (26.9%) |
| 3.0x to 3.9x | 51 (6.7%) | 671 (29.4%) |
| 4.0x or more | 382 (49.9%) | 433 (19.0%) |
| Total | 766 (100.0%) | 2,279 (100.0%) |
Real Estate Taxes by Mortgage Status in Alachua
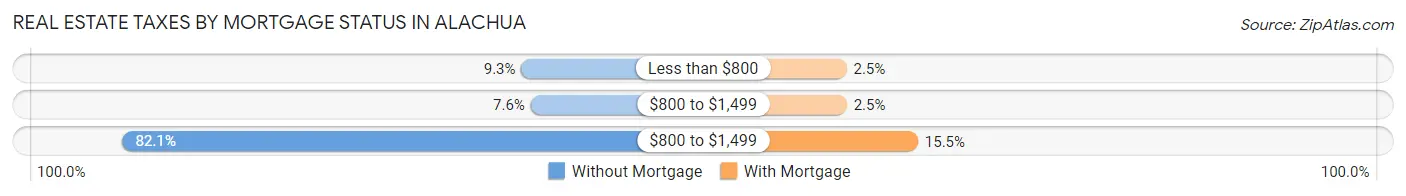
| Property Taxes | Without Mortgage | With Mortgage |
| Less than $800 | 71 (9.3%) | 56 (2.5%) |
| $800 to $1,499 | 58 (7.6%) | 57 (2.5%) |
| $800 to $1,499 | 629 (82.1%) | 353 (15.5%) |
| Total | 766 (100.0%) | 2,279 (100.0%) |
Health & Disability in Alachua
Health Insurance Coverage by Age in Alachua
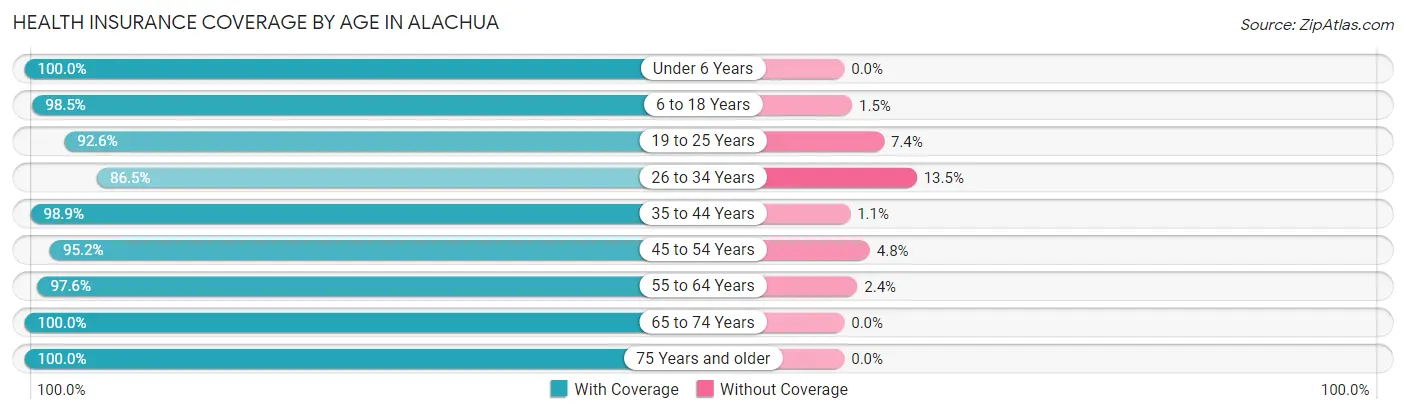
| Age Bracket | With Coverage | Without Coverage |
| Under 6 Years | 873 (100.0%) | 0 (0.0%) |
| 6 to 18 Years | 1,750 (98.5%) | 26 (1.5%) |
| 19 to 25 Years | 612 (92.6%) | 49 (7.4%) |
| 26 to 34 Years | 1,114 (86.5%) | 174 (13.5%) |
| 35 to 44 Years | 1,244 (98.9%) | 14 (1.1%) |
| 45 to 54 Years | 1,057 (95.2%) | 53 (4.8%) |
| 55 to 64 Years | 1,447 (97.6%) | 36 (2.4%) |
| 65 to 74 Years | 1,425 (100.0%) | 0 (0.0%) |
| 75 Years and older | 696 (100.0%) | 0 (0.0%) |
| Total | 10,218 (96.7%) | 352 (3.3%) |
Health Insurance Coverage by Citizenship Status in Alachua
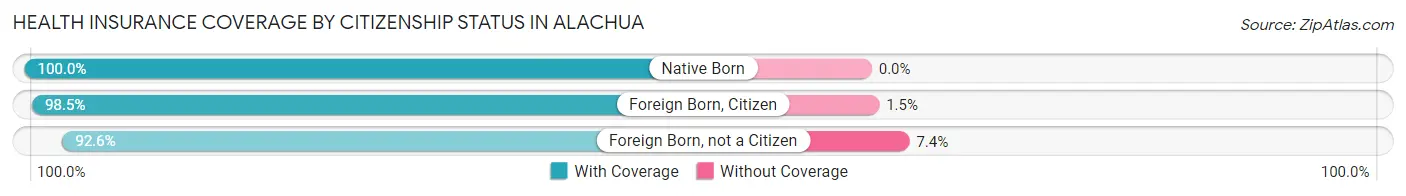
| Citizenship Status | With Coverage | Without Coverage |
| Native Born | 873 (100.0%) | 0 (0.0%) |
| Foreign Born, Citizen | 1,750 (98.5%) | 26 (1.5%) |
| Foreign Born, not a Citizen | 612 (92.6%) | 49 (7.4%) |
Health Insurance Coverage by Household Income in Alachua
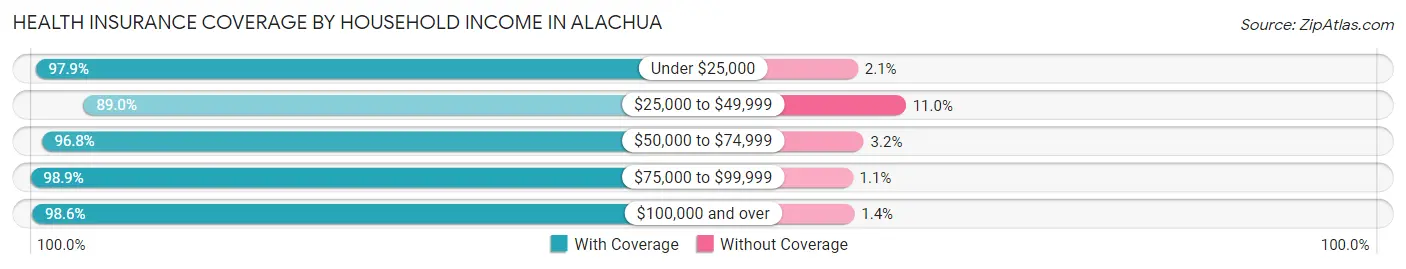
| Household Income | With Coverage | Without Coverage |
| Under $25,000 | 806 (97.9%) | 17 (2.1%) |
| $25,000 to $49,999 | 1,491 (89.0%) | 185 (11.0%) |
| $50,000 to $74,999 | 2,203 (96.8%) | 72 (3.2%) |
| $75,000 to $99,999 | 1,465 (98.9%) | 16 (1.1%) |
| $100,000 and over | 4,241 (98.6%) | 61 (1.4%) |
Public vs Private Health Insurance Coverage by Age in Alachua
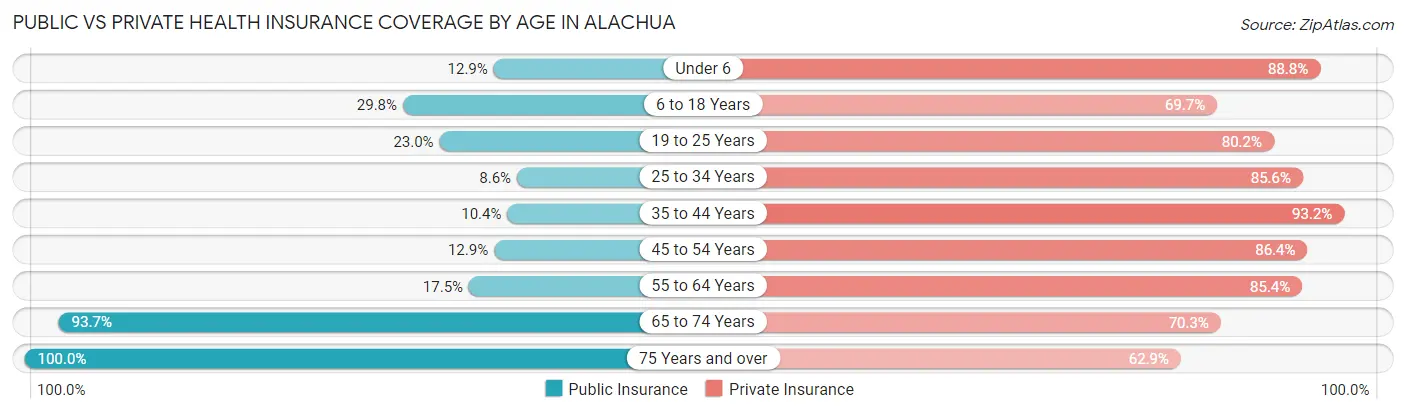
| Age Bracket | Public Insurance | Private Insurance |
| Under 6 | 113 (12.9%) | 775 (88.8%) |
| 6 to 18 Years | 529 (29.8%) | 1,237 (69.7%) |
| 19 to 25 Years | 152 (23.0%) | 530 (80.2%) |
| 25 to 34 Years | 111 (8.6%) | 1,102 (85.6%) |
| 35 to 44 Years | 131 (10.4%) | 1,173 (93.2%) |
| 45 to 54 Years | 143 (12.9%) | 959 (86.4%) |
| 55 to 64 Years | 260 (17.5%) | 1,267 (85.4%) |
| 65 to 74 Years | 1,335 (93.7%) | 1,002 (70.3%) |
| 75 Years and over | 696 (100.0%) | 438 (62.9%) |
| Total | 3,470 (32.8%) | 8,483 (80.3%) |
Disability Status by Sex by Age in Alachua
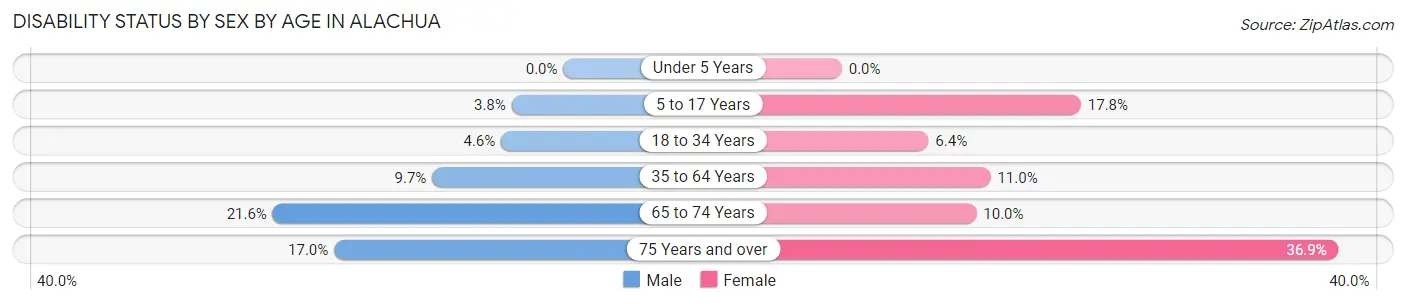
| Age Bracket | Male | Female |
| Under 5 Years | 0 (0.0%) | 0 (0.0%) |
| 5 to 17 Years | 29 (3.8%) | 180 (17.7%) |
| 18 to 34 Years | 33 (4.6%) | 88 (6.4%) |
| 35 to 64 Years | 158 (9.7%) | 246 (11.0%) |
| 65 to 74 Years | 126 (21.6%) | 84 (10.0%) |
| 75 Years and over | 64 (17.0%) | 118 (36.9%) |
Disability Class by Sex by Age in Alachua
Disability Class: Hearing Difficulty
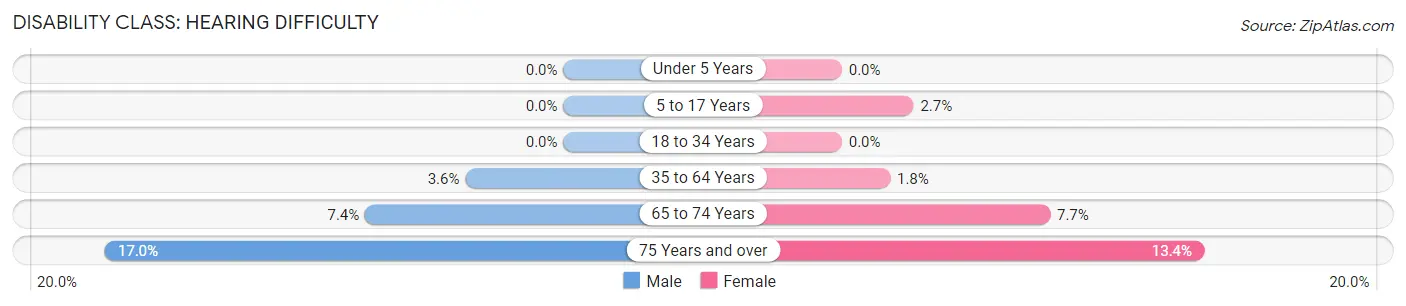
| Age Bracket | Male | Female |
| Under 5 Years | 0 (0.0%) | 0 (0.0%) |
| 5 to 17 Years | 0 (0.0%) | 27 (2.7%) |
| 18 to 34 Years | 0 (0.0%) | 0 (0.0%) |
| 35 to 64 Years | 59 (3.6%) | 40 (1.8%) |
| 65 to 74 Years | 43 (7.4%) | 65 (7.7%) |
| 75 Years and over | 64 (17.0%) | 43 (13.4%) |
Disability Class: Vision Difficulty
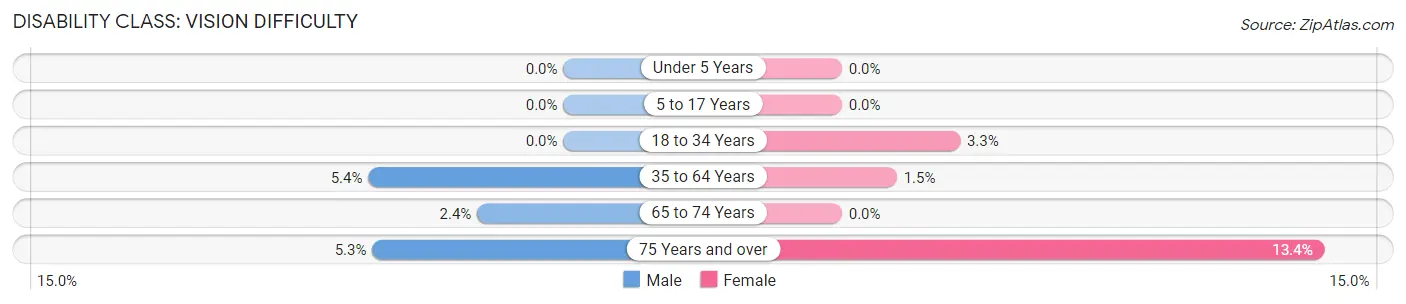
| Age Bracket | Male | Female |
| Under 5 Years | 0 (0.0%) | 0 (0.0%) |
| 5 to 17 Years | 0 (0.0%) | 0 (0.0%) |
| 18 to 34 Years | 0 (0.0%) | 45 (3.3%) |
| 35 to 64 Years | 88 (5.4%) | 34 (1.5%) |
| 65 to 74 Years | 14 (2.4%) | 0 (0.0%) |
| 75 Years and over | 20 (5.3%) | 43 (13.4%) |
Disability Class: Cognitive Difficulty
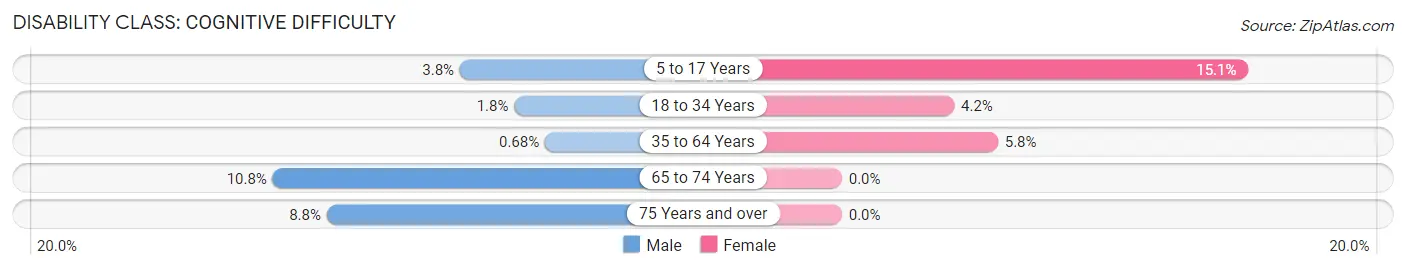
| Age Bracket | Male | Female |
| 5 to 17 Years | 29 (3.8%) | 153 (15.1%) |
| 18 to 34 Years | 13 (1.8%) | 57 (4.2%) |
| 35 to 64 Years | 11 (0.7%) | 129 (5.8%) |
| 65 to 74 Years | 63 (10.8%) | 0 (0.0%) |
| 75 Years and over | 33 (8.8%) | 0 (0.0%) |
Disability Class: Ambulatory Difficulty
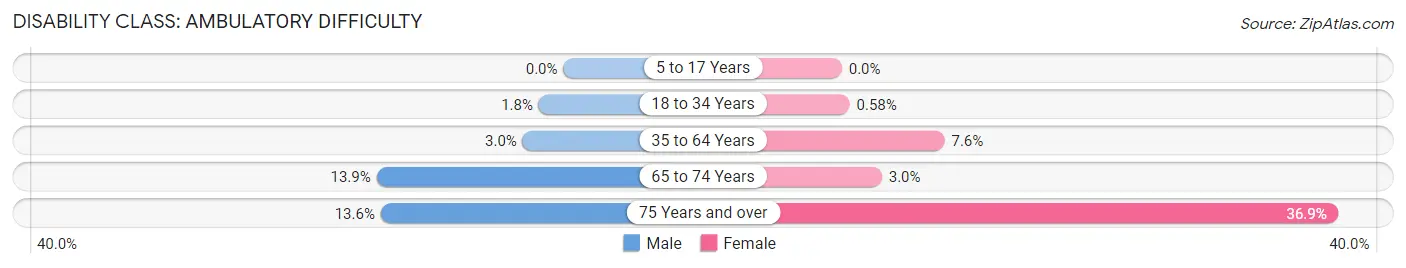
| Age Bracket | Male | Female |
| 5 to 17 Years | 0 (0.0%) | 0 (0.0%) |
| 18 to 34 Years | 13 (1.8%) | 8 (0.6%) |
| 35 to 64 Years | 49 (3.0%) | 170 (7.6%) |
| 65 to 74 Years | 81 (13.9%) | 25 (3.0%) |
| 75 Years and over | 51 (13.6%) | 118 (36.9%) |
Disability Class: Self-Care Difficulty
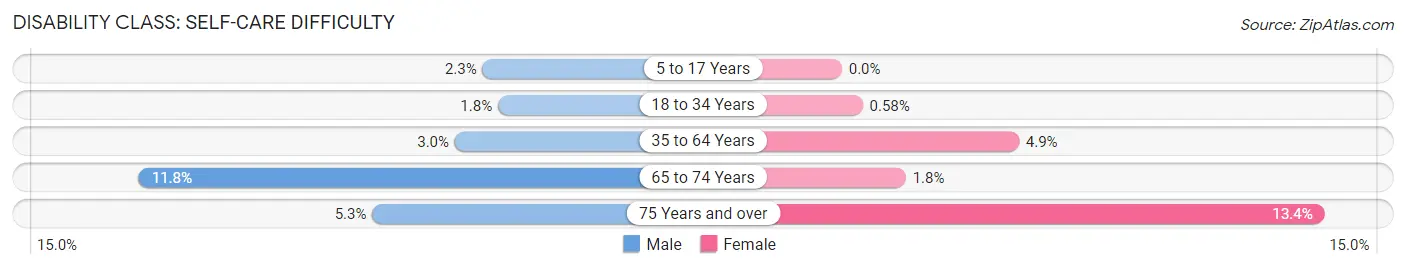
| Age Bracket | Male | Female |
| 5 to 17 Years | 17 (2.2%) | 0 (0.0%) |
| 18 to 34 Years | 13 (1.8%) | 8 (0.6%) |
| 35 to 64 Years | 49 (3.0%) | 110 (4.9%) |
| 65 to 74 Years | 69 (11.8%) | 15 (1.8%) |
| 75 Years and over | 20 (5.3%) | 43 (13.4%) |
Technology Access in Alachua
Computing Device Access in Alachua
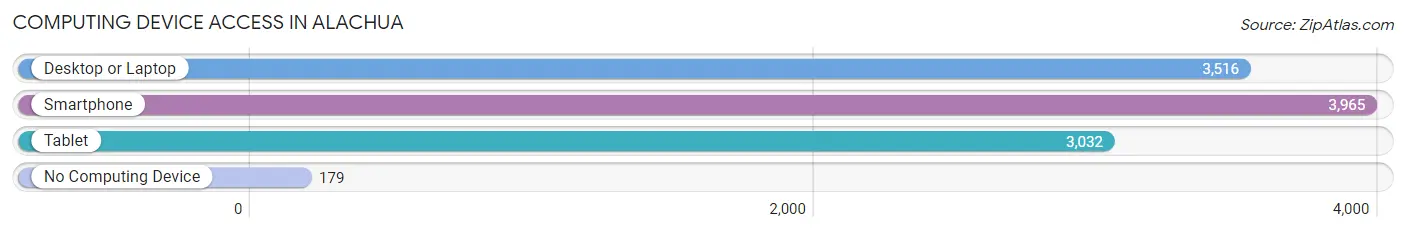
| Device Type | # Households | % Households |
| Desktop or Laptop | 3,516 | 82.8% |
| Smartphone | 3,965 | 93.3% |
| Tablet | 3,032 | 71.4% |
| No Computing Device | 179 | 4.2% |
| Total | 4,249 | 100.0% |
Internet Access in Alachua
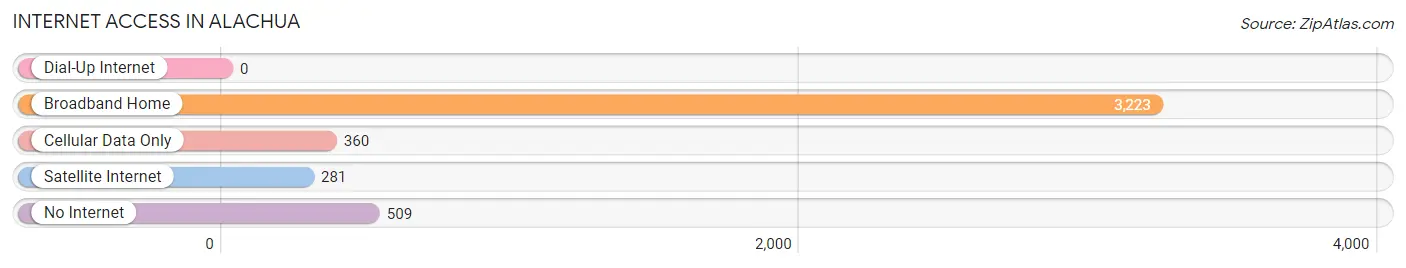
| Internet Type | # Households | % Households |
| Dial-Up Internet | 0 | 0.0% |
| Broadband Home | 3,223 | 75.8% |
| Cellular Data Only | 360 | 8.5% |
| Satellite Internet | 281 | 6.6% |
| No Internet | 509 | 12.0% |
| Total | 4,249 | 100.0% |
Alachua Summary
Alachua is a city located in Alachua County, Florida, United States. It is the county seat of Alachua County and is located about 15 miles south of Gainesville, the county's largest city and the home of the University of Florida. The population of Alachua was 9,059 as of the 2010 census.
History
The area that is now Alachua was originally inhabited by the Timucua Indians. The first European settlers arrived in the area in the early 1800s, and the town of Alachua was established in 1824. The town was named after a Seminole Indian chief who lived in the area.
In 1854, Alachua County was created from parts of Columbia, Marion, and Levy counties. Alachua was chosen as the county seat, and the town was incorporated in 1859.
During the Civil War, Alachua was a center of Confederate activity. The town was the site of a Confederate hospital and a Confederate prison.
Geography
Alachua is located in north-central Florida, about 15 miles south of Gainesville. The city is situated in the rolling hills of the Florida panhandle, and is surrounded by forests and wetlands. The Santa Fe River runs through the city, and the nearby Paynes Prairie State Preserve is a popular destination for outdoor recreation.
The city has a total area of 8.2 square miles, of which 8.1 square miles is land and 0.1 square miles is water.
Economy
Alachua is home to several major employers, including the University of Florida, Santa Fe College, and the Alachua County Public Schools. The city is also home to several small businesses, including restaurants, retail stores, and professional services.
The city's economy is largely driven by the University of Florida, which is the largest employer in the city. The university is a major source of jobs and economic activity in the area.
Demographics
As of the 2010 census, there were 9,059 people, 3,541 households, and 2,072 families residing in the city. The population density was 1,112.3 people per square mile. The racial makeup of the city was 68.2% White, 22.3% African American, 0.4% Native American, 3.2% Asian, 0.1% Pacific Islander, 3.2% from other races, and 2.6% from two or more races. Hispanic or Latino of any race were 8.7% of the population.
The median income for a household in the city was $37,945, and the median income for a family was $50,945. The per capita income for the city was $20,945. About 17.2% of families and 22.2% of the population were below the poverty line, including 28.2% of those under age 18 and 11.2% of those age 65 or over.
Common Questions
What is Per Capita Income in Alachua?
Per Capita income in Alachua is $36,206.
What is the Median Family Income in Alachua?
Median Family Income in Alachua is $91,275.
What is the Median Household income in Alachua?
Median Household Income in Alachua is $72,491.
What is Income or Wage Gap in Alachua?
Income or Wage Gap in Alachua is 25.6%.
Women in Alachua earn 74.4 cents for every dollar earned by a man.
What is Family Income Deficit in Alachua?
Family Income Deficit in Alachua is $12,693.
Families that are below poverty line in Alachua earn $12,693 less on average than the poverty threshold level.
What is Inequality or Gini Index in Alachua?
Inequality or Gini Index in Alachua is 0.37.
What is the Total Population of Alachua?
Total Population of Alachua is 10,570.
What is the Total Male Population of Alachua?
Total Male Population of Alachua is 4,349.
What is the Total Female Population of Alachua?
Total Female Population of Alachua is 6,221.
What is the Ratio of Males per 100 Females in Alachua?
There are 69.91 Males per 100 Females in Alachua.
What is the Ratio of Females per 100 Males in Alachua?
There are 143.04 Females per 100 Males in Alachua.
What is the Median Population Age in Alachua?
Median Population Age in Alachua is 39.9 Years.
What is the Average Family Size in Alachua
Average Family Size in Alachua is 3.1 People.
What is the Average Household Size in Alachua
Average Household Size in Alachua is 2.5 People.
How Large is the Labor Force in Alachua?
There are 5,048 People in the Labor Forcein in Alachua.
What is the Percentage of People in the Labor Force in Alachua?
60.7% of People are in the Labor Force in Alachua.
What is the Unemployment Rate in Alachua?
Unemployment Rate in Alachua is 3.9%.