Zip Codes with the Highest Percentage of Not-for-profit Organizations in Washington, DC

RELATED REPORTS & OPTIONS

Not-for-profit Organizations
Population
Families and Households
Female Fertility
Female Fertility (Unmarried)
Race (Community Size)
Race (Percentage)
Ancestry (Community Size)
AfghanAfricanAlbanianAlsatianAmericanApacheArabArgentineanArmenianAssyrian / Chaldean / SyriacAustralianAustrianBahamianBarbadianBasqueBelgianBelizeanBermudanBhutaneseBlackfeetBolivianBrazilianBritishBritish West IndianBulgarianBurmeseCajunCambodianCanadianCape VerdeanCelticCentral AmericanCentral American IndianCherokeeChickasawChileanChineseChippewaChoctawColombianCosta RicanCreeCreekCroatianCubanCypriotCzechCzechoslovakianDanishDominicanDutchEastern EuropeanEcuadorianEgyptianEnglishEstonianEthiopianEuropeanFilipinoFinnishFrenchFrench American IndianFrench CanadianGermanGhanaianGreekGuamanian / ChamorroGuatemalanGuyaneseHaitianHonduranHungarianIcelanderIndian (Asian)IndonesianIranianIraqiIrishIroquoisIsraeliItalianJamaicanJapaneseJordanianKenyanKoreanLaotianLatvianLebaneseLiberianLithuanianLumbeeLuxembourgerMacedonianMalaysianMalteseMexicanMexican American IndianMongolianMoroccanNative HawaiianNavajoNew ZealanderNicaraguanNigerianNorthern EuropeanNorwegianOkinawanPakistaniPalestinianPanamanianParaguayanPennsylvania GermanPeruvianPolishPortuguesePuebloPuerto RicanRomanianRussianSalvadoranSamoanScandinavianScotch-IrishScottishSeminoleSenegaleseSerbianSierra LeoneanSlavicSlovakSloveneSomaliSouth AfricanSouth AmericanSouth American IndianSpaniardSpanishSri LankanSubsaharan AfricanSudaneseSwedishSwissSyrianThaiTlingit-HaidaTrinidadian and TobagonianTurkishU.S. Virgin IslanderUgandanUkrainianUruguayanVenezuelanVietnameseWelshWest IndianYugoslavianZimbabwean
Ancestry (Percentage)
AfghanAfricanAlbanianAlsatianAmericanApacheArabArgentineanArmenianAssyrian / Chaldean / SyriacAustralianAustrianBahamianBarbadianBasqueBelgianBelizeanBermudanBhutaneseBlackfeetBolivianBrazilianBritishBritish West IndianBulgarianBurmeseCajunCambodianCanadianCape VerdeanCelticCentral AmericanCentral American IndianCherokeeChickasawChileanChineseChippewaChoctawColombianCosta RicanCreeCreekCroatianCubanCypriotCzechCzechoslovakianDanishDominicanDutchEastern EuropeanEcuadorianEgyptianEnglishEstonianEthiopianEuropeanFilipinoFinnishFrenchFrench American IndianFrench CanadianGermanGhanaianGreekGuamanian / ChamorroGuatemalanGuyaneseHaitianHonduranHungarianIcelanderIndian (Asian)IndonesianIranianIraqiIrishIroquoisIsraeliItalianJamaicanJapaneseJordanianKenyanKoreanLaotianLatvianLebaneseLiberianLithuanianLumbeeLuxembourgerMacedonianMalaysianMalteseMexicanMexican American IndianMongolianMoroccanNative HawaiianNavajoNew ZealanderNicaraguanNigerianNorthern EuropeanNorwegianOkinawanPakistaniPalestinianPanamanianParaguayanPennsylvania GermanPeruvianPolishPortuguesePuebloPuerto RicanRomanianRussianSalvadoranSamoanScandinavianScotch-IrishScottishSeminoleSenegaleseSerbianSierra LeoneanSlavicSlovakSloveneSomaliSouth AfricanSouth AmericanSouth American IndianSpaniardSpanishSri LankanSubsaharan AfricanSudaneseSwedishSwissSyrianThaiTlingit-HaidaTrinidadian and TobagonianTurkishU.S. Virgin IslanderUgandanUkrainianUruguayanVenezuelanVietnameseWelshWest IndianYugoslavianZimbabwean
Immigrant Origin (Total)
AfghanistanAfricaAlbaniaArgentinaArmeniaAsiaAustraliaAustriaBahamasBangladeshBarbadosBelarusBelgiumBelizeBoliviaBrazilBulgariaBurma / MyanmarCambodiaCameroonCanadaCaribbeanCentral AmericaChileChinaColombiaCongoCosta RicaCroatiaCubaCzechoslovakiaDenmarkDominicaDominican RepublicEastern AfricaEastern AsiaEastern EuropeEcuadorEgyptEl SalvadorEnglandEritreaEthiopiaEuropeFranceGermanyGhanaGreeceGrenadaGuatemalaGuyanaHaitiHondurasHong KongHungaryIndiaIndonesiaIranIraqIrelandIsraelItalyJamaicaJapanJordanKazakhstanKenyaKoreaKuwaitLatin AmericaLatviaLebanonLiberiaLithuaniaMalaysiaMexicoMiddle AfricaMoroccoNepalNetherlandsNicaraguaNigeriaNorthern AfricaNorthern EuropeNorwayOceaniaPakistanPanamaPeruPhilippinesPolandPortugalRomaniaRussiaSaudi ArabiaScotlandSenegalSerbiaSierra LeoneSingaporeSomaliaSouth AfricaSouth AmericaSouth Central AsiaSouth Eastern AsiaSouthern EuropeSpainSri LankaSt. Vincent and the GrenadinesSudanSwedenSwitzerlandSyriaTaiwanThailandTrinidad and TobagoTurkeyUgandaUkraineUruguayUzbekistanVenezuelaVietnamWest IndiesWestern AfricaWestern AsiaWestern EuropeZaireZimbabwe
Immigrant Origin (Percentage)
AfghanistanAfricaAlbaniaArgentinaArmeniaAsiaAustraliaAustriaBahamasBangladeshBarbadosBelarusBelgiumBelizeBoliviaBrazilBulgariaBurma / MyanmarCambodiaCameroonCanadaCaribbeanCentral AmericaChileChinaColombiaCongoCosta RicaCroatiaCubaCzechoslovakiaDenmarkDominicaDominican RepublicEastern AfricaEastern AsiaEastern EuropeEcuadorEgyptEl SalvadorEnglandEritreaEthiopiaEuropeFranceGermanyGhanaGreeceGrenadaGuatemalaGuyanaHaitiHondurasHong KongHungaryIndiaIndonesiaIranIraqIrelandIsraelItalyJamaicaJapanJordanKazakhstanKenyaKoreaKuwaitLatin AmericaLatviaLebanonLiberiaLithuaniaMalaysiaMexicoMiddle AfricaMoroccoNepalNetherlandsNicaraguaNigeriaNorthern AfricaNorthern EuropeNorwayOceaniaPakistanPanamaPeruPhilippinesPolandPortugalRomaniaRussiaSaudi ArabiaScotlandSenegalSerbiaSierra LeoneSingaporeSomaliaSouth AfricaSouth AmericaSouth Central AsiaSouth Eastern AsiaSouthern EuropeSpainSri LankaSt. Vincent and the GrenadinesSudanSwedenSwitzerlandSyriaTaiwanThailandTrinidad and TobagoTurkeyUgandaUkraineUruguayUzbekistanVenezuelaVietnamWest IndiesWestern AfricaWestern AsiaWestern EuropeZaireZimbabwe
Income
Income (Families)
Income (Households)
Poverty
Poverty (Families)
Unemployment
Employment Occupations
Employment Industries
Employer Class
Commute Time
Commute Means
School Enrollment
Education by Degree Field
Occupancy
Finances
Physical Characteristics
Washington
Compare Zip Codes
Comparison Subject

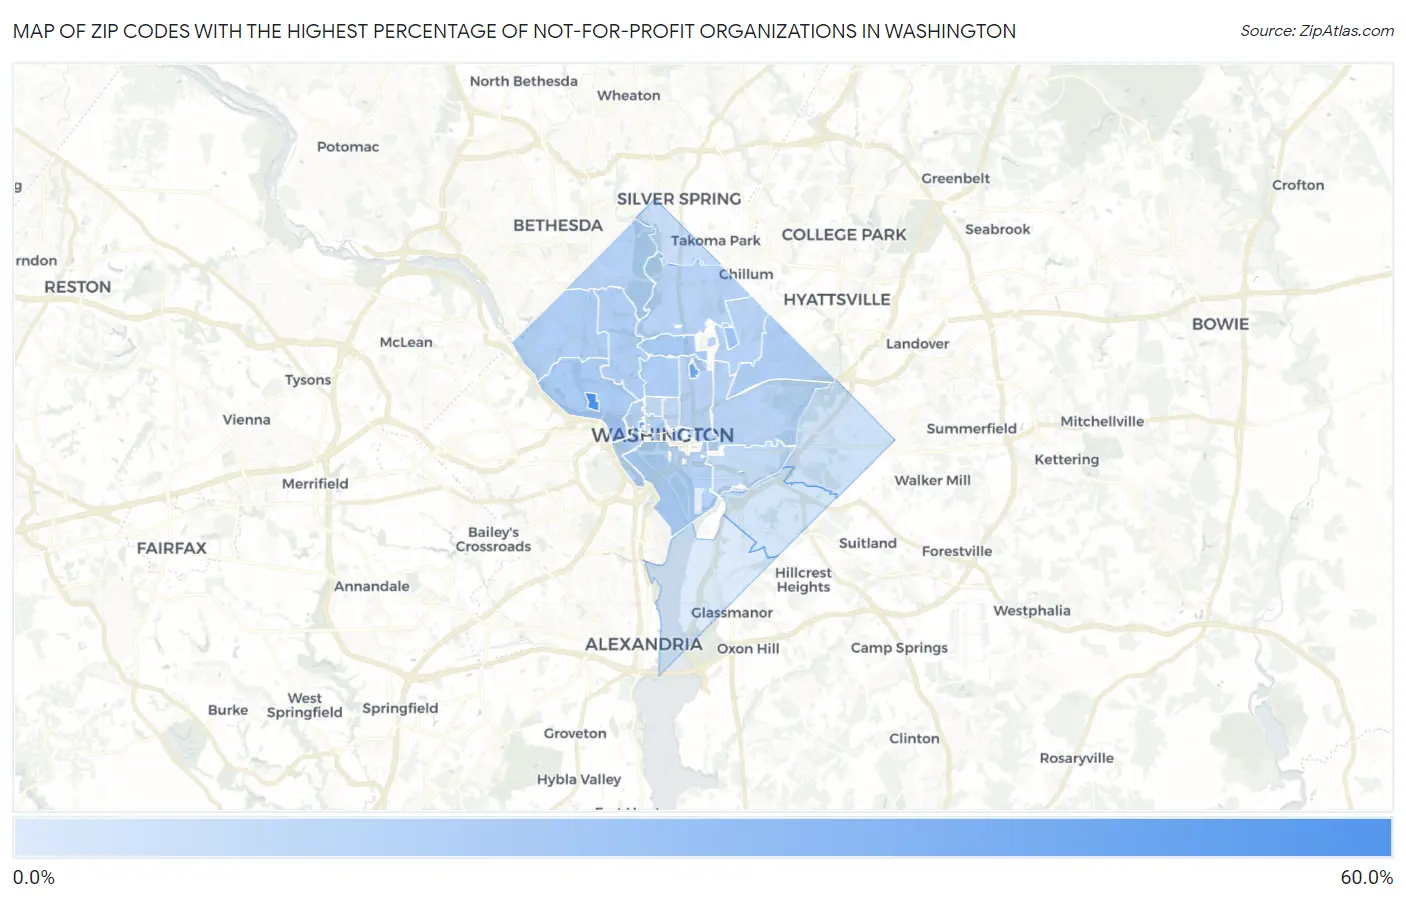
Map of Zip Codes with the Highest Percentage of Not-for-profit Organizations in Washington

0.0%
60.0%
Zip Codes with the Highest Percentage of Not-for-profit Organizations in Washington Map

Zip Codes with the Highest Percentage of Not-for-profit Organizations in Washington, DC

Zip Code % Employed in Not-for-profit vs State vs National
1.2005755.1%19.5%(+35.5)#18.4%(+46.6)#101
2.2005942.6%19.5%(+23.1)#28.4%(+34.2)#205
3.2005240.7%19.5%(+21.2)#38.4%(+32.2)#226
4.2006427.4%19.5%(+7.85)#48.4%(+18.9)#557
5.2001024.3%19.5%(+4.81)#58.4%(+15.9)#750
6.2000723.5%19.5%(+4.03)#68.4%(+15.1)#830
7.2000922.9%19.5%(+3.33)#78.4%(+14.4)#898
8.2001822.6%19.5%(+3.12)#88.4%(+14.2)#929
9.2000822.3%19.5%(+2.77)#98.4%(+13.8)#976
10.2001622.1%19.5%(+2.59)#108.4%(+13.7)#995
11.2002421.1%19.5%(+1.57)#118.4%(+12.6)#1,134
12.2000621.1%19.5%(+1.56)#128.4%(+12.6)#1,137
13.2003720.8%19.5%(+1.24)#138.4%(+12.3)#1,179
14.2001520.7%19.5%(+1.21)#148.4%(+12.3)#1,185
15.2000120.4%19.5%(+0.910)#158.4%(+12.0)#1,221
16.2001720.2%19.5%(+0.658)#168.4%(+11.7)#1,264
17.2001120.0%19.5%(+0.530)#178.4%(+11.6)#1,280
18.2000219.9%19.5%(+0.383)#188.4%(+11.5)#1,313
19.2000418.3%19.5%(-1.20)#198.4%(+9.88)#1,625
20.2000517.5%19.5%(-2.05)#208.4%(+9.02)#1,873
21.2003617.4%19.5%(-2.09)#218.4%(+8.98)#1,889
22.2000317.2%19.5%(-2.33)#228.4%(+8.74)#1,962
23.2001215.6%19.5%(-3.89)#238.4%(+7.18)#2,613
24.2001913.9%19.5%(-5.62)#248.4%(+5.46)#3,672
25.2002012.7%19.5%(-6.78)#258.4%(+4.29)#4,796
26.2003210.6%19.5%(-8.95)#268.4%(+2.13)#7,781

Common Questions

What are the Top 10 Zip Codes with the Highest Percentage of Not-for-profit Organizations in Washington, DC?
Top 10 Zip Codes with the Highest Percentage of Not-for-profit Organizations in Washington, DC are:
#1
55.1%
#2
42.6%
#3
40.7%
#4
27.4%
#5
24.3%
#6
23.5%
#7
22.9%
#8
22.6%
#9
22.3%
#10
22.1%
What zip code has the Highest Percentage of Not-for-profit Organizations in Washington, DC?
20057 has the Highest Percentage of Not-for-profit Organizations in Washington, DC with 55.1%.
What is the Percentage of Not-for-profit Organizations in Washington, DC?
Percentage of Not-for-profit Organizations in Washington is 19.5%.
What is the Percentage of Not-for-profit Organizations in District Of Columbia?
Percentage of Not-for-profit Organizations in District Of Columbia is 19.5%.
What is the Percentage of Not-for-profit Organizations in the United States?
Percentage of Not-for-profit Organizations in the United States is 8.4%.