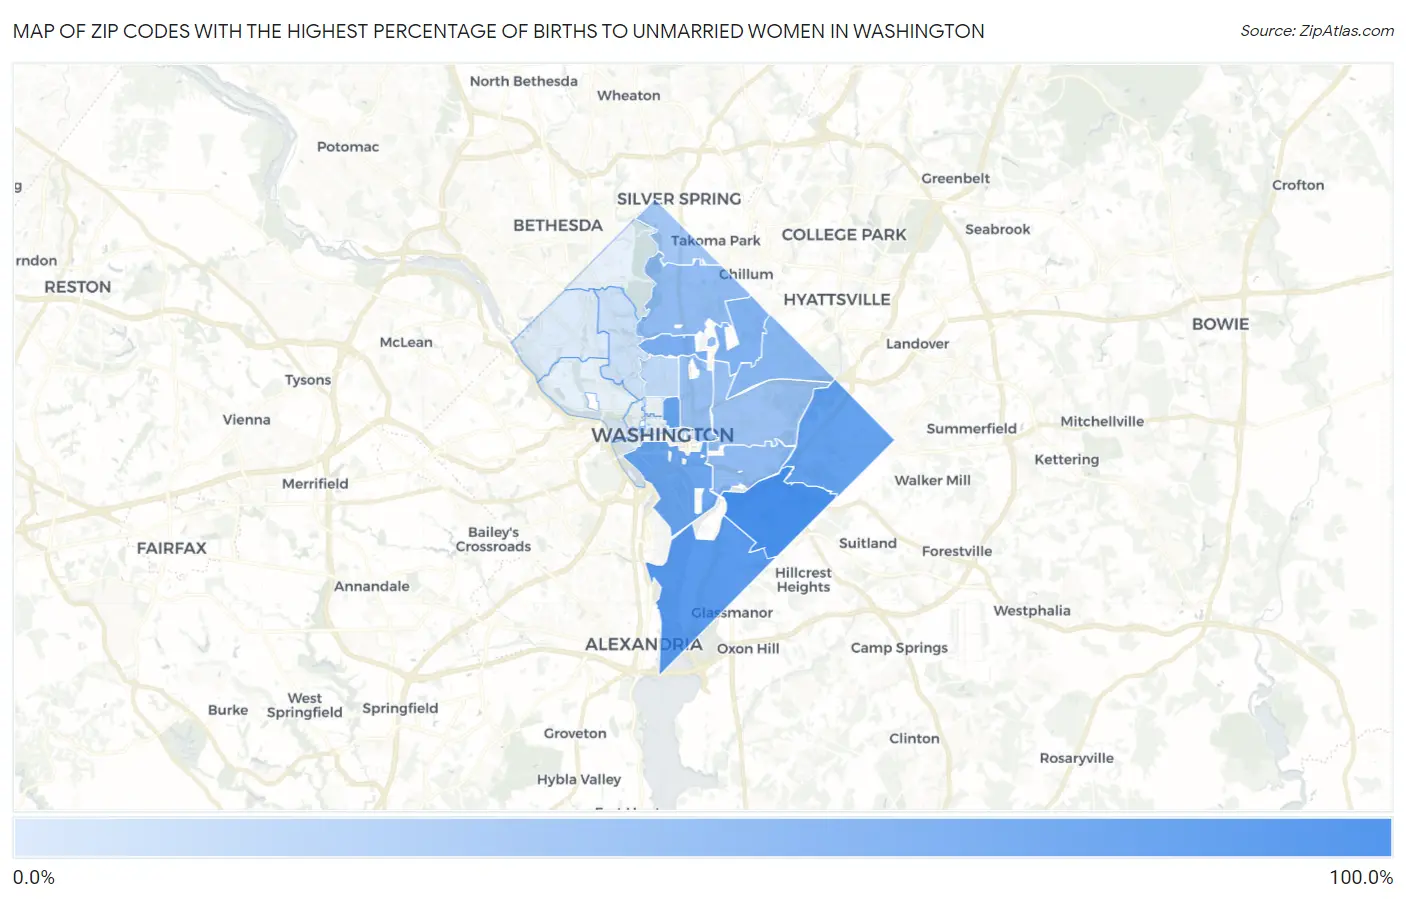
Zip Codes with the Highest Percentage of Births to Unmarried Women in Washington, DC
RELATED REPORTS & OPTIONS
Highest Illegitimacy | All Women
Washington
Compare Zip Codes
Map of Zip Codes with the Highest Percentage of Births to Unmarried Women in Washington
0.30%
84.8%
Zip Codes with the Highest Percentage of Births to Unmarried Women in Washington, DC
| Zip Code | % Unmarried | vs State | vs National | |
| 1. | 20020 | 84.8% | 43.4%(+41.4)#1 | 32.1%(+52.7)#2,330 |
| 2. | 20032 | 71.6% | 43.4%(+28.2)#2 | 32.1%(+39.5)#3,383 |
| 3. | 20019 | 64.1% | 43.4%(+20.7)#3 | 32.1%(+32.0)#4,203 |
| 4. | 20005 | 61.4% | 43.4%(+18.0)#4 | 32.1%(+29.3)#4,542 |
| 5. | 20024 | 57.1% | 43.4%(+13.7)#5 | 32.1%(+25.0)#5,102 |
| 6. | 20010 | 49.9% | 43.4%(+6.50)#6 | 32.1%(+17.8)#6,364 |
| 7. | 20017 | 46.1% | 43.4%(+2.70)#7 | 32.1%(+14.0)#7,030 |
| 8. | 20018 | 42.2% | 43.4%(-1.20)#8 | 32.1%(+10.1)#7,818 |
| 9. | 20011 | 36.7% | 43.4%(-6.70)#9 | 32.1%(+4.60)#9,090 |
| 10. | 20003 | 36.2% | 43.4%(-7.20)#10 | 32.1%(+4.10)#9,208 |
| 11. | 20001 | 32.4% | 43.4%(-11.0)#11 | 32.1%(+0.300)#10,124 |
| 12. | 20002 | 30.5% | 43.4%(-12.9)#12 | 32.1%(-1.60)#10,582 |
| 13. | 20012 | 26.4% | 43.4%(-17.0)#13 | 32.1%(-5.70)#11,622 |
| 14. | 20009 | 12.9% | 43.4%(-30.5)#14 | 32.1%(-19.2)#15,193 |
| 15. | 20008 | 6.7% | 43.4%(-36.7)#15 | 32.1%(-25.4)#16,722 |
| 16. | 20016 | 0.30% | 43.4%(-43.1)#16 | 32.1%(-31.8)#17,763 |
1
Common Questions
What are the Top 10 Zip Codes with the Highest Percentage of Births to Unmarried Women in Washington, DC?
Top 10 Zip Codes with the Highest Percentage of Births to Unmarried Women in Washington, DC are:
What zip code has the Highest Percentage of Births to Unmarried Women in Washington, DC?
20020 has the Highest Percentage of Births to Unmarried Women in Washington, DC with 84.8%.
What is the Percentage of Births to Unmarried Women in Washington, DC?
Percentage of Births to Unmarried Women in Washington is 43.4%.
What is the Percentage of Births to Unmarried Women in District Of Columbia?
Percentage of Births to Unmarried Women in District Of Columbia is 43.4%.
What is the Percentage of Births to Unmarried Women in the United States?
Percentage of Births to Unmarried Women in the United States is 32.1%.