Zip Codes with the Highest Percentage of Households Heated by Bottled Gas / Liquid Propane in Washington, DC
RELATED REPORTS & OPTIONS
Bottled Gas / LP Heating
Washington
Compare Zip Codes
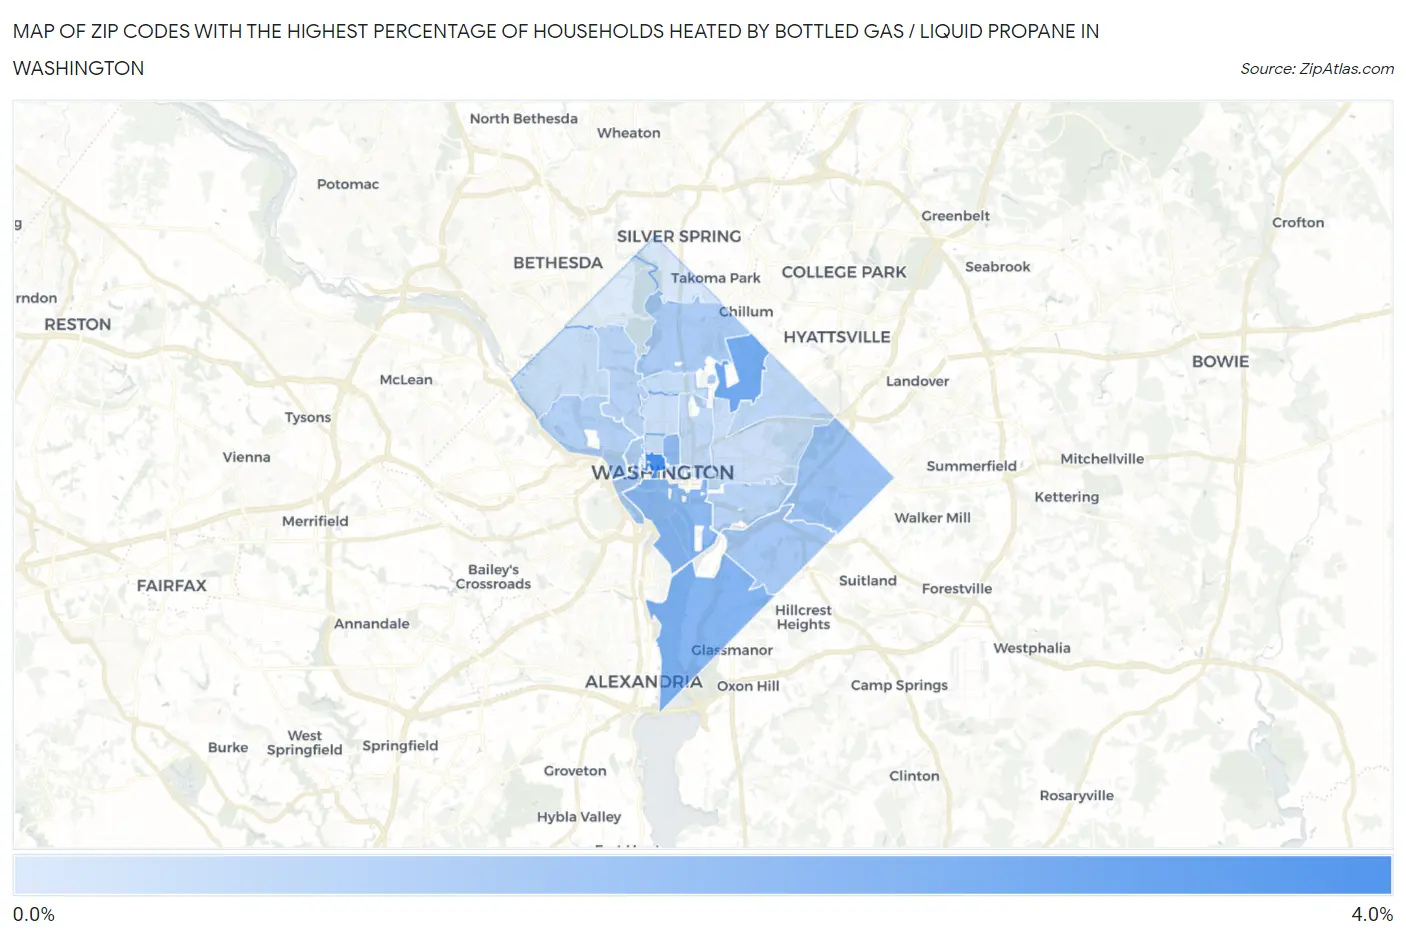
Map of Zip Codes with the Highest Percentage of Households Heated by Bottled Gas / Liquid Propane in Washington
0.10%
3.4%
Zip Codes with the Highest Percentage of Households Heated by Bottled Gas / Liquid Propane in Washington, DC
| Zip Code | Bottled Gas / LP Heating | vs State | vs National | |
| 1. | 20006 | 3.4% | 1.0%(+2.40)#1 | 4.9%(-1.50)#20,467 |
| 2. | 20017 | 2.4% | 1.0%(+1.40)#2 | 4.9%(-2.50)#22,194 |
| 3. | 20032 | 2.0% | 1.0%(+1.000)#3 | 4.9%(-2.90)#23,135 |
| 4. | 20024 | 1.8% | 1.0%(+0.800)#4 | 4.9%(-3.10)#23,820 |
| 5. | 20005 | 1.8% | 1.0%(+0.800)#5 | 4.9%(-3.10)#23,834 |
| 6. | 20019 | 1.5% | 1.0%(+0.500)#6 | 4.9%(-3.40)#24,602 |
| 7. | 20020 | 1.3% | 1.0%(+0.300)#7 | 4.9%(-3.60)#25,357 |
| 8. | 20011 | 1.2% | 1.0%(+0.200)#8 | 4.9%(-3.70)#25,724 |
| 9. | 20037 | 1.2% | 1.0%(+0.200)#9 | 4.9%(-3.70)#26,018 |
| 10. | 20007 | 1.0% | 1.0%(=0.000)#10 | 4.9%(-3.90)#26,720 |
| 11. | 20003 | 0.90% | 1.0%(-0.100)#11 | 4.9%(-4.00)#27,053 |
| 12. | 20008 | 0.90% | 1.0%(-0.100)#12 | 4.9%(-4.00)#27,095 |
| 13. | 20018 | 0.80% | 1.0%(-0.200)#13 | 4.9%(-4.10)#27,568 |
| 14. | 20001 | 0.70% | 1.0%(-0.300)#14 | 4.9%(-4.20)#27,785 |
| 15. | 20016 | 0.60% | 1.0%(-0.400)#15 | 4.9%(-4.30)#28,220 |
| 16. | 20010 | 0.60% | 1.0%(-0.400)#16 | 4.9%(-4.30)#28,222 |
| 17. | 20036 | 0.60% | 1.0%(-0.400)#17 | 4.9%(-4.30)#28,422 |
| 18. | 20002 | 0.50% | 1.0%(-0.500)#18 | 4.9%(-4.40)#28,467 |
| 19. | 20009 | 0.50% | 1.0%(-0.500)#19 | 4.9%(-4.40)#28,487 |
| 20. | 20012 | 0.20% | 1.0%(-0.800)#20 | 4.9%(-4.70)#29,427 |
| 21. | 20015 | 0.10% | 1.0%(-0.900)#21 | 4.9%(-4.80)#29,581 |
1
Common Questions
What are the Top 10 Zip Codes with the Highest Percentage of Households Heated by Bottled Gas / Liquid Propane in Washington, DC?
Top 10 Zip Codes with the Highest Percentage of Households Heated by Bottled Gas / Liquid Propane in Washington, DC are:
What zip code has the Highest Percentage of Households Heated by Bottled Gas / Liquid Propane in Washington, DC?
20006 has the Highest Percentage of Households Heated by Bottled Gas / Liquid Propane in Washington, DC with 3.4%.
What is the Percentage of Households Heated by Bottled Gas / Liquid Propane in Washington, DC?
Percentage of Households Heated by Bottled Gas / Liquid Propane in Washington is 1.0%.
What is the Percentage of Households Heated by Bottled Gas / Liquid Propane in District Of Columbia?
Percentage of Households Heated by Bottled Gas / Liquid Propane in District Of Columbia is 1.0%.
What is the Percentage of Households Heated by Bottled Gas / Liquid Propane in the United States?
Percentage of Households Heated by Bottled Gas / Liquid Propane in the United States is 4.9%.