Zip Codes with the Highest Percentage of Households With One or more Vehicles in Washington, DC
RELATED REPORTS & OPTIONS
Households with 1 or more Cars
Washington
Compare Zip Codes
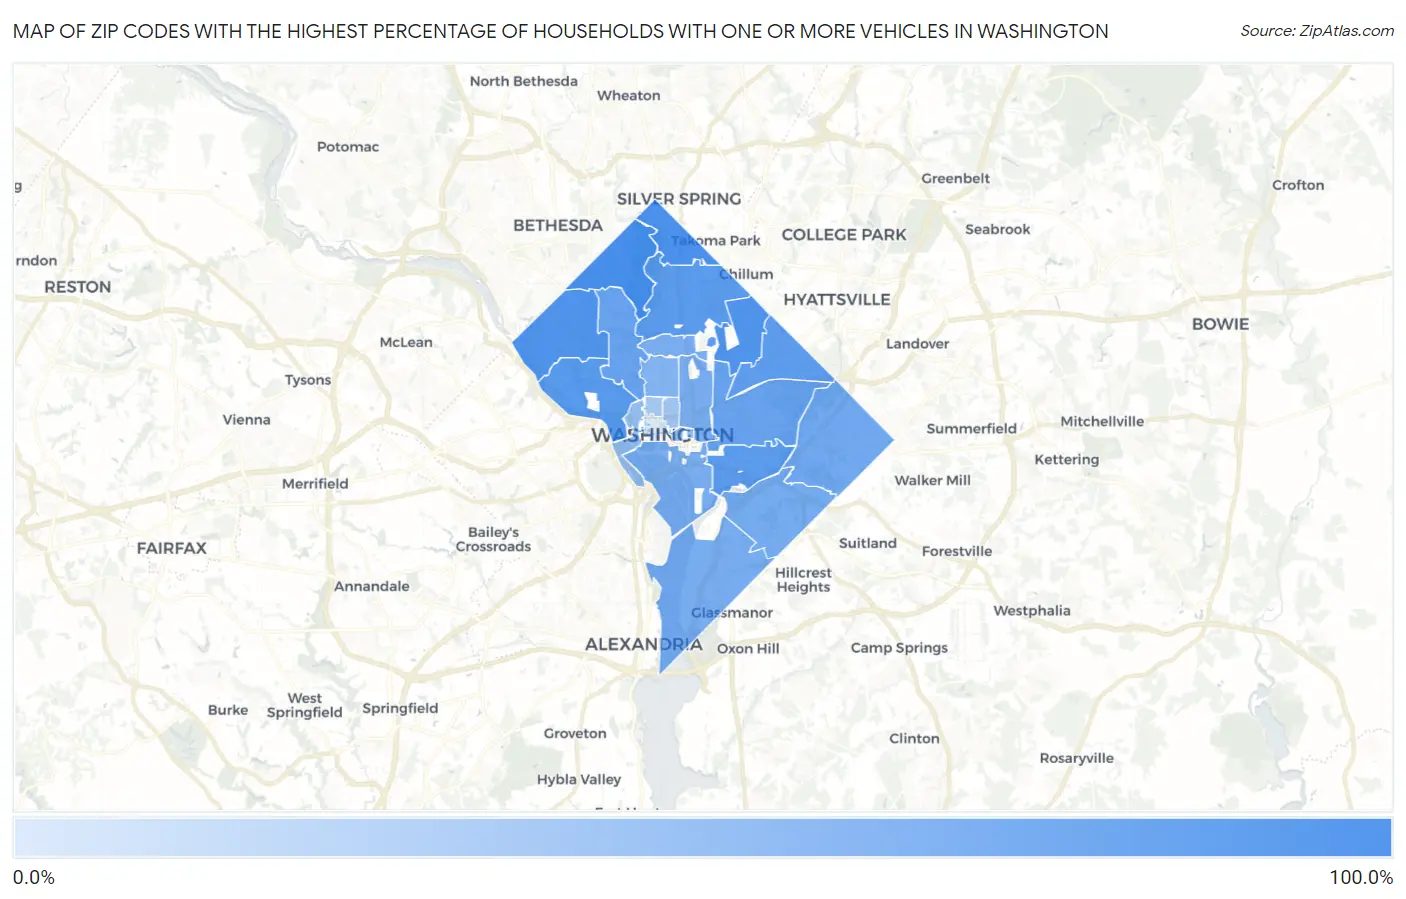
Map of Zip Codes with the Highest Percentage of Households With One or more Vehicles in Washington
11.9%
87.0%
Zip Codes with the Highest Percentage of Households With One or more Vehicles in Washington, DC
| Zip Code | Housholds With 1+ Cars | vs State | vs National | |
| 1. | 20015 | 87.0% | 64.3%(+22.7)#2 | 91.7%(-4.70)#29,710 |
| 2. | 20012 | 83.5% | 64.3%(+19.2)#3 | 91.7%(-8.20)#30,753 |
| 3. | 20016 | 82.7% | 64.3%(+18.4)#4 | 91.7%(-9.00)#30,911 |
| 4. | 20017 | 80.6% | 64.3%(+16.3)#5 | 91.7%(-11.1)#31,233 |
| 5. | 20007 | 76.8% | 64.3%(+12.5)#6 | 91.7%(-14.9)#31,618 |
| 6. | 20011 | 74.7% | 64.3%(+10.4)#7 | 91.7%(-17.0)#31,767 |
| 7. | 20003 | 74.1% | 64.3%(+9.80)#8 | 91.7%(-17.6)#31,805 |
| 8. | 20018 | 73.0% | 64.3%(+8.70)#9 | 91.7%(-18.7)#31,875 |
| 9. | 20008 | 67.6% | 64.3%(+3.30)#10 | 91.7%(-24.1)#32,104 |
| 10. | 20002 | 67.2% | 64.3%(+2.90)#11 | 91.7%(-24.5)#32,113 |
| 11. | 20019 | 62.3% | 64.3%(-2.00)#12 | 91.7%(-29.4)#32,248 |
| 12. | 20020 | 59.5% | 64.3%(-4.80)#13 | 91.7%(-32.2)#32,317 |
| 13. | 20032 | 58.2% | 64.3%(-6.10)#14 | 91.7%(-33.5)#32,341 |
| 14. | 20001 | 58.1% | 64.3%(-6.20)#15 | 91.7%(-33.6)#32,344 |
| 15. | 20010 | 57.4% | 64.3%(-6.90)#16 | 91.7%(-34.3)#32,354 |
| 16. | 20024 | 56.8% | 64.3%(-7.50)#17 | 91.7%(-34.9)#32,374 |
| 17. | 20009 | 51.8% | 64.3%(-12.5)#18 | 91.7%(-39.9)#32,458 |
| 18. | 20004 | 45.4% | 64.3%(-18.9)#19 | 91.7%(-46.3)#32,508 |
| 19. | 20037 | 42.7% | 64.3%(-21.6)#20 | 91.7%(-49.0)#32,533 |
| 20. | 20005 | 37.4% | 64.3%(-26.9)#21 | 91.7%(-54.3)#32,566 |
| 21. | 20036 | 34.8% | 64.3%(-29.5)#22 | 91.7%(-56.9)#32,583 |
| 22. | 20006 | 11.9% | 64.3%(-52.4)#23 | 91.7%(-79.8)#32,723 |
1
Common Questions
What are the Top 10 Zip Codes with the Highest Percentage of Households With One or more Vehicles in Washington, DC?
Top 10 Zip Codes with the Highest Percentage of Households With One or more Vehicles in Washington, DC are:
What zip code has the Highest Percentage of Households With One or more Vehicles in Washington, DC?
20015 has the Highest Percentage of Households With One or more Vehicles in Washington, DC with 87.0%.
What is the Percentage of Households With One or more Vehicles in Washington, DC?
Percentage of Households With One or more Vehicles in Washington is 64.3%.
What is the Percentage of Households With One or more Vehicles in District Of Columbia?
Percentage of Households With One or more Vehicles in District Of Columbia is 64.3%.
What is the Percentage of Households With One or more Vehicles in the United States?
Percentage of Households With One or more Vehicles in the United States is 91.7%.