Zip Codes with the Highest Percentage of Families with Income Above $100,000 in Storrs Mansfield, CT
RELATED REPORTS & OPTIONS
Family Income | $100k+
Storrs Mansfield
Compare Zip Codes
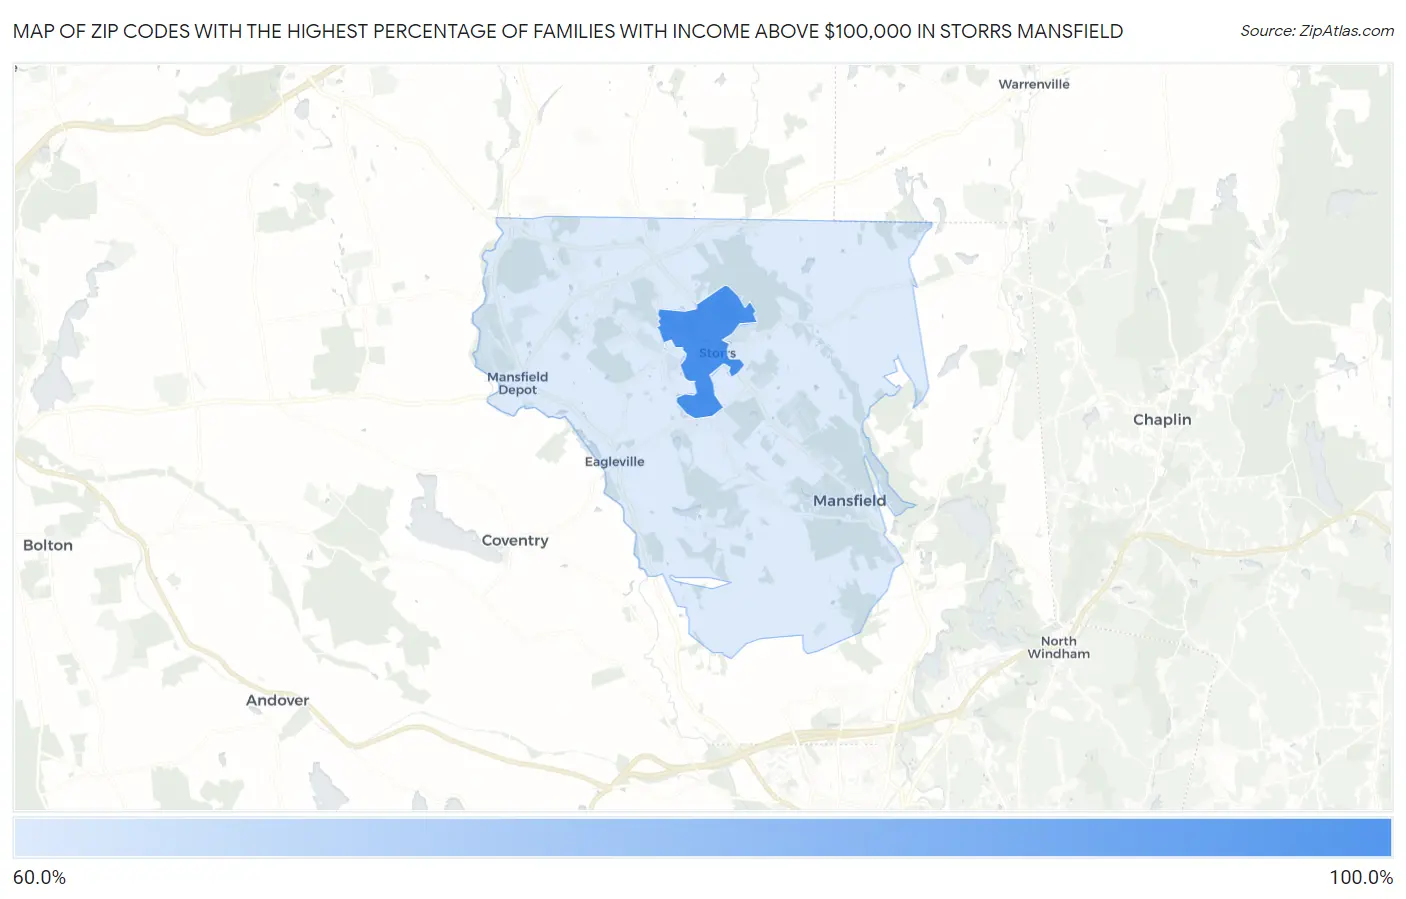
Map of Zip Codes with the Highest Percentage of Families with Income Above $100,000 in Storrs Mansfield
68.6%
100.0%
Zip Codes with the Highest Percentage of Families with Income Above $100,000 in Storrs Mansfield, CT
| Zip Code | Families with Income > $100k | vs State | vs National | |
| 1. | 06269 | 100.0% | 56.8%(+43.2)#2 | 46.1%(+53.9)#3 |
| 2. | 06268 | 68.6% | 56.8%(+11.8)#94 | 46.1%(+22.5)#2,901 |
1
Common Questions
What are the Top Zip Codes with the Highest Percentage of Families with Income Above $100,000 in Storrs Mansfield, CT?
Top Zip Codes with the Highest Percentage of Families with Income Above $100,000 in Storrs Mansfield, CT are:
What zip code has the Highest Percentage of Families with Income Above $100,000 in Storrs Mansfield, CT?
06269 has the Highest Percentage of Families with Income Above $100,000 in Storrs Mansfield, CT with 100.0%.
What is the Percentage of Families with Income Above $100,000 in Connecticut?
Percentage of Families with Income Above $100,000 in Connecticut is 56.8%.
What is the Percentage of Families with Income Above $100,000 in the United States?
Percentage of Families with Income Above $100,000 in the United States is 46.1%.