Zip Codes with the Highest Percentage of Population Employed in Community & Social Service in Milford, CT
RELATED REPORTS & OPTIONS
Community & Social Service
Milford
Compare Zip Codes
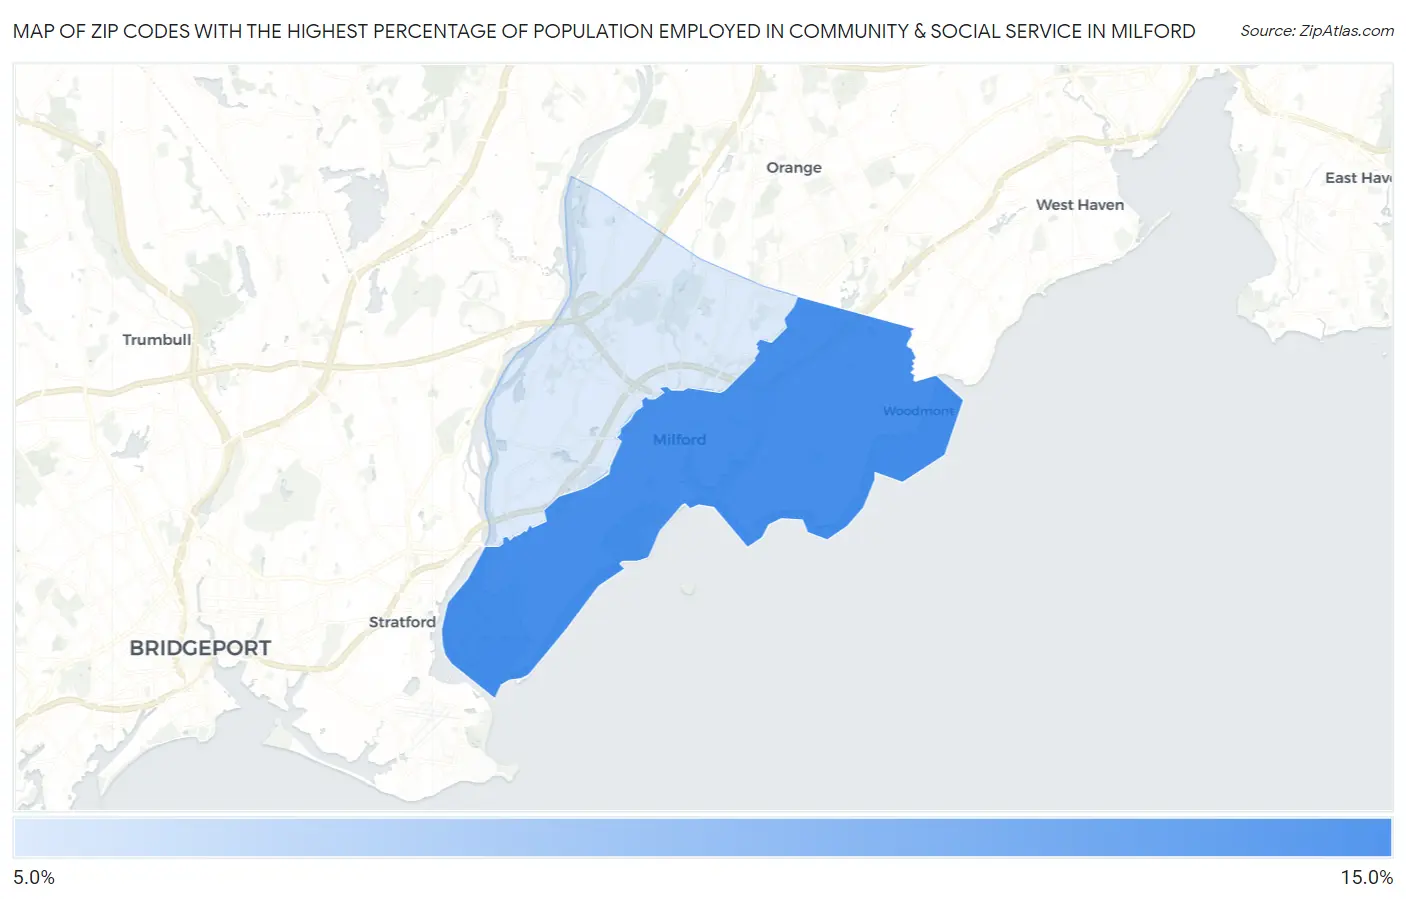
Map of Zip Codes with the Highest Percentage of Population Employed in Community & Social Service in Milford
13.9%
14.4%
Zip Codes with the Highest Percentage of Population Employed in Community & Social Service in Milford, CT
| Zip Code | % Employed | vs State | vs National | |
| 1. | 06460 | 14.4% | 13.0%(+1.39)#105 | 11.2%(+3.18)#5,591 |
| 2. | 06461 | 13.9% | 13.0%(+0.878)#114 | 11.2%(+2.67)#6,225 |
1
Common Questions
What are the Top Zip Codes with the Highest Percentage of Population Employed in Community & Social Service in Milford, CT?
Top Zip Codes with the Highest Percentage of Population Employed in Community & Social Service in Milford, CT are:
What zip code has the Highest Percentage of Population Employed in Community & Social Service in Milford, CT?
06460 has the Highest Percentage of Population Employed in Community & Social Service in Milford, CT with 14.4%.
What is the Percentage of Population Employed in Community & Social Service in Connecticut?
Percentage of Population Employed in Community & Social Service in Connecticut is 13.0%.
What is the Percentage of Population Employed in Community & Social Service in the United States?
Percentage of Population Employed in Community & Social Service in the United States is 11.2%.