Zip Codes with the Highest Percentage of Population Employed in Farming, Fishing & Forestry in Danbury, CT
RELATED REPORTS & OPTIONS
Farming, Fishing & Forestry
Danbury
Compare Zip Codes
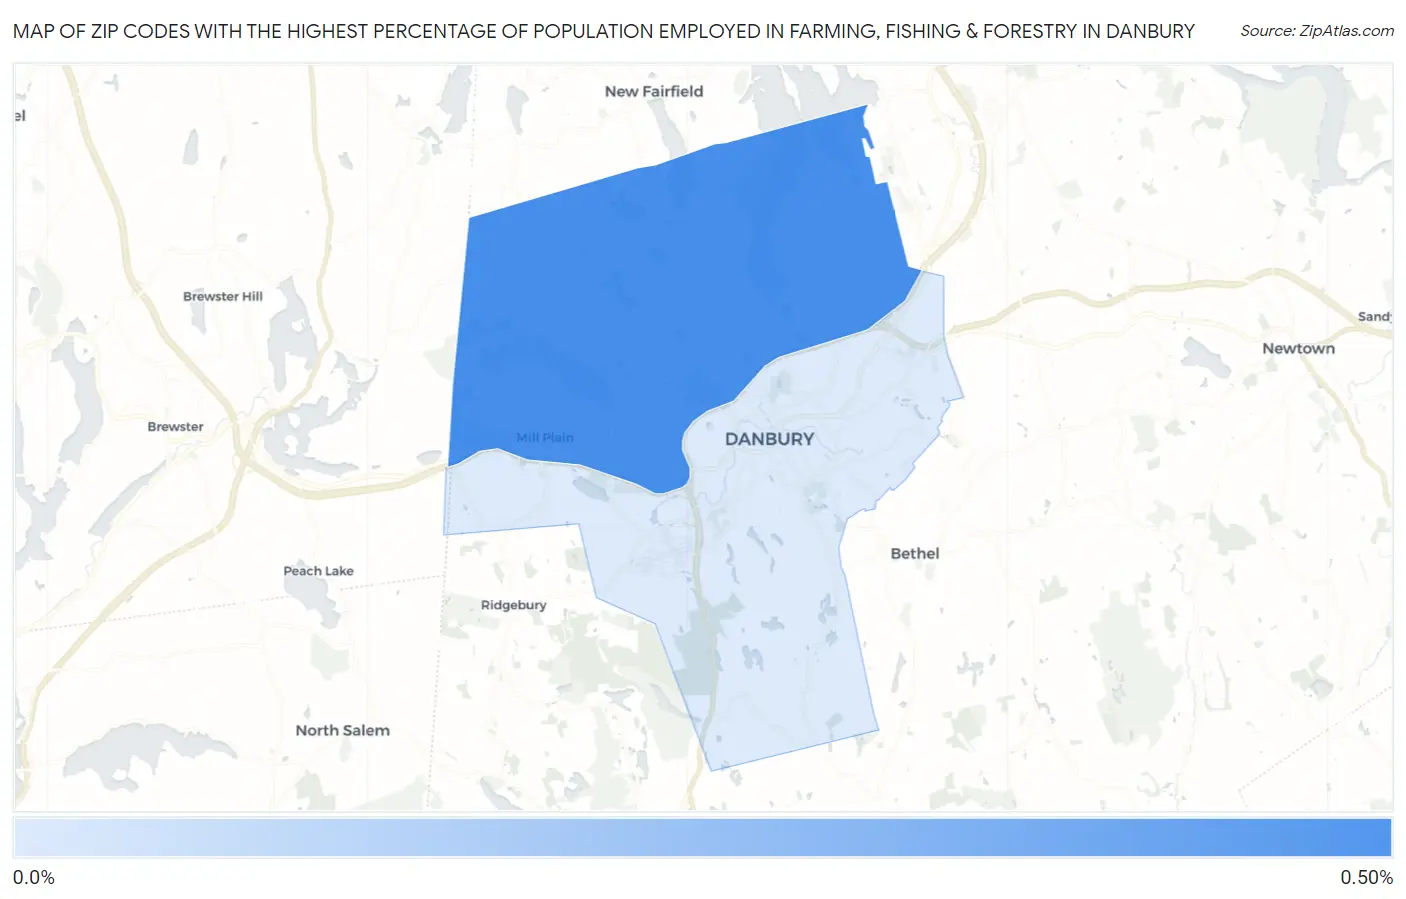
Map of Zip Codes with the Highest Percentage of Population Employed in Farming, Fishing & Forestry in Danbury
0.0%
0.50%
Zip Codes with the Highest Percentage of Population Employed in Farming, Fishing & Forestry in Danbury, CT
| Zip Code | % Employed | vs State | vs National | |
| 1. | 06811 | 0.42% | 0.18%(+0.243)#43 | 0.61%(-0.184)#13,578 |
| 2. | 06810 | 0.0067% | 0.18%(-0.171)#112 | 0.61%(-0.599)#19,190 |
1
Common Questions
What are the Top Zip Codes with the Highest Percentage of Population Employed in Farming, Fishing & Forestry in Danbury, CT?
Top Zip Codes with the Highest Percentage of Population Employed in Farming, Fishing & Forestry in Danbury, CT are:
What zip code has the Highest Percentage of Population Employed in Farming, Fishing & Forestry in Danbury, CT?
06811 has the Highest Percentage of Population Employed in Farming, Fishing & Forestry in Danbury, CT with 0.42%.
What is the Percentage of Population Employed in Farming, Fishing & Forestry in Danbury, CT?
Percentage of Population Employed in Farming, Fishing & Forestry in Danbury is 0.16%.
What is the Percentage of Population Employed in Farming, Fishing & Forestry in Connecticut?
Percentage of Population Employed in Farming, Fishing & Forestry in Connecticut is 0.18%.
What is the Percentage of Population Employed in Farming, Fishing & Forestry in the United States?
Percentage of Population Employed in Farming, Fishing & Forestry in the United States is 0.61%.