Zip Codes with the Highest Percentage of Population Employed in Life, Physical & Social Science in New Haven, CT

RELATED REPORTS & OPTIONS

Life, Physical & Social Science
Population
Families and Households
Female Fertility
Female Fertility (Unmarried)
Race (Community Size)
Race (Percentage)
Ancestry (Community Size)
AfghanAfricanAlbanianAmericanArabArgentineanArmenianAustrianBarbadianBelgianBhutaneseBlackfeetBolivianBrazilianBritishBulgarianBurmeseCambodianCanadianCape VerdeanCentral AmericanCentral American IndianCherokeeChileanChoctawColombianCosta RicanCroatianCubanCzechDanishDominicanDutchEastern EuropeanEcuadorianEgyptianEnglishEthiopianEuropeanFilipinoFinnishFrenchFrench CanadianGermanGhanaianGreekGuatemalanGuyaneseHaitianHmongHonduranHungarianIndian (Asian)IranianIraqiIrishIsraeliItalianJamaicanJapaneseKenyanKoreanLaotianLatvianLebaneseLiberianLithuanianMalaysianMexicanMexican American IndianMoroccanNative HawaiianNavajoNicaraguanNigerianNorthern EuropeanNorwegianPakistaniPennsylvania GermanPeruvianPolishPortuguesePuerto RicanRomanianRussianSalvadoranSamoanScandinavianScotch-IrishScottishSlavicSlovakSloveneSouth AfricanSouth AmericanSouth American IndianSpaniardSpanishSri LankanSubsaharan AfricanSwedishSwissSyrianThaiTrinidadian and TobagonianTurkishU.S. Virgin IslanderUkrainianVenezuelanVietnameseWelshWest IndianYugoslavian
Ancestry (Percentage)
AfghanAfricanAlbanianAmericanArabArgentineanArmenianAustrianBarbadianBelgianBhutaneseBlackfeetBolivianBrazilianBritishBulgarianBurmeseCambodianCanadianCape VerdeanCentral AmericanCentral American IndianCherokeeChileanChoctawColombianCosta RicanCroatianCubanCzechDanishDominicanDutchEastern EuropeanEcuadorianEgyptianEnglishEthiopianEuropeanFilipinoFinnishFrenchFrench CanadianGermanGhanaianGreekGuatemalanGuyaneseHaitianHmongHonduranHungarianIndian (Asian)IranianIraqiIrishIsraeliItalianJamaicanJapaneseKenyanKoreanLaotianLatvianLebaneseLiberianLithuanianMalaysianMexicanMexican American IndianMoroccanNative HawaiianNavajoNicaraguanNigerianNorthern EuropeanNorwegianPakistaniPennsylvania GermanPeruvianPolishPortuguesePuerto RicanRomanianRussianSalvadoranSamoanScandinavianScotch-IrishScottishSlavicSlovakSloveneSouth AfricanSouth AmericanSouth American IndianSpaniardSpanishSri LankanSubsaharan AfricanSwedishSwissSyrianThaiTrinidadian and TobagonianTurkishU.S. Virgin IslanderUkrainianVenezuelanVietnameseWelshWest IndianYugoslavian
Immigrant Origin (Total)
Immigrant Origin (Percentage)
Income
Income (Families)
Income (Households)
Poverty
Poverty (Families)
Unemployment
Employment Occupations
Employment Industries
Employer Class
Commute Time
Commute Means
School Enrollment
Education by Degree Field
Occupancy
Finances
Physical Characteristics
New Haven
Compare Zip Codes
Comparison Subject

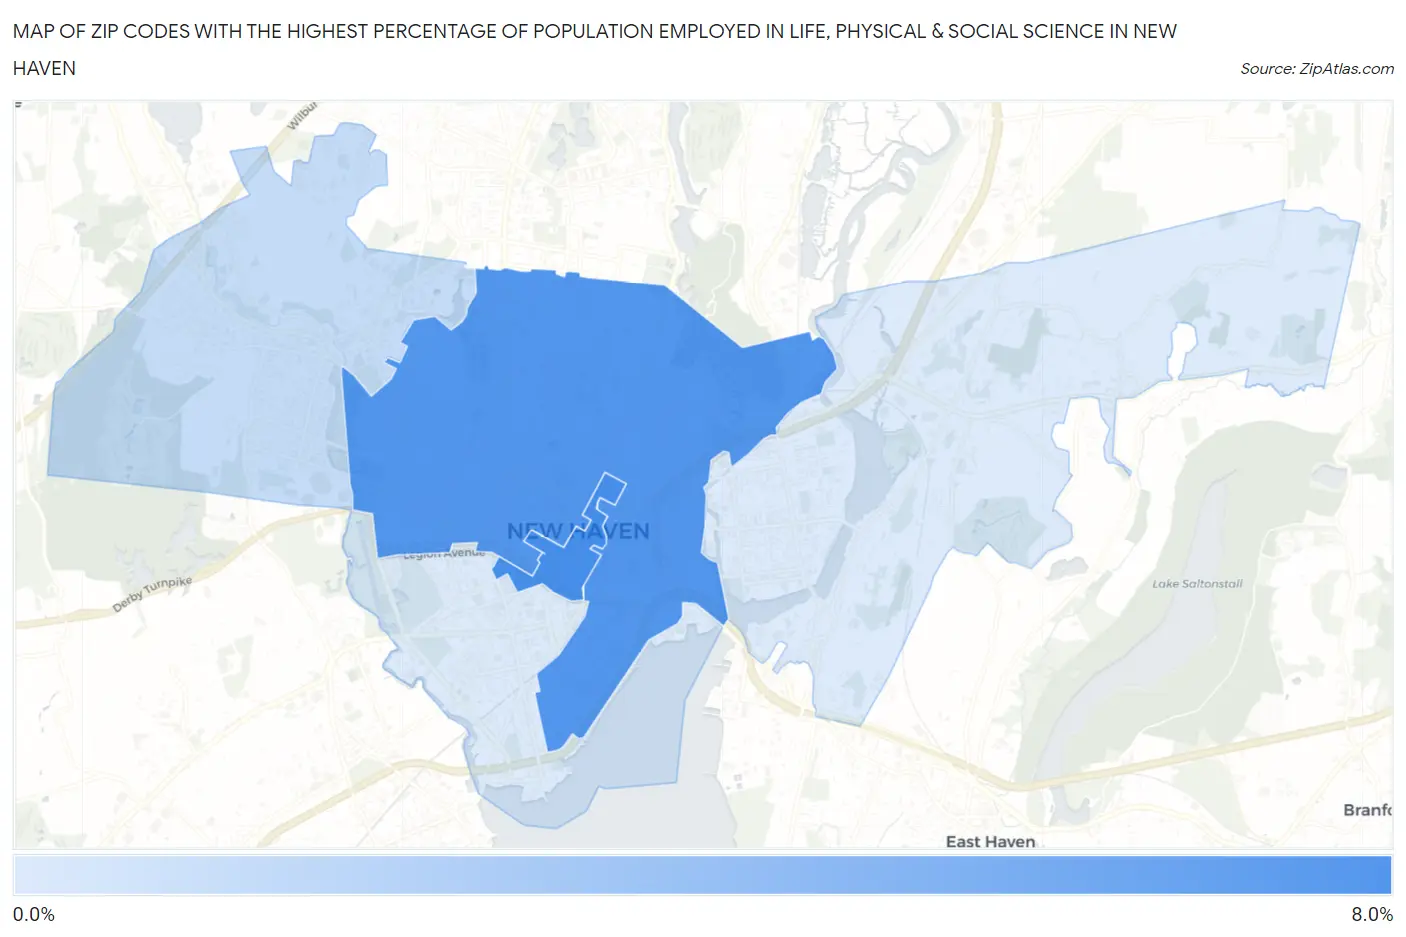
Map of Zip Codes with the Highest Percentage of Population Employed in Life, Physical & Social Science in New Haven

0.0%
8.0%
Zip Codes with the Highest Percentage of Population Employed in Life, Physical & Social Science in New Haven Map

Zip Codes with the Highest Percentage of Population Employed in Life, Physical & Social Science in New Haven, CT

Zip Code % Employed vs State vs National
1.065106.3%1.2%(+5.07)#21.1%(+5.22)#501
2.065115.9%1.2%(+4.64)#31.1%(+4.80)#557
3.065151.5%1.2%(+0.278)#701.1%(+0.429)#5,546
4.065130.65%1.2%(-0.592)#1781.1%(-0.441)#12,660
5.065190.62%1.2%(-0.619)#1831.1%(-0.469)#13,013

Common Questions

What are the Top 3 Zip Codes with the Highest Percentage of Population Employed in Life, Physical & Social Science in New Haven, CT?
Top 3 Zip Codes with the Highest Percentage of Population Employed in Life, Physical & Social Science in New Haven, CT are:
#1
6.3%
#2
5.9%
#3
1.5%
What zip code has the Highest Percentage of Population Employed in Life, Physical & Social Science in New Haven, CT?
06510 has the Highest Percentage of Population Employed in Life, Physical & Social Science in New Haven, CT with 6.3%.
What is the Percentage of Population Employed in Life, Physical & Social Science in New Haven, CT?
Percentage of Population Employed in Life, Physical & Social Science in New Haven is 3.2%.
What is the Percentage of Population Employed in Life, Physical & Social Science in Connecticut?
Percentage of Population Employed in Life, Physical & Social Science in Connecticut is 1.2%.
What is the Percentage of Population Employed in Life, Physical & Social Science in the United States?
Percentage of Population Employed in Life, Physical & Social Science in the United States is 1.1%.