Westcliffe, CO Map & Demographics
Westcliffe Map
Westcliffe Overview
$49,433
PER CAPITA INCOME
$72,250
AVG FAMILY INCOME
$52,500
AVG HOUSEHOLD INCOME
13.4%
WAGE / INCOME GAP [ % ]
86.6¢/ $1
WAGE / INCOME GAP [ $ ]
0.58
INEQUALITY / GINI INDEX
443
TOTAL POPULATION
212
MALE POPULATION
231
FEMALE POPULATION
91.77
MALES / 100 FEMALES
108.96
FEMALES / 100 MALES
47.4
MEDIAN AGE
2.8
AVG FAMILY SIZE
1.8
AVG HOUSEHOLD SIZE
237
LABOR FORCE [ PEOPLE ]
63.9%
PERCENT IN LABOR FORCE
6.8%
UNEMPLOYMENT RATE
Westcliffe Zip Codes
Westcliffe Area Codes
Income in Westcliffe
Income Overview in Westcliffe
Per Capita Income in Westcliffe is $49,433, while median incomes of families and households are $72,250 and $52,500 respectively.
| Characteristic | Number | Measure |
| Per Capita Income | 443 | $49,433 |
| Median Family Income | 95 | $72,250 |
| Mean Family Income | 95 | $74,208 |
| Median Household Income | 238 | $52,500 |
| Mean Household Income | 238 | $94,243 |
| Income Deficit | 95 | $0 |
| Wage / Income Gap (%) | 443 | 13.39% |
| Wage / Income Gap ($) | 443 | 86.61¢ per $1 |
| Gini / Inequality Index | 443 | 0.58 |
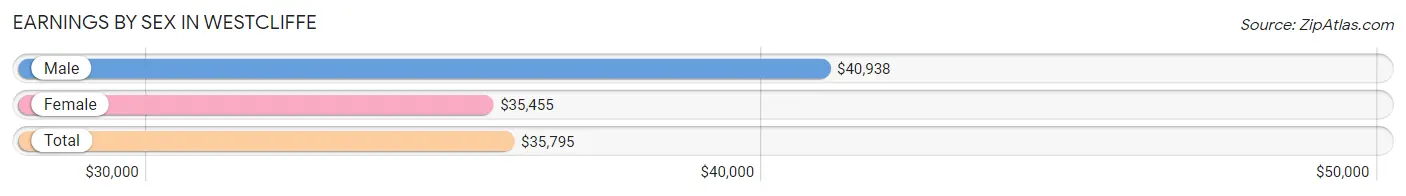
Earnings by Sex in Westcliffe
Average Earnings in Westcliffe are $35,795, $40,938 for men and $35,455 for women, a difference of 13.4%.
| Sex | Number | Average Earnings |
| Male | 91 (38.7%) | $40,938 |
| Female | 144 (61.3%) | $35,455 |
| Total | 235 (100.0%) | $35,795 |
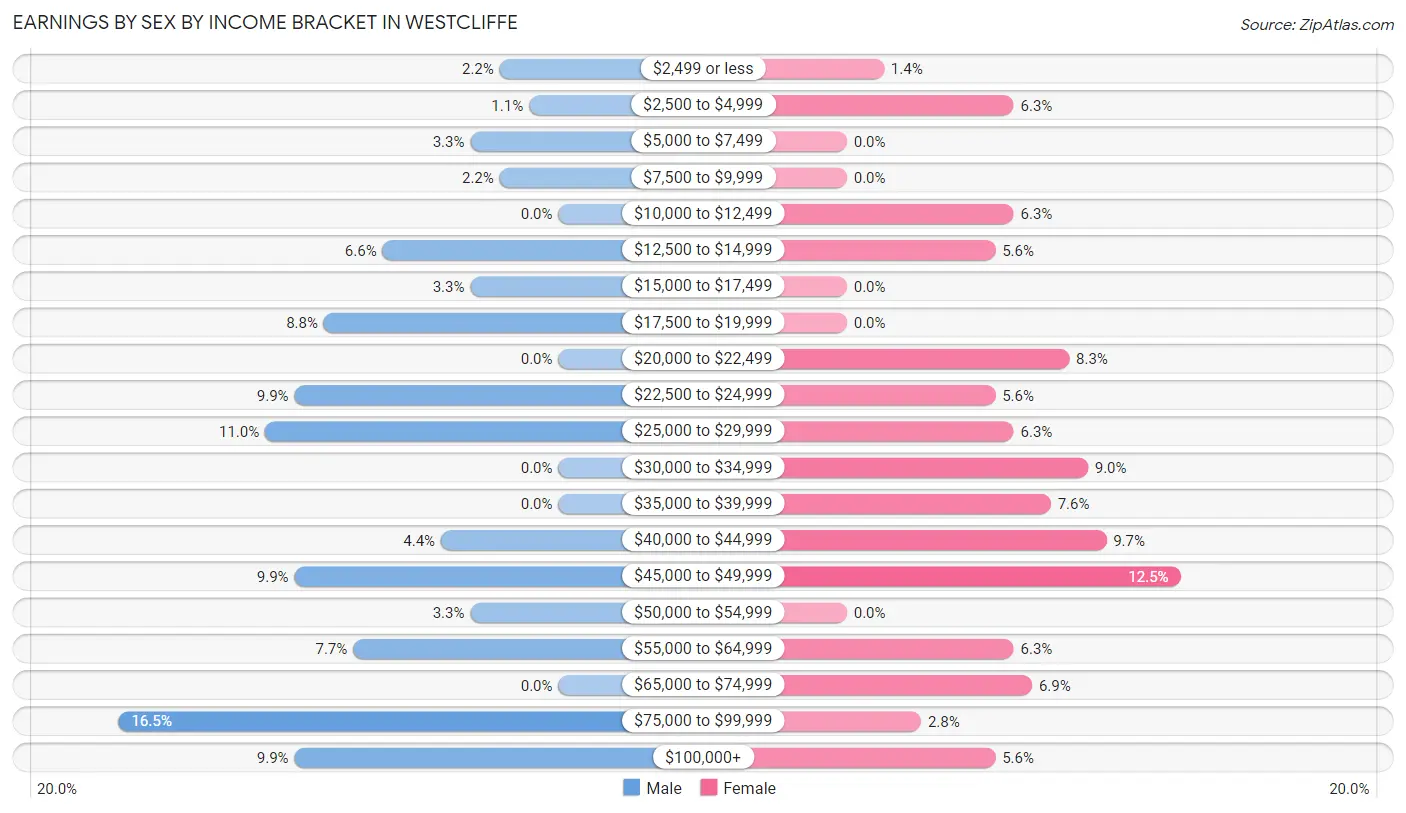
Earnings by Sex by Income Bracket in Westcliffe
The most common earnings brackets in Westcliffe are $75,000 to $99,999 for men (15 | 16.5%) and $45,000 to $49,999 for women (18 | 12.5%).
| Income | Male | Female |
| $2,499 or less | 2 (2.2%) | 2 (1.4%) |
| $2,500 to $4,999 | 1 (1.1%) | 9 (6.2%) |
| $5,000 to $7,499 | 3 (3.3%) | 0 (0.0%) |
| $7,500 to $9,999 | 2 (2.2%) | 0 (0.0%) |
| $10,000 to $12,499 | 0 (0.0%) | 9 (6.2%) |
| $12,500 to $14,999 | 6 (6.6%) | 8 (5.6%) |
| $15,000 to $17,499 | 3 (3.3%) | 0 (0.0%) |
| $17,500 to $19,999 | 8 (8.8%) | 0 (0.0%) |
| $20,000 to $22,499 | 0 (0.0%) | 12 (8.3%) |
| $22,500 to $24,999 | 9 (9.9%) | 8 (5.6%) |
| $25,000 to $29,999 | 10 (11.0%) | 9 (6.2%) |
| $30,000 to $34,999 | 0 (0.0%) | 13 (9.0%) |
| $35,000 to $39,999 | 0 (0.0%) | 11 (7.6%) |
| $40,000 to $44,999 | 4 (4.4%) | 14 (9.7%) |
| $45,000 to $49,999 | 9 (9.9%) | 18 (12.5%) |
| $50,000 to $54,999 | 3 (3.3%) | 0 (0.0%) |
| $55,000 to $64,999 | 7 (7.7%) | 9 (6.2%) |
| $65,000 to $74,999 | 0 (0.0%) | 10 (6.9%) |
| $75,000 to $99,999 | 15 (16.5%) | 4 (2.8%) |
| $100,000+ | 9 (9.9%) | 8 (5.6%) |
| Total | 91 (100.0%) | 144 (100.0%) |
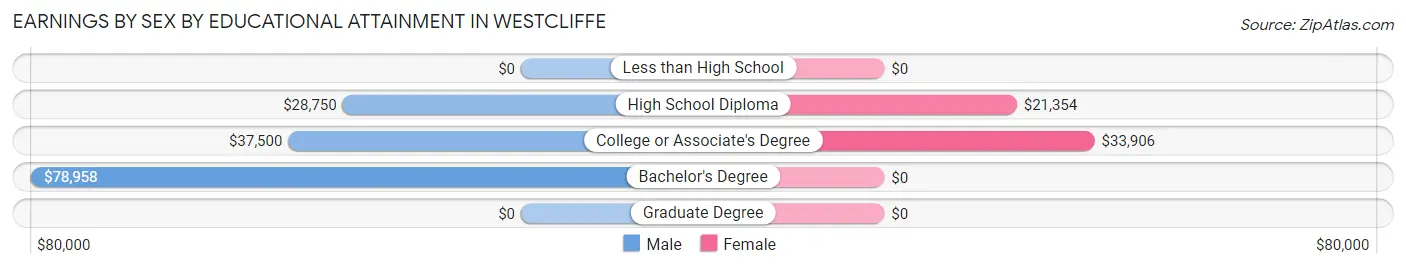
Earnings by Sex by Educational Attainment in Westcliffe
Average earnings in Westcliffe are $40,938 for men and $35,556 for women, a difference of 13.2%. Men with an educational attainment of bachelor's degree enjoy the highest average annual earnings of $78,958, while those with high school diploma education earn the least with $28,750. Women with an educational attainment of college or associate's degree earn the most with the average annual earnings of $33,906, while those with high school diploma education have the smallest earnings of $21,354.
| Educational Attainment | Male Income | Female Income |
| Less than High School | - | - |
| High School Diploma | $28,750 | $21,354 |
| College or Associate's Degree | $37,500 | $33,906 |
| Bachelor's Degree | $78,958 | $0 |
| Graduate Degree | - | - |
| Total | $40,938 | $35,556 |
Family Income in Westcliffe
Family Income Brackets in Westcliffe
According to the Westcliffe family income data, there are 26 families falling into the $75,000 to $99,999 income range, which is the most common income bracket and makes up 27.4% of all families.
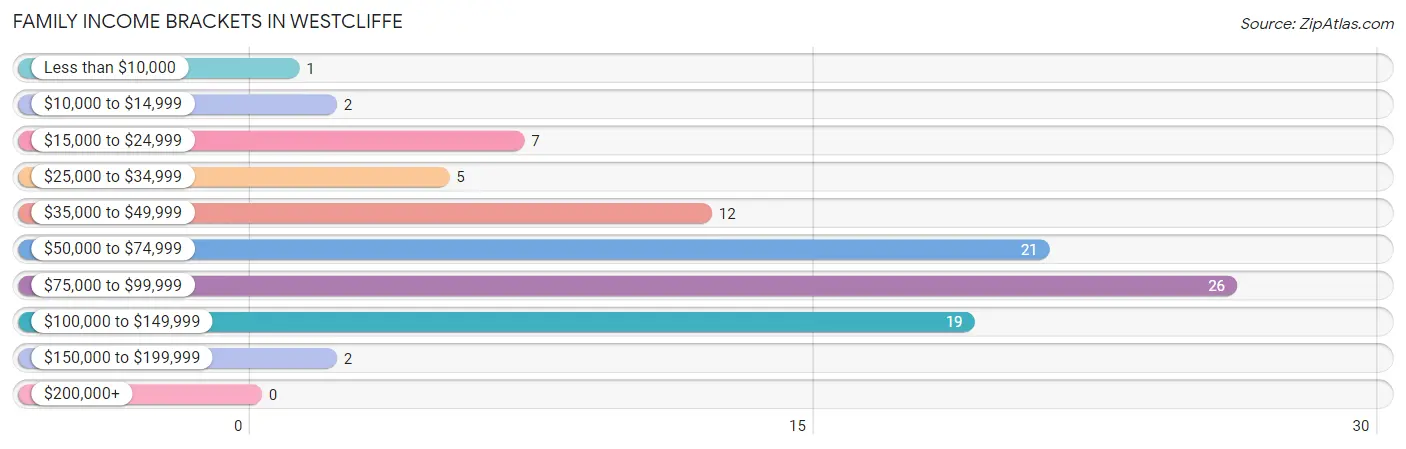
| Income Bracket | # Families | % Families |
| Less than $10,000 | 1 | 1.1% |
| $10,000 to $14,999 | 2 | 2.1% |
| $15,000 to $24,999 | 7 | 7.4% |
| $25,000 to $34,999 | 5 | 5.3% |
| $35,000 to $49,999 | 12 | 12.6% |
| $50,000 to $74,999 | 21 | 22.1% |
| $75,000 to $99,999 | 26 | 27.4% |
| $100,000 to $149,999 | 19 | 20.0% |
| $150,000 to $199,999 | 2 | 2.1% |
| $200,000+ | 0 | 0.0% |
Family Income by Famaliy Size in Westcliffe
2-person families (45 | 47.4%) account for the highest median family income in Westcliffe with $92,639 per family, while 2-person families (45 | 47.4%) have the highest median income of $46,320 per family member.
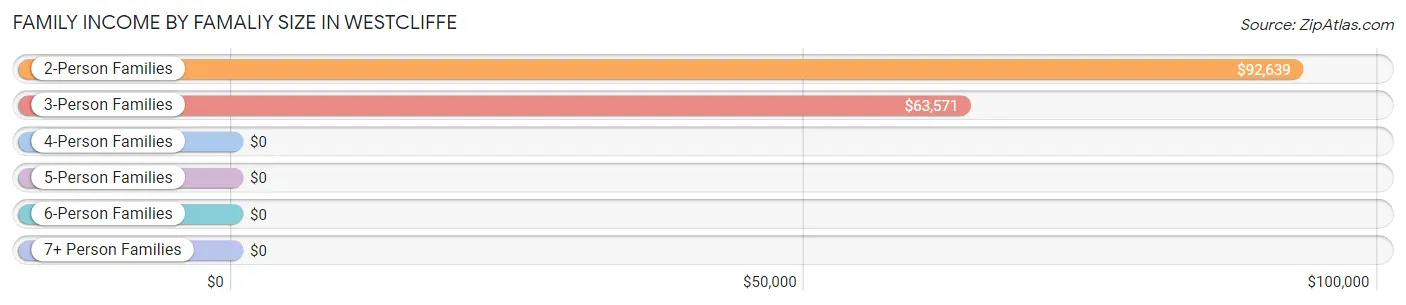
| Income Bracket | # Families | Median Income |
| 2-Person Families | 45 (47.4%) | $92,639 |
| 3-Person Families | 36 (37.9%) | $63,571 |
| 4-Person Families | 9 (9.5%) | $0 |
| 5-Person Families | 5 (5.3%) | $0 |
| 6-Person Families | 0 (0.0%) | $0 |
| 7+ Person Families | 0 (0.0%) | $0 |
| Total | 95 (100.0%) | $72,250 |
Family Income by Number of Earners in Westcliffe
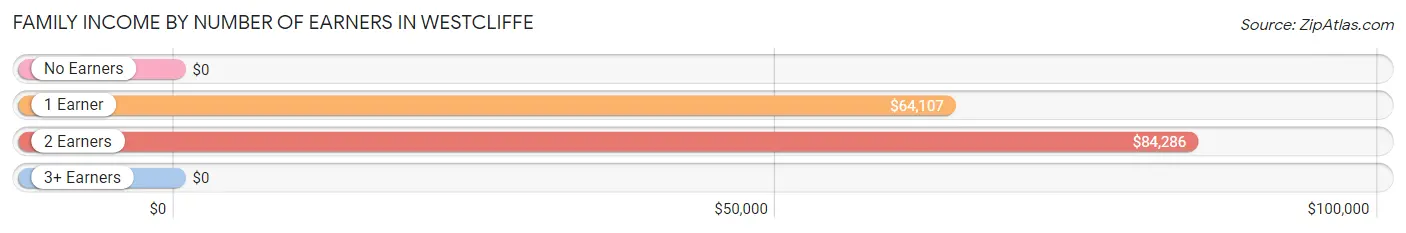
| Number of Earners | # Families | Median Income |
| No Earners | 11 (11.6%) | $0 |
| 1 Earner | 48 (50.5%) | $64,107 |
| 2 Earners | 36 (37.9%) | $84,286 |
| 3+ Earners | 0 (0.0%) | $0 |
| Total | 95 (100.0%) | $72,250 |
Household Income in Westcliffe
Household Income Brackets in Westcliffe
With 45 households falling in the category, the $50,000 to $74,999 income range is the most frequent in Westcliffe, accounting for 18.9% of all households. In contrast, only 2 households (0.8%) fall into the $150,000 to $199,999 income bracket, making it the least populous group.
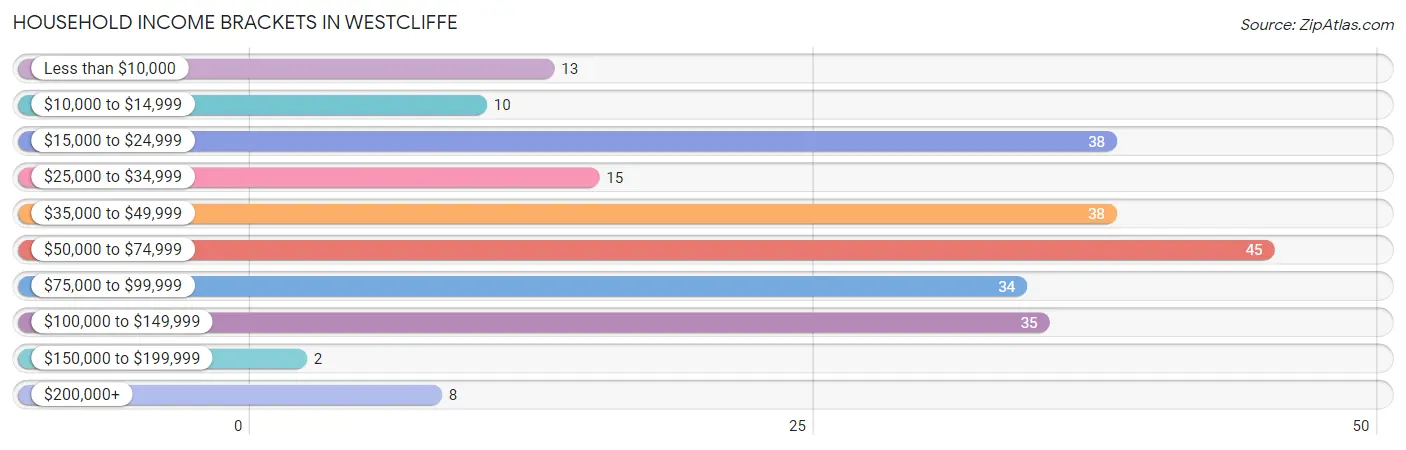
| Income Bracket | # Households | % Households |
| Less than $10,000 | 13 | 5.5% |
| $10,000 to $14,999 | 10 | 4.2% |
| $15,000 to $24,999 | 38 | 16.0% |
| $25,000 to $34,999 | 15 | 6.3% |
| $35,000 to $49,999 | 38 | 16.0% |
| $50,000 to $74,999 | 45 | 18.9% |
| $75,000 to $99,999 | 34 | 14.3% |
| $100,000 to $149,999 | 35 | 14.7% |
| $150,000 to $199,999 | 2 | 0.8% |
| $200,000+ | 8 | 3.4% |
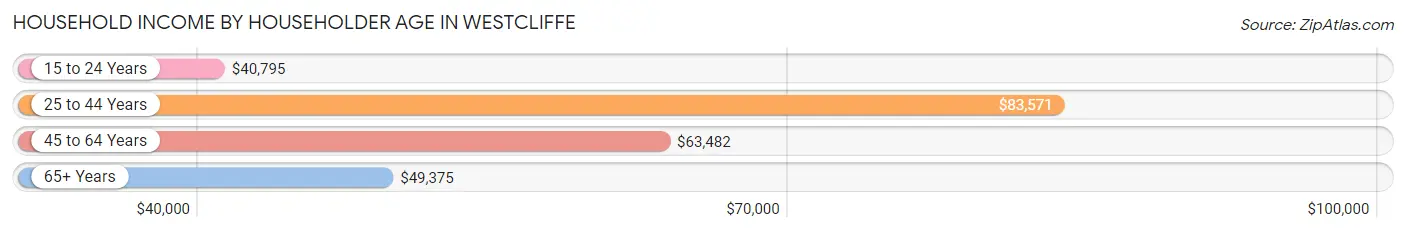
Household Income by Householder Age in Westcliffe
The median household income in Westcliffe is $52,500, with the highest median household income of $83,571 found in the 25 to 44 years age bracket for the primary householder. A total of 52 households (21.8%) fall into this category. Meanwhile, the 15 to 24 years age bracket for the primary householder has the lowest median household income of $40,795, with 15 households (6.3%) in this group.
| Income Bracket | # Households | Median Income |
| 15 to 24 Years | 15 (6.3%) | $40,795 |
| 25 to 44 Years | 52 (21.8%) | $83,571 |
| 45 to 64 Years | 103 (43.3%) | $63,482 |
| 65+ Years | 68 (28.6%) | $49,375 |
| Total | 238 (100.0%) | $52,500 |
Poverty in Westcliffe
Income Below Poverty by Sex and Age in Westcliffe
With 10.3% poverty level for males and 16.0% for females among the residents of Westcliffe, 16 and 17 year old males and under 5 year old females are the most vulnerable to poverty, with 7 males (100.0%) and 3 females (100.0%) in their respective age groups living below the poverty level.
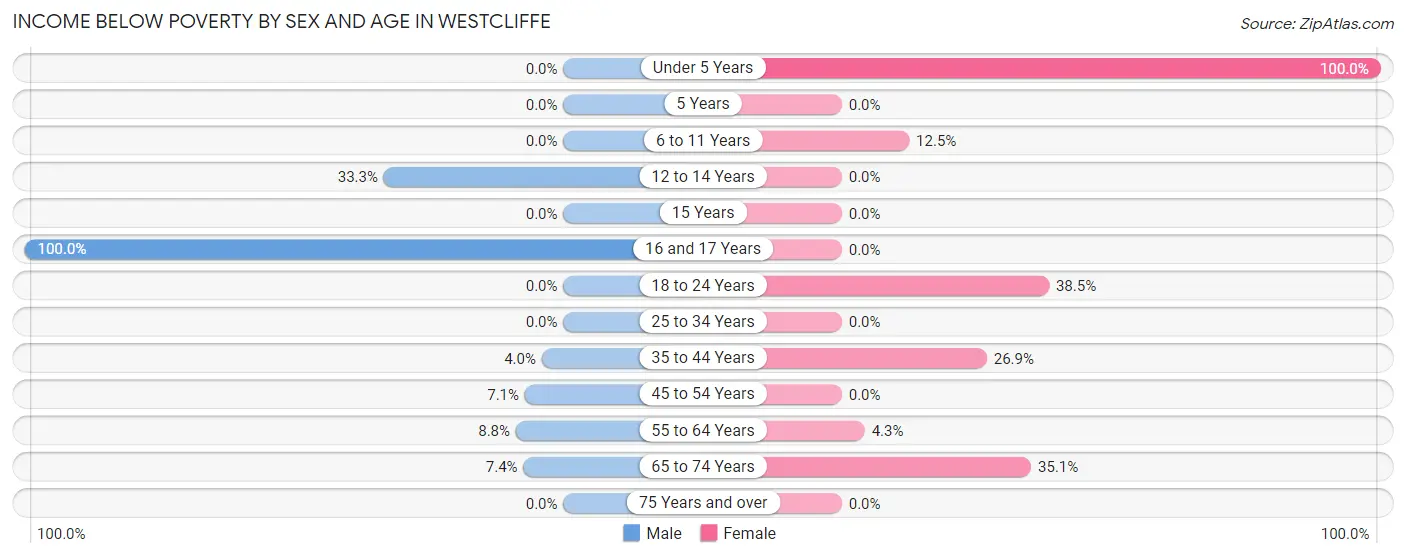
| Age Bracket | Male | Female |
| Under 5 Years | 0 (0.0%) | 3 (100.0%) |
| 5 Years | 0 (0.0%) | 0 (0.0%) |
| 6 to 11 Years | 0 (0.0%) | 2 (12.5%) |
| 12 to 14 Years | 6 (33.3%) | 0 (0.0%) |
| 15 Years | 0 (0.0%) | 0 (0.0%) |
| 16 and 17 Years | 7 (100.0%) | 0 (0.0%) |
| 18 to 24 Years | 0 (0.0%) | 10 (38.5%) |
| 25 to 34 Years | 0 (0.0%) | 0 (0.0%) |
| 35 to 44 Years | 1 (4.0%) | 7 (26.9%) |
| 45 to 54 Years | 2 (7.1%) | 0 (0.0%) |
| 55 to 64 Years | 3 (8.8%) | 2 (4.3%) |
| 65 to 74 Years | 2 (7.4%) | 13 (35.1%) |
| 75 Years and over | 0 (0.0%) | 0 (0.0%) |
| Total | 21 (10.3%) | 37 (16.0%) |
Income Above Poverty by Sex and Age in Westcliffe
According to the poverty statistics in Westcliffe, males aged under 5 years and females aged 12 to 14 years are the age groups that are most secure financially, with 100.0% of males and 100.0% of females in these age groups living above the poverty line.
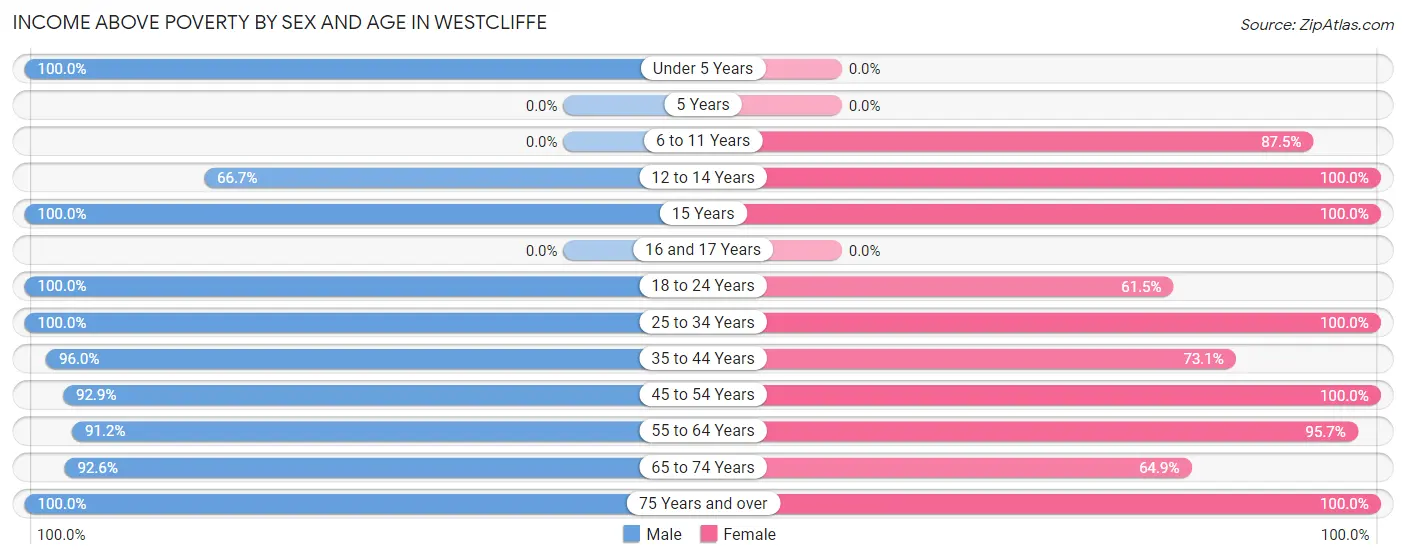
| Age Bracket | Male | Female |
| Under 5 Years | 8 (100.0%) | 0 (0.0%) |
| 5 Years | 0 (0.0%) | 0 (0.0%) |
| 6 to 11 Years | 0 (0.0%) | 14 (87.5%) |
| 12 to 14 Years | 12 (66.7%) | 11 (100.0%) |
| 15 Years | 14 (100.0%) | 2 (100.0%) |
| 16 and 17 Years | 0 (0.0%) | 0 (0.0%) |
| 18 to 24 Years | 5 (100.0%) | 16 (61.5%) |
| 25 to 34 Years | 20 (100.0%) | 23 (100.0%) |
| 35 to 44 Years | 24 (96.0%) | 19 (73.1%) |
| 45 to 54 Years | 26 (92.9%) | 33 (100.0%) |
| 55 to 64 Years | 31 (91.2%) | 45 (95.7%) |
| 65 to 74 Years | 25 (92.6%) | 24 (64.9%) |
| 75 Years and over | 17 (100.0%) | 7 (100.0%) |
| Total | 182 (89.7%) | 194 (84.0%) |
Income Below Poverty Among Married-Couple Families in Westcliffe
The poverty statistics for married-couple families in Westcliffe show that 1.3% or 1 of the total 80 families live below the poverty line. Families with no children have the highest poverty rate of 2.2%, comprising of 1 families. On the other hand, families with 1 or 2 children have the lowest poverty rate of 0.0%, which includes 0 families.
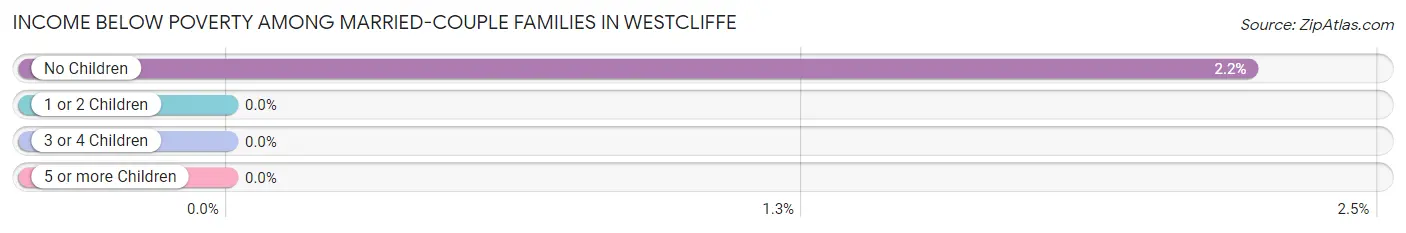
| Children | Above Poverty | Below Poverty |
| No Children | 44 (97.8%) | 1 (2.2%) |
| 1 or 2 Children | 30 (100.0%) | 0 (0.0%) |
| 3 or 4 Children | 5 (100.0%) | 0 (0.0%) |
| 5 or more Children | 0 (0.0%) | 0 (0.0%) |
| Total | 79 (98.8%) | 1 (1.3%) |
Income Below Poverty Among Single-Parent Households in Westcliffe
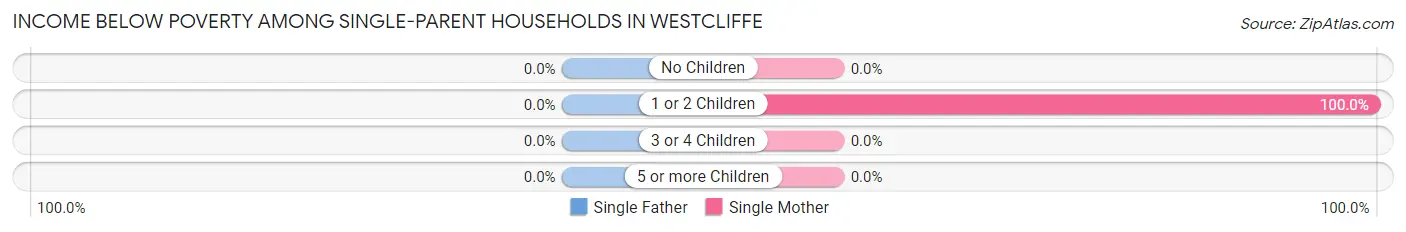
| Children | Single Father | Single Mother |
| No Children | 0 (0.0%) | 0 (0.0%) |
| 1 or 2 Children | 0 (0.0%) | 9 (100.0%) |
| 3 or 4 Children | 0 (0.0%) | 0 (0.0%) |
| 5 or more Children | 0 (0.0%) | 0 (0.0%) |
| Total | 0 (0.0%) | 9 (60.0%) |
Income Below Poverty Among Married-Couple vs Single-Parent Households in Westcliffe
The poverty data for Westcliffe shows that 1 of the married-couple family households (1.3%) and 9 of the single-parent households (60.0%) are living below the poverty level. Within the married-couple family households, those with no children have the highest poverty rate, with 1 households (2.2%) falling below the poverty line. Among the single-parent households, those with 1 or 2 children have the highest poverty rate, with 9 household (100.0%) living below poverty.
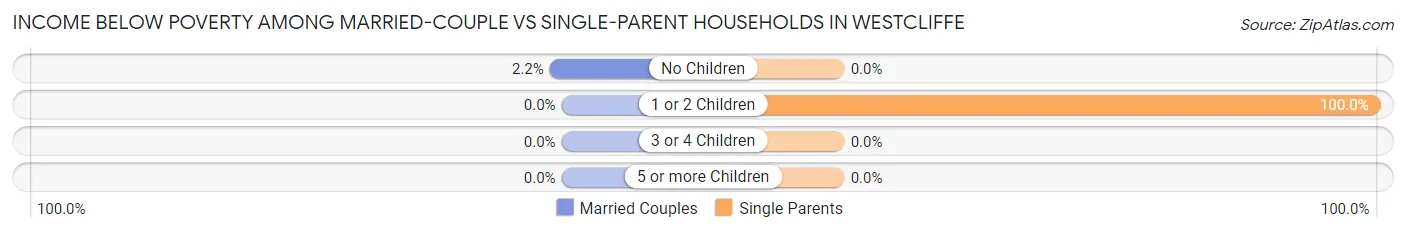
| Children | Married-Couple Families | Single-Parent Households |
| No Children | 1 (2.2%) | 0 (0.0%) |
| 1 or 2 Children | 0 (0.0%) | 9 (100.0%) |
| 3 or 4 Children | 0 (0.0%) | 0 (0.0%) |
| 5 or more Children | 0 (0.0%) | 0 (0.0%) |
| Total | 1 (1.3%) | 9 (60.0%) |
Race in Westcliffe
The most populous races in Westcliffe are White / Caucasian (403 | 91.0%), Some other Race (18 | 4.1%), and Hispanic or Latino (13 | 2.9%).
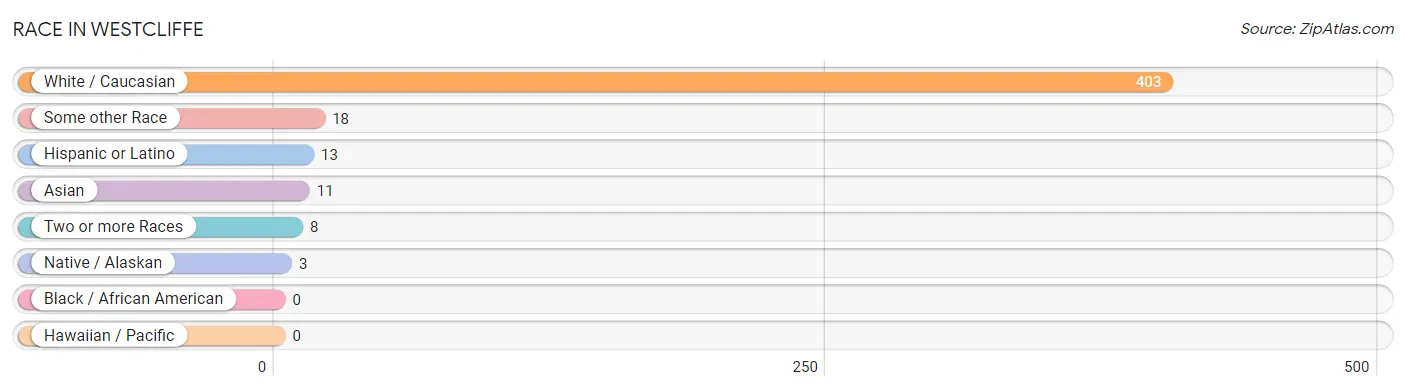
| Race | # Population | % Population |
| Asian | 11 | 2.5% |
| Black / African American | 0 | 0.0% |
| Hawaiian / Pacific | 0 | 0.0% |
| Hispanic or Latino | 13 | 2.9% |
| Native / Alaskan | 3 | 0.7% |
| White / Caucasian | 403 | 91.0% |
| Two or more Races | 8 | 1.8% |
| Some other Race | 18 | 4.1% |
| Total | 443 | 100.0% |
Ancestry in Westcliffe
The most populous ancestries reported in Westcliffe are German (92 | 20.8%), Irish (58 | 13.1%), English (40 | 9.0%), Polish (28 | 6.3%), and European (24 | 5.4%), together accounting for 54.6% of all Westcliffe residents.
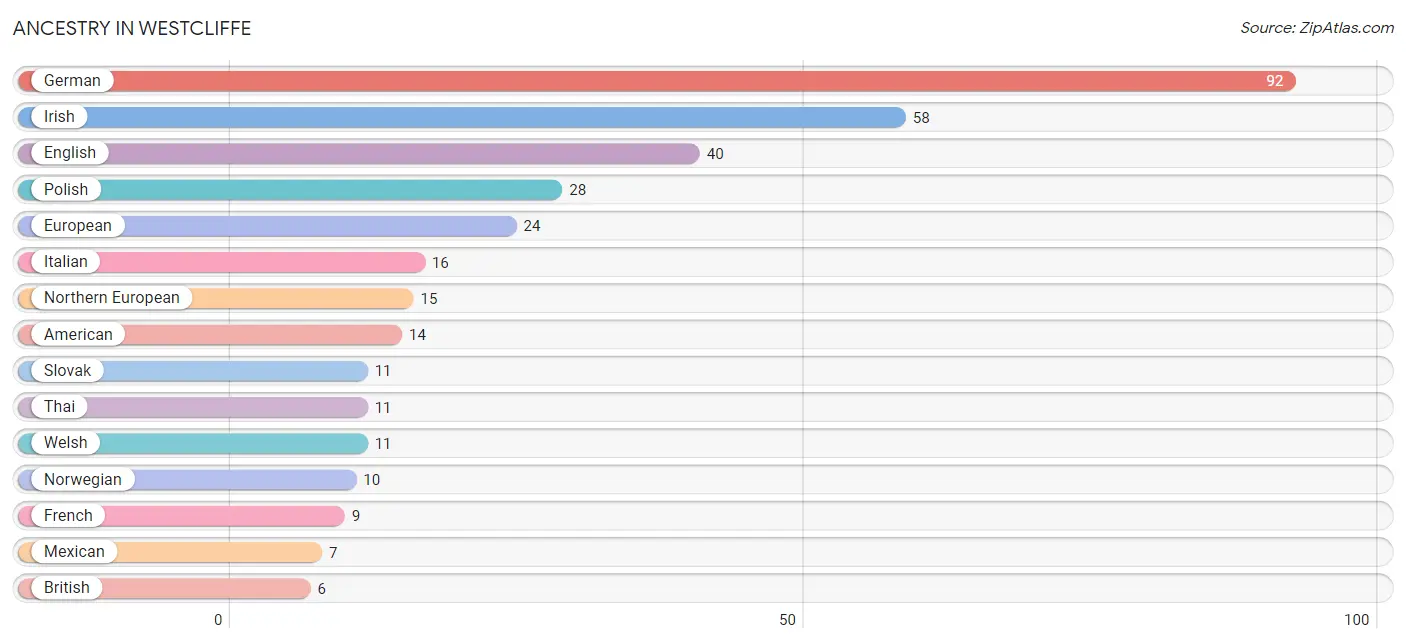
| Ancestry | # Population | % Population |
| American | 14 | 3.2% |
| British | 6 | 1.3% |
| Chippewa | 3 | 0.7% |
| Dutch | 3 | 0.7% |
| English | 40 | 9.0% |
| European | 24 | 5.4% |
| French | 9 | 2.0% |
| German | 92 | 20.8% |
| Irish | 58 | 13.1% |
| Italian | 16 | 3.6% |
| Mexican | 7 | 1.6% |
| Northern European | 15 | 3.4% |
| Norwegian | 10 | 2.3% |
| Pennsylvania German | 1 | 0.2% |
| Polish | 28 | 6.3% |
| Scotch-Irish | 2 | 0.4% |
| Slovak | 11 | 2.5% |
| Spanish | 3 | 0.7% |
| Swedish | 4 | 0.9% |
| Thai | 11 | 2.5% |
| Welsh | 11 | 2.5% | View All 21 Rows |
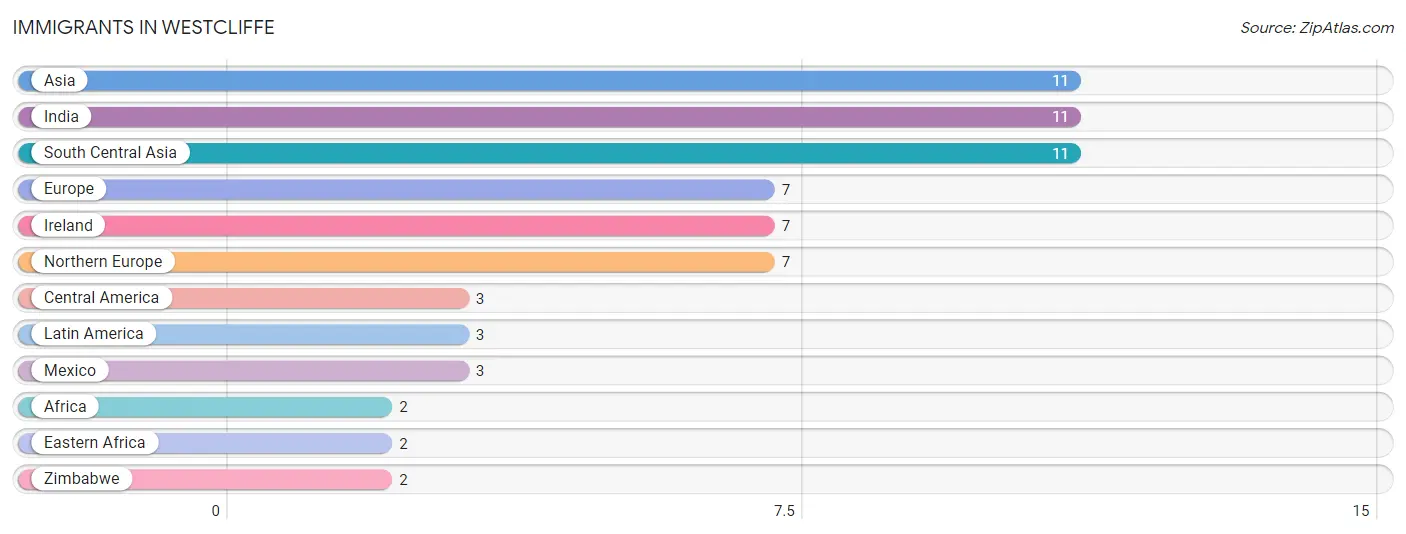
Immigrants in Westcliffe
The most numerous immigrant groups reported in Westcliffe came from Asia (11 | 2.5%), India (11 | 2.5%), South Central Asia (11 | 2.5%), Europe (7 | 1.6%), and Ireland (7 | 1.6%), together accounting for 10.6% of all Westcliffe residents.
| Immigration Origin | # Population | % Population |
| Africa | 2 | 0.4% |
| Asia | 11 | 2.5% |
| Central America | 3 | 0.7% |
| Eastern Africa | 2 | 0.4% |
| Europe | 7 | 1.6% |
| India | 11 | 2.5% |
| Ireland | 7 | 1.6% |
| Latin America | 3 | 0.7% |
| Mexico | 3 | 0.7% |
| Northern Europe | 7 | 1.6% |
| South Central Asia | 11 | 2.5% |
| Zimbabwe | 2 | 0.4% | View All 12 Rows |
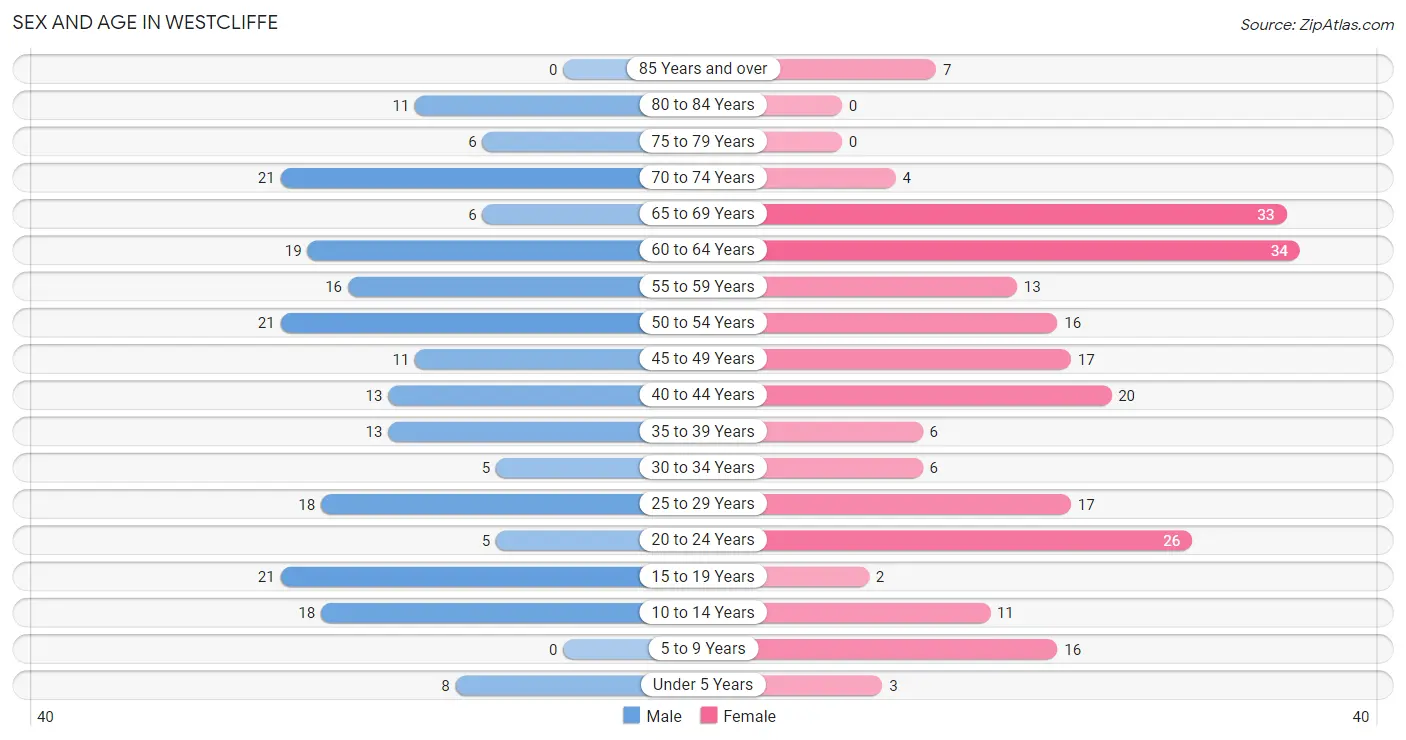
Sex and Age in Westcliffe
Sex and Age in Westcliffe
The most populous age groups in Westcliffe are 15 to 19 Years (21 | 9.9%) for men and 60 to 64 Years (34 | 14.7%) for women.
| Age Bracket | Male | Female |
| Under 5 Years | 8 (3.8%) | 3 (1.3%) |
| 5 to 9 Years | 0 (0.0%) | 16 (6.9%) |
| 10 to 14 Years | 18 (8.5%) | 11 (4.8%) |
| 15 to 19 Years | 21 (9.9%) | 2 (0.9%) |
| 20 to 24 Years | 5 (2.4%) | 26 (11.3%) |
| 25 to 29 Years | 18 (8.5%) | 17 (7.4%) |
| 30 to 34 Years | 5 (2.4%) | 6 (2.6%) |
| 35 to 39 Years | 13 (6.1%) | 6 (2.6%) |
| 40 to 44 Years | 13 (6.1%) | 20 (8.7%) |
| 45 to 49 Years | 11 (5.2%) | 17 (7.4%) |
| 50 to 54 Years | 21 (9.9%) | 16 (6.9%) |
| 55 to 59 Years | 16 (7.5%) | 13 (5.6%) |
| 60 to 64 Years | 19 (9.0%) | 34 (14.7%) |
| 65 to 69 Years | 6 (2.8%) | 33 (14.3%) |
| 70 to 74 Years | 21 (9.9%) | 4 (1.7%) |
| 75 to 79 Years | 6 (2.8%) | 0 (0.0%) |
| 80 to 84 Years | 11 (5.2%) | 0 (0.0%) |
| 85 Years and over | 0 (0.0%) | 7 (3.0%) |
| Total | 212 (100.0%) | 231 (100.0%) |
Families and Households in Westcliffe
Median Family Size in Westcliffe
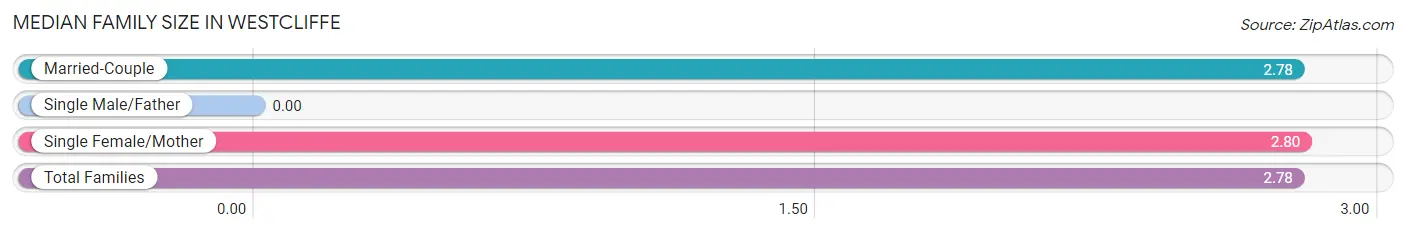
| Family Type | # Families | Family Size |
| Married-Couple | 80 (84.2%) | 2.78 |
| Single Male/Father | 0 (0.0%) | - |
| Single Female/Mother | 15 (15.8%) | 2.80 |
| Total Families | 95 (100.0%) | 2.78 |
Median Household Size in Westcliffe
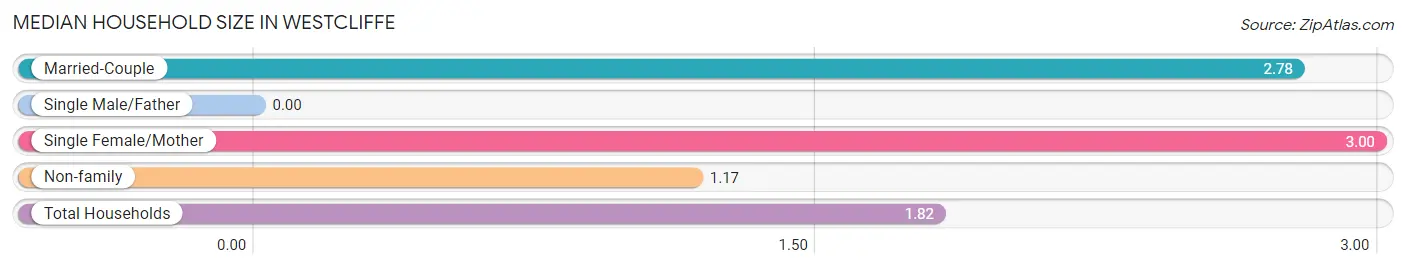
| Household Type | # Households | Household Size |
| Married-Couple | 80 (33.6%) | 2.78 |
| Single Male/Father | 0 (0.0%) | - |
| Single Female/Mother | 15 (6.3%) | 3.00 |
| Non-family | 143 (60.1%) | 1.17 |
| Total Households | 238 (100.0%) | 1.82 |
Household Size by Marriage Status in Westcliffe
Out of a total of 238 households in Westcliffe, 95 (39.9%) are family households, while 143 (60.1%) are nonfamily households. The most numerous type of family households are 2-person households, comprising 45, and the most common type of nonfamily households are 1-person households, comprising 116.
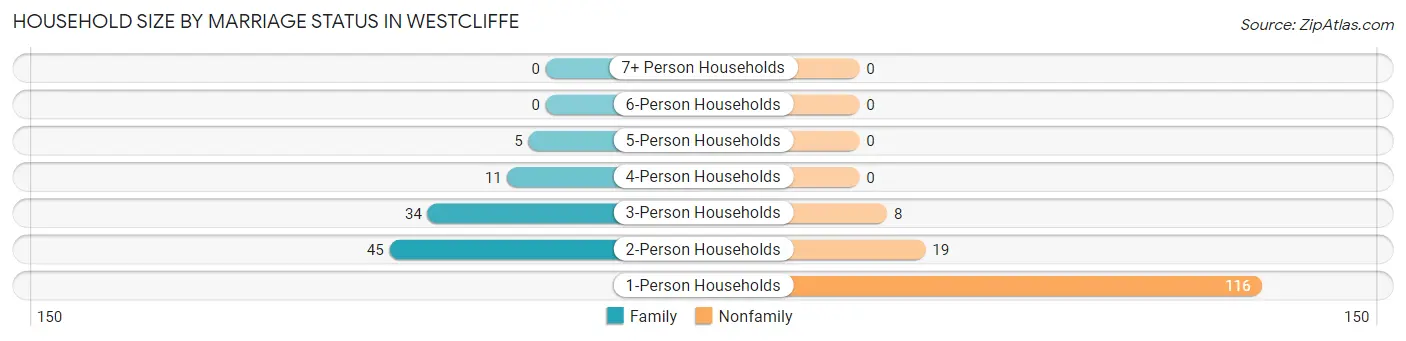
| Household Size | Family Households | Nonfamily Households |
| 1-Person Households | - | 116 (48.7%) |
| 2-Person Households | 45 (18.9%) | 19 (8.0%) |
| 3-Person Households | 34 (14.3%) | 8 (3.4%) |
| 4-Person Households | 11 (4.6%) | 0 (0.0%) |
| 5-Person Households | 5 (2.1%) | 0 (0.0%) |
| 6-Person Households | 0 (0.0%) | 0 (0.0%) |
| 7+ Person Households | 0 (0.0%) | 0 (0.0%) |
| Total | 95 (39.9%) | 143 (60.1%) |
Female Fertility in Westcliffe
Fertility by Age in Westcliffe
| Age Bracket | Women with Births | Births / 1,000 Women |
| 15 to 19 years | 0 (0.0%) | 0.0 |
| 20 to 34 years | 0 (0.0%) | 0.0 |
| 35 to 50 years | 0 (0.0%) | 0.0 |
| Total | 0 (0.0%) | 0.0 |
Fertility by Age by Marriage Status in Westcliffe
| Age Bracket | Married | Unmarried |
| 15 to 19 years | 0 (0.0%) | 0 (0.0%) |
| 20 to 34 years | 0 (0.0%) | 0 (0.0%) |
| 35 to 50 years | 0 (0.0%) | 0 (0.0%) |
| Total | 0 (0.0%) | 0 (0.0%) |
Fertility by Education in Westcliffe
| Educational Attainment | Women with Births | Births / 1,000 Women |
| Less than High School | 0 (0.0%) | 0.0 |
| High School Diploma | 0 (0.0%) | 0.0 |
| College or Associate's Degree | 0 (0.0%) | 0.0 |
| Bachelor's Degree | 0 (0.0%) | 0.0 |
| Graduate Degree | 0 (0.0%) | 0.0 |
| Total | 0 (0.0%) | 0.0 |
Fertility by Education by Marriage Status in Westcliffe
| Educational Attainment | Married | Unmarried |
| Less than High School | 0 (0.0%) | 0 (0.0%) |
| High School Diploma | 0 (0.0%) | 0 (0.0%) |
| College or Associate's Degree | 0 (0.0%) | 0 (0.0%) |
| Bachelor's Degree | 0 (0.0%) | 0 (0.0%) |
| Graduate Degree | 0 (0.0%) | 0 (0.0%) |
| Total | 0 (0.0%) | 0 (0.0%) |
Employment Characteristics in Westcliffe
Employment by Class of Employer in Westcliffe
Among the 218 employed individuals in Westcliffe, private company employees (78 | 35.8%), local government employees (51 | 23.4%), and self-employed (incorporated) (35 | 16.1%) make up the most common classes of employment.
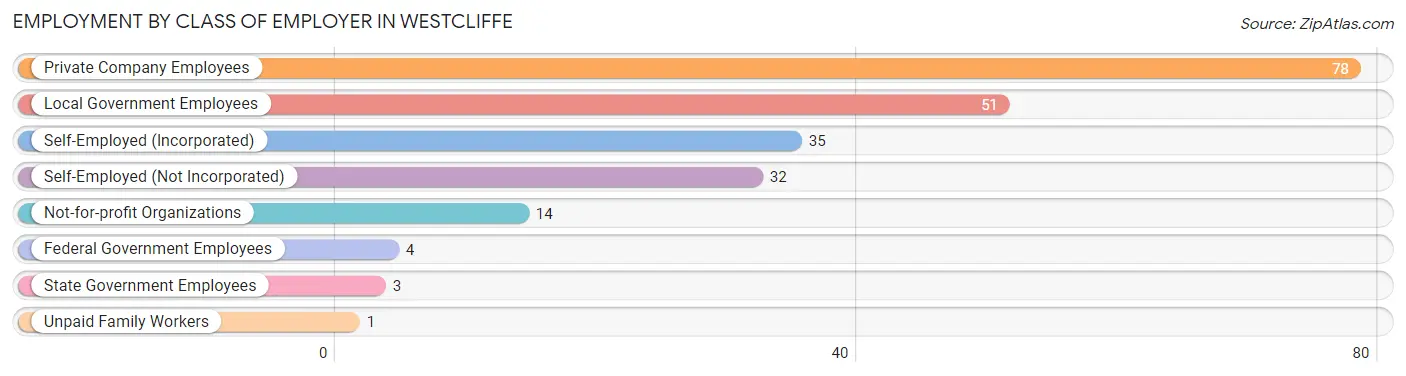
| Employer Class | # Employees | % Employees |
| Private Company Employees | 78 | 35.8% |
| Self-Employed (Incorporated) | 35 | 16.1% |
| Self-Employed (Not Incorporated) | 32 | 14.7% |
| Not-for-profit Organizations | 14 | 6.4% |
| Local Government Employees | 51 | 23.4% |
| State Government Employees | 3 | 1.4% |
| Federal Government Employees | 4 | 1.8% |
| Unpaid Family Workers | 1 | 0.5% |
| Total | 218 | 100.0% |
Employment Status by Age in Westcliffe
According to the labor force statistics for Westcliffe, out of the total population over 16 years of age (371), 63.9% or 237 individuals are in the labor force, with 6.8% or 16 of them unemployed. The age group with the highest labor force participation rate is 25 to 29 years, with 94.3% or 33 individuals in the labor force. Within the labor force, the 45 to 54 years age range has the highest percentage of unemployed individuals, with 25.9% or 14 of them being unemployed.
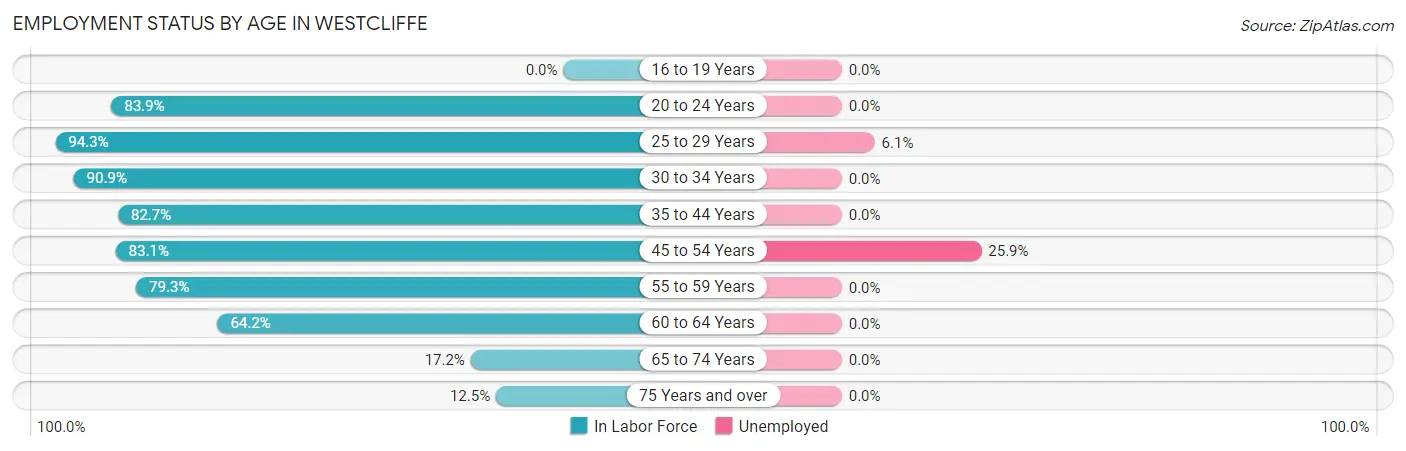
| Age Bracket | In Labor Force | Unemployed |
| 16 to 19 Years | 0 (0.0%) | 0 (0.0%) |
| 20 to 24 Years | 26 (83.9%) | 0 (0.0%) |
| 25 to 29 Years | 33 (94.3%) | 2 (6.1%) |
| 30 to 34 Years | 10 (90.9%) | 0 (0.0%) |
| 35 to 44 Years | 43 (82.7%) | 0 (0.0%) |
| 45 to 54 Years | 54 (83.1%) | 14 (25.9%) |
| 55 to 59 Years | 23 (79.3%) | 0 (0.0%) |
| 60 to 64 Years | 34 (64.2%) | 0 (0.0%) |
| 65 to 74 Years | 11 (17.2%) | 0 (0.0%) |
| 75 Years and over | 3 (12.5%) | 0 (0.0%) |
| Total | 237 (63.9%) | 16 (6.8%) |
Employment Status by Educational Attainment in Westcliffe
According to labor force statistics for Westcliffe, 80.4% of individuals (197) out of the total population between 25 and 64 years of age (245) are in the labor force, with 8.1% or 16 of them being unemployed. The group with the highest labor force participation rate are those with the educational attainment of college / associate degree, with 90.5% or 67 individuals in the labor force. Within the labor force, individuals with bachelor's degree or higher education have the highest percentage of unemployment, with 17.3% or 14 of them being unemployed.
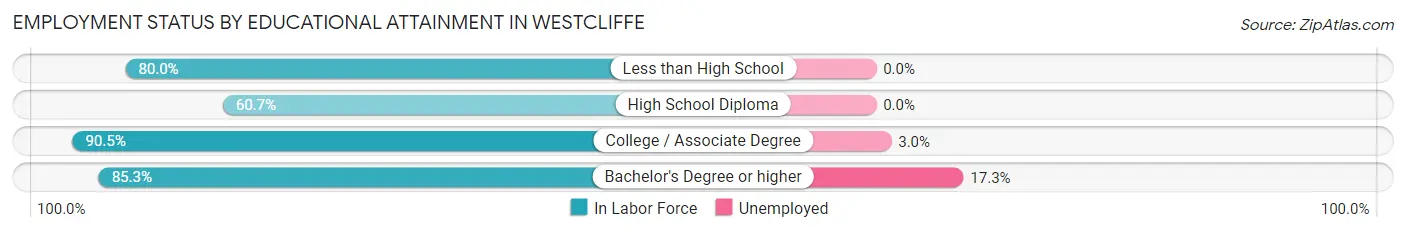
| Educational Attainment | In Labor Force | Unemployed |
| Less than High School | 12 (80.0%) | 0 (0.0%) |
| High School Diploma | 37 (60.7%) | 0 (0.0%) |
| College / Associate Degree | 67 (90.5%) | 2 (3.0%) |
| Bachelor's Degree or higher | 81 (85.3%) | 16 (17.3%) |
| Total | 197 (80.4%) | 20 (8.1%) |
Employment Occupations by Sex in Westcliffe
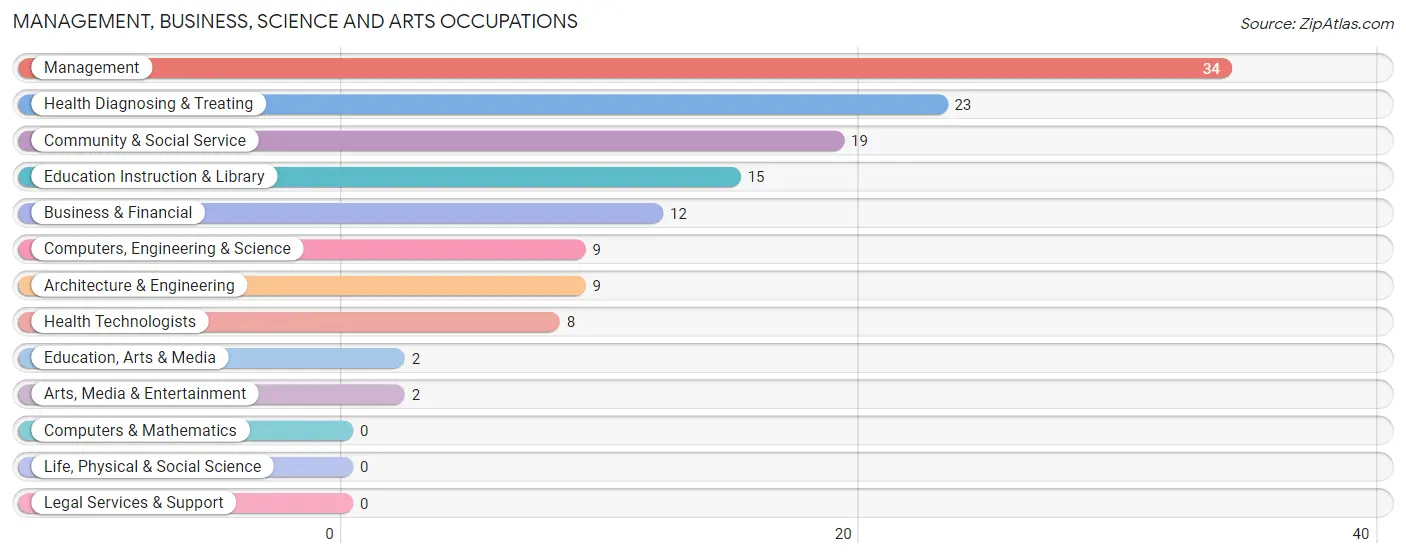
Management, Business, Science and Arts Occupations
The most common Management, Business, Science and Arts occupations in Westcliffe are Management (34 | 15.4%), Health Diagnosing & Treating (23 | 10.4%), Community & Social Service (19 | 8.6%), Education Instruction & Library (15 | 6.8%), and Business & Financial (12 | 5.4%).
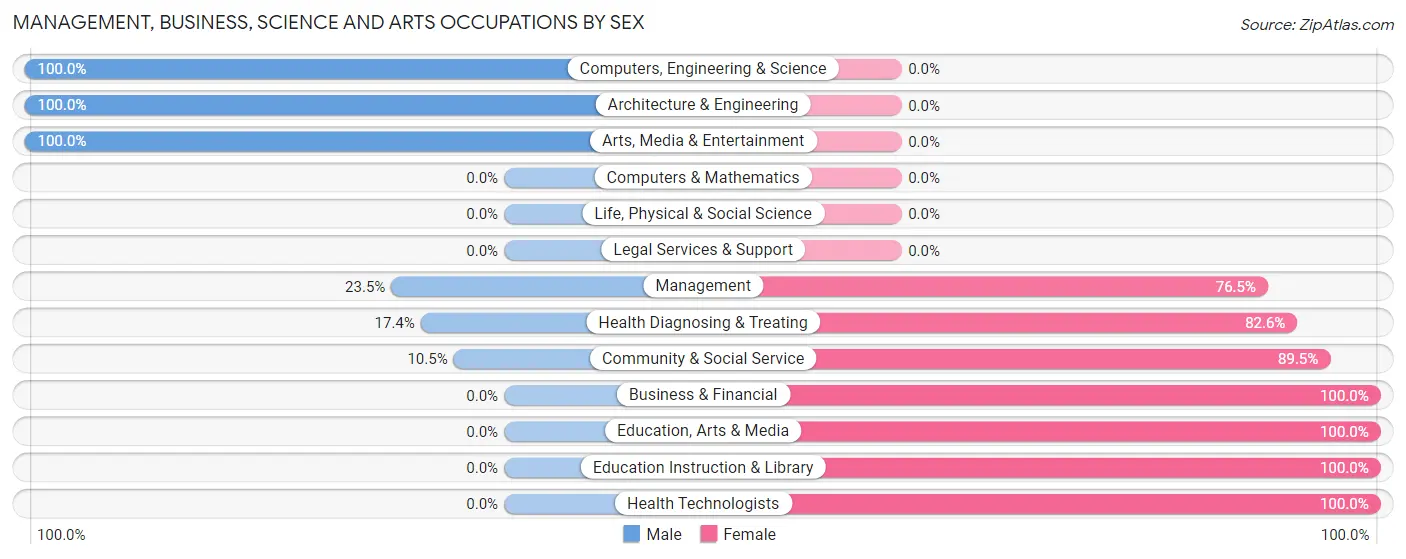
Management, Business, Science and Arts Occupations by Sex
Within the Management, Business, Science and Arts occupations in Westcliffe, the most male-oriented occupations are Computers, Engineering & Science (100.0%), Architecture & Engineering (100.0%), and Arts, Media & Entertainment (100.0%), while the most female-oriented occupations are Business & Financial (100.0%), Education, Arts & Media (100.0%), and Education Instruction & Library (100.0%).
| Occupation | Male | Female |
| Management | 8 (23.5%) | 26 (76.5%) |
| Business & Financial | 0 (0.0%) | 12 (100.0%) |
| Computers, Engineering & Science | 9 (100.0%) | 0 (0.0%) |
| Computers & Mathematics | 0 (0.0%) | 0 (0.0%) |
| Architecture & Engineering | 9 (100.0%) | 0 (0.0%) |
| Life, Physical & Social Science | 0 (0.0%) | 0 (0.0%) |
| Community & Social Service | 2 (10.5%) | 17 (89.5%) |
| Education, Arts & Media | 0 (0.0%) | 2 (100.0%) |
| Legal Services & Support | 0 (0.0%) | 0 (0.0%) |
| Education Instruction & Library | 0 (0.0%) | 15 (100.0%) |
| Arts, Media & Entertainment | 2 (100.0%) | 0 (0.0%) |
| Health Diagnosing & Treating | 4 (17.4%) | 19 (82.6%) |
| Health Technologists | 0 (0.0%) | 8 (100.0%) |
| Total (Category) | 23 (23.7%) | 74 (76.3%) |
| Total (Overall) | 79 (35.7%) | 142 (64.2%) |
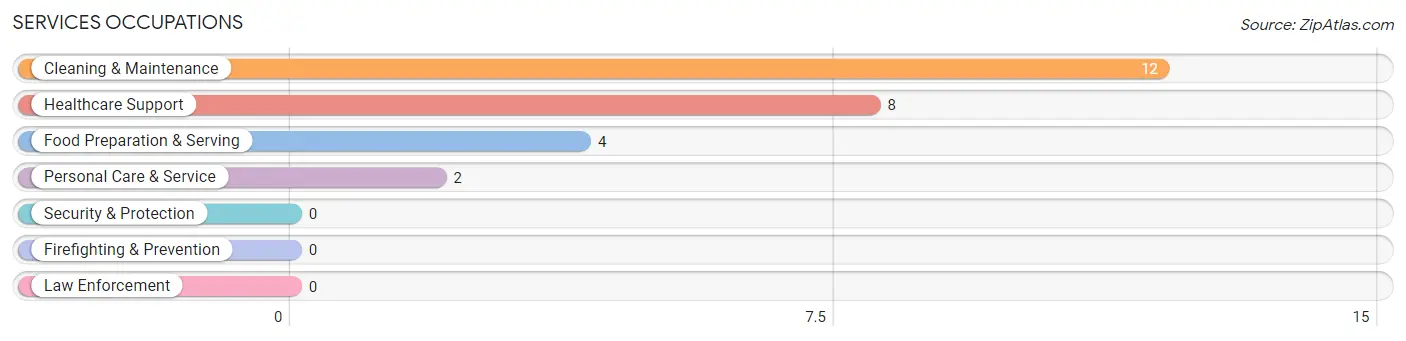
Services Occupations
The most common Services occupations in Westcliffe are Cleaning & Maintenance (12 | 5.4%), Healthcare Support (8 | 3.6%), Food Preparation & Serving (4 | 1.8%), and Personal Care & Service (2 | 0.9%).
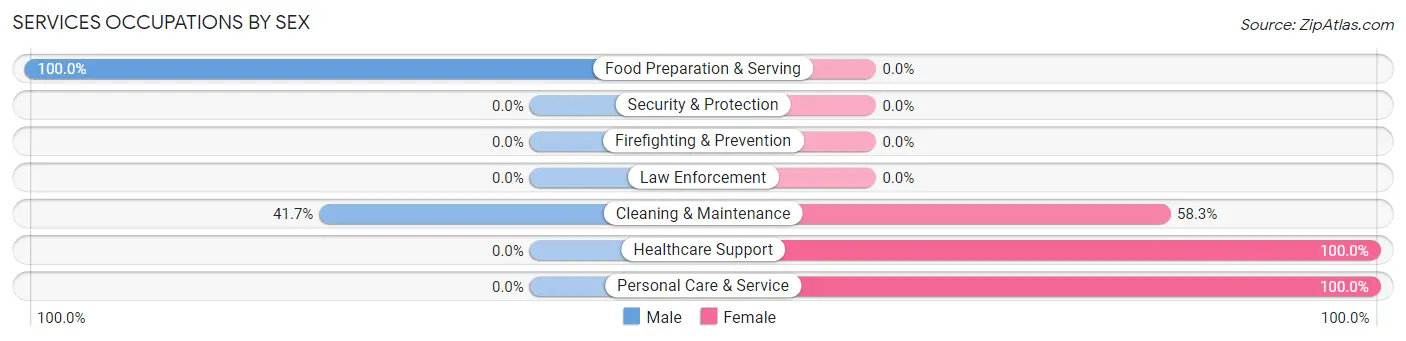
Services Occupations by Sex
Within the Services occupations in Westcliffe, the most male-oriented occupations are Food Preparation & Serving (100.0%), and Cleaning & Maintenance (41.7%), while the most female-oriented occupations are Healthcare Support (100.0%), Personal Care & Service (100.0%), and Cleaning & Maintenance (58.3%).
| Occupation | Male | Female |
| Healthcare Support | 0 (0.0%) | 8 (100.0%) |
| Security & Protection | 0 (0.0%) | 0 (0.0%) |
| Firefighting & Prevention | 0 (0.0%) | 0 (0.0%) |
| Law Enforcement | 0 (0.0%) | 0 (0.0%) |
| Food Preparation & Serving | 4 (100.0%) | 0 (0.0%) |
| Cleaning & Maintenance | 5 (41.7%) | 7 (58.3%) |
| Personal Care & Service | 0 (0.0%) | 2 (100.0%) |
| Total (Category) | 9 (34.6%) | 17 (65.4%) |
| Total (Overall) | 79 (35.7%) | 142 (64.2%) |
Sales and Office Occupations
The most common Sales and Office occupations in Westcliffe are Office & Administration (31 | 14.0%), and Sales & Related (20 | 9.0%).
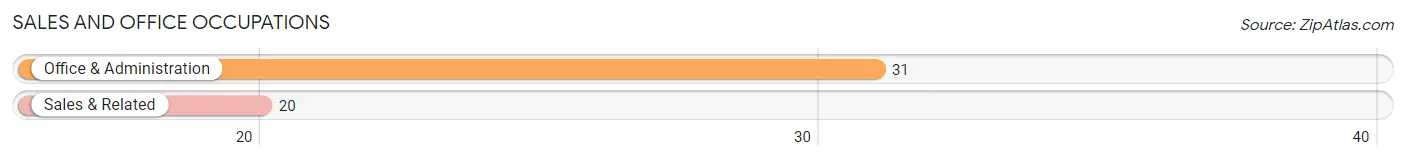
Sales and Office Occupations by Sex
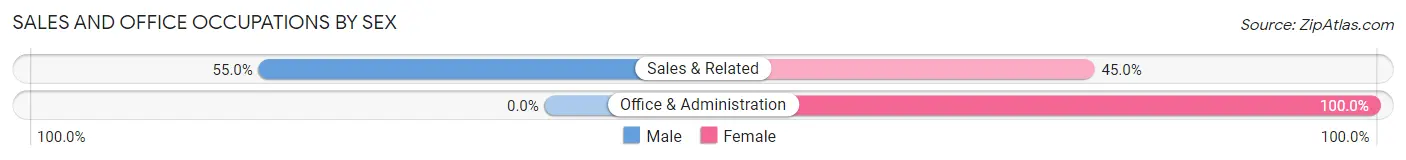
| Occupation | Male | Female |
| Sales & Related | 11 (55.0%) | 9 (45.0%) |
| Office & Administration | 0 (0.0%) | 31 (100.0%) |
| Total (Category) | 11 (21.6%) | 40 (78.4%) |
| Total (Overall) | 79 (35.7%) | 142 (64.2%) |
Natural Resources, Construction and Maintenance Occupations
The most common Natural Resources, Construction and Maintenance occupations in Westcliffe are Construction & Extraction (22 | 10.0%), and Installation, Maintenance & Repair (6 | 2.7%).
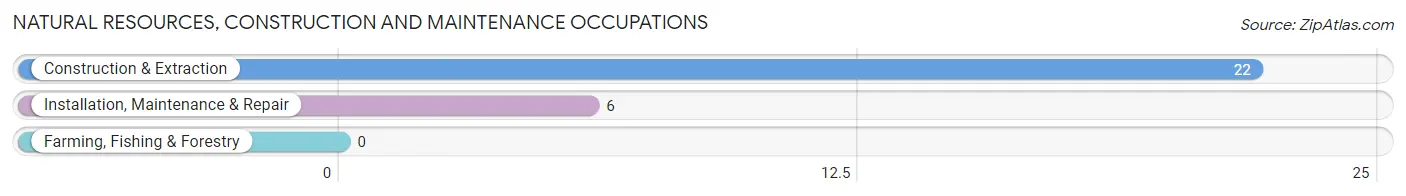
Natural Resources, Construction and Maintenance Occupations by Sex
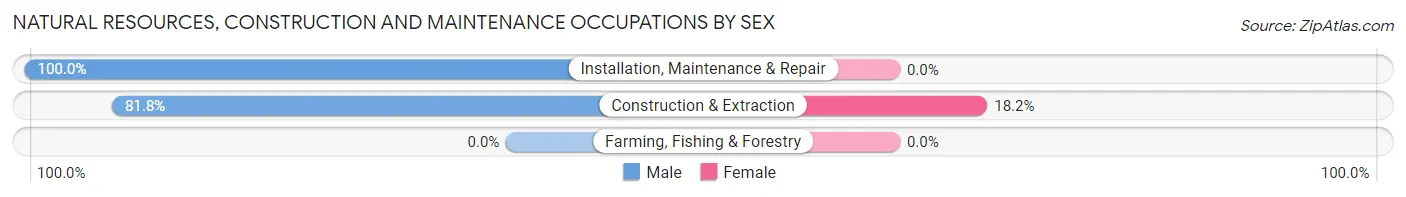
| Occupation | Male | Female |
| Farming, Fishing & Forestry | 0 (0.0%) | 0 (0.0%) |
| Construction & Extraction | 18 (81.8%) | 4 (18.2%) |
| Installation, Maintenance & Repair | 6 (100.0%) | 0 (0.0%) |
| Total (Category) | 24 (85.7%) | 4 (14.3%) |
| Total (Overall) | 79 (35.7%) | 142 (64.2%) |
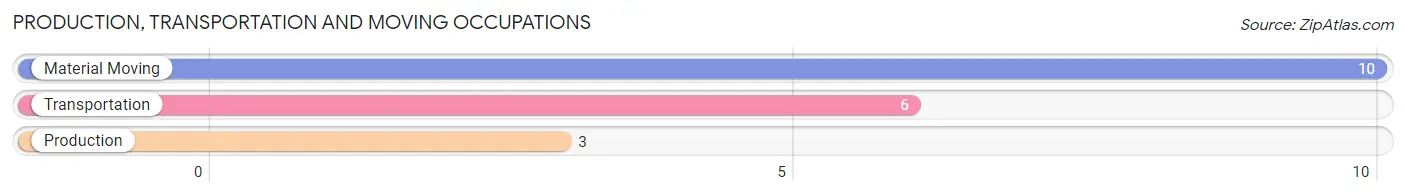
Production, Transportation and Moving Occupations
The most common Production, Transportation and Moving occupations in Westcliffe are Material Moving (10 | 4.5%), Transportation (6 | 2.7%), and Production (3 | 1.4%).
Production, Transportation and Moving Occupations by Sex
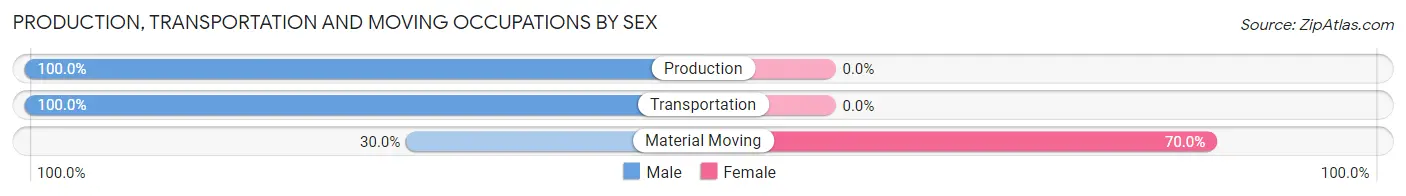
| Occupation | Male | Female |
| Production | 3 (100.0%) | 0 (0.0%) |
| Transportation | 6 (100.0%) | 0 (0.0%) |
| Material Moving | 3 (30.0%) | 7 (70.0%) |
| Total (Category) | 12 (63.2%) | 7 (36.8%) |
| Total (Overall) | 79 (35.7%) | 142 (64.2%) |
Employment Industries by Sex in Westcliffe
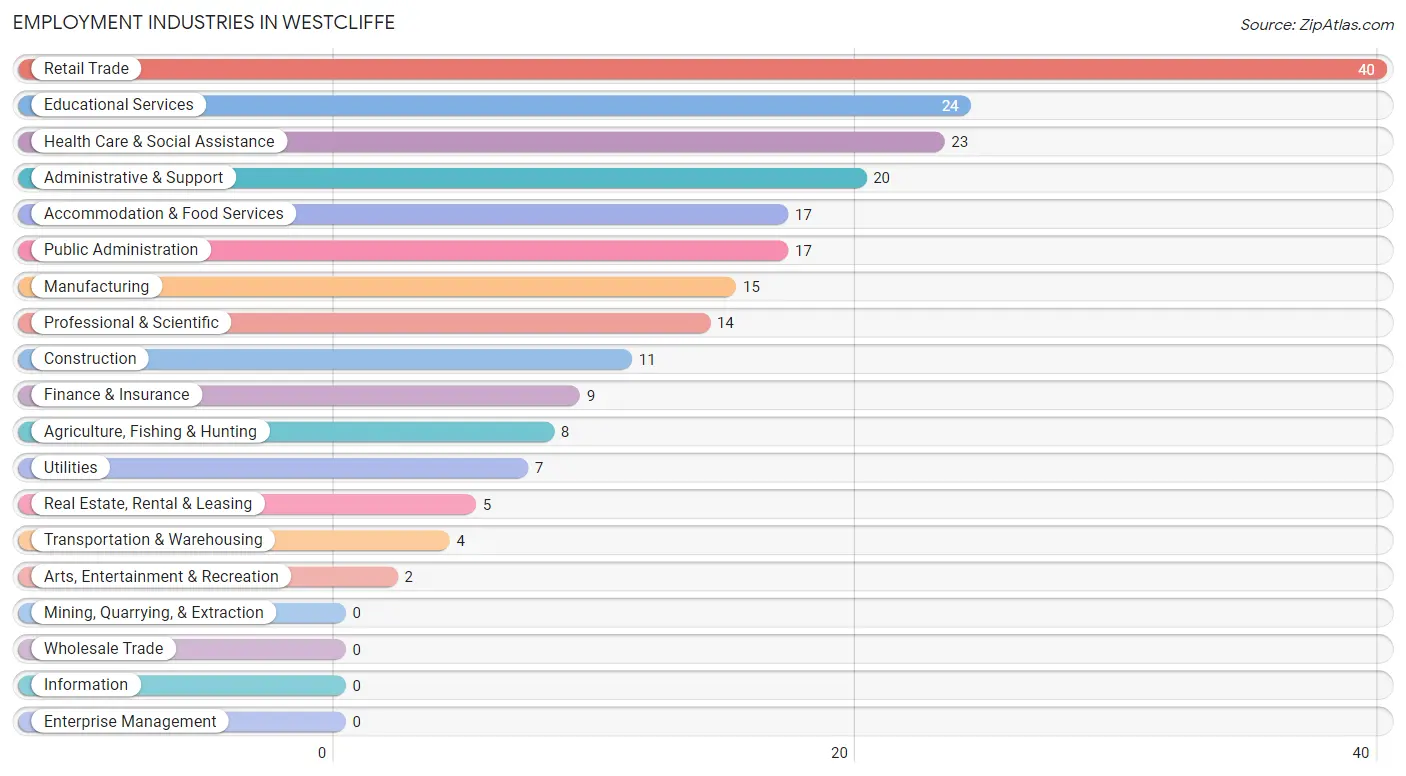
Employment Industries in Westcliffe
The major employment industries in Westcliffe include Retail Trade (40 | 18.1%), Educational Services (24 | 10.9%), Health Care & Social Assistance (23 | 10.4%), Administrative & Support (20 | 9.0%), and Accommodation & Food Services (17 | 7.7%).
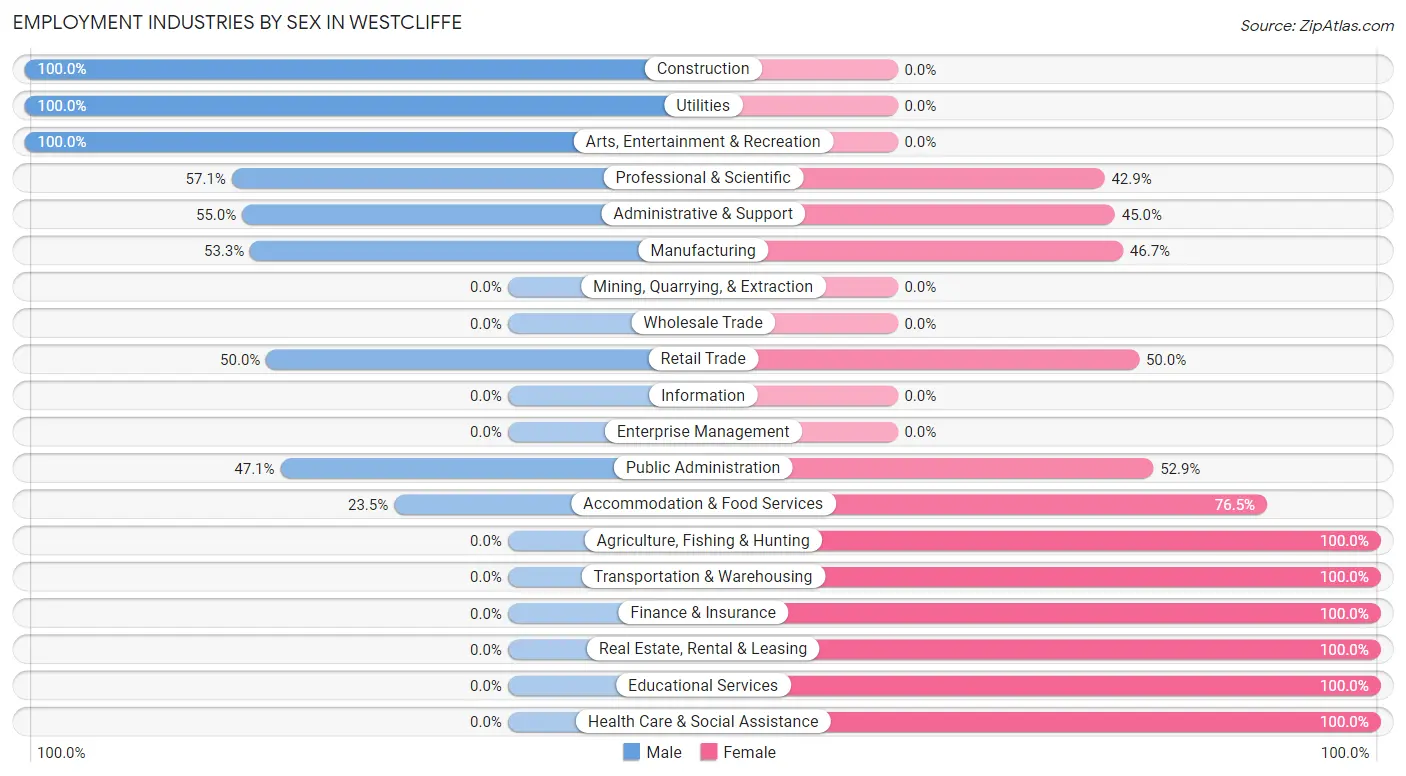
Employment Industries by Sex in Westcliffe
The Westcliffe industries that see more men than women are Construction (100.0%), Utilities (100.0%), and Arts, Entertainment & Recreation (100.0%), whereas the industries that tend to have a higher number of women are Agriculture, Fishing & Hunting (100.0%), Transportation & Warehousing (100.0%), and Finance & Insurance (100.0%).
| Industry | Male | Female |
| Agriculture, Fishing & Hunting | 0 (0.0%) | 8 (100.0%) |
| Mining, Quarrying, & Extraction | 0 (0.0%) | 0 (0.0%) |
| Construction | 11 (100.0%) | 0 (0.0%) |
| Manufacturing | 8 (53.3%) | 7 (46.7%) |
| Wholesale Trade | 0 (0.0%) | 0 (0.0%) |
| Retail Trade | 20 (50.0%) | 20 (50.0%) |
| Transportation & Warehousing | 0 (0.0%) | 4 (100.0%) |
| Utilities | 7 (100.0%) | 0 (0.0%) |
| Information | 0 (0.0%) | 0 (0.0%) |
| Finance & Insurance | 0 (0.0%) | 9 (100.0%) |
| Real Estate, Rental & Leasing | 0 (0.0%) | 5 (100.0%) |
| Professional & Scientific | 8 (57.1%) | 6 (42.9%) |
| Enterprise Management | 0 (0.0%) | 0 (0.0%) |
| Administrative & Support | 11 (55.0%) | 9 (45.0%) |
| Educational Services | 0 (0.0%) | 24 (100.0%) |
| Health Care & Social Assistance | 0 (0.0%) | 23 (100.0%) |
| Arts, Entertainment & Recreation | 2 (100.0%) | 0 (0.0%) |
| Accommodation & Food Services | 4 (23.5%) | 13 (76.5%) |
| Public Administration | 8 (47.1%) | 9 (52.9%) |
| Total | 79 (35.7%) | 142 (64.2%) |
Education in Westcliffe
School Enrollment in Westcliffe
The most common levels of schooling among the 91 students in Westcliffe are high school (29 | 31.9%), middle school (23 | 25.3%), and college / undergraduate (11 | 12.1%).
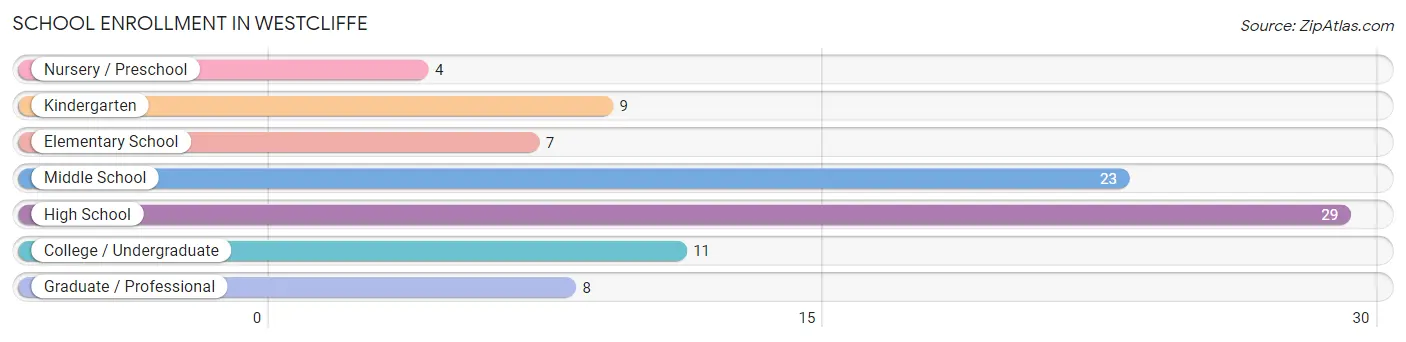
| School Level | # Students | % Students |
| Nursery / Preschool | 4 | 4.4% |
| Kindergarten | 9 | 9.9% |
| Elementary School | 7 | 7.7% |
| Middle School | 23 | 25.3% |
| High School | 29 | 31.9% |
| College / Undergraduate | 11 | 12.1% |
| Graduate / Professional | 8 | 8.8% |
| Total | 91 | 100.0% |
School Enrollment by Age by Funding Source in Westcliffe
Out of a total of 91 students who are enrolled in schools in Westcliffe, 41 (45.1%) attend a private institution, while the remaining 50 (54.9%) are enrolled in public schools. The age group of 3 to 4 year olds has the highest likelihood of being enrolled in private schools, with 4 (100.0% in the age bracket) enrolled. Conversely, the age group of 15 to 17 year olds has the lowest likelihood of being enrolled in a private school, with 23 (100.0% in the age bracket) attending a public institution.
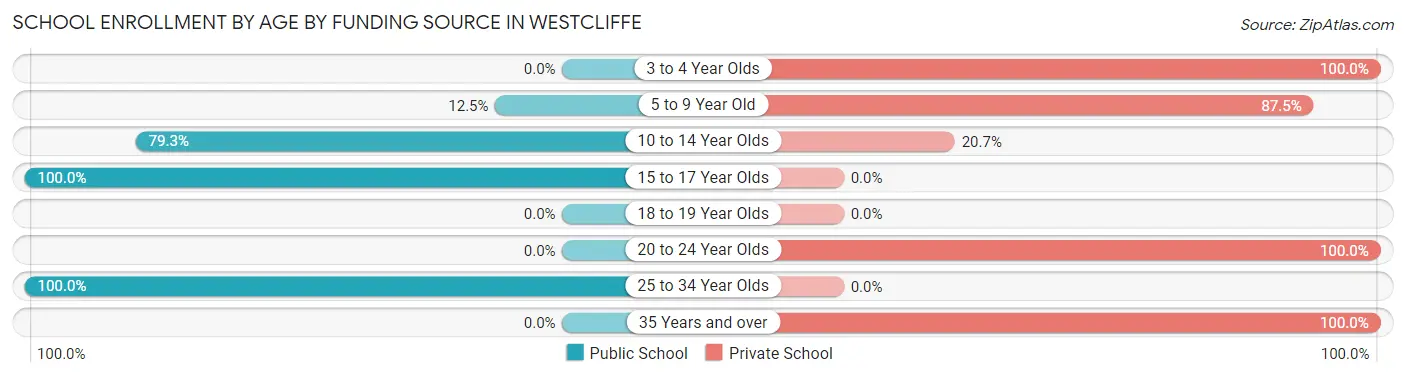
| Age Bracket | Public School | Private School |
| 3 to 4 Year Olds | 0 (0.0%) | 4 (100.0%) |
| 5 to 9 Year Old | 2 (12.5%) | 14 (87.5%) |
| 10 to 14 Year Olds | 23 (79.3%) | 6 (20.7%) |
| 15 to 17 Year Olds | 23 (100.0%) | 0 (0.0%) |
| 18 to 19 Year Olds | 0 (0.0%) | 0 (0.0%) |
| 20 to 24 Year Olds | 0 (0.0%) | 11 (100.0%) |
| 25 to 34 Year Olds | 2 (100.0%) | 0 (0.0%) |
| 35 Years and over | 0 (0.0%) | 6 (100.0%) |
| Total | 50 (54.9%) | 41 (45.1%) |
Educational Attainment by Field of Study in Westcliffe
Business (30 | 20.3%), science & technology (22 | 14.9%), education (21 | 14.2%), social sciences (16 | 10.8%), and arts & humanities (14 | 9.5%) are the most common fields of study among 148 individuals in Westcliffe who have obtained a bachelor's degree or higher.
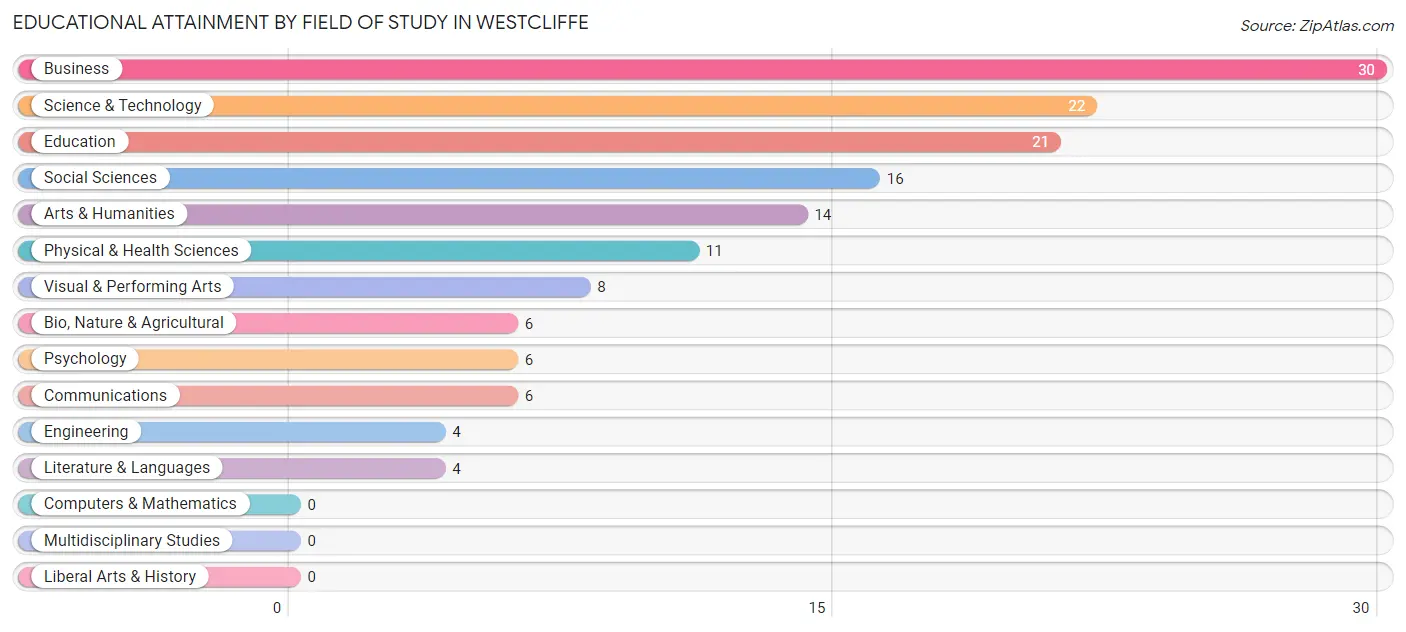
| Field of Study | # Graduates | % Graduates |
| Computers & Mathematics | 0 | 0.0% |
| Bio, Nature & Agricultural | 6 | 4.1% |
| Physical & Health Sciences | 11 | 7.4% |
| Psychology | 6 | 4.1% |
| Social Sciences | 16 | 10.8% |
| Engineering | 4 | 2.7% |
| Multidisciplinary Studies | 0 | 0.0% |
| Science & Technology | 22 | 14.9% |
| Business | 30 | 20.3% |
| Education | 21 | 14.2% |
| Literature & Languages | 4 | 2.7% |
| Liberal Arts & History | 0 | 0.0% |
| Visual & Performing Arts | 8 | 5.4% |
| Communications | 6 | 4.1% |
| Arts & Humanities | 14 | 9.5% |
| Total | 148 | 100.0% |
Transportation & Commute in Westcliffe
Vehicle Availability by Sex in Westcliffe
The most prevalent vehicle ownership categories in Westcliffe are males with 3 vehicles (28, accounting for 36.8%) and females with 3 vehicles (35, making up 19.7%).
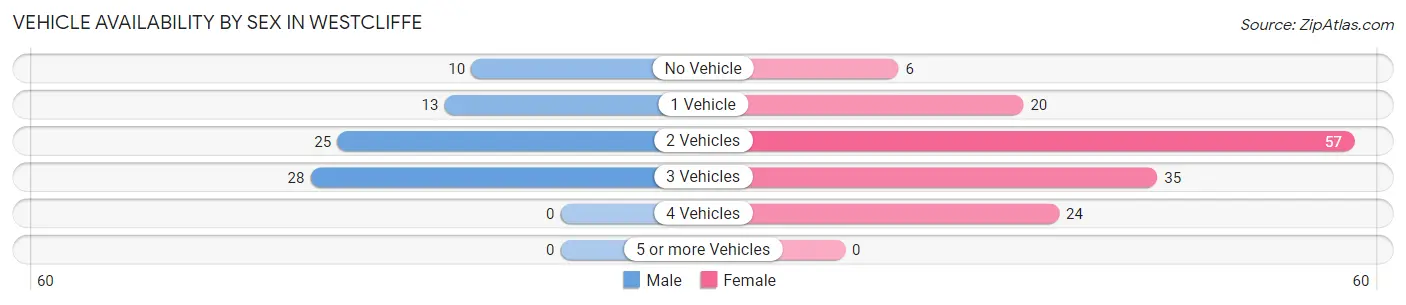
| Vehicles Available | Male | Female |
| No Vehicle | 10 (13.2%) | 6 (4.2%) |
| 1 Vehicle | 13 (17.1%) | 20 (14.1%) |
| 2 Vehicles | 25 (32.9%) | 57 (40.1%) |
| 3 Vehicles | 28 (36.8%) | 35 (24.6%) |
| 4 Vehicles | 0 (0.0%) | 24 (16.9%) |
| 5 or more Vehicles | 0 (0.0%) | 0 (0.0%) |
| Total | 76 (100.0%) | 142 (100.0%) |
Commute Time in Westcliffe
The most frequently occuring commute durations in Westcliffe are 5 to 9 minutes (77 commuters, 44.5%), 15 to 19 minutes (37 commuters, 21.4%), and 90 or more minutes (18 commuters, 10.4%).
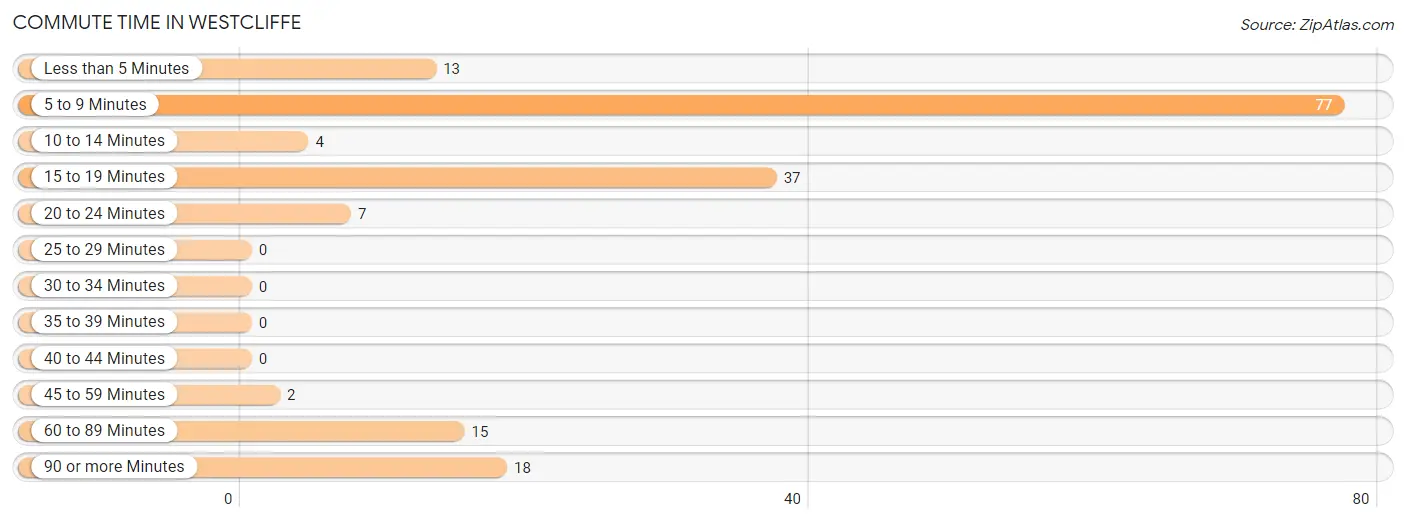
| Commute Time | # Commuters | % Commuters |
| Less than 5 Minutes | 13 | 7.5% |
| 5 to 9 Minutes | 77 | 44.5% |
| 10 to 14 Minutes | 4 | 2.3% |
| 15 to 19 Minutes | 37 | 21.4% |
| 20 to 24 Minutes | 7 | 4.1% |
| 25 to 29 Minutes | 0 | 0.0% |
| 30 to 34 Minutes | 0 | 0.0% |
| 35 to 39 Minutes | 0 | 0.0% |
| 40 to 44 Minutes | 0 | 0.0% |
| 45 to 59 Minutes | 2 | 1.2% |
| 60 to 89 Minutes | 15 | 8.7% |
| 90 or more Minutes | 18 | 10.4% |
Commute Time by Sex in Westcliffe
The most common commute times in Westcliffe are 15 to 19 minutes (20 commuters, 35.7%) for males and 5 to 9 minutes (60 commuters, 51.3%) for females.
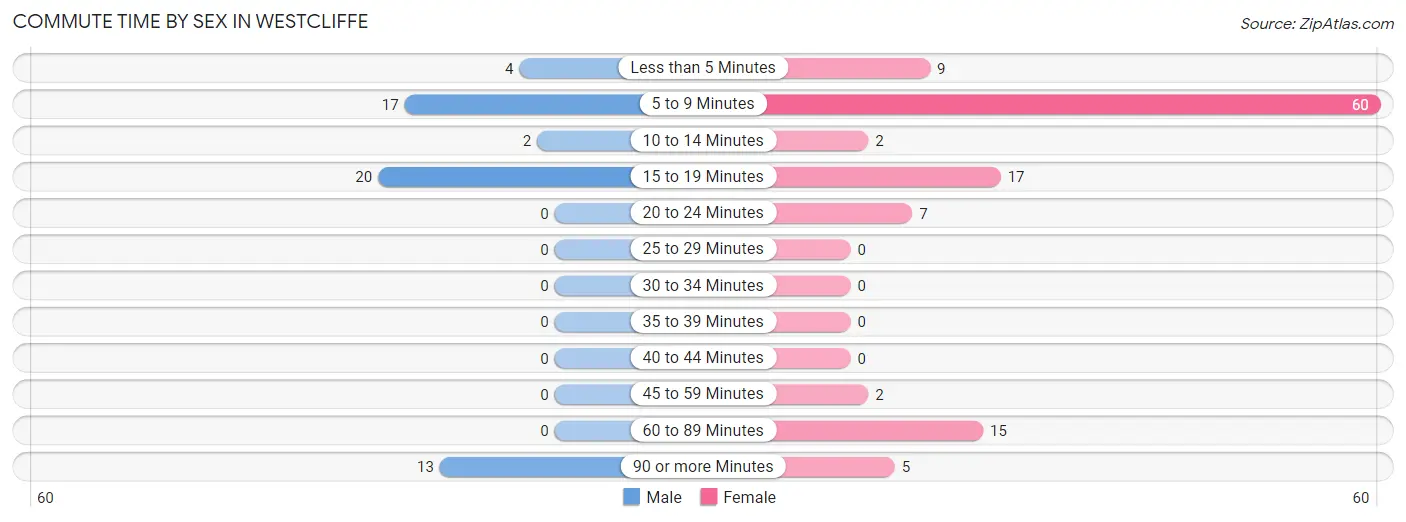
| Commute Time | Male | Female |
| Less than 5 Minutes | 4 (7.1%) | 9 (7.7%) |
| 5 to 9 Minutes | 17 (30.4%) | 60 (51.3%) |
| 10 to 14 Minutes | 2 (3.6%) | 2 (1.7%) |
| 15 to 19 Minutes | 20 (35.7%) | 17 (14.5%) |
| 20 to 24 Minutes | 0 (0.0%) | 7 (6.0%) |
| 25 to 29 Minutes | 0 (0.0%) | 0 (0.0%) |
| 30 to 34 Minutes | 0 (0.0%) | 0 (0.0%) |
| 35 to 39 Minutes | 0 (0.0%) | 0 (0.0%) |
| 40 to 44 Minutes | 0 (0.0%) | 0 (0.0%) |
| 45 to 59 Minutes | 0 (0.0%) | 2 (1.7%) |
| 60 to 89 Minutes | 0 (0.0%) | 15 (12.8%) |
| 90 or more Minutes | 13 (23.2%) | 5 (4.3%) |
Time of Departure to Work by Sex in Westcliffe
The most frequent times of departure to work in Westcliffe are 8:00 AM to 8:29 AM (18, 32.1%) for males and 7:30 AM to 7:59 AM (24, 20.5%) for females.
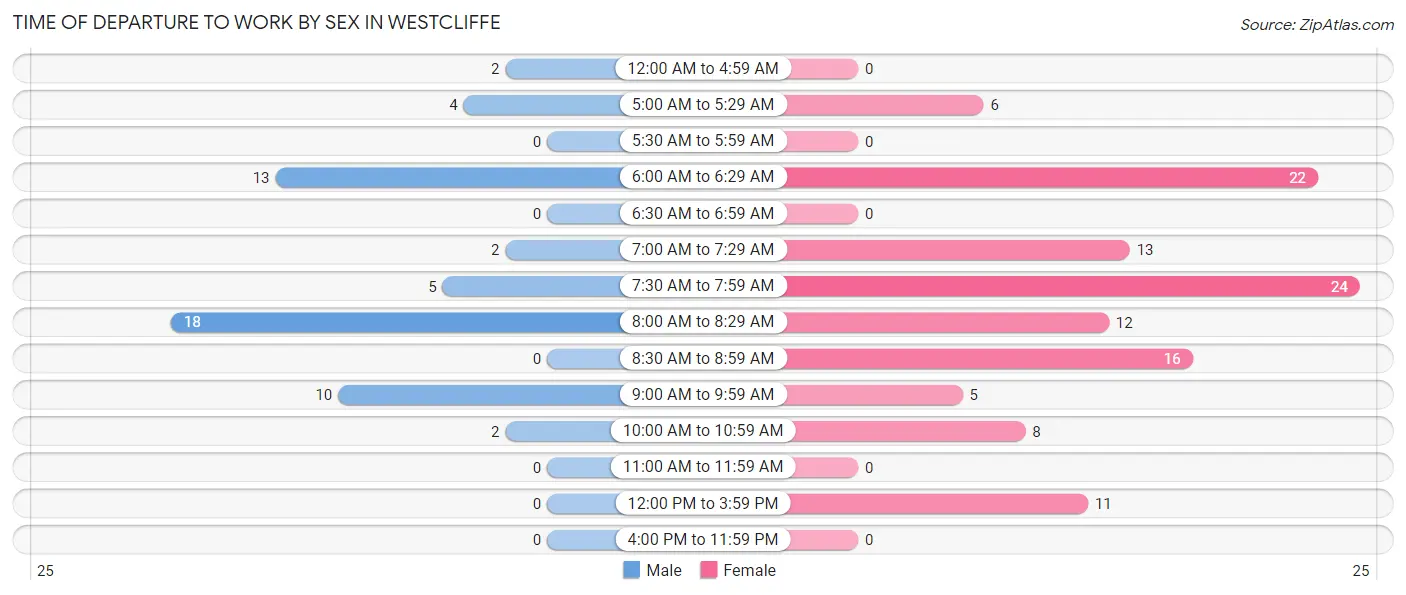
| Time of Departure | Male | Female |
| 12:00 AM to 4:59 AM | 2 (3.6%) | 0 (0.0%) |
| 5:00 AM to 5:29 AM | 4 (7.1%) | 6 (5.1%) |
| 5:30 AM to 5:59 AM | 0 (0.0%) | 0 (0.0%) |
| 6:00 AM to 6:29 AM | 13 (23.2%) | 22 (18.8%) |
| 6:30 AM to 6:59 AM | 0 (0.0%) | 0 (0.0%) |
| 7:00 AM to 7:29 AM | 2 (3.6%) | 13 (11.1%) |
| 7:30 AM to 7:59 AM | 5 (8.9%) | 24 (20.5%) |
| 8:00 AM to 8:29 AM | 18 (32.1%) | 12 (10.3%) |
| 8:30 AM to 8:59 AM | 0 (0.0%) | 16 (13.7%) |
| 9:00 AM to 9:59 AM | 10 (17.9%) | 5 (4.3%) |
| 10:00 AM to 10:59 AM | 2 (3.6%) | 8 (6.8%) |
| 11:00 AM to 11:59 AM | 0 (0.0%) | 0 (0.0%) |
| 12:00 PM to 3:59 PM | 0 (0.0%) | 11 (9.4%) |
| 4:00 PM to 11:59 PM | 0 (0.0%) | 0 (0.0%) |
| Total | 56 (100.0%) | 117 (100.0%) |
Housing Occupancy in Westcliffe
Occupancy by Ownership in Westcliffe
Of the total 238 dwellings in Westcliffe, owner-occupied units account for 175 (73.5%), while renter-occupied units make up 63 (26.5%).
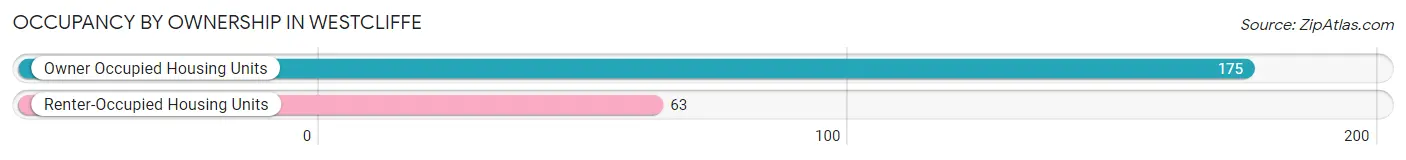
| Occupancy | # Housing Units | % Housing Units |
| Owner Occupied Housing Units | 175 | 73.5% |
| Renter-Occupied Housing Units | 63 | 26.5% |
| Total Occupied Housing Units | 238 | 100.0% |
Occupancy by Household Size in Westcliffe
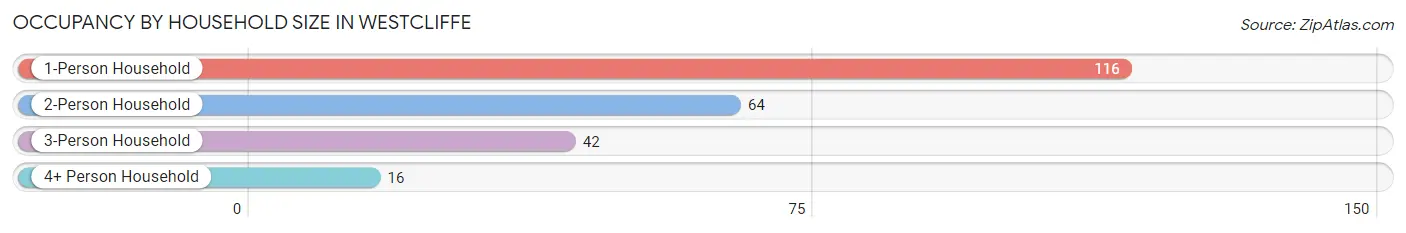
| Household Size | # Housing Units | % Housing Units |
| 1-Person Household | 116 | 48.7% |
| 2-Person Household | 64 | 26.9% |
| 3-Person Household | 42 | 17.6% |
| 4+ Person Household | 16 | 6.7% |
| Total Housing Units | 238 | 100.0% |
Occupancy by Ownership by Household Size in Westcliffe
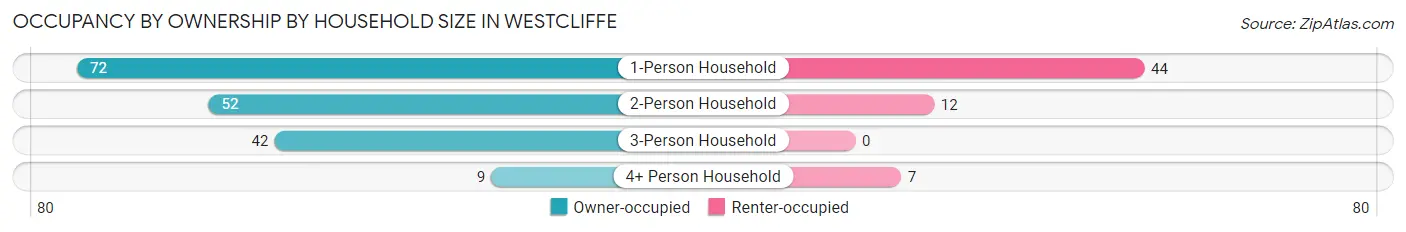
| Household Size | Owner-occupied | Renter-occupied |
| 1-Person Household | 72 (62.1%) | 44 (37.9%) |
| 2-Person Household | 52 (81.2%) | 12 (18.8%) |
| 3-Person Household | 42 (100.0%) | 0 (0.0%) |
| 4+ Person Household | 9 (56.2%) | 7 (43.8%) |
| Total Housing Units | 175 (73.5%) | 63 (26.5%) |
Occupancy by Educational Attainment in Westcliffe
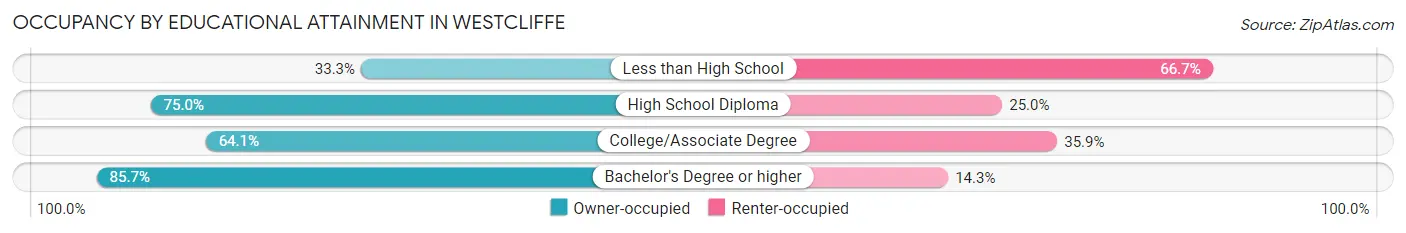
| Household Size | Owner-occupied | Renter-occupied |
| Less than High School | 1 (33.3%) | 2 (66.7%) |
| High School Diploma | 36 (75.0%) | 12 (25.0%) |
| College/Associate Degree | 66 (64.1%) | 37 (35.9%) |
| Bachelor's Degree or higher | 72 (85.7%) | 12 (14.3%) |
Occupancy by Age of Householder in Westcliffe
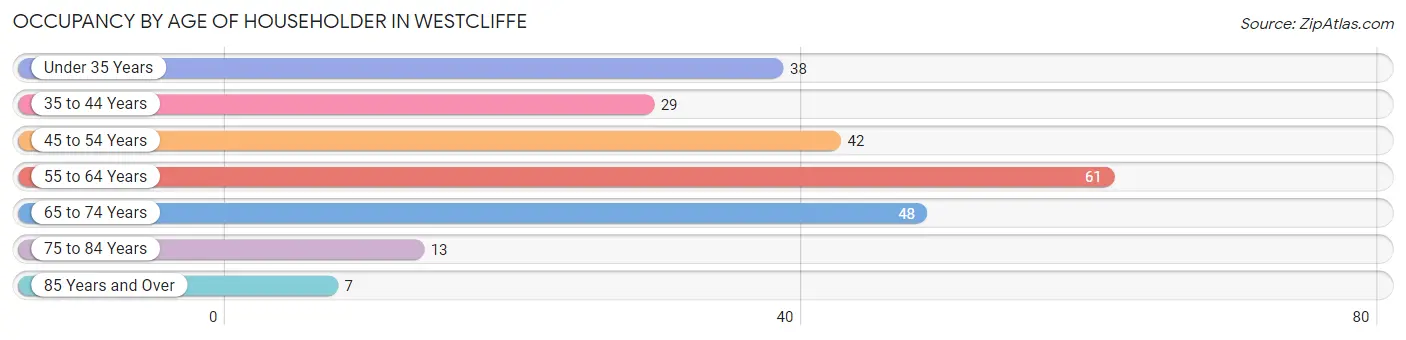
| Age Bracket | # Households | % Households |
| Under 35 Years | 38 | 16.0% |
| 35 to 44 Years | 29 | 12.2% |
| 45 to 54 Years | 42 | 17.6% |
| 55 to 64 Years | 61 | 25.6% |
| 65 to 74 Years | 48 | 20.2% |
| 75 to 84 Years | 13 | 5.5% |
| 85 Years and Over | 7 | 2.9% |
| Total | 238 | 100.0% |
Housing Finances in Westcliffe
Median Income by Occupancy in Westcliffe
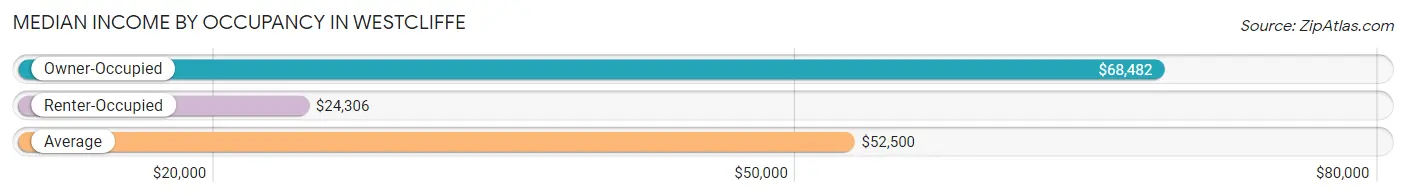
| Occupancy Type | # Households | Median Income |
| Owner-Occupied | 175 (73.5%) | $68,482 |
| Renter-Occupied | 63 (26.5%) | $24,306 |
| Average | 238 (100.0%) | $52,500 |
Occupancy by Householder Income Bracket in Westcliffe
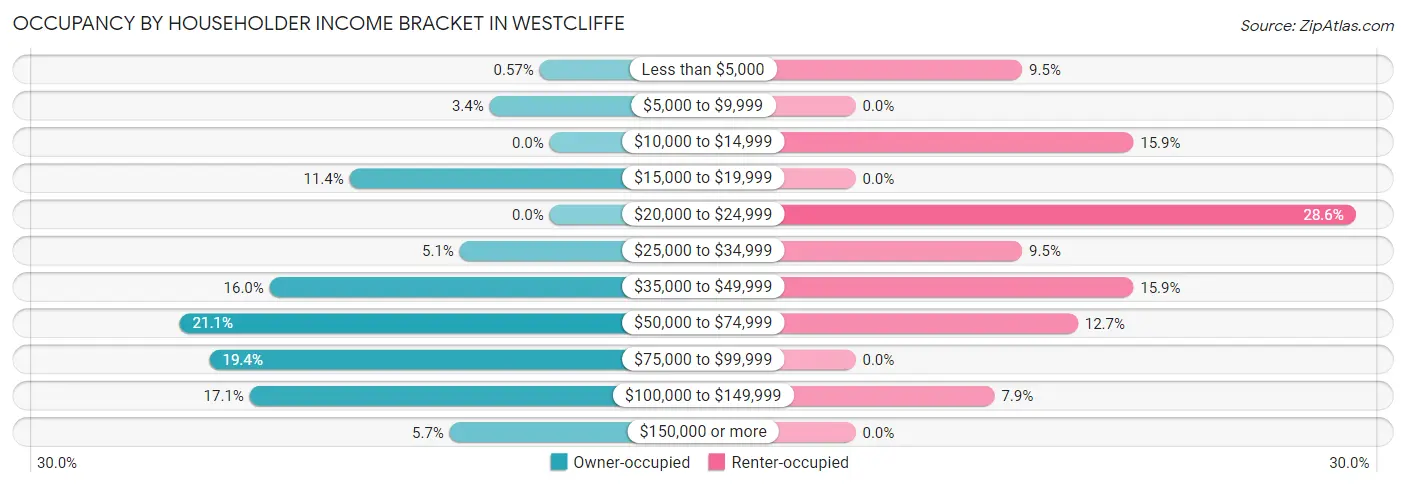
| Income Bracket | Owner-occupied | Renter-occupied |
| Less than $5,000 | 1 (0.6%) | 6 (9.5%) |
| $5,000 to $9,999 | 6 (3.4%) | 0 (0.0%) |
| $10,000 to $14,999 | 0 (0.0%) | 10 (15.9%) |
| $15,000 to $19,999 | 20 (11.4%) | 0 (0.0%) |
| $20,000 to $24,999 | 0 (0.0%) | 18 (28.6%) |
| $25,000 to $34,999 | 9 (5.1%) | 6 (9.5%) |
| $35,000 to $49,999 | 28 (16.0%) | 10 (15.9%) |
| $50,000 to $74,999 | 37 (21.1%) | 8 (12.7%) |
| $75,000 to $99,999 | 34 (19.4%) | 0 (0.0%) |
| $100,000 to $149,999 | 30 (17.1%) | 5 (7.9%) |
| $150,000 or more | 10 (5.7%) | 0 (0.0%) |
| Total | 175 (100.0%) | 63 (100.0%) |
Monthly Housing Cost Tiers in Westcliffe
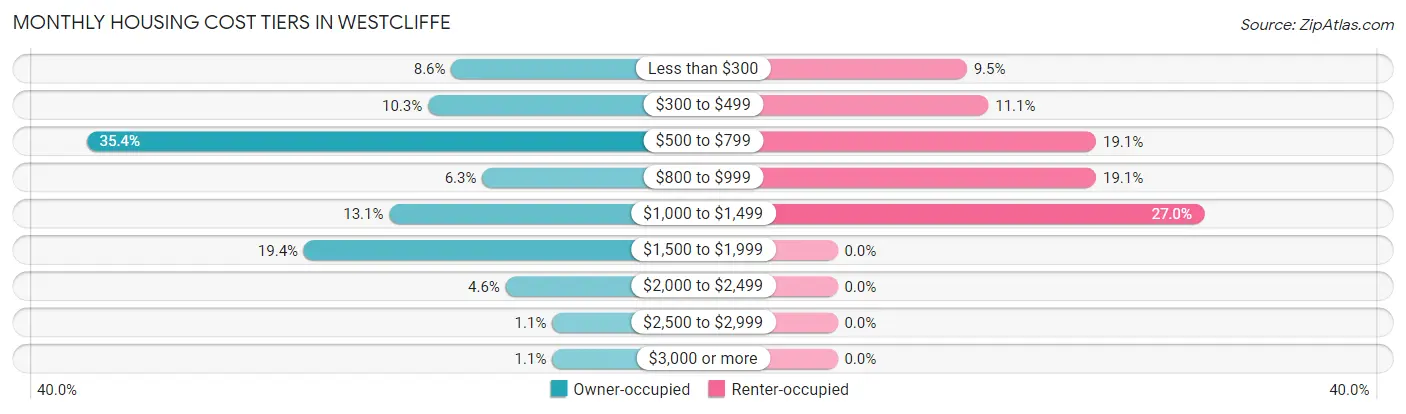
| Monthly Cost | Owner-occupied | Renter-occupied |
| Less than $300 | 15 (8.6%) | 6 (9.5%) |
| $300 to $499 | 18 (10.3%) | 7 (11.1%) |
| $500 to $799 | 62 (35.4%) | 12 (19.1%) |
| $800 to $999 | 11 (6.3%) | 12 (19.1%) |
| $1,000 to $1,499 | 23 (13.1%) | 17 (27.0%) |
| $1,500 to $1,999 | 34 (19.4%) | 0 (0.0%) |
| $2,000 to $2,499 | 8 (4.6%) | 0 (0.0%) |
| $2,500 to $2,999 | 2 (1.1%) | 0 (0.0%) |
| $3,000 or more | 2 (1.1%) | 0 (0.0%) |
| Total | 175 (100.0%) | 63 (100.0%) |
Physical Housing Characteristics in Westcliffe
Housing Structures in Westcliffe
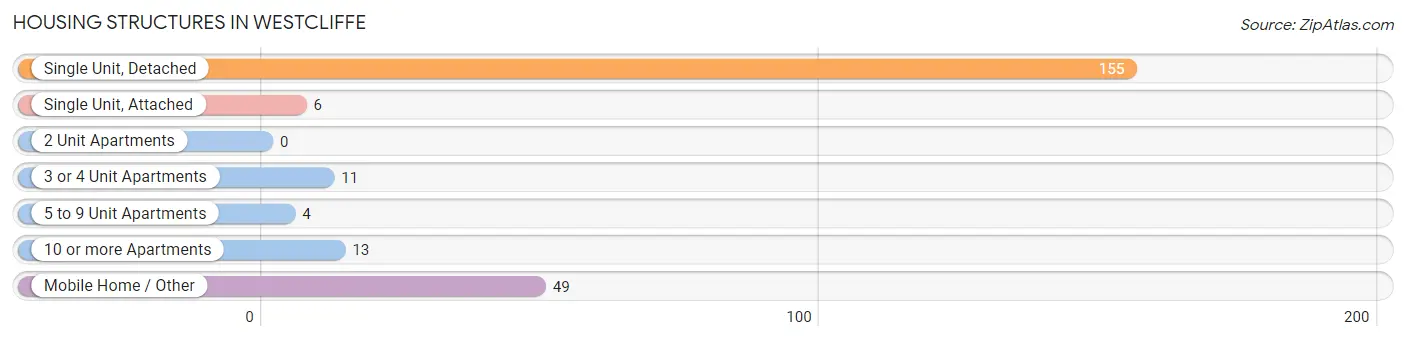
| Structure Type | # Housing Units | % Housing Units |
| Single Unit, Detached | 155 | 65.1% |
| Single Unit, Attached | 6 | 2.5% |
| 2 Unit Apartments | 0 | 0.0% |
| 3 or 4 Unit Apartments | 11 | 4.6% |
| 5 to 9 Unit Apartments | 4 | 1.7% |
| 10 or more Apartments | 13 | 5.5% |
| Mobile Home / Other | 49 | 20.6% |
| Total | 238 | 100.0% |
Housing Structures by Occupancy in Westcliffe
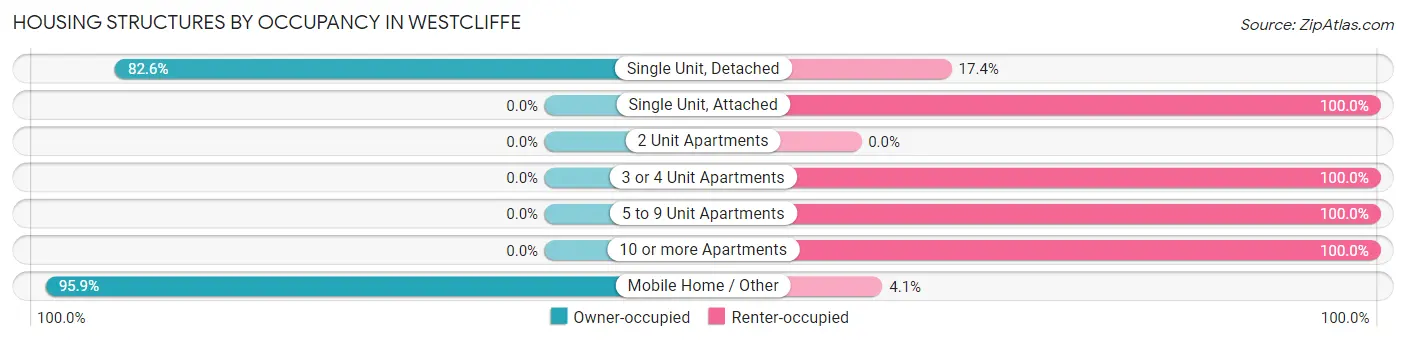
| Structure Type | Owner-occupied | Renter-occupied |
| Single Unit, Detached | 128 (82.6%) | 27 (17.4%) |
| Single Unit, Attached | 0 (0.0%) | 6 (100.0%) |
| 2 Unit Apartments | 0 (0.0%) | 0 (0.0%) |
| 3 or 4 Unit Apartments | 0 (0.0%) | 11 (100.0%) |
| 5 to 9 Unit Apartments | 0 (0.0%) | 4 (100.0%) |
| 10 or more Apartments | 0 (0.0%) | 13 (100.0%) |
| Mobile Home / Other | 47 (95.9%) | 2 (4.1%) |
| Total | 175 (73.5%) | 63 (26.5%) |
Housing Structures by Number of Rooms in Westcliffe
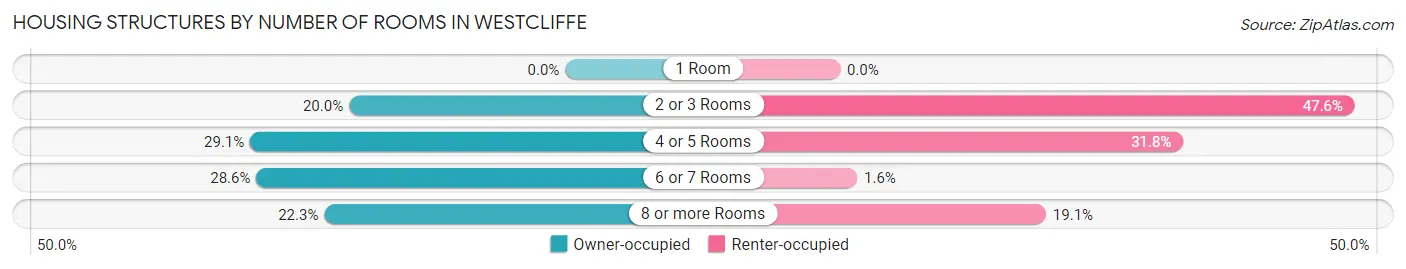
| Number of Rooms | Owner-occupied | Renter-occupied |
| 1 Room | 0 (0.0%) | 0 (0.0%) |
| 2 or 3 Rooms | 35 (20.0%) | 30 (47.6%) |
| 4 or 5 Rooms | 51 (29.1%) | 20 (31.8%) |
| 6 or 7 Rooms | 50 (28.6%) | 1 (1.6%) |
| 8 or more Rooms | 39 (22.3%) | 12 (19.1%) |
| Total | 175 (100.0%) | 63 (100.0%) |
Housing Structure by Heating Type in Westcliffe
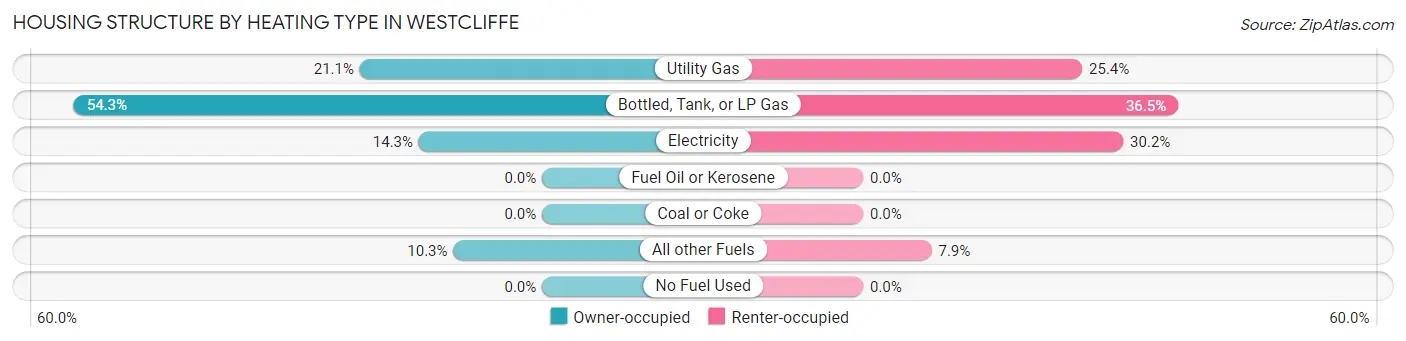
| Heating Type | Owner-occupied | Renter-occupied |
| Utility Gas | 37 (21.1%) | 16 (25.4%) |
| Bottled, Tank, or LP Gas | 95 (54.3%) | 23 (36.5%) |
| Electricity | 25 (14.3%) | 19 (30.2%) |
| Fuel Oil or Kerosene | 0 (0.0%) | 0 (0.0%) |
| Coal or Coke | 0 (0.0%) | 0 (0.0%) |
| All other Fuels | 18 (10.3%) | 5 (7.9%) |
| No Fuel Used | 0 (0.0%) | 0 (0.0%) |
| Total | 175 (100.0%) | 63 (100.0%) |
Household Vehicle Usage in Westcliffe
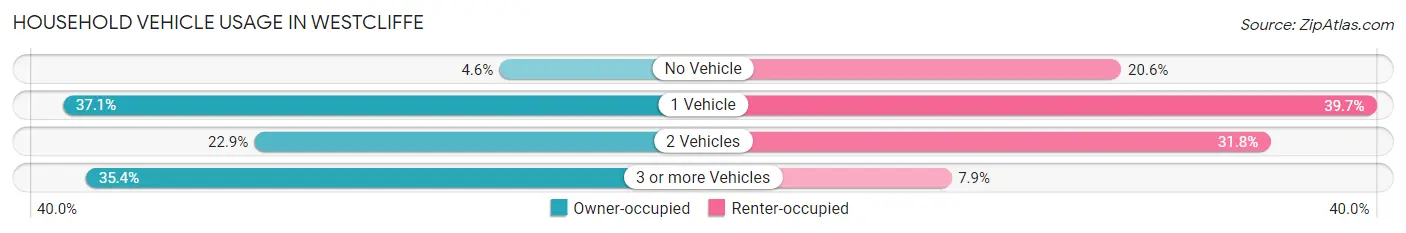
| Vehicles per Household | Owner-occupied | Renter-occupied |
| No Vehicle | 8 (4.6%) | 13 (20.6%) |
| 1 Vehicle | 65 (37.1%) | 25 (39.7%) |
| 2 Vehicles | 40 (22.9%) | 20 (31.8%) |
| 3 or more Vehicles | 62 (35.4%) | 5 (7.9%) |
| Total | 175 (100.0%) | 63 (100.0%) |
Real Estate & Mortgages in Westcliffe
Real Estate and Mortgage Overview in Westcliffe
| Characteristic | Without Mortgage | With Mortgage |
| Housing Units | 108 | 67 |
| Median Property Value | $293,800 | $326,000 |
| Median Household Income | $50,000 | $2 |
| Monthly Housing Costs | $557 | $2 |
| Real Estate Taxes | $950 | $2 |
Property Value by Mortgage Status in Westcliffe
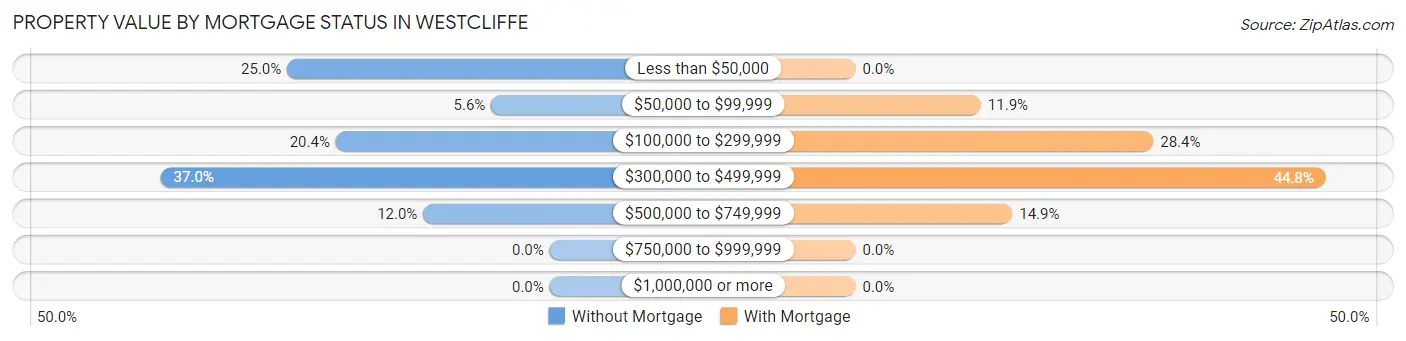
| Property Value | Without Mortgage | With Mortgage |
| Less than $50,000 | 27 (25.0%) | 0 (0.0%) |
| $50,000 to $99,999 | 6 (5.6%) | 8 (11.9%) |
| $100,000 to $299,999 | 22 (20.4%) | 19 (28.4%) |
| $300,000 to $499,999 | 40 (37.0%) | 30 (44.8%) |
| $500,000 to $749,999 | 13 (12.0%) | 10 (14.9%) |
| $750,000 to $999,999 | 0 (0.0%) | 0 (0.0%) |
| $1,000,000 or more | 0 (0.0%) | 0 (0.0%) |
| Total | 108 (100.0%) | 67 (100.0%) |
Household Income by Mortgage Status in Westcliffe
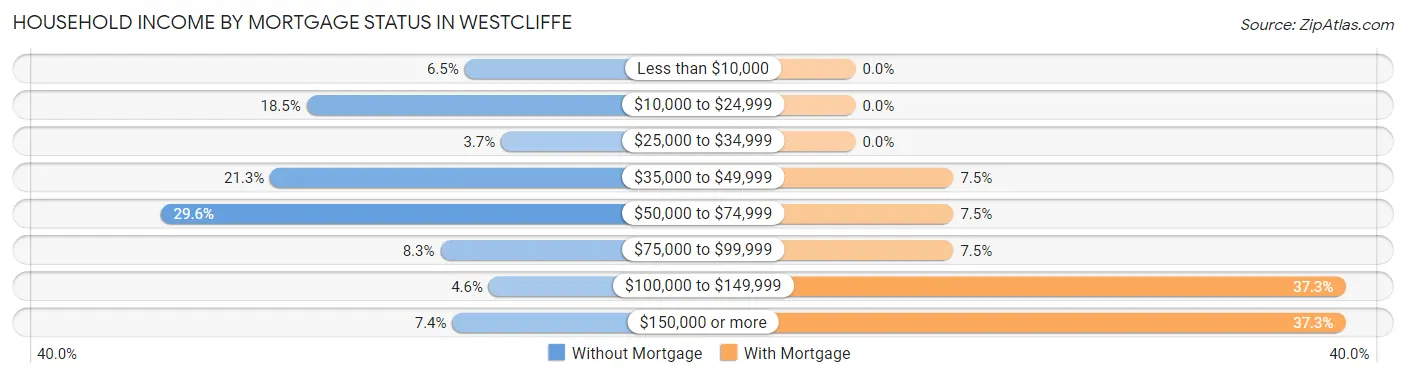
| Household Income | Without Mortgage | With Mortgage |
| Less than $10,000 | 7 (6.5%) | 0 (0.0%) |
| $10,000 to $24,999 | 20 (18.5%) | 0 (0.0%) |
| $25,000 to $34,999 | 4 (3.7%) | 0 (0.0%) |
| $35,000 to $49,999 | 23 (21.3%) | 5 (7.5%) |
| $50,000 to $74,999 | 32 (29.6%) | 5 (7.5%) |
| $75,000 to $99,999 | 9 (8.3%) | 5 (7.5%) |
| $100,000 to $149,999 | 5 (4.6%) | 25 (37.3%) |
| $150,000 or more | 8 (7.4%) | 25 (37.3%) |
| Total | 108 (100.0%) | 67 (100.0%) |
Property Value to Household Income Ratio in Westcliffe
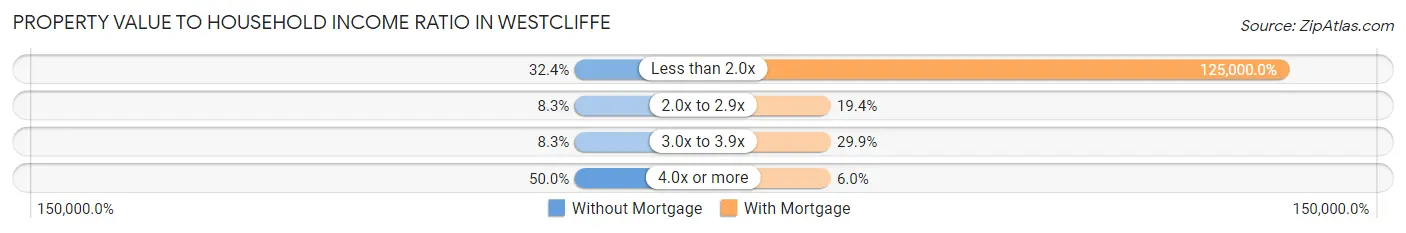
| Value-to-Income Ratio | Without Mortgage | With Mortgage |
| Less than 2.0x | 35 (32.4%) | 83,750 (125,000.0%) |
| 2.0x to 2.9x | 9 (8.3%) | 13 (19.4%) |
| 3.0x to 3.9x | 9 (8.3%) | 20 (29.8%) |
| 4.0x or more | 54 (50.0%) | 4 (6.0%) |
| Total | 108 (100.0%) | 67 (100.0%) |
Real Estate Taxes by Mortgage Status in Westcliffe
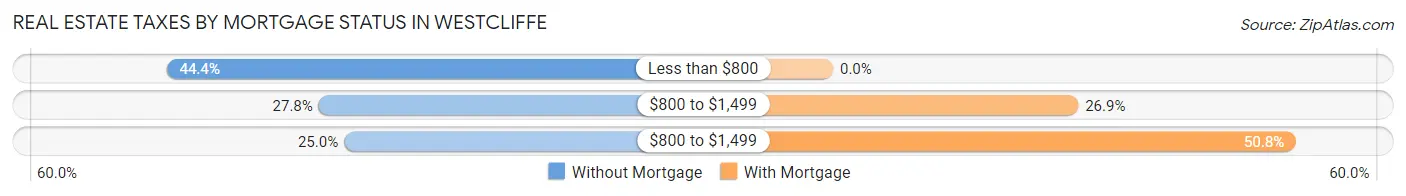
| Property Taxes | Without Mortgage | With Mortgage |
| Less than $800 | 48 (44.4%) | 0 (0.0%) |
| $800 to $1,499 | 30 (27.8%) | 18 (26.9%) |
| $800 to $1,499 | 27 (25.0%) | 34 (50.7%) |
| Total | 108 (100.0%) | 67 (100.0%) |
Health & Disability in Westcliffe
Health Insurance Coverage by Age in Westcliffe
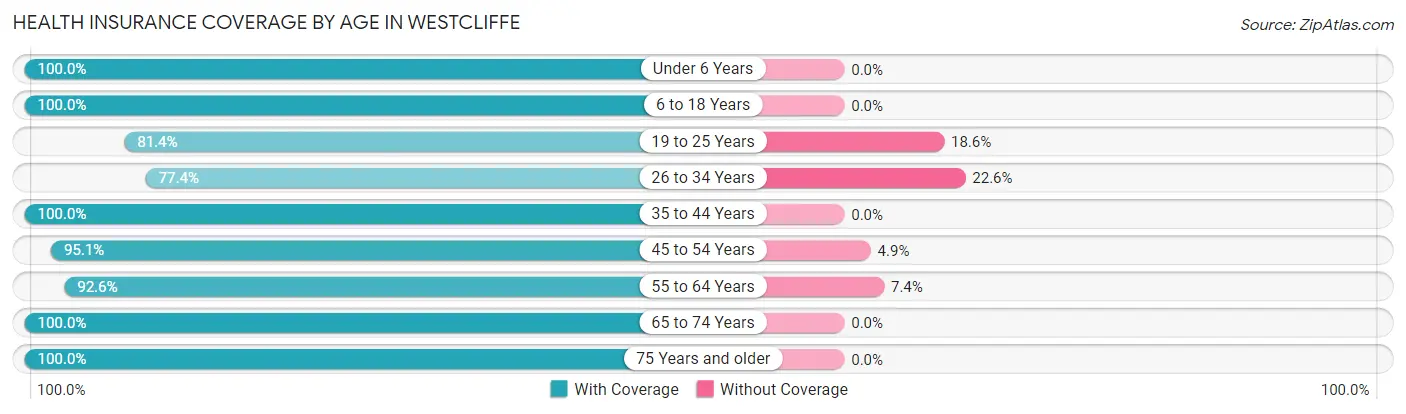
| Age Bracket | With Coverage | Without Coverage |
| Under 6 Years | 11 (100.0%) | 0 (0.0%) |
| 6 to 18 Years | 68 (100.0%) | 0 (0.0%) |
| 19 to 25 Years | 35 (81.4%) | 8 (18.6%) |
| 26 to 34 Years | 24 (77.4%) | 7 (22.6%) |
| 35 to 44 Years | 51 (100.0%) | 0 (0.0%) |
| 45 to 54 Years | 58 (95.1%) | 3 (4.9%) |
| 55 to 64 Years | 75 (92.6%) | 6 (7.4%) |
| 65 to 74 Years | 64 (100.0%) | 0 (0.0%) |
| 75 Years and older | 24 (100.0%) | 0 (0.0%) |
| Total | 410 (94.5%) | 24 (5.5%) |
Health Insurance Coverage by Citizenship Status in Westcliffe
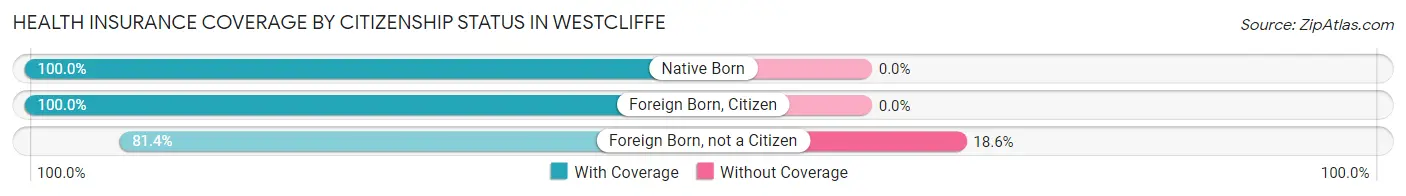
| Citizenship Status | With Coverage | Without Coverage |
| Native Born | 11 (100.0%) | 0 (0.0%) |
| Foreign Born, Citizen | 68 (100.0%) | 0 (0.0%) |
| Foreign Born, not a Citizen | 35 (81.4%) | 8 (18.6%) |
Health Insurance Coverage by Household Income in Westcliffe
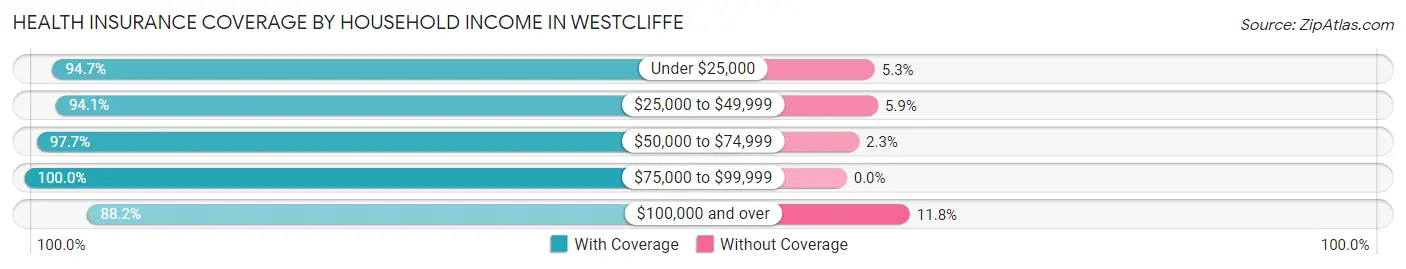
| Household Income | With Coverage | Without Coverage |
| Under $25,000 | 72 (94.7%) | 4 (5.3%) |
| $25,000 to $49,999 | 80 (94.1%) | 5 (5.9%) |
| $50,000 to $74,999 | 85 (97.7%) | 2 (2.3%) |
| $75,000 to $99,999 | 76 (100.0%) | 0 (0.0%) |
| $100,000 and over | 97 (88.2%) | 13 (11.8%) |
Public vs Private Health Insurance Coverage by Age in Westcliffe
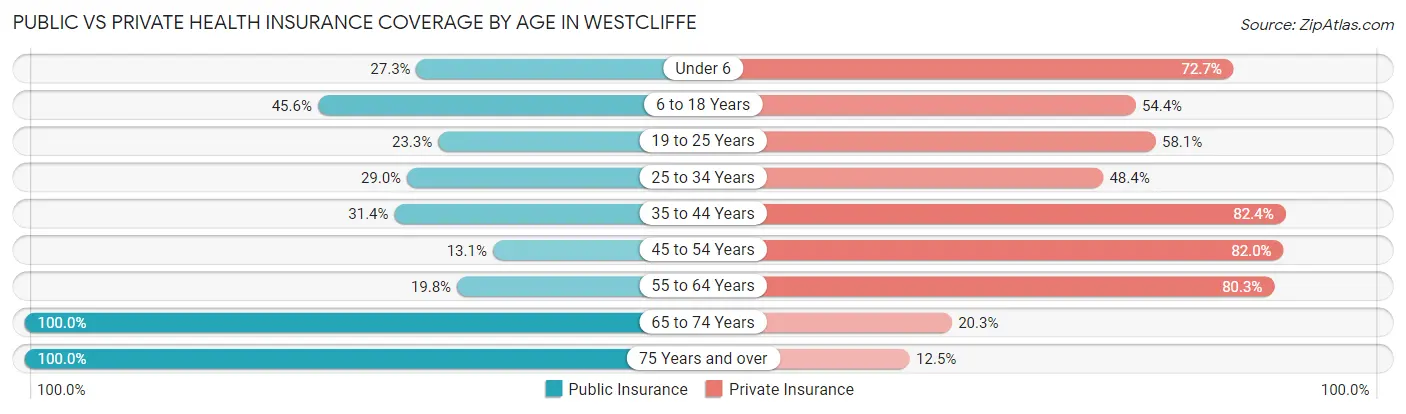
| Age Bracket | Public Insurance | Private Insurance |
| Under 6 | 3 (27.3%) | 8 (72.7%) |
| 6 to 18 Years | 31 (45.6%) | 37 (54.4%) |
| 19 to 25 Years | 10 (23.3%) | 25 (58.1%) |
| 25 to 34 Years | 9 (29.0%) | 15 (48.4%) |
| 35 to 44 Years | 16 (31.4%) | 42 (82.4%) |
| 45 to 54 Years | 8 (13.1%) | 50 (82.0%) |
| 55 to 64 Years | 16 (19.8%) | 65 (80.2%) |
| 65 to 74 Years | 64 (100.0%) | 13 (20.3%) |
| 75 Years and over | 24 (100.0%) | 3 (12.5%) |
| Total | 181 (41.7%) | 258 (59.5%) |
Disability Status by Sex by Age in Westcliffe
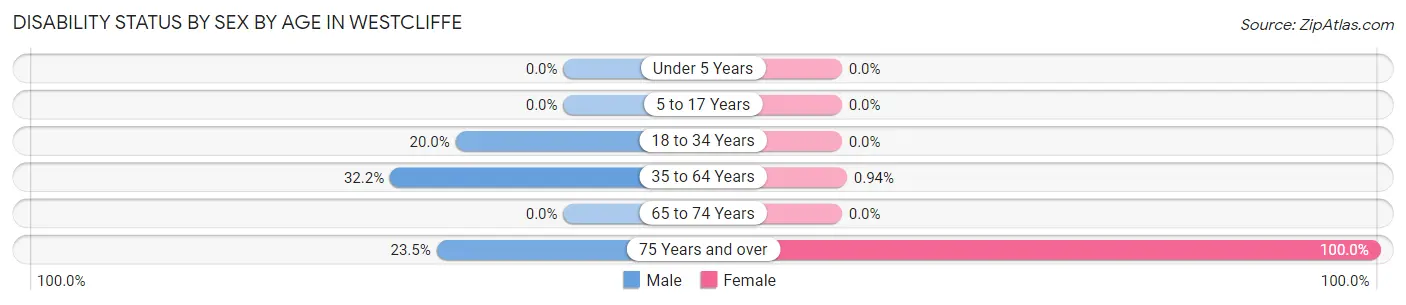
| Age Bracket | Male | Female |
| Under 5 Years | 0 (0.0%) | 0 (0.0%) |
| 5 to 17 Years | 0 (0.0%) | 0 (0.0%) |
| 18 to 34 Years | 5 (20.0%) | 0 (0.0%) |
| 35 to 64 Years | 28 (32.2%) | 1 (0.9%) |
| 65 to 74 Years | 0 (0.0%) | 0 (0.0%) |
| 75 Years and over | 4 (23.5%) | 7 (100.0%) |
Disability Class by Sex by Age in Westcliffe
Disability Class: Hearing Difficulty
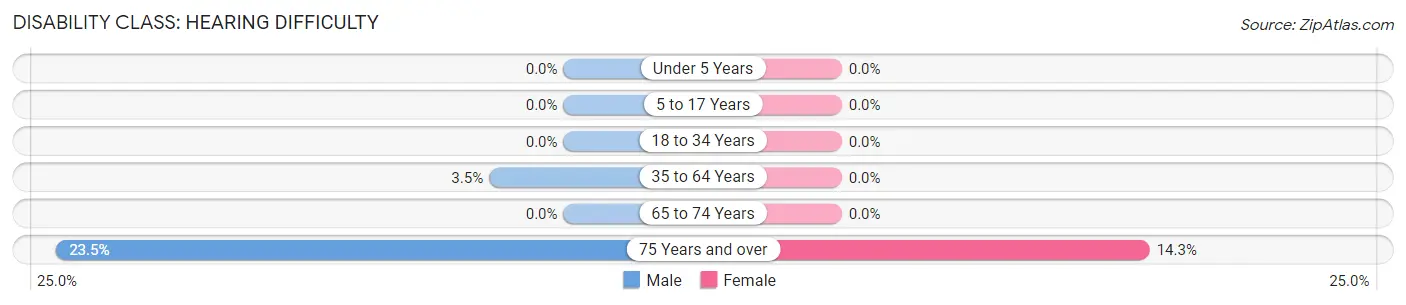
| Age Bracket | Male | Female |
| Under 5 Years | 0 (0.0%) | 0 (0.0%) |
| 5 to 17 Years | 0 (0.0%) | 0 (0.0%) |
| 18 to 34 Years | 0 (0.0%) | 0 (0.0%) |
| 35 to 64 Years | 3 (3.5%) | 0 (0.0%) |
| 65 to 74 Years | 0 (0.0%) | 0 (0.0%) |
| 75 Years and over | 4 (23.5%) | 1 (14.3%) |
Disability Class: Vision Difficulty
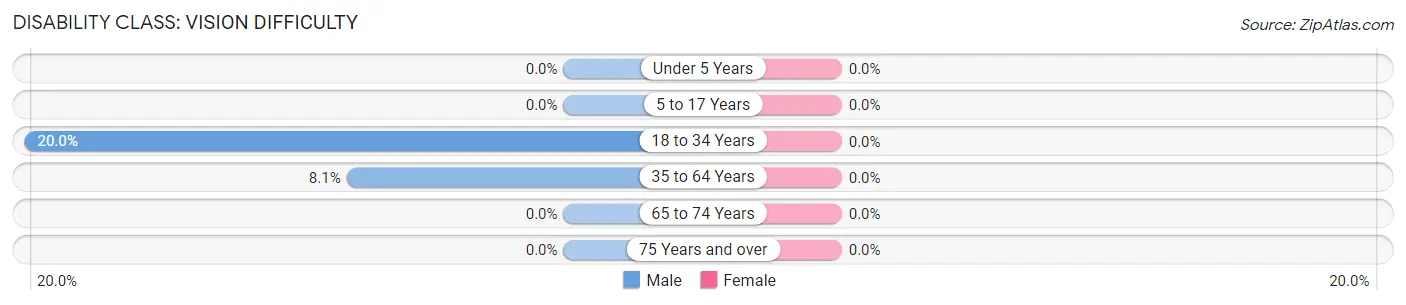
| Age Bracket | Male | Female |
| Under 5 Years | 0 (0.0%) | 0 (0.0%) |
| 5 to 17 Years | 0 (0.0%) | 0 (0.0%) |
| 18 to 34 Years | 5 (20.0%) | 0 (0.0%) |
| 35 to 64 Years | 7 (8.1%) | 0 (0.0%) |
| 65 to 74 Years | 0 (0.0%) | 0 (0.0%) |
| 75 Years and over | 0 (0.0%) | 0 (0.0%) |
Disability Class: Cognitive Difficulty
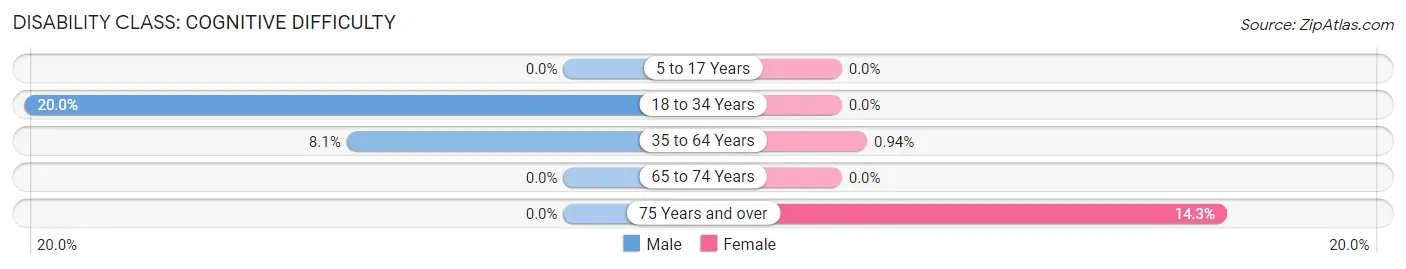
| Age Bracket | Male | Female |
| 5 to 17 Years | 0 (0.0%) | 0 (0.0%) |
| 18 to 34 Years | 5 (20.0%) | 0 (0.0%) |
| 35 to 64 Years | 7 (8.1%) | 1 (0.9%) |
| 65 to 74 Years | 0 (0.0%) | 0 (0.0%) |
| 75 Years and over | 0 (0.0%) | 1 (14.3%) |
Disability Class: Ambulatory Difficulty
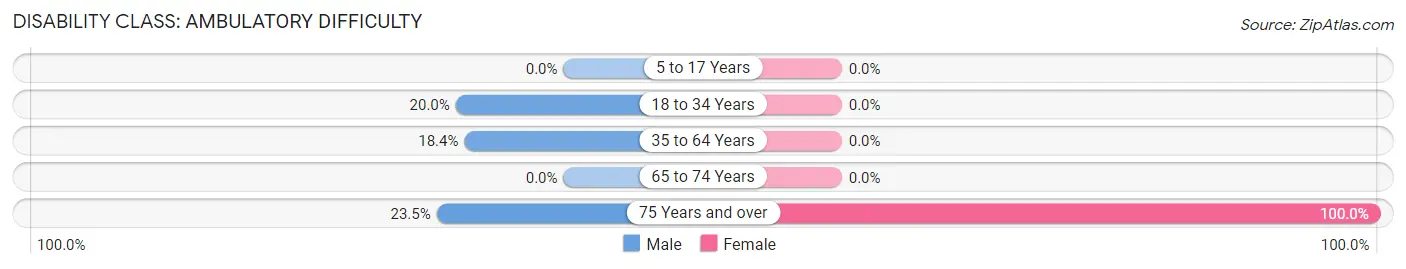
| Age Bracket | Male | Female |
| 5 to 17 Years | 0 (0.0%) | 0 (0.0%) |
| 18 to 34 Years | 5 (20.0%) | 0 (0.0%) |
| 35 to 64 Years | 16 (18.4%) | 0 (0.0%) |
| 65 to 74 Years | 0 (0.0%) | 0 (0.0%) |
| 75 Years and over | 4 (23.5%) | 7 (100.0%) |
Disability Class: Self-Care Difficulty
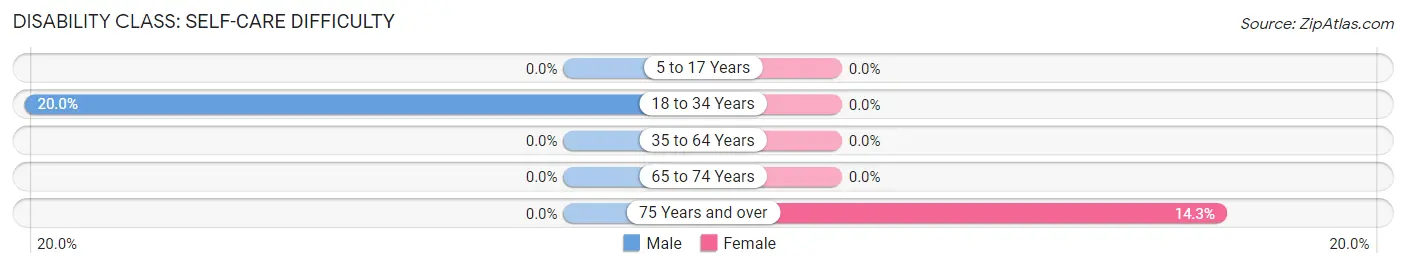
| Age Bracket | Male | Female |
| 5 to 17 Years | 0 (0.0%) | 0 (0.0%) |
| 18 to 34 Years | 5 (20.0%) | 0 (0.0%) |
| 35 to 64 Years | 0 (0.0%) | 0 (0.0%) |
| 65 to 74 Years | 0 (0.0%) | 0 (0.0%) |
| 75 Years and over | 0 (0.0%) | 1 (14.3%) |
Technology Access in Westcliffe
Computing Device Access in Westcliffe
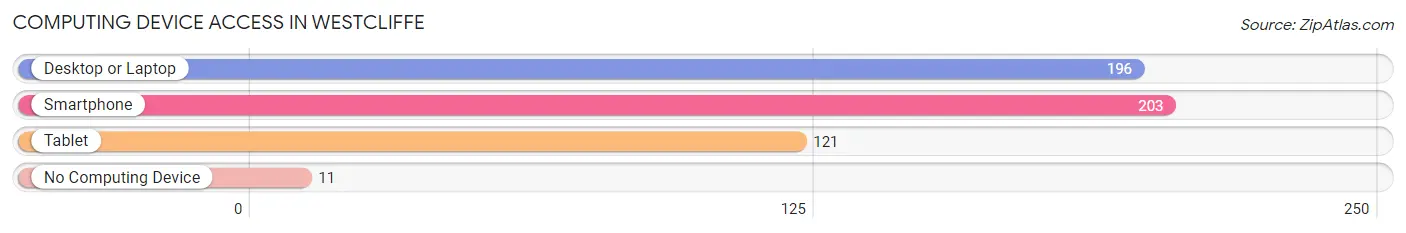
| Device Type | # Households | % Households |
| Desktop or Laptop | 196 | 82.4% |
| Smartphone | 203 | 85.3% |
| Tablet | 121 | 50.8% |
| No Computing Device | 11 | 4.6% |
| Total | 238 | 100.0% |
Internet Access in Westcliffe
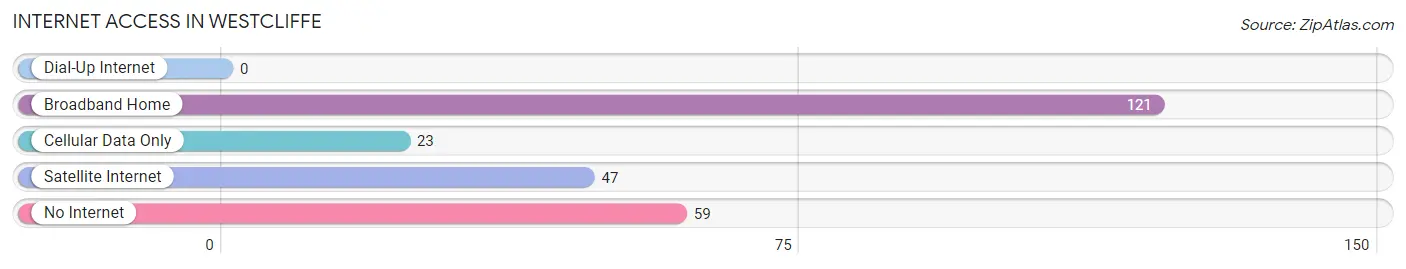
| Internet Type | # Households | % Households |
| Dial-Up Internet | 0 | 0.0% |
| Broadband Home | 121 | 50.8% |
| Cellular Data Only | 23 | 9.7% |
| Satellite Internet | 47 | 19.8% |
| No Internet | 59 | 24.8% |
| Total | 238 | 100.0% |
Westcliffe Summary
History
Westcliffe, Colorado is a small town located in Custer County, in the Wet Mountain Valley of the Rocky Mountains. The town was founded in 1878 by a group of settlers from the nearby town of Silver Cliff. The settlers were looking for a place to settle and start a new life, and they found it in Westcliffe. The town was named after the nearby Westcliffe Mountain, which was named after the nearby Westcliffe Creek.
The town of Westcliffe was originally a mining town, and the first mine was opened in 1879. The mine was called the Westcliffe Mine, and it produced silver, lead, and zinc. The mine was a success, and it helped to bring prosperity to the town. The town also had a number of other businesses, including a hotel, a general store, a saloon, and a blacksmith shop.
In the early 1900s, the town began to experience a decline in its mining industry. This was due to the fact that the ore in the mines was becoming depleted, and the cost of mining was becoming too expensive. As a result, many of the miners left the town in search of other opportunities.
In the 1920s, the town began to experience a resurgence in its economy. This was due to the fact that the town was becoming a popular tourist destination. The town was located in a beautiful mountain valley, and it was close to many of the popular ski resorts in the area. As a result, the town began to attract more visitors, and the economy began to improve.
In the 1950s, the town experienced another decline in its economy. This was due to the fact that the nearby ski resorts were becoming more popular, and the town was no longer able to compete with them. As a result, many of the businesses in the town closed down, and the population began to decline.
In the 1970s, the town began to experience a resurgence in its economy. This was due to the fact that the town was becoming a popular destination for outdoor activities, such as camping, fishing, and hiking. As a result, the town began to attract more visitors, and the economy began to improve.
Geography
Westcliffe is located in the Wet Mountain Valley of the Rocky Mountains in Custer County, Colorado. The town is situated at an elevation of 8,000 feet, and it is surrounded by the Sangre de Cristo Mountains to the east and the Wet Mountains to the west. The town is located on the banks of the Arkansas River, and it is close to the towns of Silver Cliff and Westcliffe.
The town of Westcliffe is located in a semi-arid climate, and it experiences hot summers and cold winters. The average temperature in the summer is around 70 degrees Fahrenheit, and the average temperature in the winter is around 20 degrees Fahrenheit. The town receives an average of 16 inches of precipitation per year, and it is known for its sunny days and clear skies.
Economy
The economy of Westcliffe is largely based on tourism. The town is a popular destination for outdoor activities, such as camping, fishing, and hiking. The town also has a number of restaurants, shops, and other businesses that cater to tourists.
In addition to tourism, the town also has a number of businesses that are involved in the mining industry. The town is located near several mines, and these mines produce silver, lead, and zinc. The town also has a number of businesses that are involved in the timber industry, as the town is located near several forests.
Demographics
As of the 2010 census, the town of Westcliffe had a population of 545 people. The town has a median age of 44.7 years, and the median household income is $41,250. The town is predominantly white, with 95.3% of the population being white. The town also has a small Hispanic population, with 4.7% of the population being Hispanic.
Common Questions
What is Per Capita Income in Westcliffe?
Per Capita income in Westcliffe is $49,433.
What is the Median Family Income in Westcliffe?
Median Family Income in Westcliffe is $72,250.
What is the Median Household income in Westcliffe?
Median Household Income in Westcliffe is $52,500.
What is Income or Wage Gap in Westcliffe?
Income or Wage Gap in Westcliffe is 13.4%.
Women in Westcliffe earn 86.6 cents for every dollar earned by a man.
What is Inequality or Gini Index in Westcliffe?
Inequality or Gini Index in Westcliffe is 0.58.
What is the Total Population of Westcliffe?
Total Population of Westcliffe is 443.
What is the Total Male Population of Westcliffe?
Total Male Population of Westcliffe is 212.
What is the Total Female Population of Westcliffe?
Total Female Population of Westcliffe is 231.
What is the Ratio of Males per 100 Females in Westcliffe?
There are 91.77 Males per 100 Females in Westcliffe.
What is the Ratio of Females per 100 Males in Westcliffe?
There are 108.96 Females per 100 Males in Westcliffe.
What is the Median Population Age in Westcliffe?
Median Population Age in Westcliffe is 47.4 Years.
What is the Average Family Size in Westcliffe
Average Family Size in Westcliffe is 2.8 People.
What is the Average Household Size in Westcliffe
Average Household Size in Westcliffe is 1.8 People.
How Large is the Labor Force in Westcliffe?
There are 237 People in the Labor Forcein in Westcliffe.
What is the Percentage of People in the Labor Force in Westcliffe?
63.9% of People are in the Labor Force in Westcliffe.
What is the Unemployment Rate in Westcliffe?
Unemployment Rate in Westcliffe is 6.8%.