Springfield, CO Map & Demographics
Springfield Map
Springfield Overview
$26,127
PER CAPITA INCOME
$60,455
AVG FAMILY INCOME
$36,354
AVG HOUSEHOLD INCOME
2.5%
WAGE / INCOME GAP [ % ]
97.5¢/ $1
WAGE / INCOME GAP [ $ ]
$8,126
FAMILY INCOME DEFICIT
0.50
INEQUALITY / GINI INDEX
1,357
TOTAL POPULATION
684
MALE POPULATION
673
FEMALE POPULATION
101.63
MALES / 100 FEMALES
98.39
FEMALES / 100 MALES
43.4
MEDIAN AGE
2.9
AVG FAMILY SIZE
2.1
AVG HOUSEHOLD SIZE
568
LABOR FORCE [ PEOPLE ]
53.3%
PERCENT IN LABOR FORCE
2.3%
UNEMPLOYMENT RATE
Springfield Zip Codes
Springfield Area Codes
Income in Springfield
Income Overview in Springfield
Per Capita Income in Springfield is $26,127, while median incomes of families and households are $60,455 and $36,354 respectively.
| Characteristic | Number | Measure |
| Per Capita Income | 1,357 | $26,127 |
| Median Family Income | 326 | $60,455 |
| Mean Family Income | 326 | $82,659 |
| Median Household Income | 623 | $36,354 |
| Mean Household Income | 623 | $57,226 |
| Income Deficit | 326 | $8,126 |
| Wage / Income Gap (%) | 1,357 | 2.49% |
| Wage / Income Gap ($) | 1,357 | 97.51¢ per $1 |
| Gini / Inequality Index | 1,357 | 0.50 |
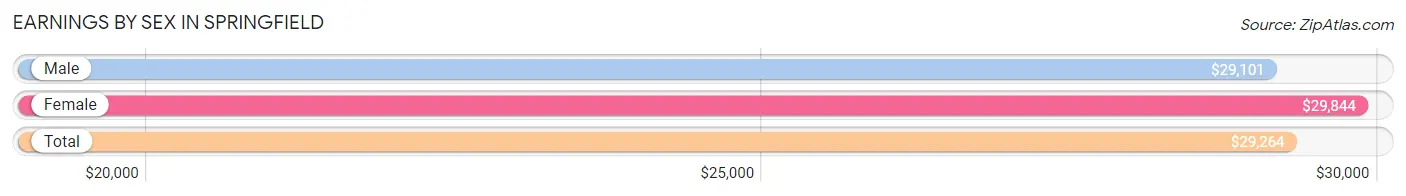
Earnings by Sex in Springfield
Average Earnings in Springfield are $29,264, $29,101 for men and $29,844 for women, a difference of 2.5%.
| Sex | Number | Average Earnings |
| Male | 365 (59.5%) | $29,101 |
| Female | 248 (40.5%) | $29,844 |
| Total | 613 (100.0%) | $29,264 |
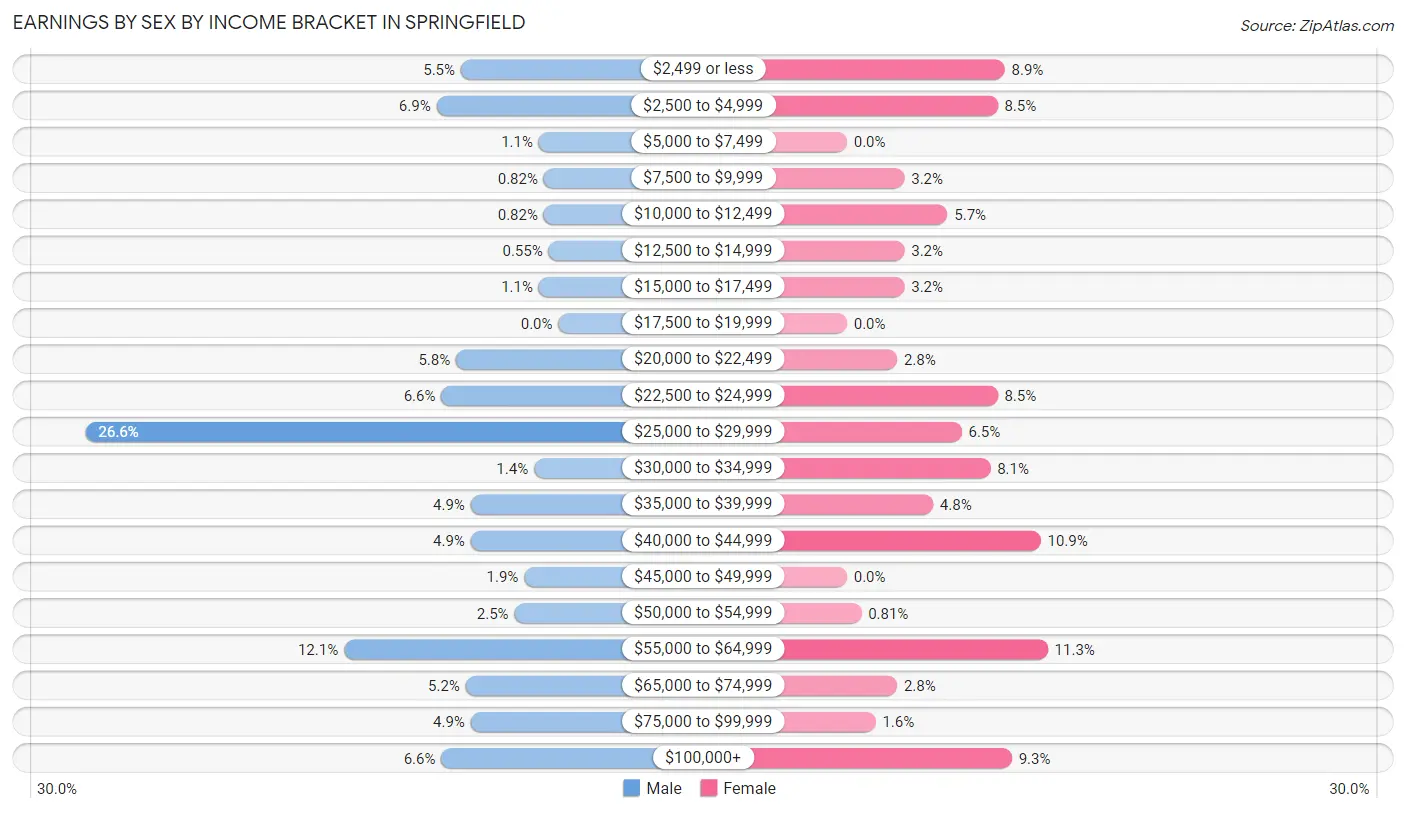
Earnings by Sex by Income Bracket in Springfield
The most common earnings brackets in Springfield are $25,000 to $29,999 for men (97 | 26.6%) and $55,000 to $64,999 for women (28 | 11.3%).
| Income | Male | Female |
| $2,499 or less | 20 (5.5%) | 22 (8.9%) |
| $2,500 to $4,999 | 25 (6.9%) | 21 (8.5%) |
| $5,000 to $7,499 | 4 (1.1%) | 0 (0.0%) |
| $7,500 to $9,999 | 3 (0.8%) | 8 (3.2%) |
| $10,000 to $12,499 | 3 (0.8%) | 14 (5.7%) |
| $12,500 to $14,999 | 2 (0.5%) | 8 (3.2%) |
| $15,000 to $17,499 | 4 (1.1%) | 8 (3.2%) |
| $17,500 to $19,999 | 0 (0.0%) | 0 (0.0%) |
| $20,000 to $22,499 | 21 (5.8%) | 7 (2.8%) |
| $22,500 to $24,999 | 24 (6.6%) | 21 (8.5%) |
| $25,000 to $29,999 | 97 (26.6%) | 16 (6.5%) |
| $30,000 to $34,999 | 5 (1.4%) | 20 (8.1%) |
| $35,000 to $39,999 | 18 (4.9%) | 12 (4.8%) |
| $40,000 to $44,999 | 18 (4.9%) | 27 (10.9%) |
| $45,000 to $49,999 | 7 (1.9%) | 0 (0.0%) |
| $50,000 to $54,999 | 9 (2.5%) | 2 (0.8%) |
| $55,000 to $64,999 | 44 (12.0%) | 28 (11.3%) |
| $65,000 to $74,999 | 19 (5.2%) | 7 (2.8%) |
| $75,000 to $99,999 | 18 (4.9%) | 4 (1.6%) |
| $100,000+ | 24 (6.6%) | 23 (9.3%) |
| Total | 365 (100.0%) | 248 (100.0%) |
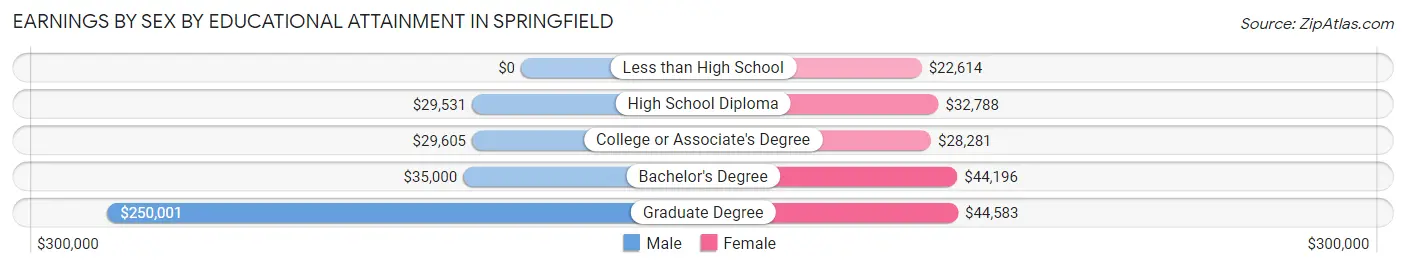
Earnings by Sex by Educational Attainment in Springfield
Average earnings in Springfield are $29,167 for men and $32,500 for women, a difference of 10.3%. Men with an educational attainment of graduate degree enjoy the highest average annual earnings of $250,001, while those with high school diploma education earn the least with $29,531. Women with an educational attainment of graduate degree earn the most with the average annual earnings of $44,583, while those with less than high school education have the smallest earnings of $22,614.
| Educational Attainment | Male Income | Female Income |
| Less than High School | - | - |
| High School Diploma | $29,531 | $32,788 |
| College or Associate's Degree | $29,605 | $28,281 |
| Bachelor's Degree | $35,000 | $44,196 |
| Graduate Degree | $250,001 | $44,583 |
| Total | $29,167 | $32,500 |
Family Income in Springfield
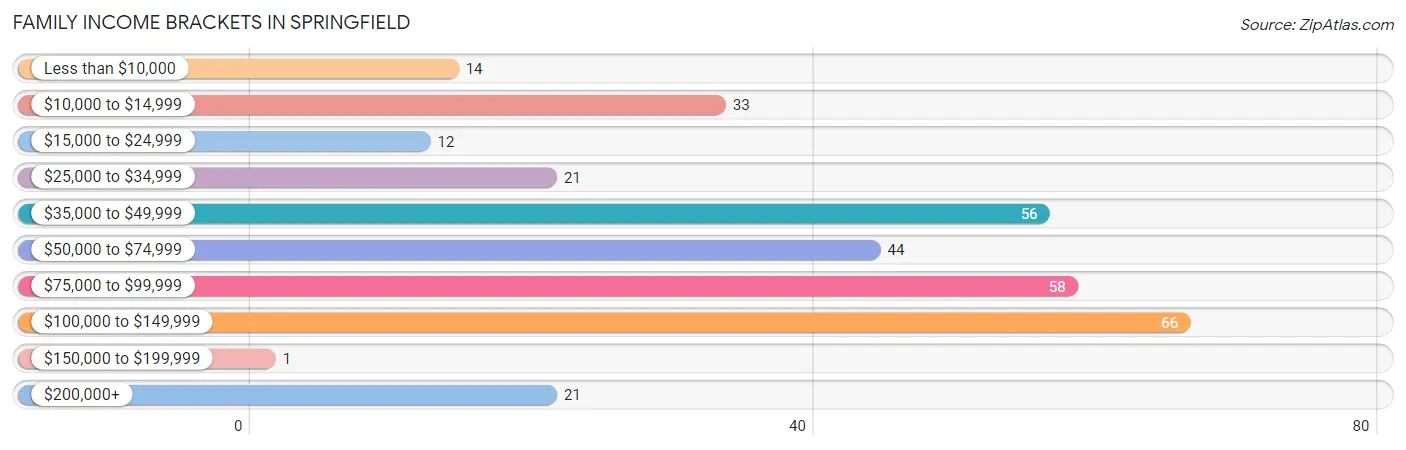
Family Income Brackets in Springfield
According to the Springfield family income data, there are 66 families falling into the $100,000 to $149,999 income range, which is the most common income bracket and makes up 20.3% of all families. Conversely, the $150,000 to $199,999 income bracket is the least frequent group with only 1 families (0.3%) belonging to this category.
| Income Bracket | # Families | % Families |
| Less than $10,000 | 14 | 4.3% |
| $10,000 to $14,999 | 33 | 10.1% |
| $15,000 to $24,999 | 12 | 3.7% |
| $25,000 to $34,999 | 21 | 6.4% |
| $35,000 to $49,999 | 56 | 17.2% |
| $50,000 to $74,999 | 44 | 13.5% |
| $75,000 to $99,999 | 58 | 17.8% |
| $100,000 to $149,999 | 66 | 20.2% |
| $150,000 to $199,999 | 1 | 0.3% |
| $200,000+ | 21 | 6.4% |
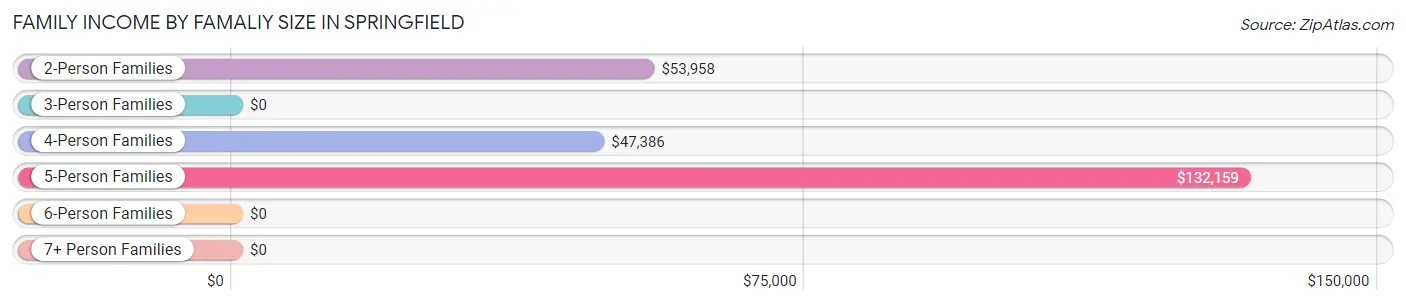
Family Income by Famaliy Size in Springfield
5-person families (35 | 10.7%) account for the highest median family income in Springfield with $132,159 per family, while 2-person families (163 | 50.0%) have the highest median income of $26,979 per family member.
| Income Bracket | # Families | Median Income |
| 2-Person Families | 163 (50.0%) | $53,958 |
| 3-Person Families | 77 (23.6%) | $0 |
| 4-Person Families | 37 (11.4%) | $47,386 |
| 5-Person Families | 35 (10.7%) | $132,159 |
| 6-Person Families | 14 (4.3%) | $0 |
| 7+ Person Families | 0 (0.0%) | $0 |
| Total | 326 (100.0%) | $60,455 |
Family Income by Number of Earners in Springfield
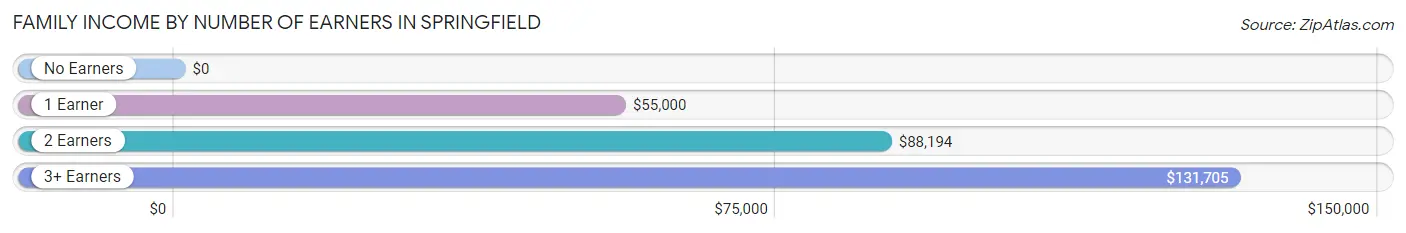
| Number of Earners | # Families | Median Income |
| No Earners | 66 (20.3%) | $0 |
| 1 Earner | 110 (33.7%) | $55,000 |
| 2 Earners | 129 (39.6%) | $88,194 |
| 3+ Earners | 21 (6.4%) | $131,705 |
| Total | 326 (100.0%) | $60,455 |
Household Income in Springfield
Household Income Brackets in Springfield
With 104 households falling in the category, the $25,000 to $34,999 income range is the most frequent in Springfield, accounting for 16.7% of all households. In contrast, only 5 households (0.8%) fall into the $150,000 to $199,999 income bracket, making it the least populous group.
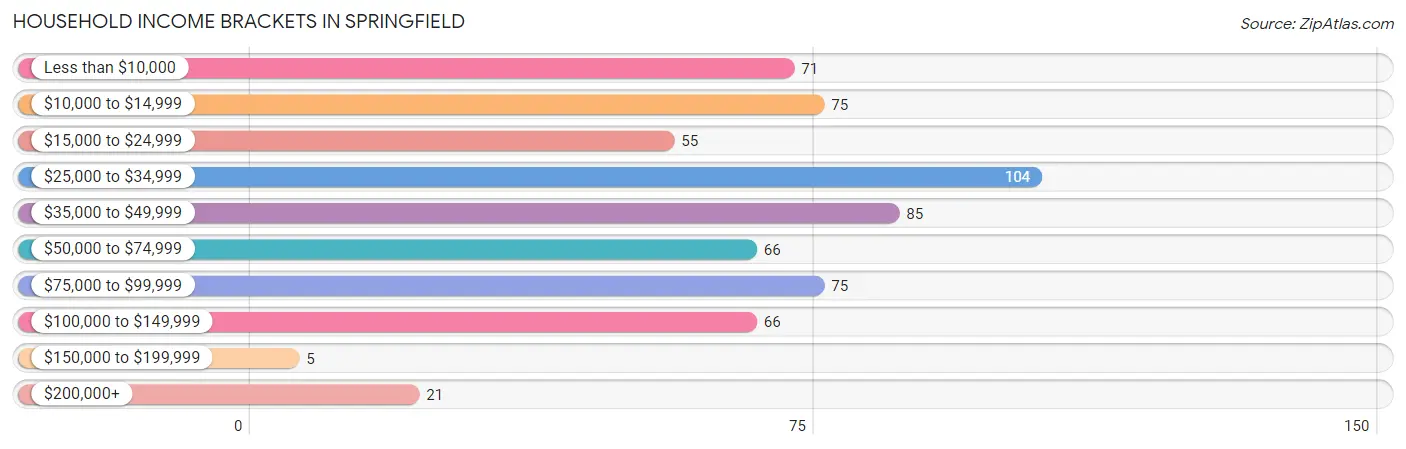
| Income Bracket | # Households | % Households |
| Less than $10,000 | 71 | 11.4% |
| $10,000 to $14,999 | 75 | 12.0% |
| $15,000 to $24,999 | 55 | 8.8% |
| $25,000 to $34,999 | 104 | 16.7% |
| $35,000 to $49,999 | 85 | 13.6% |
| $50,000 to $74,999 | 66 | 10.6% |
| $75,000 to $99,999 | 75 | 12.0% |
| $100,000 to $149,999 | 66 | 10.6% |
| $150,000 to $199,999 | 5 | 0.8% |
| $200,000+ | 21 | 3.4% |
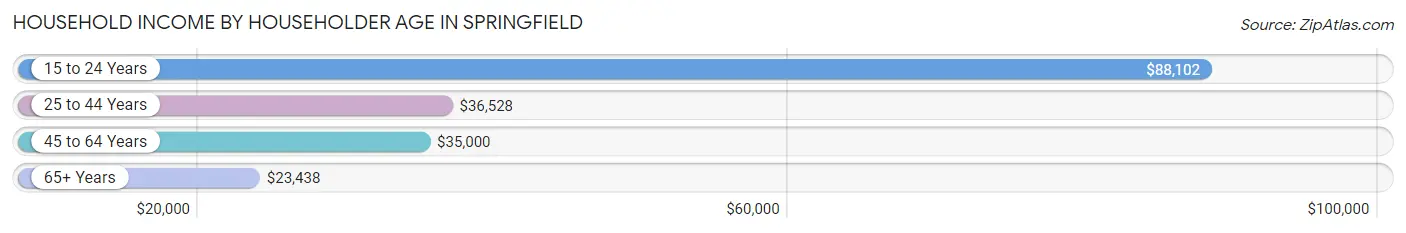
Household Income by Householder Age in Springfield
The median household income in Springfield is $36,354, with the highest median household income of $88,102 found in the 15 to 24 years age bracket for the primary householder. A total of 41 households (6.6%) fall into this category. Meanwhile, the 65+ years age bracket for the primary householder has the lowest median household income of $23,438, with 211 households (33.9%) in this group.
| Income Bracket | # Households | Median Income |
| 15 to 24 Years | 41 (6.6%) | $88,102 |
| 25 to 44 Years | 203 (32.6%) | $36,528 |
| 45 to 64 Years | 168 (27.0%) | $35,000 |
| 65+ Years | 211 (33.9%) | $23,438 |
| Total | 623 (100.0%) | $36,354 |
Poverty in Springfield
Income Below Poverty by Sex and Age in Springfield
With 10.1% poverty level for males and 24.3% for females among the residents of Springfield, 65 to 74 year old males and 15 year old females are the most vulnerable to poverty, with 26 males (48.1%) and 2 females (100.0%) in their respective age groups living below the poverty level.
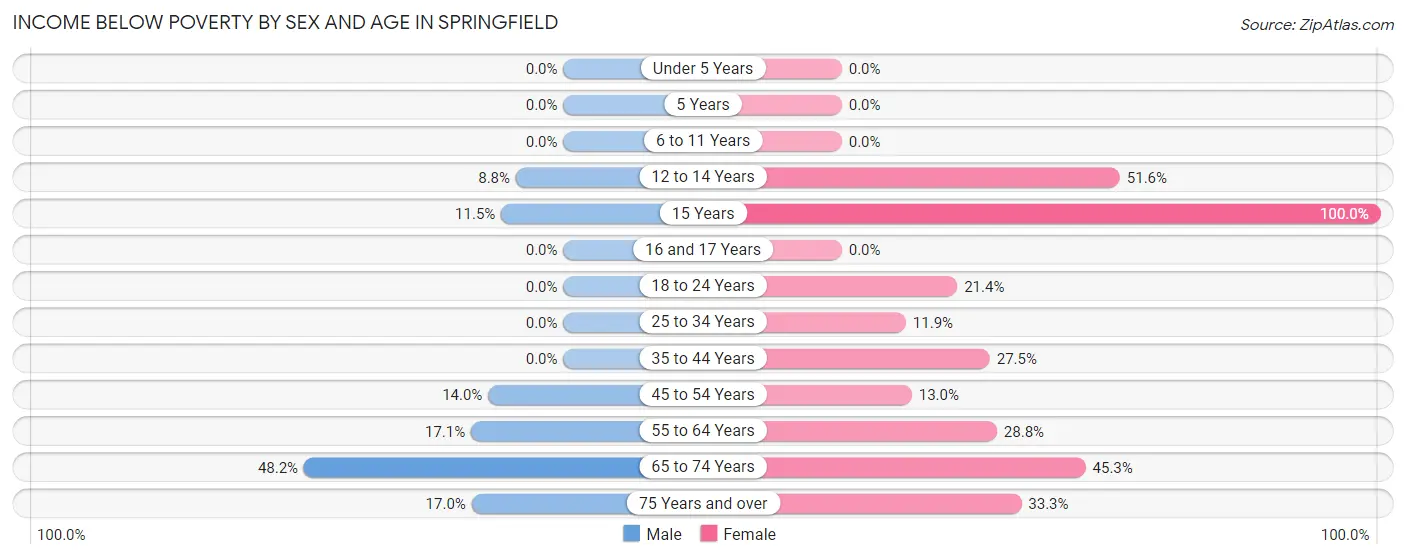
| Age Bracket | Male | Female |
| Under 5 Years | 0 (0.0%) | 0 (0.0%) |
| 5 Years | 0 (0.0%) | 0 (0.0%) |
| 6 to 11 Years | 0 (0.0%) | 0 (0.0%) |
| 12 to 14 Years | 3 (8.8%) | 16 (51.6%) |
| 15 Years | 3 (11.5%) | 2 (100.0%) |
| 16 and 17 Years | 0 (0.0%) | 0 (0.0%) |
| 18 to 24 Years | 0 (0.0%) | 6 (21.4%) |
| 25 to 34 Years | 0 (0.0%) | 5 (11.9%) |
| 35 to 44 Years | 0 (0.0%) | 25 (27.5%) |
| 45 to 54 Years | 12 (14.0%) | 10 (13.0%) |
| 55 to 64 Years | 12 (17.1%) | 19 (28.8%) |
| 65 to 74 Years | 26 (48.1%) | 43 (45.3%) |
| 75 Years and over | 8 (17.0%) | 32 (33.3%) |
| Total | 64 (10.1%) | 158 (24.3%) |
Income Above Poverty by Sex and Age in Springfield
According to the poverty statistics in Springfield, males aged under 5 years and females aged under 5 years are the age groups that are most secure financially, with 100.0% of males and 100.0% of females in these age groups living above the poverty line.
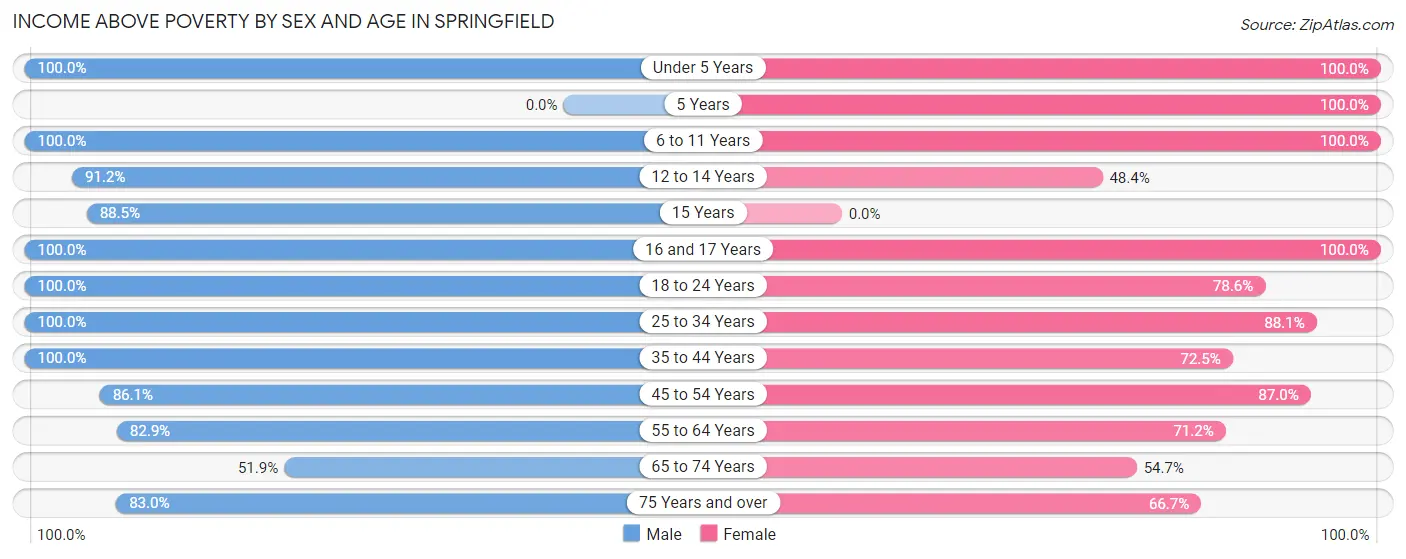
| Age Bracket | Male | Female |
| Under 5 Years | 36 (100.0%) | 32 (100.0%) |
| 5 Years | 0 (0.0%) | 14 (100.0%) |
| 6 to 11 Years | 44 (100.0%) | 72 (100.0%) |
| 12 to 14 Years | 31 (91.2%) | 15 (48.4%) |
| 15 Years | 23 (88.5%) | 0 (0.0%) |
| 16 and 17 Years | 7 (100.0%) | 3 (100.0%) |
| 18 to 24 Years | 66 (100.0%) | 22 (78.6%) |
| 25 to 34 Years | 86 (100.0%) | 37 (88.1%) |
| 35 to 44 Years | 81 (100.0%) | 66 (72.5%) |
| 45 to 54 Years | 74 (86.1%) | 67 (87.0%) |
| 55 to 64 Years | 58 (82.9%) | 47 (71.2%) |
| 65 to 74 Years | 28 (51.8%) | 52 (54.7%) |
| 75 Years and over | 39 (83.0%) | 64 (66.7%) |
| Total | 573 (89.9%) | 491 (75.6%) |
Income Below Poverty Among Married-Couple Families in Springfield
The poverty statistics for married-couple families in Springfield show that 12.0% or 28 of the total 234 families live below the poverty line. Families with no children have the highest poverty rate of 16.4%, comprising of 19 families. On the other hand, families with 3 or 4 children have the lowest poverty rate of 0.0%, which includes 0 families.
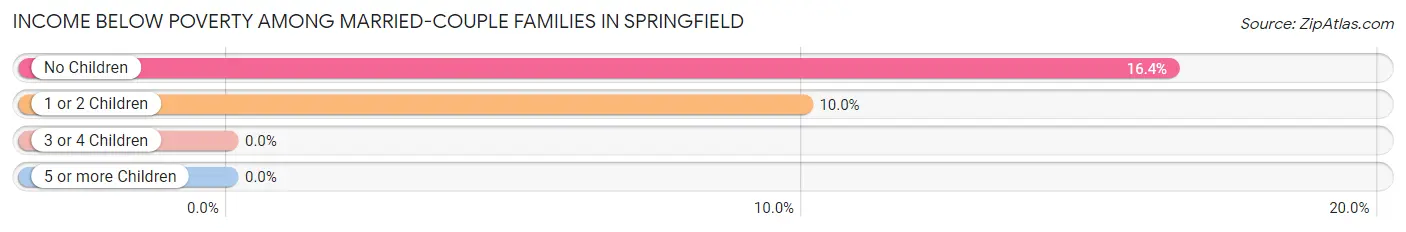
| Children | Above Poverty | Below Poverty |
| No Children | 97 (83.6%) | 19 (16.4%) |
| 1 or 2 Children | 81 (90.0%) | 9 (10.0%) |
| 3 or 4 Children | 28 (100.0%) | 0 (0.0%) |
| 5 or more Children | 0 (0.0%) | 0 (0.0%) |
| Total | 206 (88.0%) | 28 (12.0%) |
Income Below Poverty Among Single-Parent Households in Springfield
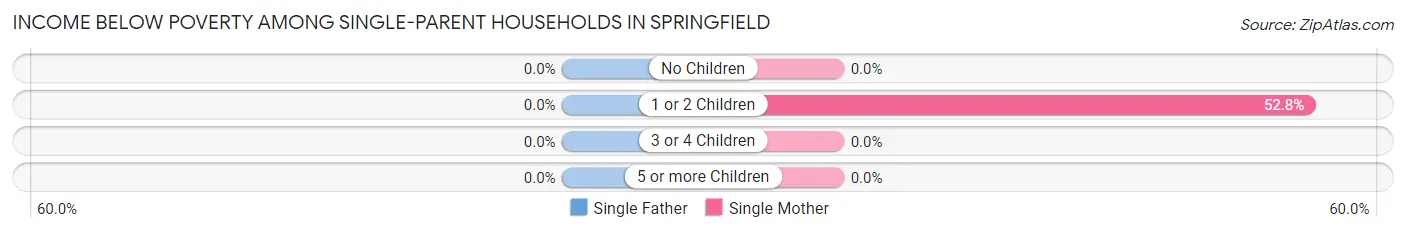
| Children | Single Father | Single Mother |
| No Children | 0 (0.0%) | 0 (0.0%) |
| 1 or 2 Children | 0 (0.0%) | 19 (52.8%) |
| 3 or 4 Children | 0 (0.0%) | 0 (0.0%) |
| 5 or more Children | 0 (0.0%) | 0 (0.0%) |
| Total | 0 (0.0%) | 19 (40.4%) |
Income Below Poverty Among Married-Couple vs Single-Parent Households in Springfield
The poverty data for Springfield shows that 28 of the married-couple family households (12.0%) and 19 of the single-parent households (20.6%) are living below the poverty level. Within the married-couple family households, those with no children have the highest poverty rate, with 19 households (16.4%) falling below the poverty line. Among the single-parent households, those with 1 or 2 children have the highest poverty rate, with 19 household (37.2%) living below poverty.
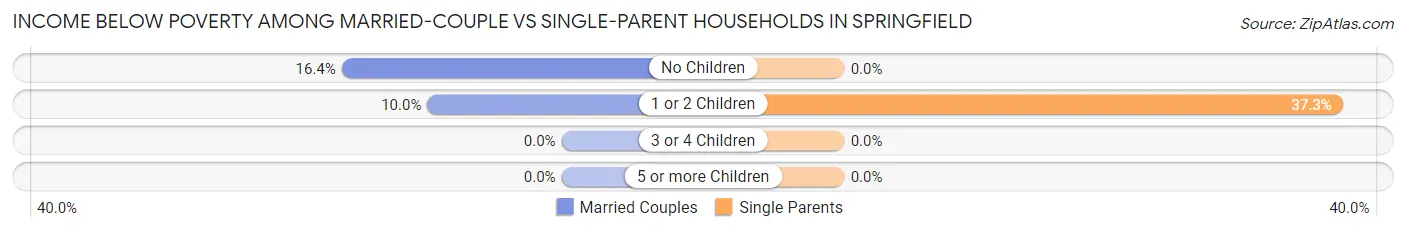
| Children | Married-Couple Families | Single-Parent Households |
| No Children | 19 (16.4%) | 0 (0.0%) |
| 1 or 2 Children | 9 (10.0%) | 19 (37.2%) |
| 3 or 4 Children | 0 (0.0%) | 0 (0.0%) |
| 5 or more Children | 0 (0.0%) | 0 (0.0%) |
| Total | 28 (12.0%) | 19 (20.6%) |
Race in Springfield
The most populous races in Springfield are White / Caucasian (1,219 | 89.8%), Hispanic or Latino (159 | 11.7%), and Asian (50 | 3.7%).
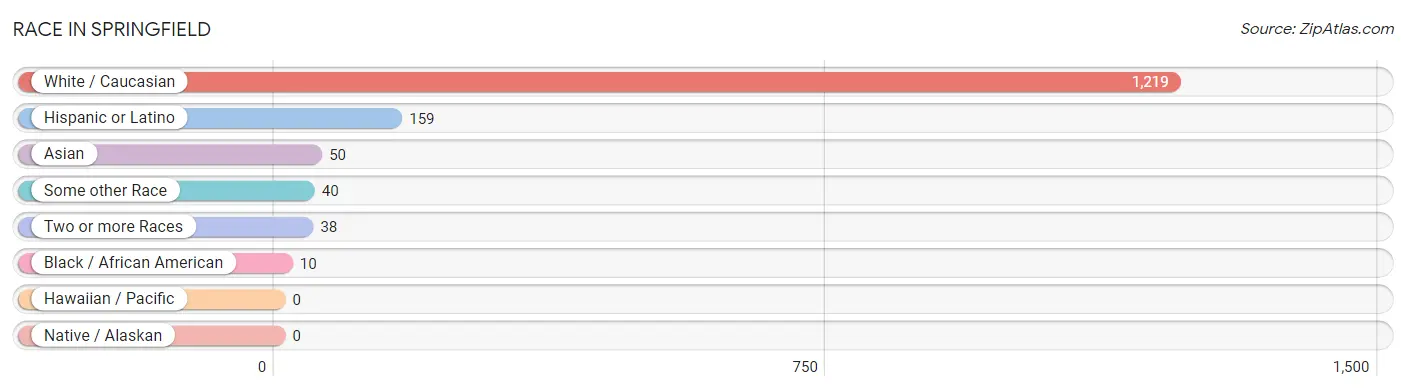
| Race | # Population | % Population |
| Asian | 50 | 3.7% |
| Black / African American | 10 | 0.7% |
| Hawaiian / Pacific | 0 | 0.0% |
| Hispanic or Latino | 159 | 11.7% |
| Native / Alaskan | 0 | 0.0% |
| White / Caucasian | 1,219 | 89.8% |
| Two or more Races | 38 | 2.8% |
| Some other Race | 40 | 2.9% |
| Total | 1,357 | 100.0% |
Ancestry in Springfield
The most populous ancestries reported in Springfield are Irish (195 | 14.4%), German (171 | 12.6%), Mexican (156 | 11.5%), English (109 | 8.0%), and American (64 | 4.7%), together accounting for 51.2% of all Springfield residents.
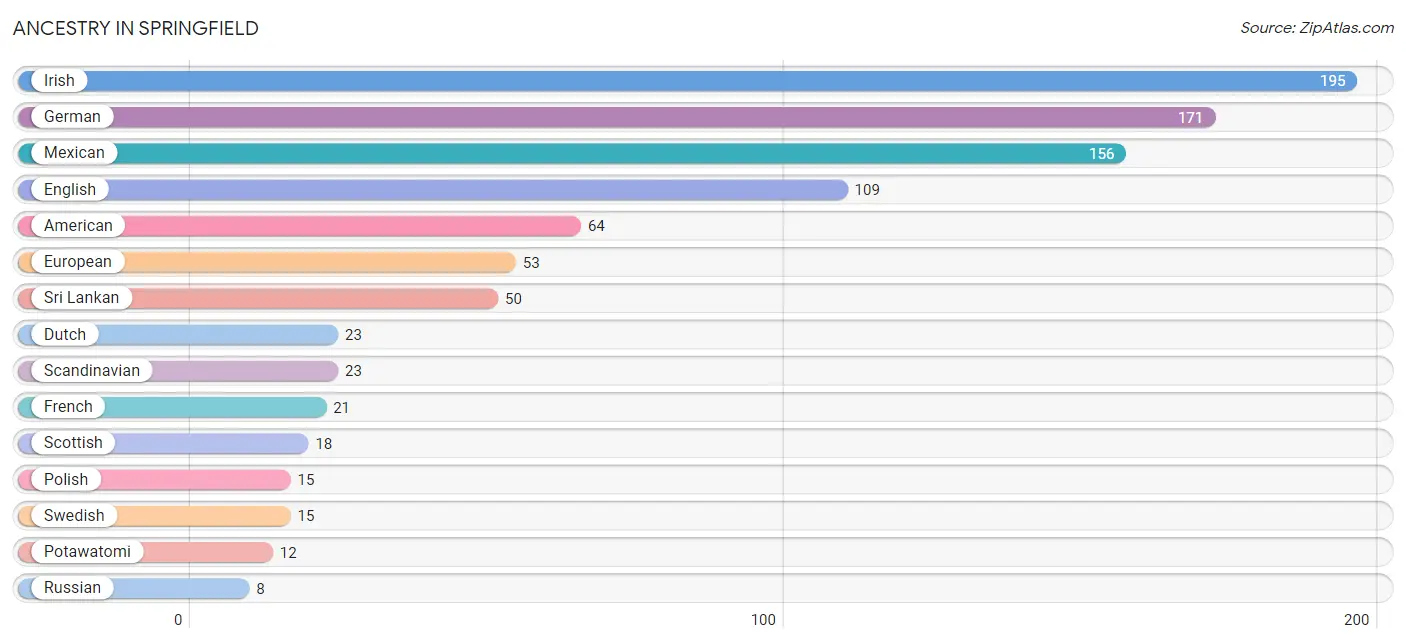
| Ancestry | # Population | % Population |
| American | 64 | 4.7% |
| British | 4 | 0.3% |
| Celtic | 3 | 0.2% |
| Danish | 5 | 0.4% |
| Dutch | 23 | 1.7% |
| English | 109 | 8.0% |
| European | 53 | 3.9% |
| French | 21 | 1.5% |
| French Canadian | 3 | 0.2% |
| German | 171 | 12.6% |
| Irish | 195 | 14.4% |
| Italian | 5 | 0.4% |
| Mexican | 156 | 11.5% |
| Norwegian | 2 | 0.2% |
| Polish | 15 | 1.1% |
| Potawatomi | 12 | 0.9% |
| Russian | 8 | 0.6% |
| Scandinavian | 23 | 1.7% |
| Scotch-Irish | 3 | 0.2% |
| Scottish | 18 | 1.3% |
| Spanish | 3 | 0.2% |
| Sri Lankan | 50 | 3.7% |
| Swedish | 15 | 1.1% |
| Ukrainian | 4 | 0.3% |
| Welsh | 4 | 0.3% | View All 25 Rows |
Immigrants in Springfield
The most numerous immigrant groups reported in Springfield came from Canada (28 | 2.1%), Asia (22 | 1.6%), South Eastern Asia (22 | 1.6%), Vietnam (22 | 1.6%), and Europe (10 | 0.7%), together accounting for 7.7% of all Springfield residents.
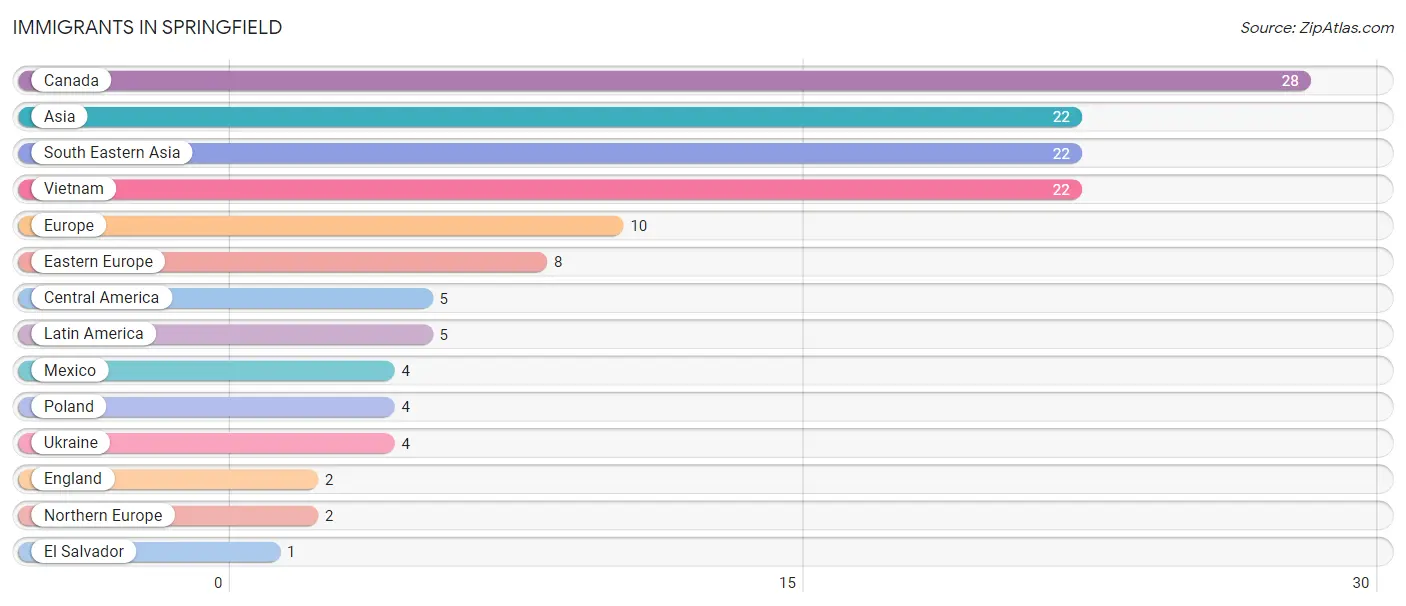
| Immigration Origin | # Population | % Population |
| Asia | 22 | 1.6% |
| Canada | 28 | 2.1% |
| Central America | 5 | 0.4% |
| Eastern Europe | 8 | 0.6% |
| El Salvador | 1 | 0.1% |
| England | 2 | 0.2% |
| Europe | 10 | 0.7% |
| Latin America | 5 | 0.4% |
| Mexico | 4 | 0.3% |
| Northern Europe | 2 | 0.2% |
| Poland | 4 | 0.3% |
| South Eastern Asia | 22 | 1.6% |
| Ukraine | 4 | 0.3% |
| Vietnam | 22 | 1.6% | View All 14 Rows |
Sex and Age in Springfield
Sex and Age in Springfield
The most populous age groups in Springfield are 35 to 39 Years (72 | 10.5%) for men and 5 to 9 Years (76 | 11.3%) for women.
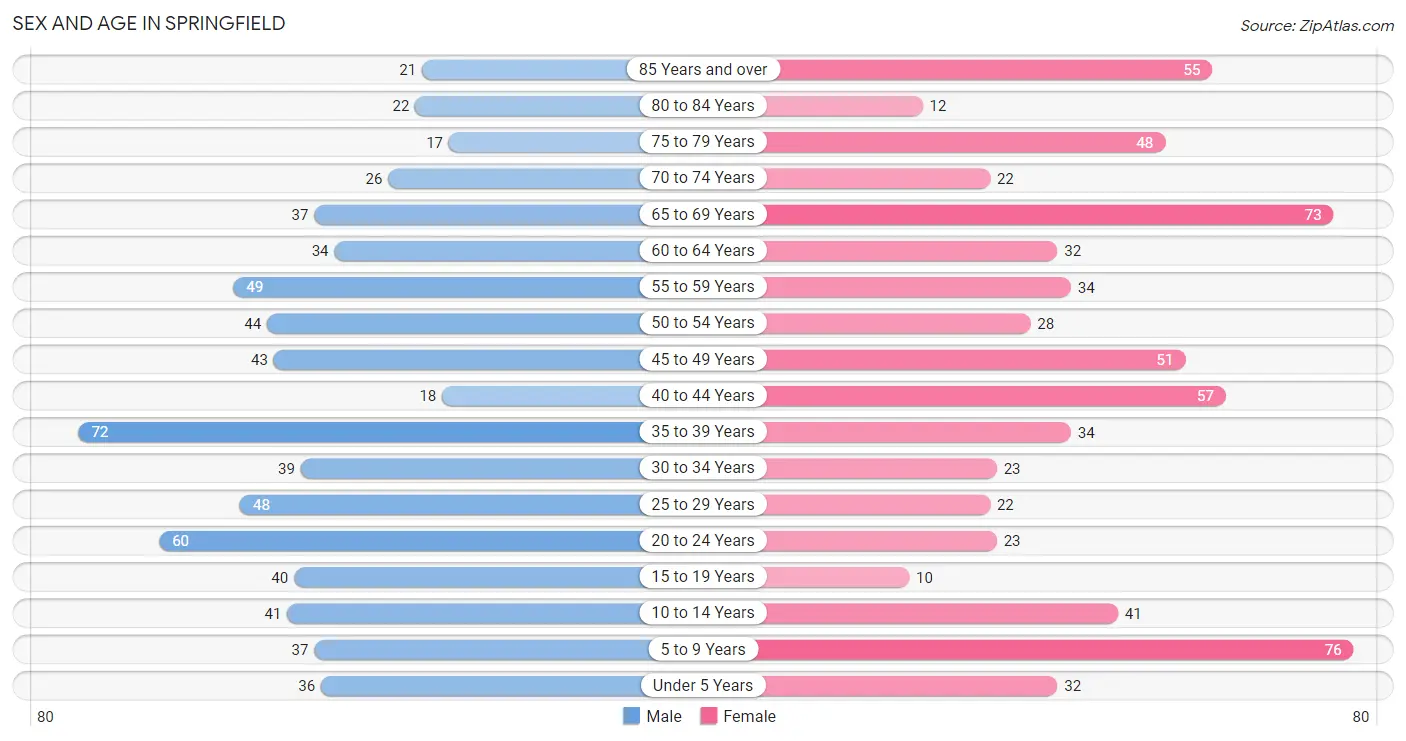
| Age Bracket | Male | Female |
| Under 5 Years | 36 (5.3%) | 32 (4.8%) |
| 5 to 9 Years | 37 (5.4%) | 76 (11.3%) |
| 10 to 14 Years | 41 (6.0%) | 41 (6.1%) |
| 15 to 19 Years | 40 (5.9%) | 10 (1.5%) |
| 20 to 24 Years | 60 (8.8%) | 23 (3.4%) |
| 25 to 29 Years | 48 (7.0%) | 22 (3.3%) |
| 30 to 34 Years | 39 (5.7%) | 23 (3.4%) |
| 35 to 39 Years | 72 (10.5%) | 34 (5.1%) |
| 40 to 44 Years | 18 (2.6%) | 57 (8.5%) |
| 45 to 49 Years | 43 (6.3%) | 51 (7.6%) |
| 50 to 54 Years | 44 (6.4%) | 28 (4.2%) |
| 55 to 59 Years | 49 (7.2%) | 34 (5.1%) |
| 60 to 64 Years | 34 (5.0%) | 32 (4.8%) |
| 65 to 69 Years | 37 (5.4%) | 73 (10.8%) |
| 70 to 74 Years | 26 (3.8%) | 22 (3.3%) |
| 75 to 79 Years | 17 (2.5%) | 48 (7.1%) |
| 80 to 84 Years | 22 (3.2%) | 12 (1.8%) |
| 85 Years and over | 21 (3.1%) | 55 (8.2%) |
| Total | 684 (100.0%) | 673 (100.0%) |
Families and Households in Springfield
Median Family Size in Springfield
The median family size in Springfield is 2.94 persons per family, with married-couple families (234 | 71.8%) accounting for the largest median family size of 3.26 persons per family. On the other hand, single male/father families (45 | 13.8%) represent the smallest median family size with 1.93 persons per family.
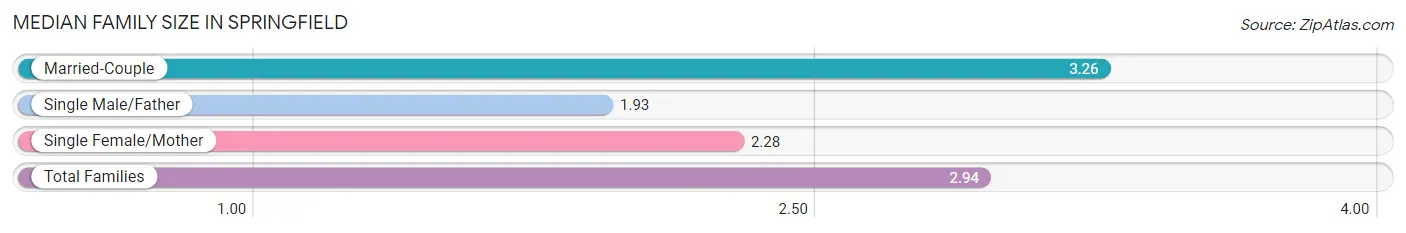
| Family Type | # Families | Family Size |
| Married-Couple | 234 (71.8%) | 3.26 |
| Single Male/Father | 45 (13.8%) | 1.93 |
| Single Female/Mother | 47 (14.4%) | 2.28 |
| Total Families | 326 (100.0%) | 2.94 |
Median Household Size in Springfield
The median household size in Springfield is 2.06 persons per household, with married-couple households (234 | 37.6%) accounting for the largest median household size of 3.26 persons per household. non-family households (297 | 47.7%) represent the smallest median household size with 1.08 persons per household.
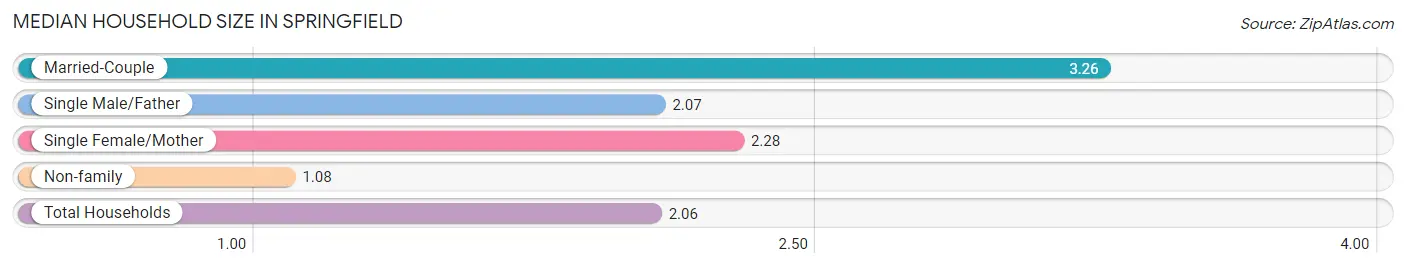
| Household Type | # Households | Household Size |
| Married-Couple | 234 (37.6%) | 3.26 |
| Single Male/Father | 45 (7.2%) | 2.07 |
| Single Female/Mother | 47 (7.5%) | 2.28 |
| Non-family | 297 (47.7%) | 1.08 |
| Total Households | 623 (100.0%) | 2.06 |
Household Size by Marriage Status in Springfield
Out of a total of 623 households in Springfield, 326 (52.3%) are family households, while 297 (47.7%) are nonfamily households. The most numerous type of family households are 2-person households, comprising 159, and the most common type of nonfamily households are 1-person households, comprising 272.
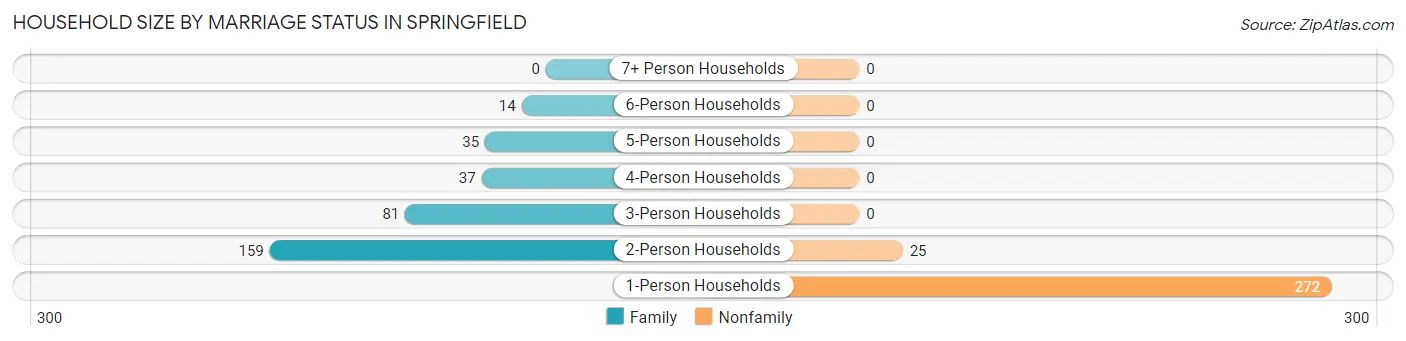
| Household Size | Family Households | Nonfamily Households |
| 1-Person Households | - | 272 (43.7%) |
| 2-Person Households | 159 (25.5%) | 25 (4.0%) |
| 3-Person Households | 81 (13.0%) | 0 (0.0%) |
| 4-Person Households | 37 (5.9%) | 0 (0.0%) |
| 5-Person Households | 35 (5.6%) | 0 (0.0%) |
| 6-Person Households | 14 (2.2%) | 0 (0.0%) |
| 7+ Person Households | 0 (0.0%) | 0 (0.0%) |
| Total | 326 (52.3%) | 297 (47.7%) |
Female Fertility in Springfield
Fertility by Age in Springfield
Average fertility rate in Springfield is 50.0 births per 1,000 women. Women in the age bracket of 20 to 34 years have the highest fertility rate with 162.0 births per 1,000 women. Women in the age bracket of 20 to 34 years acount for 100.0% of all women with births.
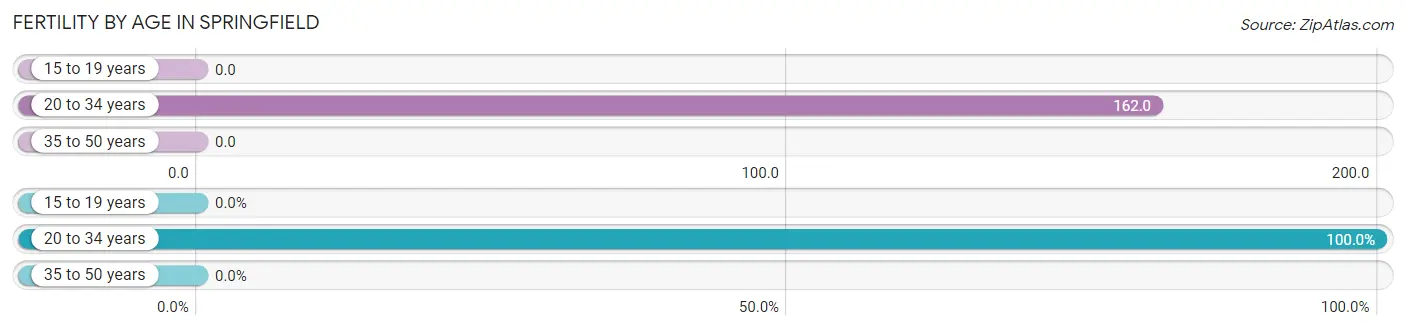
| Age Bracket | Women with Births | Births / 1,000 Women |
| 15 to 19 years | 0 (0.0%) | 0.0 |
| 20 to 34 years | 11 (100.0%) | 162.0 |
| 35 to 50 years | 0 (0.0%) | 0.0 |
| Total | 11 (100.0%) | 50.0 |
Fertility by Age by Marriage Status in Springfield
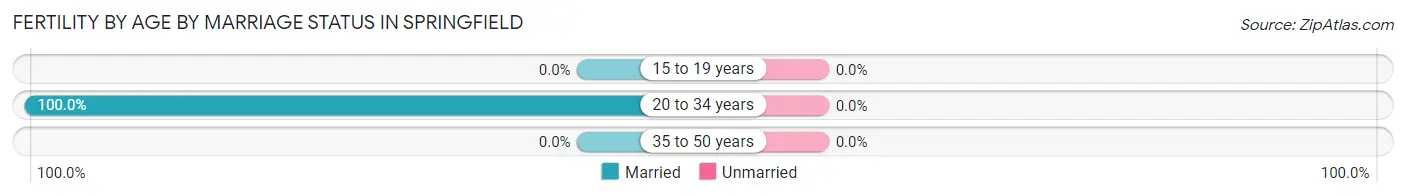
| Age Bracket | Married | Unmarried |
| 15 to 19 years | 0 (0.0%) | 0 (0.0%) |
| 20 to 34 years | 11 (100.0%) | 0 (0.0%) |
| 35 to 50 years | 0 (0.0%) | 0 (0.0%) |
| Total | 11 (100.0%) | 0 (0.0%) |
Fertility by Education in Springfield
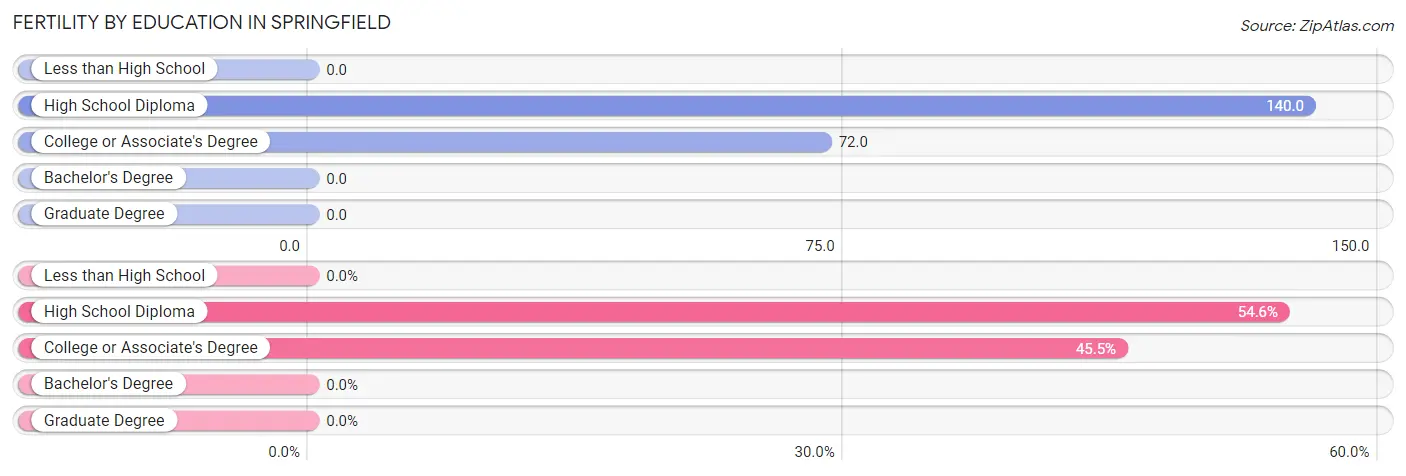
| Educational Attainment | Women with Births | Births / 1,000 Women |
| Less than High School | 0 (0.0%) | 0.0 |
| High School Diploma | 6 (54.5%) | 140.0 |
| College or Associate's Degree | 5 (45.5%) | 72.0 |
| Bachelor's Degree | 0 (0.0%) | 0.0 |
| Graduate Degree | 0 (0.0%) | 0.0 |
| Total | 11 (100.0%) | 50.0 |
Fertility by Education by Marriage Status in Springfield
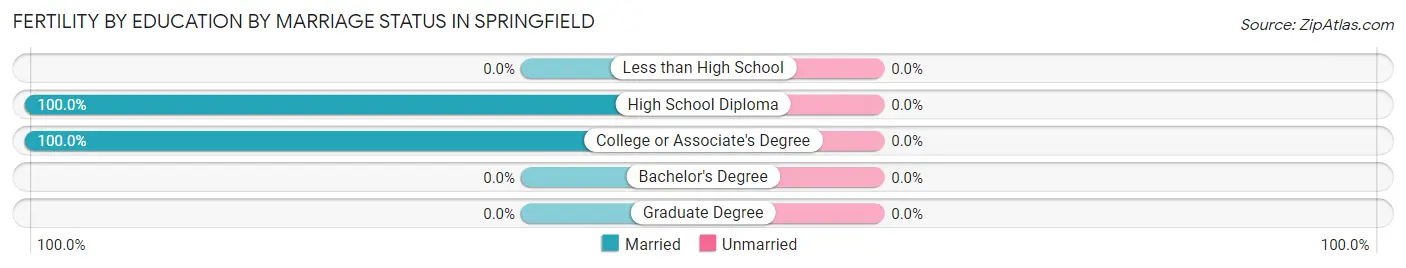
| Educational Attainment | Married | Unmarried |
| Less than High School | 0 (0.0%) | 0 (0.0%) |
| High School Diploma | 6 (100.0%) | 0 (0.0%) |
| College or Associate's Degree | 5 (100.0%) | 0 (0.0%) |
| Bachelor's Degree | 0 (0.0%) | 0 (0.0%) |
| Graduate Degree | 0 (0.0%) | 0 (0.0%) |
| Total | 11 (100.0%) | 0 (0.0%) |
Employment Characteristics in Springfield
Employment by Class of Employer in Springfield
Among the 547 employed individuals in Springfield, private company employees (276 | 50.5%), local government employees (80 | 14.6%), and self-employed (not incorporated) (68 | 12.4%) make up the most common classes of employment.
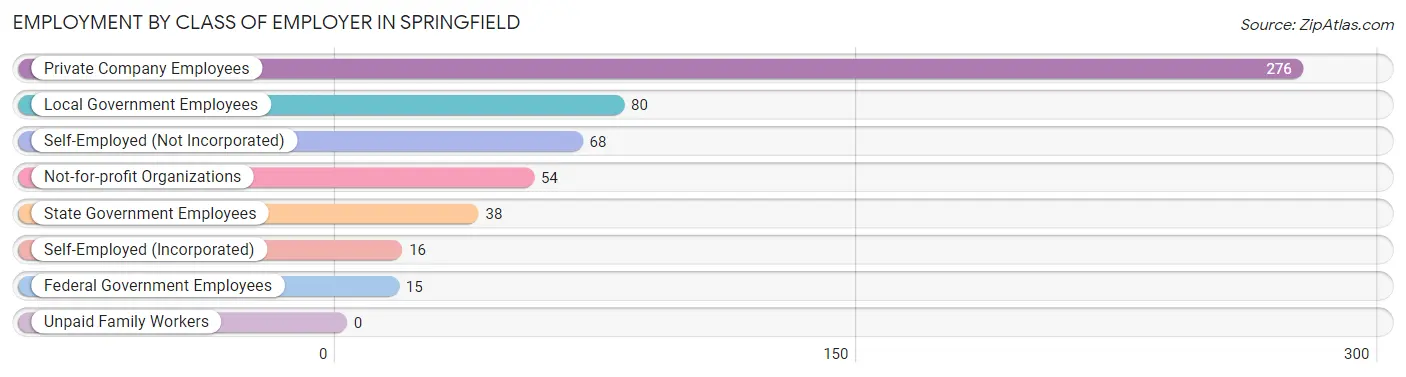
| Employer Class | # Employees | % Employees |
| Private Company Employees | 276 | 50.5% |
| Self-Employed (Incorporated) | 16 | 2.9% |
| Self-Employed (Not Incorporated) | 68 | 12.4% |
| Not-for-profit Organizations | 54 | 9.9% |
| Local Government Employees | 80 | 14.6% |
| State Government Employees | 38 | 7.0% |
| Federal Government Employees | 15 | 2.7% |
| Unpaid Family Workers | 0 | 0.0% |
| Total | 547 | 100.0% |
Employment Status by Age in Springfield
According to the labor force statistics for Springfield, out of the total population over 16 years of age (1,066), 53.3% or 568 individuals are in the labor force, with 2.3% or 13 of them unemployed. The age group with the highest labor force participation rate is 20 to 24 years, with 91.6% or 76 individuals in the labor force. Within the labor force, the 75 years and over age range has the highest percentage of unemployed individuals, with 21.4% or 3 of them being unemployed.
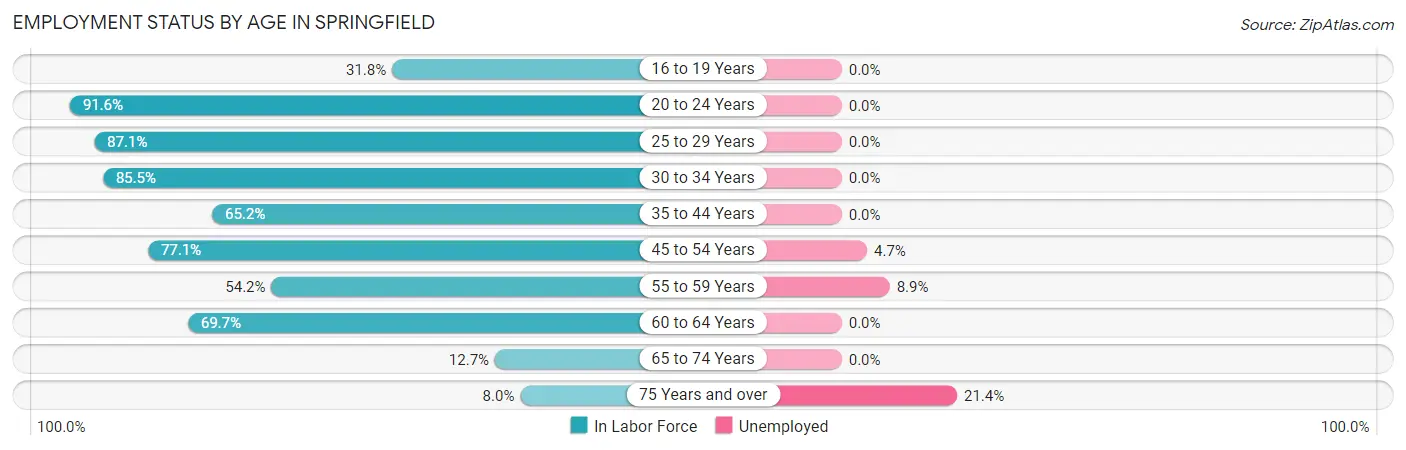
| Age Bracket | In Labor Force | Unemployed |
| 16 to 19 Years | 7 (31.8%) | 0 (0.0%) |
| 20 to 24 Years | 76 (91.6%) | 0 (0.0%) |
| 25 to 29 Years | 61 (87.1%) | 0 (0.0%) |
| 30 to 34 Years | 53 (85.5%) | 0 (0.0%) |
| 35 to 44 Years | 118 (65.2%) | 0 (0.0%) |
| 45 to 54 Years | 128 (77.1%) | 6 (4.7%) |
| 55 to 59 Years | 45 (54.2%) | 4 (8.9%) |
| 60 to 64 Years | 46 (69.7%) | 0 (0.0%) |
| 65 to 74 Years | 20 (12.7%) | 0 (0.0%) |
| 75 Years and over | 14 (8.0%) | 3 (21.4%) |
| Total | 568 (53.3%) | 13 (2.3%) |
Employment Status by Educational Attainment in Springfield
According to labor force statistics for Springfield, 71.8% of individuals (451) out of the total population between 25 and 64 years of age (628) are in the labor force, with 2.2% or 10 of them being unemployed. The group with the highest labor force participation rate are those with the educational attainment of bachelor's degree or higher, with 96.5% or 166 individuals in the labor force. Within the labor force, individuals with high school diploma education have the highest percentage of unemployment, with 8.9% or 7 of them being unemployed.
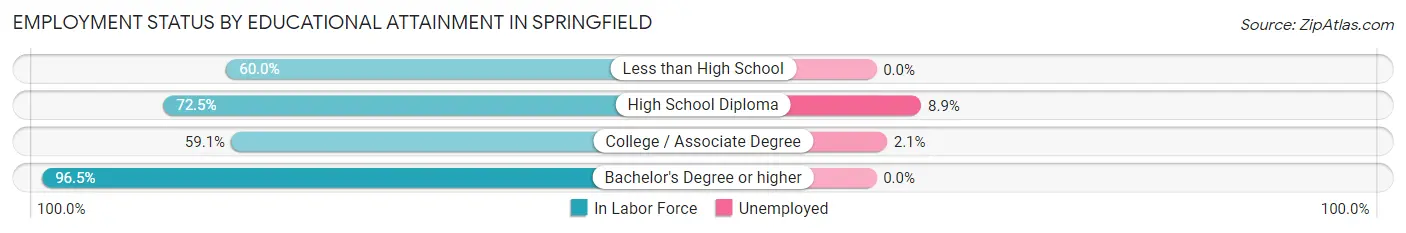
| Educational Attainment | In Labor Force | Unemployed |
| Less than High School | 66 (60.0%) | 0 (0.0%) |
| High School Diploma | 79 (72.5%) | 10 (8.9%) |
| College / Associate Degree | 140 (59.1%) | 5 (2.1%) |
| Bachelor's Degree or higher | 166 (96.5%) | 0 (0.0%) |
| Total | 451 (71.8%) | 14 (2.2%) |
Employment Occupations by Sex in Springfield
Management, Business, Science and Arts Occupations
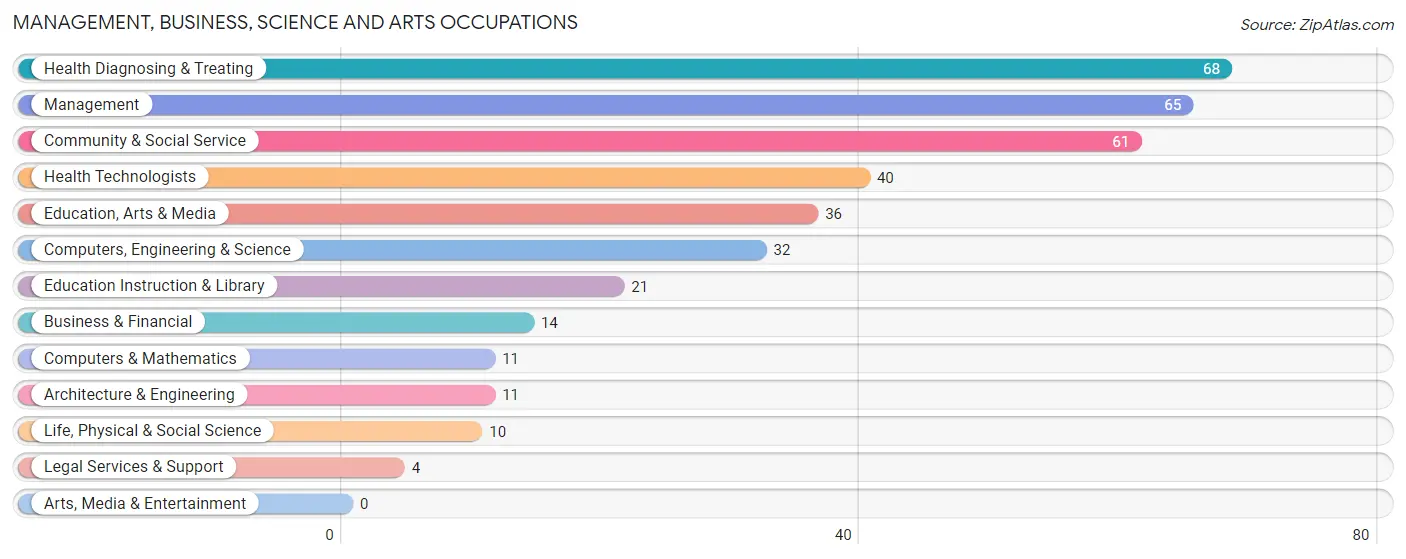
The most common Management, Business, Science and Arts occupations in Springfield are Health Diagnosing & Treating (68 | 12.2%), Management (65 | 11.7%), Community & Social Service (61 | 11.0%), Health Technologists (40 | 7.2%), and Education, Arts & Media (36 | 6.5%).
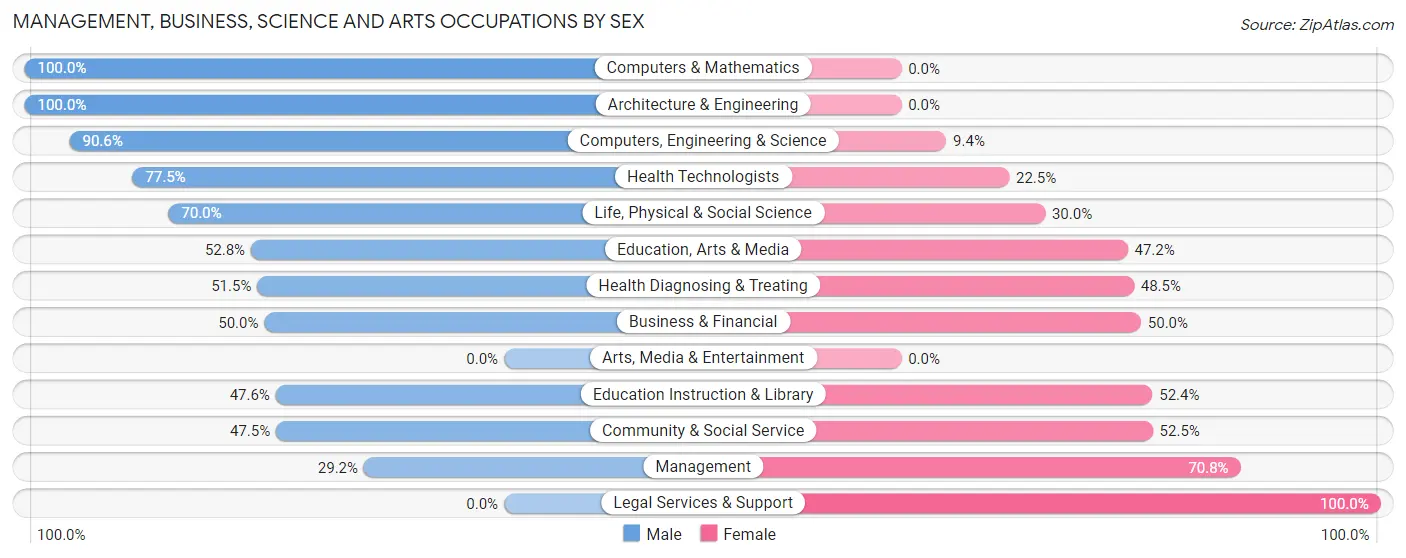
Management, Business, Science and Arts Occupations by Sex
Within the Management, Business, Science and Arts occupations in Springfield, the most male-oriented occupations are Computers & Mathematics (100.0%), Architecture & Engineering (100.0%), and Computers, Engineering & Science (90.6%), while the most female-oriented occupations are Legal Services & Support (100.0%), Management (70.8%), and Community & Social Service (52.5%).
| Occupation | Male | Female |
| Management | 19 (29.2%) | 46 (70.8%) |
| Business & Financial | 7 (50.0%) | 7 (50.0%) |
| Computers, Engineering & Science | 29 (90.6%) | 3 (9.4%) |
| Computers & Mathematics | 11 (100.0%) | 0 (0.0%) |
| Architecture & Engineering | 11 (100.0%) | 0 (0.0%) |
| Life, Physical & Social Science | 7 (70.0%) | 3 (30.0%) |
| Community & Social Service | 29 (47.5%) | 32 (52.5%) |
| Education, Arts & Media | 19 (52.8%) | 17 (47.2%) |
| Legal Services & Support | 0 (0.0%) | 4 (100.0%) |
| Education Instruction & Library | 10 (47.6%) | 11 (52.4%) |
| Arts, Media & Entertainment | 0 (0.0%) | 0 (0.0%) |
| Health Diagnosing & Treating | 35 (51.5%) | 33 (48.5%) |
| Health Technologists | 31 (77.5%) | 9 (22.5%) |
| Total (Category) | 119 (49.6%) | 121 (50.4%) |
| Total (Overall) | 334 (60.2%) | 221 (39.8%) |
Services Occupations
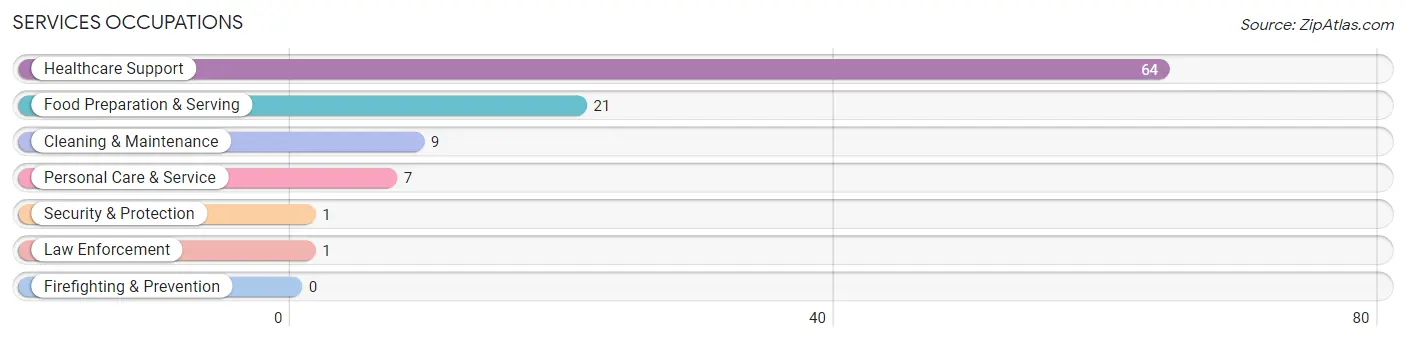
The most common Services occupations in Springfield are Healthcare Support (64 | 11.5%), Food Preparation & Serving (21 | 3.8%), Cleaning & Maintenance (9 | 1.6%), Personal Care & Service (7 | 1.3%), and Security & Protection (1 | 0.2%).
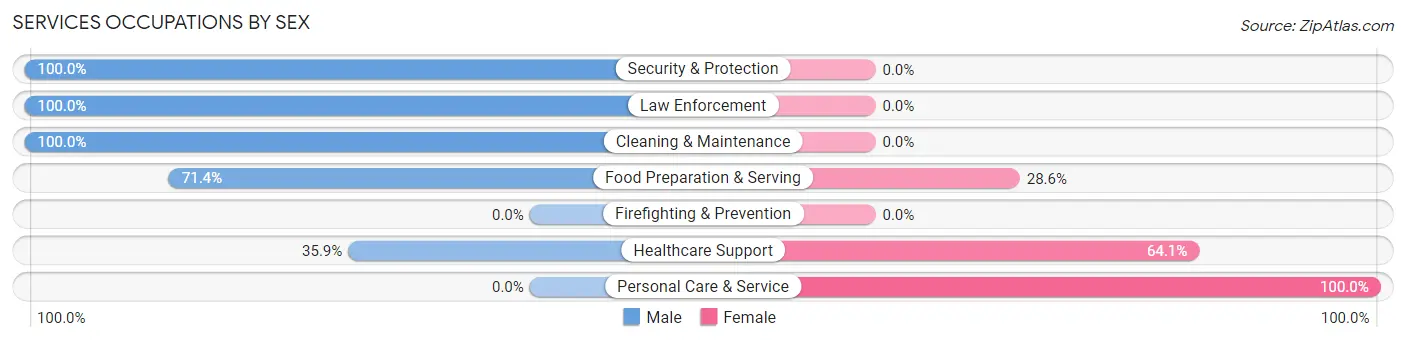
Services Occupations by Sex
Within the Services occupations in Springfield, the most male-oriented occupations are Security & Protection (100.0%), Law Enforcement (100.0%), and Cleaning & Maintenance (100.0%), while the most female-oriented occupations are Personal Care & Service (100.0%), Healthcare Support (64.1%), and Food Preparation & Serving (28.6%).
| Occupation | Male | Female |
| Healthcare Support | 23 (35.9%) | 41 (64.1%) |
| Security & Protection | 1 (100.0%) | 0 (0.0%) |
| Firefighting & Prevention | 0 (0.0%) | 0 (0.0%) |
| Law Enforcement | 1 (100.0%) | 0 (0.0%) |
| Food Preparation & Serving | 15 (71.4%) | 6 (28.6%) |
| Cleaning & Maintenance | 9 (100.0%) | 0 (0.0%) |
| Personal Care & Service | 0 (0.0%) | 7 (100.0%) |
| Total (Category) | 48 (47.1%) | 54 (52.9%) |
| Total (Overall) | 334 (60.2%) | 221 (39.8%) |
Sales and Office Occupations
The most common Sales and Office occupations in Springfield are Office & Administration (18 | 3.2%), and Sales & Related (14 | 2.5%).
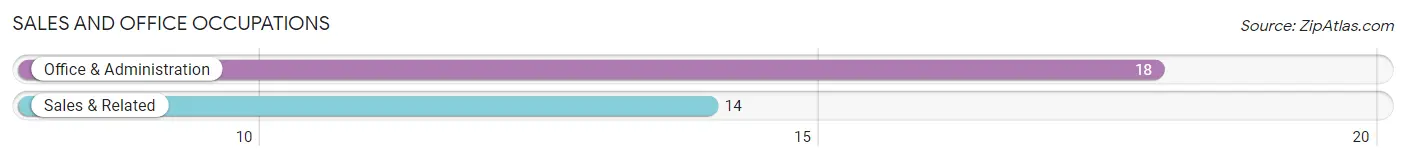
Sales and Office Occupations by Sex
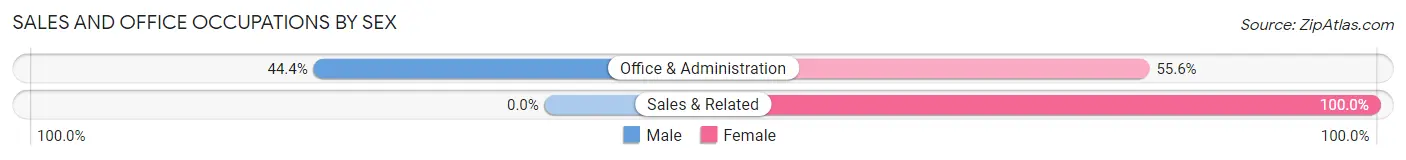
| Occupation | Male | Female |
| Sales & Related | 0 (0.0%) | 14 (100.0%) |
| Office & Administration | 8 (44.4%) | 10 (55.6%) |
| Total (Category) | 8 (25.0%) | 24 (75.0%) |
| Total (Overall) | 334 (60.2%) | 221 (39.8%) |
Natural Resources, Construction and Maintenance Occupations
The most common Natural Resources, Construction and Maintenance occupations in Springfield are Farming, Fishing & Forestry (41 | 7.4%), Construction & Extraction (39 | 7.0%), and Installation, Maintenance & Repair (34 | 6.1%).
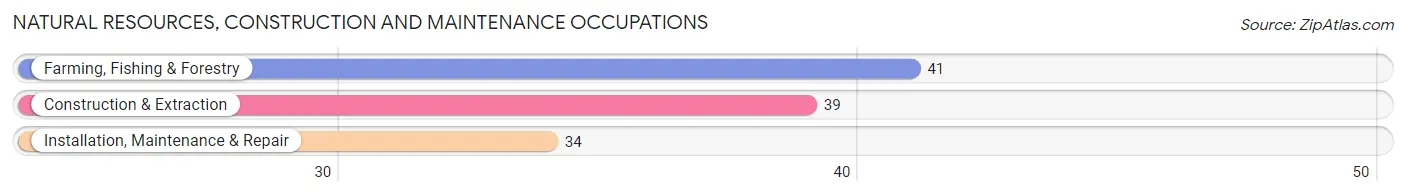
Natural Resources, Construction and Maintenance Occupations by Sex
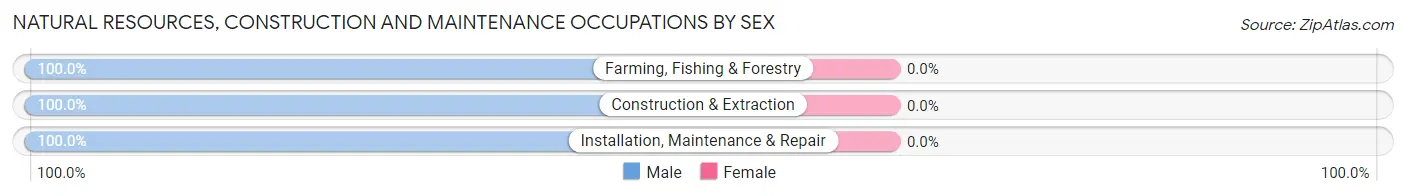
| Occupation | Male | Female |
| Farming, Fishing & Forestry | 41 (100.0%) | 0 (0.0%) |
| Construction & Extraction | 39 (100.0%) | 0 (0.0%) |
| Installation, Maintenance & Repair | 34 (100.0%) | 0 (0.0%) |
| Total (Category) | 114 (100.0%) | 0 (0.0%) |
| Total (Overall) | 334 (60.2%) | 221 (39.8%) |
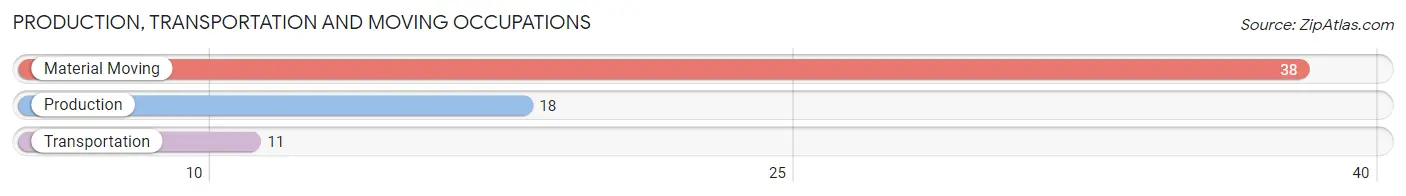
Production, Transportation and Moving Occupations
The most common Production, Transportation and Moving occupations in Springfield are Material Moving (38 | 6.9%), Production (18 | 3.2%), and Transportation (11 | 2.0%).
Production, Transportation and Moving Occupations by Sex
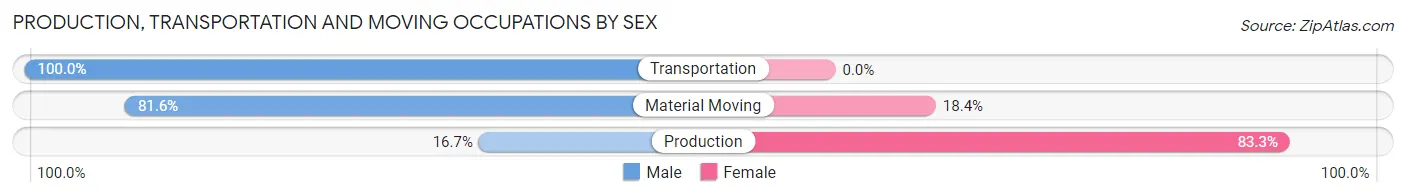
| Occupation | Male | Female |
| Production | 3 (16.7%) | 15 (83.3%) |
| Transportation | 11 (100.0%) | 0 (0.0%) |
| Material Moving | 31 (81.6%) | 7 (18.4%) |
| Total (Category) | 45 (67.2%) | 22 (32.8%) |
| Total (Overall) | 334 (60.2%) | 221 (39.8%) |
Employment Industries by Sex in Springfield
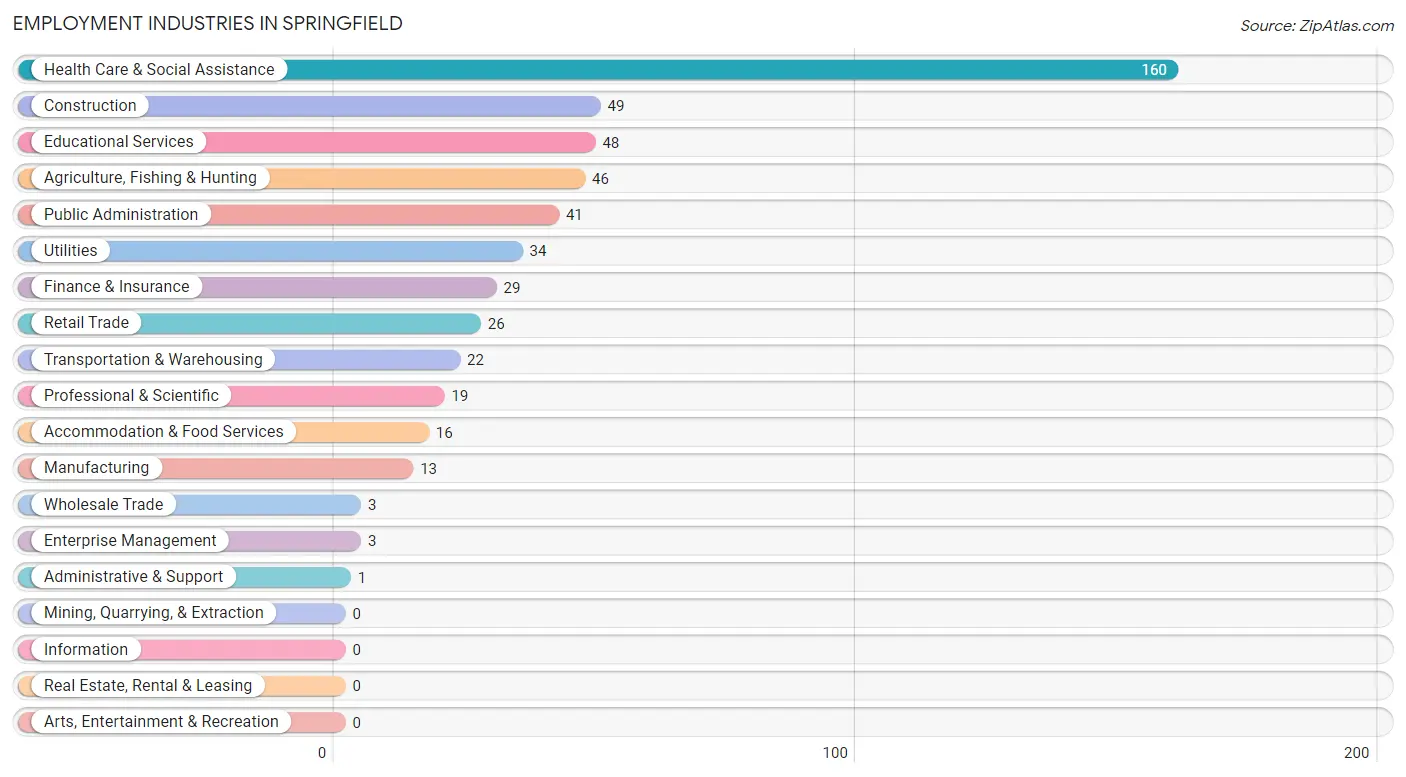
Employment Industries in Springfield
The major employment industries in Springfield include Health Care & Social Assistance (160 | 28.8%), Construction (49 | 8.8%), Educational Services (48 | 8.6%), Agriculture, Fishing & Hunting (46 | 8.3%), and Public Administration (41 | 7.4%).
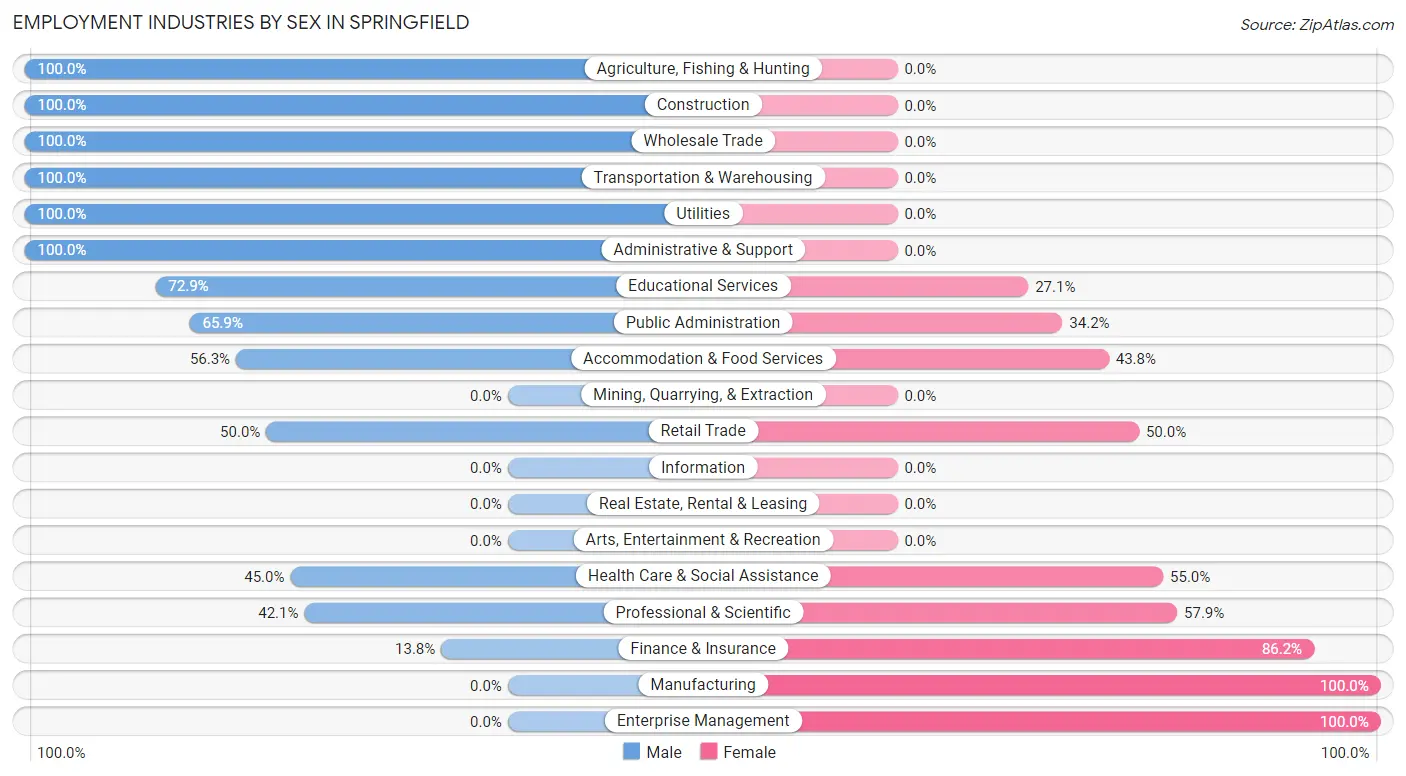
Employment Industries by Sex in Springfield
The Springfield industries that see more men than women are Agriculture, Fishing & Hunting (100.0%), Construction (100.0%), and Wholesale Trade (100.0%), whereas the industries that tend to have a higher number of women are Manufacturing (100.0%), Enterprise Management (100.0%), and Finance & Insurance (86.2%).
| Industry | Male | Female |
| Agriculture, Fishing & Hunting | 46 (100.0%) | 0 (0.0%) |
| Mining, Quarrying, & Extraction | 0 (0.0%) | 0 (0.0%) |
| Construction | 49 (100.0%) | 0 (0.0%) |
| Manufacturing | 0 (0.0%) | 13 (100.0%) |
| Wholesale Trade | 3 (100.0%) | 0 (0.0%) |
| Retail Trade | 13 (50.0%) | 13 (50.0%) |
| Transportation & Warehousing | 22 (100.0%) | 0 (0.0%) |
| Utilities | 34 (100.0%) | 0 (0.0%) |
| Information | 0 (0.0%) | 0 (0.0%) |
| Finance & Insurance | 4 (13.8%) | 25 (86.2%) |
| Real Estate, Rental & Leasing | 0 (0.0%) | 0 (0.0%) |
| Professional & Scientific | 8 (42.1%) | 11 (57.9%) |
| Enterprise Management | 0 (0.0%) | 3 (100.0%) |
| Administrative & Support | 1 (100.0%) | 0 (0.0%) |
| Educational Services | 35 (72.9%) | 13 (27.1%) |
| Health Care & Social Assistance | 72 (45.0%) | 88 (55.0%) |
| Arts, Entertainment & Recreation | 0 (0.0%) | 0 (0.0%) |
| Accommodation & Food Services | 9 (56.2%) | 7 (43.8%) |
| Public Administration | 27 (65.8%) | 14 (34.2%) |
| Total | 334 (60.2%) | 221 (39.8%) |
Education in Springfield
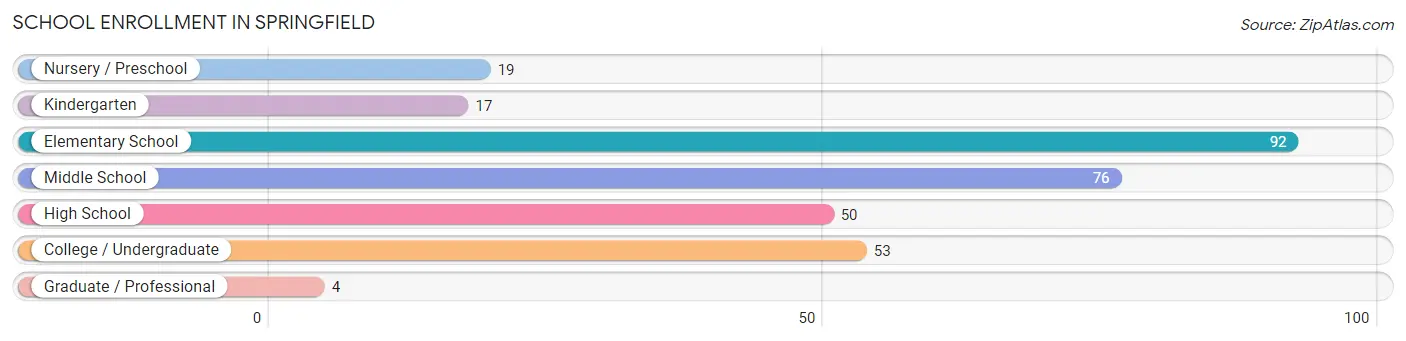
School Enrollment in Springfield
The most common levels of schooling among the 311 students in Springfield are elementary school (92 | 29.6%), middle school (76 | 24.4%), and college / undergraduate (53 | 17.0%).
| School Level | # Students | % Students |
| Nursery / Preschool | 19 | 6.1% |
| Kindergarten | 17 | 5.5% |
| Elementary School | 92 | 29.6% |
| Middle School | 76 | 24.4% |
| High School | 50 | 16.1% |
| College / Undergraduate | 53 | 17.0% |
| Graduate / Professional | 4 | 1.3% |
| Total | 311 | 100.0% |
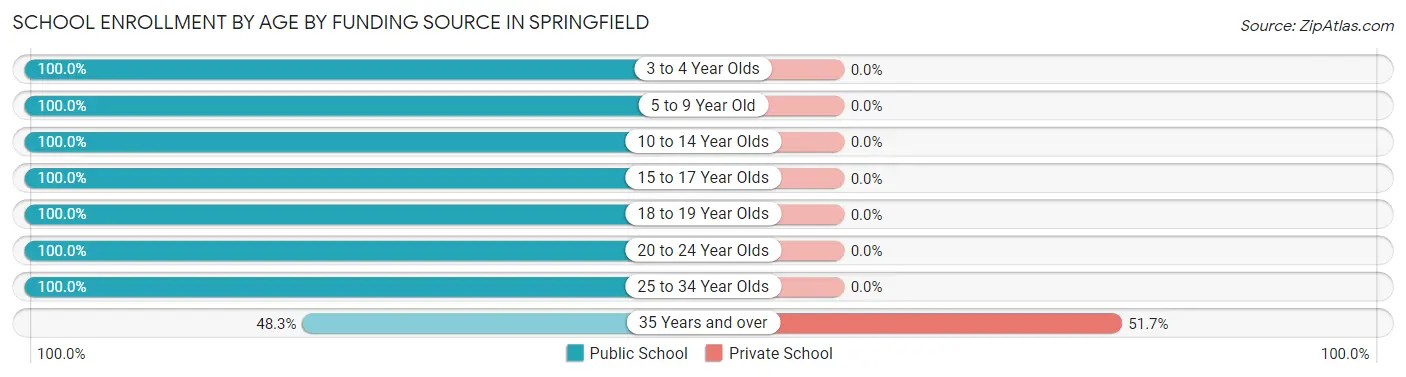
School Enrollment by Age by Funding Source in Springfield
Out of a total of 311 students who are enrolled in schools in Springfield, 15 (4.8%) attend a private institution, while the remaining 296 (95.2%) are enrolled in public schools. The age group of 35 years and over has the highest likelihood of being enrolled in private schools, with 15 (51.7% in the age bracket) enrolled. Conversely, the age group of 3 to 4 year olds has the lowest likelihood of being enrolled in a private school, with 8 (100.0% in the age bracket) attending a public institution.
| Age Bracket | Public School | Private School |
| 3 to 4 Year Olds | 8 (100.0%) | 0 (0.0%) |
| 5 to 9 Year Old | 113 (100.0%) | 0 (0.0%) |
| 10 to 14 Year Olds | 73 (100.0%) | 0 (0.0%) |
| 15 to 17 Year Olds | 38 (100.0%) | 0 (0.0%) |
| 18 to 19 Year Olds | 12 (100.0%) | 0 (0.0%) |
| 20 to 24 Year Olds | 29 (100.0%) | 0 (0.0%) |
| 25 to 34 Year Olds | 9 (100.0%) | 0 (0.0%) |
| 35 Years and over | 14 (48.3%) | 15 (51.7%) |
| Total | 296 (95.2%) | 15 (4.8%) |
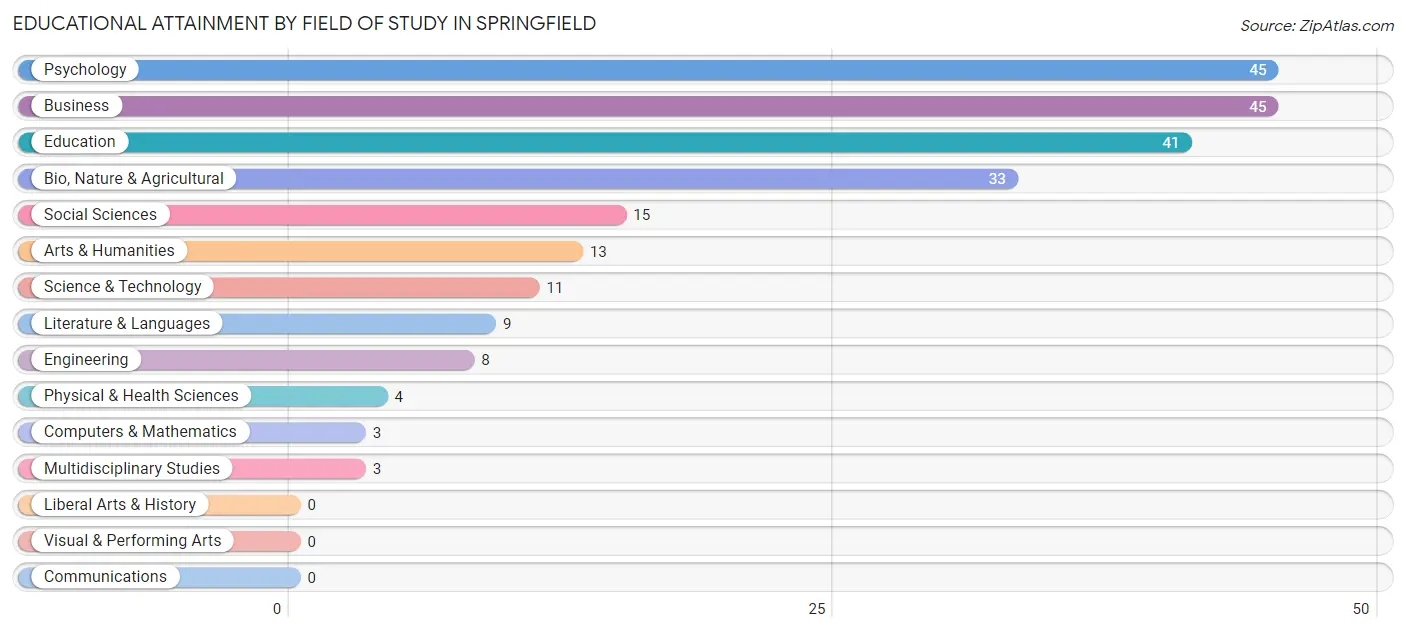
Educational Attainment by Field of Study in Springfield
Psychology (45 | 19.6%), business (45 | 19.6%), education (41 | 17.8%), bio, nature & agricultural (33 | 14.3%), and social sciences (15 | 6.5%) are the most common fields of study among 230 individuals in Springfield who have obtained a bachelor's degree or higher.
| Field of Study | # Graduates | % Graduates |
| Computers & Mathematics | 3 | 1.3% |
| Bio, Nature & Agricultural | 33 | 14.3% |
| Physical & Health Sciences | 4 | 1.7% |
| Psychology | 45 | 19.6% |
| Social Sciences | 15 | 6.5% |
| Engineering | 8 | 3.5% |
| Multidisciplinary Studies | 3 | 1.3% |
| Science & Technology | 11 | 4.8% |
| Business | 45 | 19.6% |
| Education | 41 | 17.8% |
| Literature & Languages | 9 | 3.9% |
| Liberal Arts & History | 0 | 0.0% |
| Visual & Performing Arts | 0 | 0.0% |
| Communications | 0 | 0.0% |
| Arts & Humanities | 13 | 5.7% |
| Total | 230 | 100.0% |
Transportation & Commute in Springfield
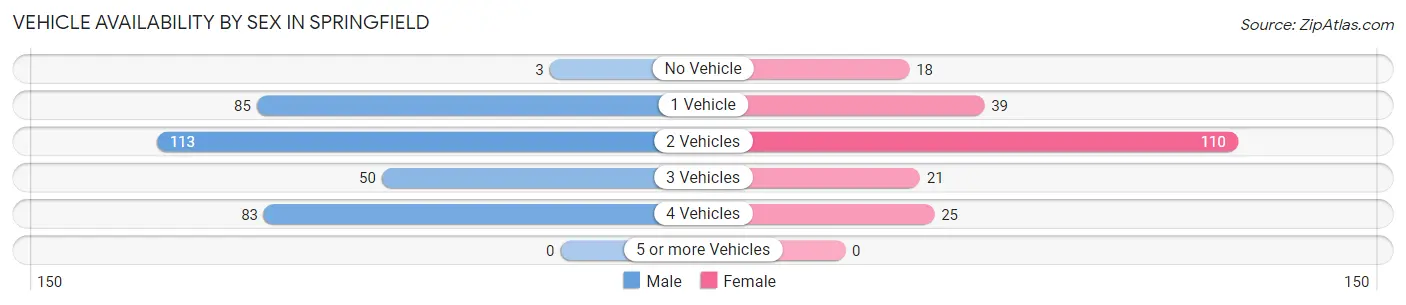
Vehicle Availability by Sex in Springfield
The most prevalent vehicle ownership categories in Springfield are males with 2 vehicles (113, accounting for 33.8%) and females with 2 vehicles (110, making up 53.0%).
| Vehicles Available | Male | Female |
| No Vehicle | 3 (0.9%) | 18 (8.5%) |
| 1 Vehicle | 85 (25.5%) | 39 (18.3%) |
| 2 Vehicles | 113 (33.8%) | 110 (51.6%) |
| 3 Vehicles | 50 (15.0%) | 21 (9.9%) |
| 4 Vehicles | 83 (24.8%) | 25 (11.7%) |
| 5 or more Vehicles | 0 (0.0%) | 0 (0.0%) |
| Total | 334 (100.0%) | 213 (100.0%) |
Commute Time in Springfield
The most frequently occuring commute durations in Springfield are less than 5 minutes (194 commuters, 37.1%), 5 to 9 minutes (188 commuters, 35.9%), and 15 to 19 minutes (37 commuters, 7.1%).
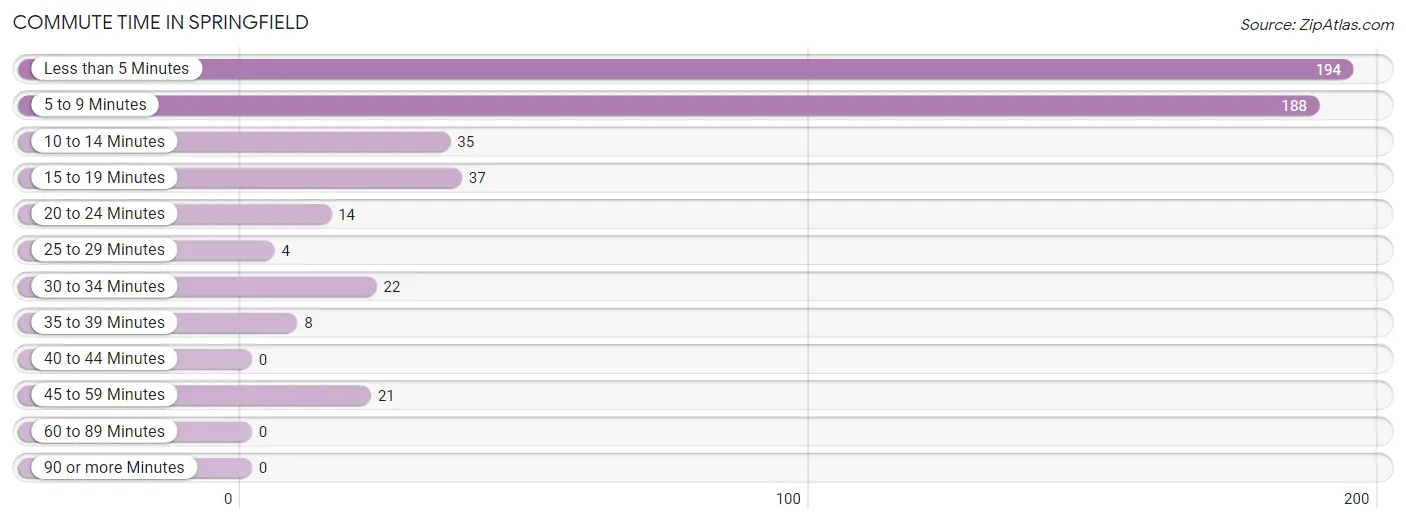
| Commute Time | # Commuters | % Commuters |
| Less than 5 Minutes | 194 | 37.1% |
| 5 to 9 Minutes | 188 | 35.9% |
| 10 to 14 Minutes | 35 | 6.7% |
| 15 to 19 Minutes | 37 | 7.1% |
| 20 to 24 Minutes | 14 | 2.7% |
| 25 to 29 Minutes | 4 | 0.8% |
| 30 to 34 Minutes | 22 | 4.2% |
| 35 to 39 Minutes | 8 | 1.5% |
| 40 to 44 Minutes | 0 | 0.0% |
| 45 to 59 Minutes | 21 | 4.0% |
| 60 to 89 Minutes | 0 | 0.0% |
| 90 or more Minutes | 0 | 0.0% |
Commute Time by Sex in Springfield
The most common commute times in Springfield are 5 to 9 minutes (124 commuters, 37.8%) for males and less than 5 minutes (87 commuters, 44.6%) for females.
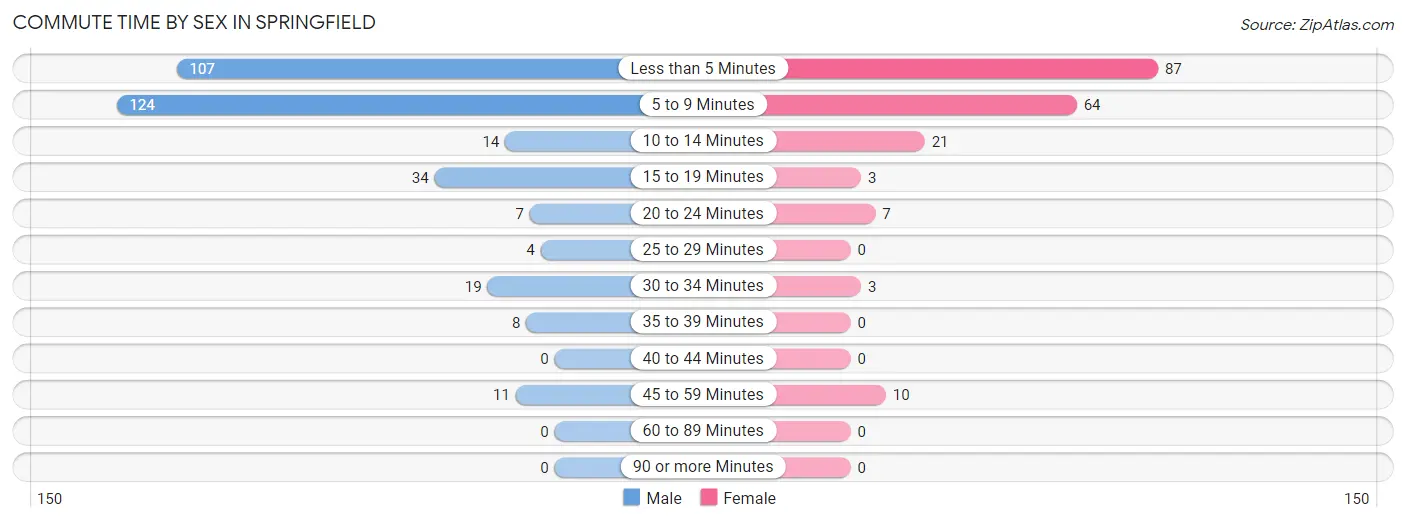
| Commute Time | Male | Female |
| Less than 5 Minutes | 107 (32.6%) | 87 (44.6%) |
| 5 to 9 Minutes | 124 (37.8%) | 64 (32.8%) |
| 10 to 14 Minutes | 14 (4.3%) | 21 (10.8%) |
| 15 to 19 Minutes | 34 (10.4%) | 3 (1.5%) |
| 20 to 24 Minutes | 7 (2.1%) | 7 (3.6%) |
| 25 to 29 Minutes | 4 (1.2%) | 0 (0.0%) |
| 30 to 34 Minutes | 19 (5.8%) | 3 (1.5%) |
| 35 to 39 Minutes | 8 (2.4%) | 0 (0.0%) |
| 40 to 44 Minutes | 0 (0.0%) | 0 (0.0%) |
| 45 to 59 Minutes | 11 (3.4%) | 10 (5.1%) |
| 60 to 89 Minutes | 0 (0.0%) | 0 (0.0%) |
| 90 or more Minutes | 0 (0.0%) | 0 (0.0%) |
Time of Departure to Work by Sex in Springfield
The most frequent times of departure to work in Springfield are 7:30 AM to 7:59 AM (84, 25.6%) for males and 7:30 AM to 7:59 AM (73, 37.4%) for females.
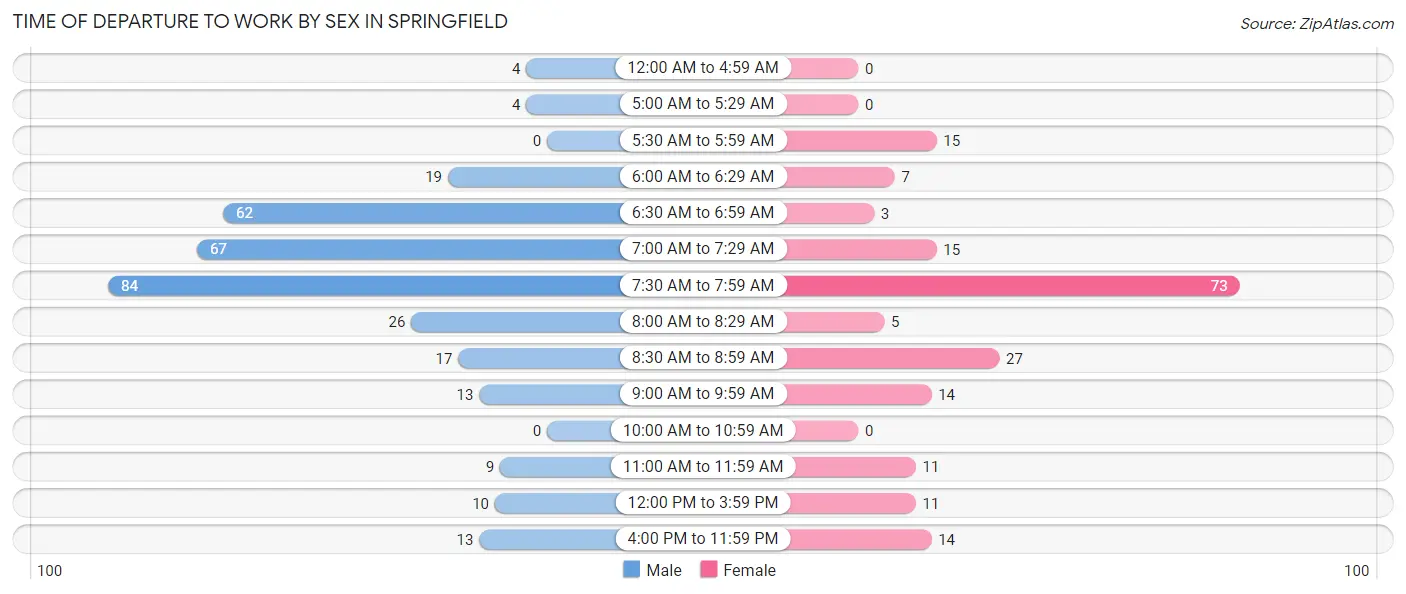
| Time of Departure | Male | Female |
| 12:00 AM to 4:59 AM | 4 (1.2%) | 0 (0.0%) |
| 5:00 AM to 5:29 AM | 4 (1.2%) | 0 (0.0%) |
| 5:30 AM to 5:59 AM | 0 (0.0%) | 15 (7.7%) |
| 6:00 AM to 6:29 AM | 19 (5.8%) | 7 (3.6%) |
| 6:30 AM to 6:59 AM | 62 (18.9%) | 3 (1.5%) |
| 7:00 AM to 7:29 AM | 67 (20.4%) | 15 (7.7%) |
| 7:30 AM to 7:59 AM | 84 (25.6%) | 73 (37.4%) |
| 8:00 AM to 8:29 AM | 26 (7.9%) | 5 (2.6%) |
| 8:30 AM to 8:59 AM | 17 (5.2%) | 27 (13.9%) |
| 9:00 AM to 9:59 AM | 13 (4.0%) | 14 (7.2%) |
| 10:00 AM to 10:59 AM | 0 (0.0%) | 0 (0.0%) |
| 11:00 AM to 11:59 AM | 9 (2.7%) | 11 (5.6%) |
| 12:00 PM to 3:59 PM | 10 (3.0%) | 11 (5.6%) |
| 4:00 PM to 11:59 PM | 13 (4.0%) | 14 (7.2%) |
| Total | 328 (100.0%) | 195 (100.0%) |
Housing Occupancy in Springfield
Occupancy by Ownership in Springfield
Of the total 623 dwellings in Springfield, owner-occupied units account for 401 (64.4%), while renter-occupied units make up 222 (35.6%).
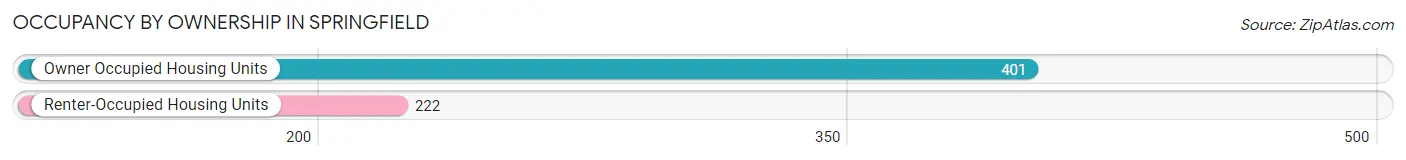
| Occupancy | # Housing Units | % Housing Units |
| Owner Occupied Housing Units | 401 | 64.4% |
| Renter-Occupied Housing Units | 222 | 35.6% |
| Total Occupied Housing Units | 623 | 100.0% |
Occupancy by Household Size in Springfield
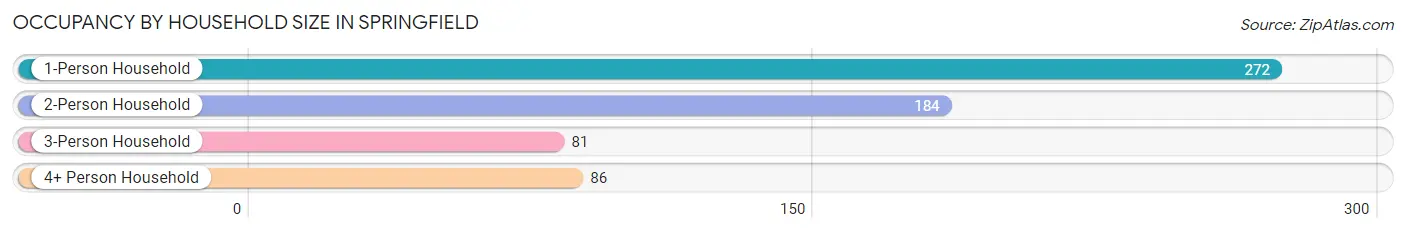
| Household Size | # Housing Units | % Housing Units |
| 1-Person Household | 272 | 43.7% |
| 2-Person Household | 184 | 29.5% |
| 3-Person Household | 81 | 13.0% |
| 4+ Person Household | 86 | 13.8% |
| Total Housing Units | 623 | 100.0% |
Occupancy by Ownership by Household Size in Springfield
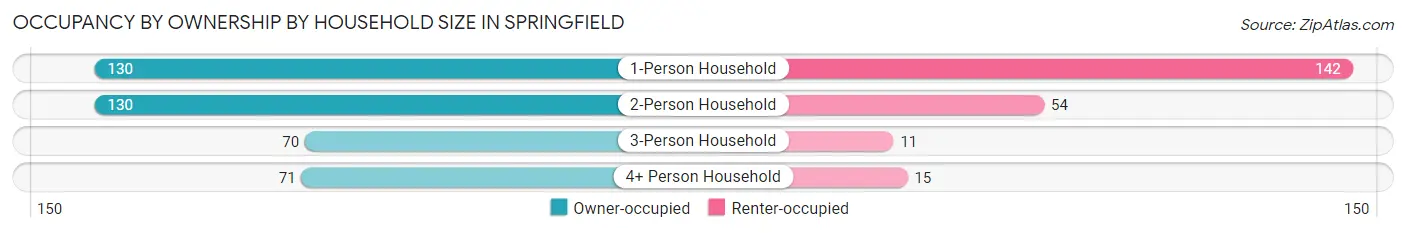
| Household Size | Owner-occupied | Renter-occupied |
| 1-Person Household | 130 (47.8%) | 142 (52.2%) |
| 2-Person Household | 130 (70.7%) | 54 (29.3%) |
| 3-Person Household | 70 (86.4%) | 11 (13.6%) |
| 4+ Person Household | 71 (82.6%) | 15 (17.4%) |
| Total Housing Units | 401 (64.4%) | 222 (35.6%) |
Occupancy by Educational Attainment in Springfield
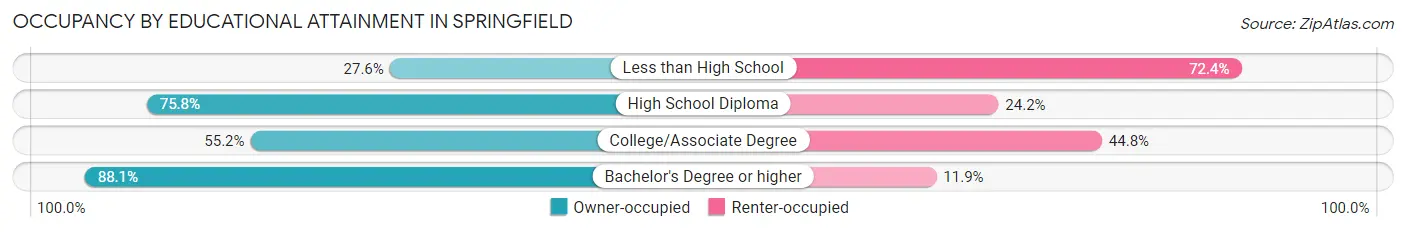
| Household Size | Owner-occupied | Renter-occupied |
| Less than High School | 21 (27.6%) | 55 (72.4%) |
| High School Diploma | 125 (75.8%) | 40 (24.2%) |
| College/Associate Degree | 137 (55.2%) | 111 (44.8%) |
| Bachelor's Degree or higher | 118 (88.1%) | 16 (11.9%) |
Occupancy by Age of Householder in Springfield
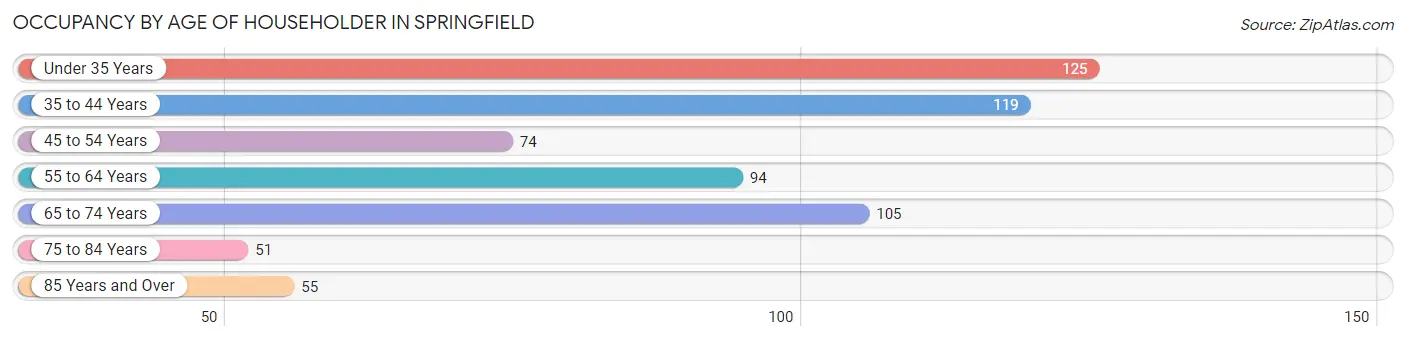
| Age Bracket | # Households | % Households |
| Under 35 Years | 125 | 20.1% |
| 35 to 44 Years | 119 | 19.1% |
| 45 to 54 Years | 74 | 11.9% |
| 55 to 64 Years | 94 | 15.1% |
| 65 to 74 Years | 105 | 16.9% |
| 75 to 84 Years | 51 | 8.2% |
| 85 Years and Over | 55 | 8.8% |
| Total | 623 | 100.0% |
Housing Finances in Springfield
Median Income by Occupancy in Springfield
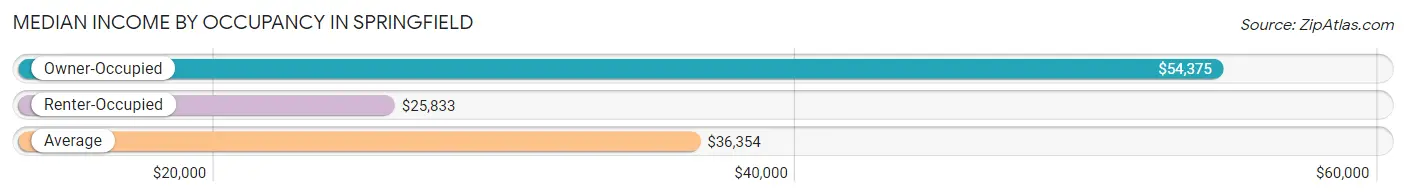
| Occupancy Type | # Households | Median Income |
| Owner-Occupied | 401 (64.4%) | $54,375 |
| Renter-Occupied | 222 (35.6%) | $25,833 |
| Average | 623 (100.0%) | $36,354 |
Occupancy by Householder Income Bracket in Springfield
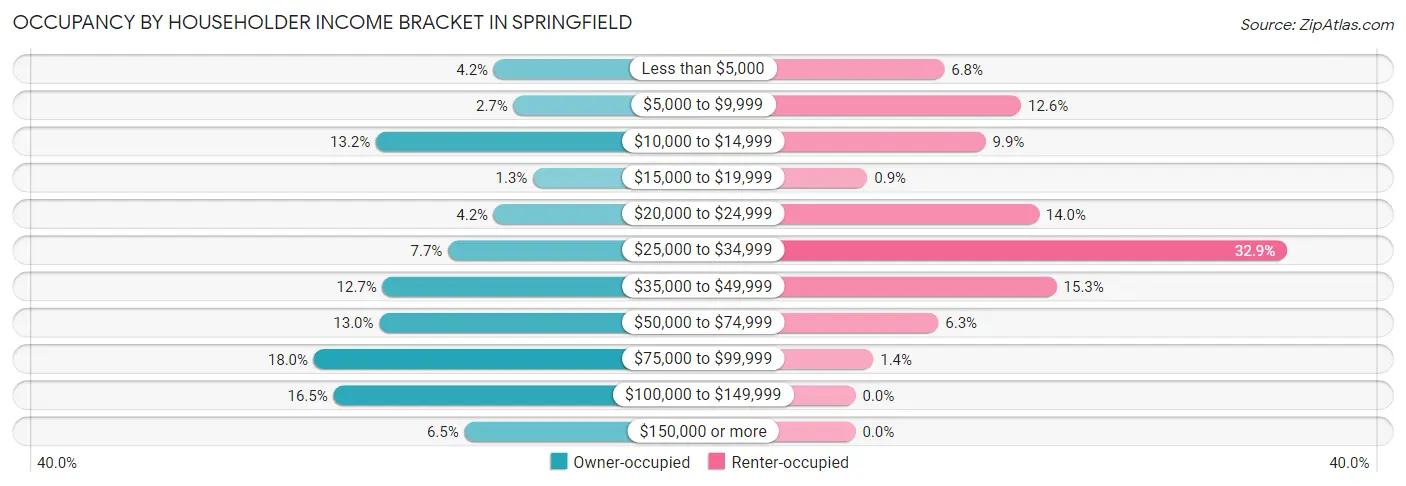
| Income Bracket | Owner-occupied | Renter-occupied |
| Less than $5,000 | 17 (4.2%) | 15 (6.8%) |
| $5,000 to $9,999 | 11 (2.7%) | 28 (12.6%) |
| $10,000 to $14,999 | 53 (13.2%) | 22 (9.9%) |
| $15,000 to $19,999 | 5 (1.3%) | 2 (0.9%) |
| $20,000 to $24,999 | 17 (4.2%) | 31 (14.0%) |
| $25,000 to $34,999 | 31 (7.7%) | 73 (32.9%) |
| $35,000 to $49,999 | 51 (12.7%) | 34 (15.3%) |
| $50,000 to $74,999 | 52 (13.0%) | 14 (6.3%) |
| $75,000 to $99,999 | 72 (18.0%) | 3 (1.3%) |
| $100,000 to $149,999 | 66 (16.5%) | 0 (0.0%) |
| $150,000 or more | 26 (6.5%) | 0 (0.0%) |
| Total | 401 (100.0%) | 222 (100.0%) |
Monthly Housing Cost Tiers in Springfield
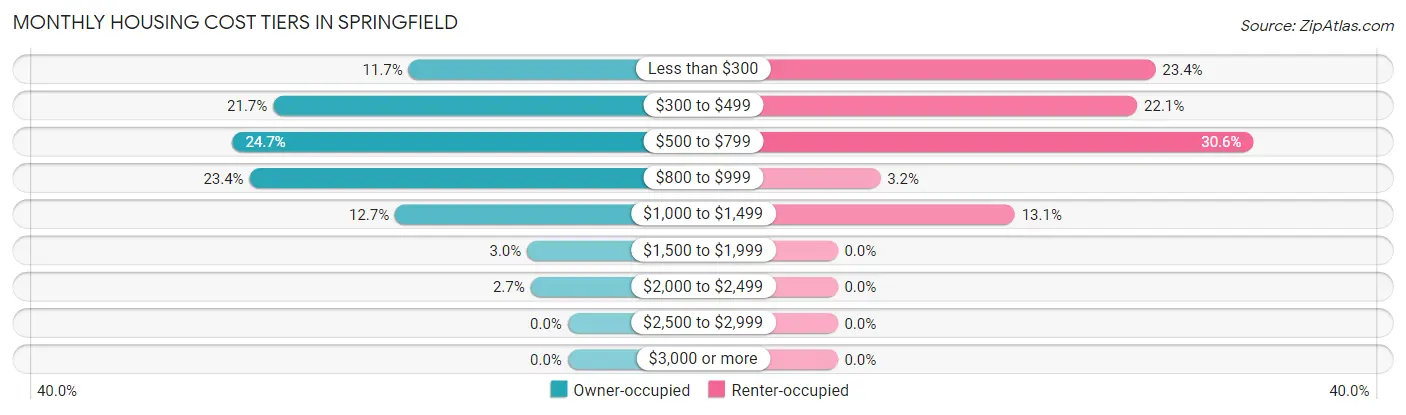
| Monthly Cost | Owner-occupied | Renter-occupied |
| Less than $300 | 47 (11.7%) | 52 (23.4%) |
| $300 to $499 | 87 (21.7%) | 49 (22.1%) |
| $500 to $799 | 99 (24.7%) | 68 (30.6%) |
| $800 to $999 | 94 (23.4%) | 7 (3.2%) |
| $1,000 to $1,499 | 51 (12.7%) | 29 (13.1%) |
| $1,500 to $1,999 | 12 (3.0%) | 0 (0.0%) |
| $2,000 to $2,499 | 11 (2.7%) | 0 (0.0%) |
| $2,500 to $2,999 | 0 (0.0%) | 0 (0.0%) |
| $3,000 or more | 0 (0.0%) | 0 (0.0%) |
| Total | 401 (100.0%) | 222 (100.0%) |
Physical Housing Characteristics in Springfield
Housing Structures in Springfield
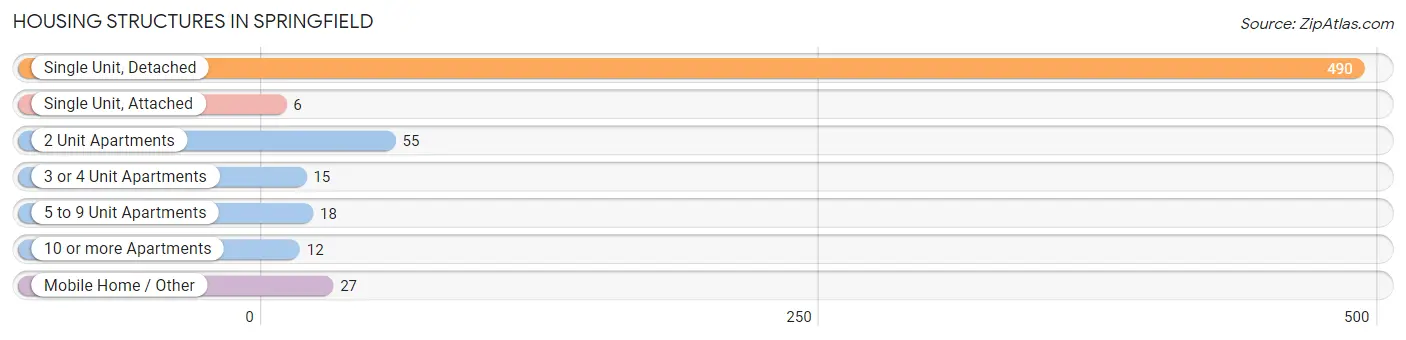
| Structure Type | # Housing Units | % Housing Units |
| Single Unit, Detached | 490 | 78.6% |
| Single Unit, Attached | 6 | 1.0% |
| 2 Unit Apartments | 55 | 8.8% |
| 3 or 4 Unit Apartments | 15 | 2.4% |
| 5 to 9 Unit Apartments | 18 | 2.9% |
| 10 or more Apartments | 12 | 1.9% |
| Mobile Home / Other | 27 | 4.3% |
| Total | 623 | 100.0% |
Housing Structures by Occupancy in Springfield
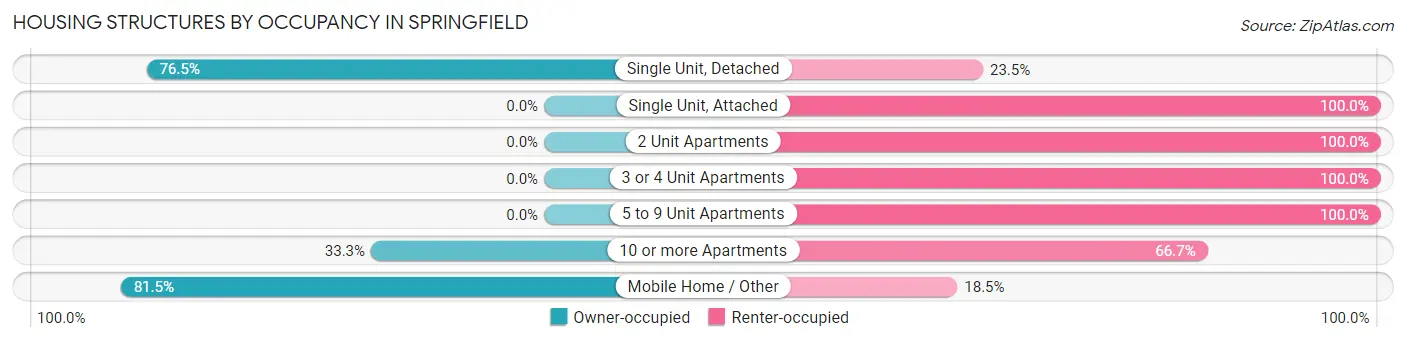
| Structure Type | Owner-occupied | Renter-occupied |
| Single Unit, Detached | 375 (76.5%) | 115 (23.5%) |
| Single Unit, Attached | 0 (0.0%) | 6 (100.0%) |
| 2 Unit Apartments | 0 (0.0%) | 55 (100.0%) |
| 3 or 4 Unit Apartments | 0 (0.0%) | 15 (100.0%) |
| 5 to 9 Unit Apartments | 0 (0.0%) | 18 (100.0%) |
| 10 or more Apartments | 4 (33.3%) | 8 (66.7%) |
| Mobile Home / Other | 22 (81.5%) | 5 (18.5%) |
| Total | 401 (64.4%) | 222 (35.6%) |
Housing Structures by Number of Rooms in Springfield
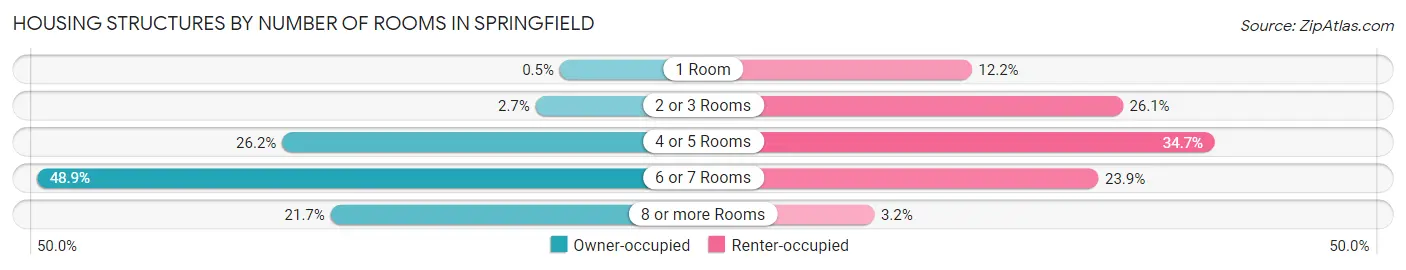
| Number of Rooms | Owner-occupied | Renter-occupied |
| 1 Room | 2 (0.5%) | 27 (12.2%) |
| 2 or 3 Rooms | 11 (2.7%) | 58 (26.1%) |
| 4 or 5 Rooms | 105 (26.2%) | 77 (34.7%) |
| 6 or 7 Rooms | 196 (48.9%) | 53 (23.9%) |
| 8 or more Rooms | 87 (21.7%) | 7 (3.2%) |
| Total | 401 (100.0%) | 222 (100.0%) |
Housing Structure by Heating Type in Springfield
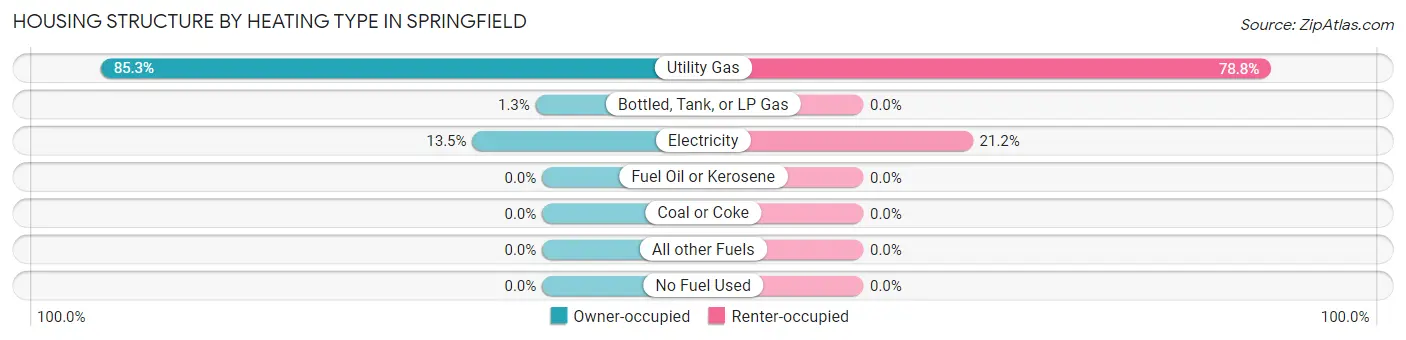
| Heating Type | Owner-occupied | Renter-occupied |
| Utility Gas | 342 (85.3%) | 175 (78.8%) |
| Bottled, Tank, or LP Gas | 5 (1.3%) | 0 (0.0%) |
| Electricity | 54 (13.5%) | 47 (21.2%) |
| Fuel Oil or Kerosene | 0 (0.0%) | 0 (0.0%) |
| Coal or Coke | 0 (0.0%) | 0 (0.0%) |
| All other Fuels | 0 (0.0%) | 0 (0.0%) |
| No Fuel Used | 0 (0.0%) | 0 (0.0%) |
| Total | 401 (100.0%) | 222 (100.0%) |
Household Vehicle Usage in Springfield
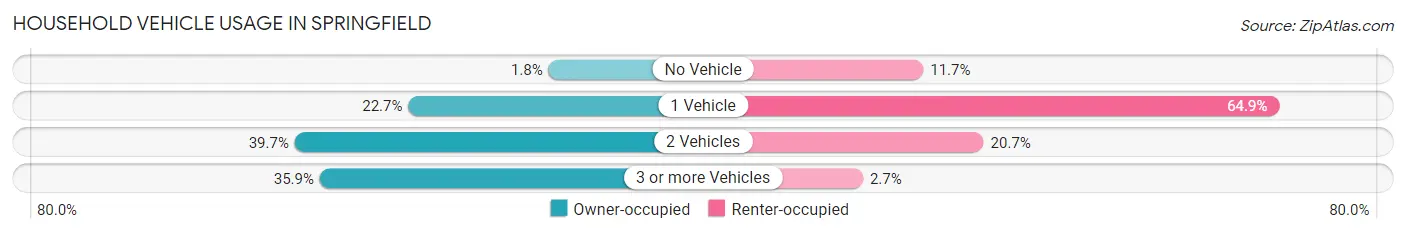
| Vehicles per Household | Owner-occupied | Renter-occupied |
| No Vehicle | 7 (1.8%) | 26 (11.7%) |
| 1 Vehicle | 91 (22.7%) | 144 (64.9%) |
| 2 Vehicles | 159 (39.7%) | 46 (20.7%) |
| 3 or more Vehicles | 144 (35.9%) | 6 (2.7%) |
| Total | 401 (100.0%) | 222 (100.0%) |
Real Estate & Mortgages in Springfield
Real Estate and Mortgage Overview in Springfield
| Characteristic | Without Mortgage | With Mortgage |
| Housing Units | 226 | 175 |
| Median Property Value | $123,800 | $117,800 |
| Median Household Income | $45,179 | $17 |
| Monthly Housing Costs | $465 | $0 |
| Real Estate Taxes | $415 | $17 |
Property Value by Mortgage Status in Springfield
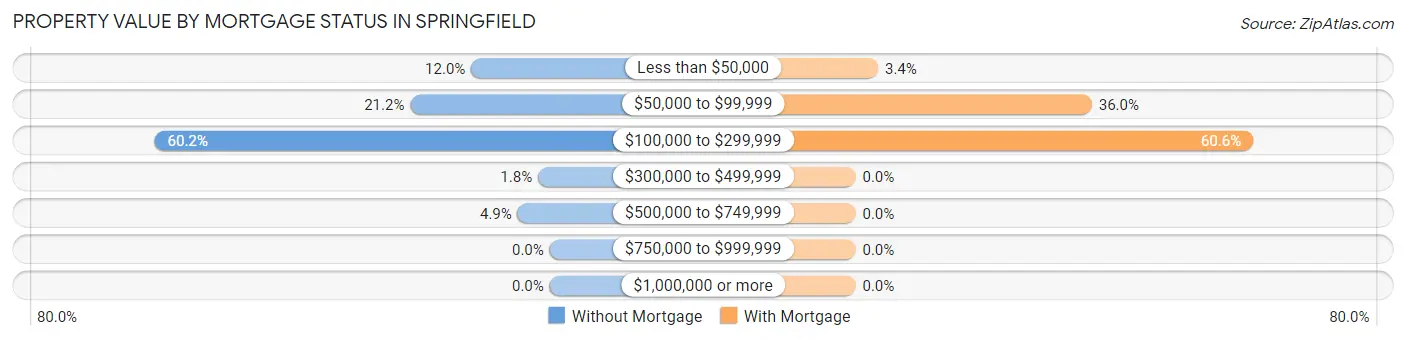
| Property Value | Without Mortgage | With Mortgage |
| Less than $50,000 | 27 (11.9%) | 6 (3.4%) |
| $50,000 to $99,999 | 48 (21.2%) | 63 (36.0%) |
| $100,000 to $299,999 | 136 (60.2%) | 106 (60.6%) |
| $300,000 to $499,999 | 4 (1.8%) | 0 (0.0%) |
| $500,000 to $749,999 | 11 (4.9%) | 0 (0.0%) |
| $750,000 to $999,999 | 0 (0.0%) | 0 (0.0%) |
| $1,000,000 or more | 0 (0.0%) | 0 (0.0%) |
| Total | 226 (100.0%) | 175 (100.0%) |
Household Income by Mortgage Status in Springfield
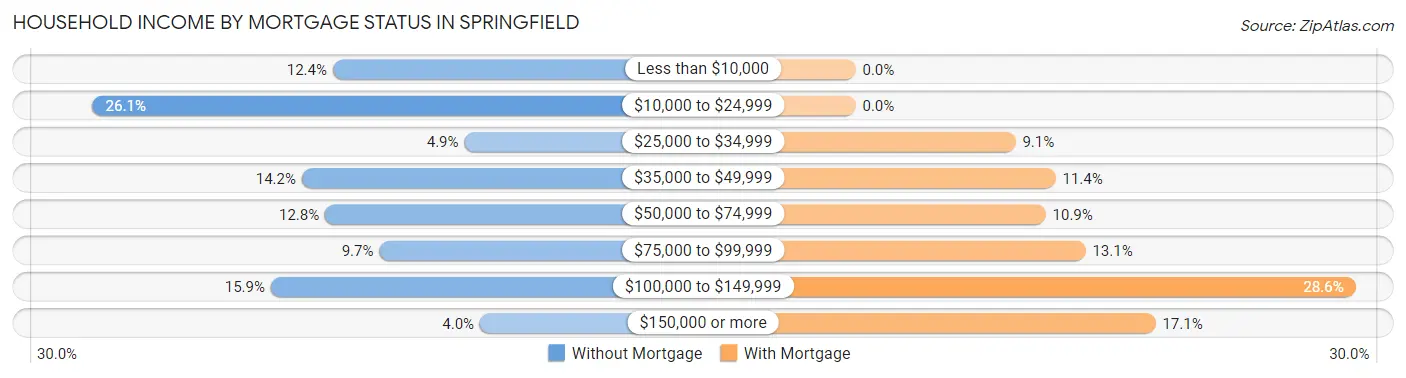
| Household Income | Without Mortgage | With Mortgage |
| Less than $10,000 | 28 (12.4%) | 0 (0.0%) |
| $10,000 to $24,999 | 59 (26.1%) | 0 (0.0%) |
| $25,000 to $34,999 | 11 (4.9%) | 16 (9.1%) |
| $35,000 to $49,999 | 32 (14.2%) | 20 (11.4%) |
| $50,000 to $74,999 | 29 (12.8%) | 19 (10.9%) |
| $75,000 to $99,999 | 22 (9.7%) | 23 (13.1%) |
| $100,000 to $149,999 | 36 (15.9%) | 50 (28.6%) |
| $150,000 or more | 9 (4.0%) | 30 (17.1%) |
| Total | 226 (100.0%) | 175 (100.0%) |
Property Value to Household Income Ratio in Springfield
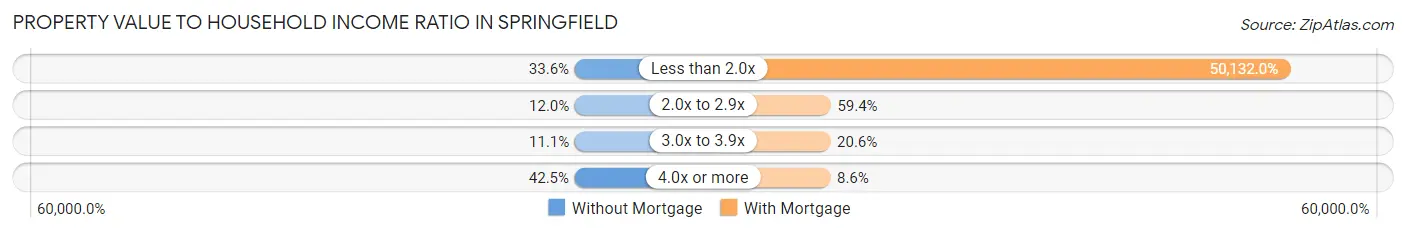
| Value-to-Income Ratio | Without Mortgage | With Mortgage |
| Less than 2.0x | 76 (33.6%) | 87,731 (50,132.0%) |
| 2.0x to 2.9x | 27 (11.9%) | 104 (59.4%) |
| 3.0x to 3.9x | 25 (11.1%) | 36 (20.6%) |
| 4.0x or more | 96 (42.5%) | 15 (8.6%) |
| Total | 226 (100.0%) | 175 (100.0%) |
Real Estate Taxes by Mortgage Status in Springfield
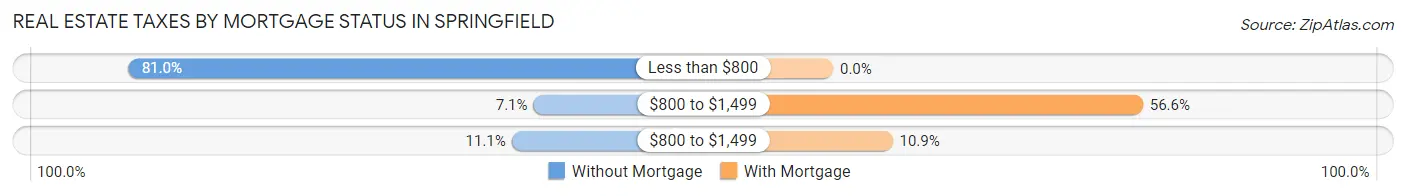
| Property Taxes | Without Mortgage | With Mortgage |
| Less than $800 | 183 (81.0%) | 0 (0.0%) |
| $800 to $1,499 | 16 (7.1%) | 99 (56.6%) |
| $800 to $1,499 | 25 (11.1%) | 19 (10.9%) |
| Total | 226 (100.0%) | 175 (100.0%) |
Health & Disability in Springfield
Health Insurance Coverage by Age in Springfield
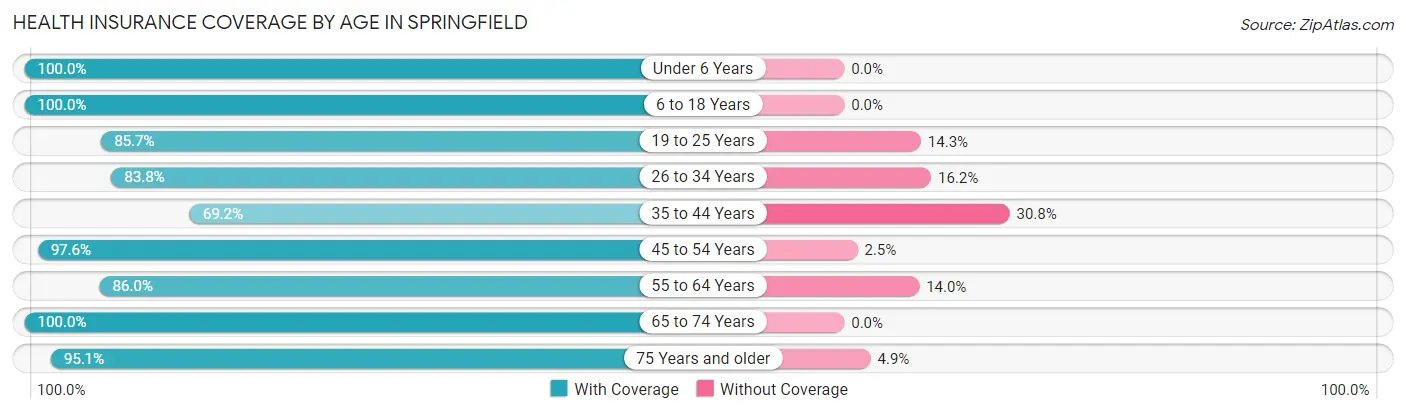
| Age Bracket | With Coverage | Without Coverage |
| Under 6 Years | 82 (100.0%) | 0 (0.0%) |
| 6 to 18 Years | 231 (100.0%) | 0 (0.0%) |
| 19 to 25 Years | 90 (85.7%) | 15 (14.3%) |
| 26 to 34 Years | 88 (83.8%) | 17 (16.2%) |
| 35 to 44 Years | 119 (69.2%) | 53 (30.8%) |
| 45 to 54 Years | 159 (97.6%) | 4 (2.5%) |
| 55 to 64 Years | 117 (86.0%) | 19 (14.0%) |
| 65 to 74 Years | 149 (100.0%) | 0 (0.0%) |
| 75 Years and older | 136 (95.1%) | 7 (4.9%) |
| Total | 1,171 (91.1%) | 115 (8.9%) |
Health Insurance Coverage by Citizenship Status in Springfield
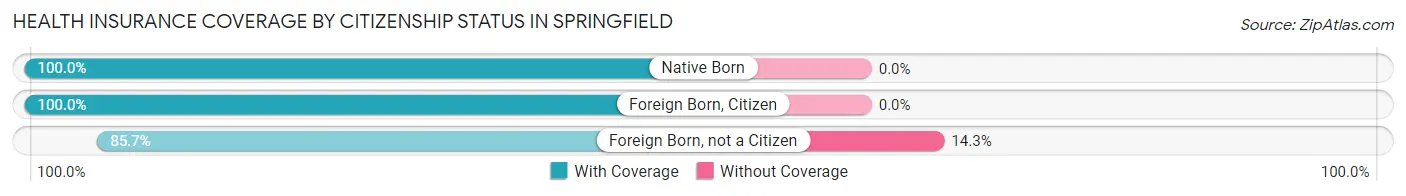
| Citizenship Status | With Coverage | Without Coverage |
| Native Born | 82 (100.0%) | 0 (0.0%) |
| Foreign Born, Citizen | 231 (100.0%) | 0 (0.0%) |
| Foreign Born, not a Citizen | 90 (85.7%) | 15 (14.3%) |
Health Insurance Coverage by Household Income in Springfield
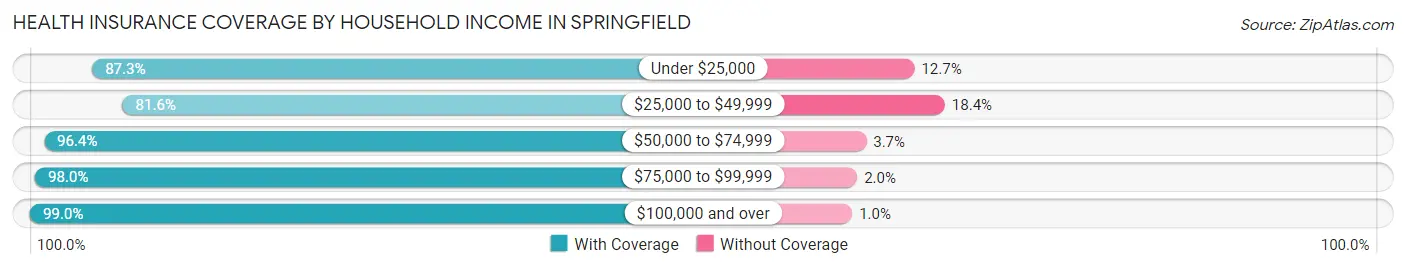
| Household Income | With Coverage | Without Coverage |
| Under $25,000 | 248 (87.3%) | 36 (12.7%) |
| $25,000 to $49,999 | 293 (81.6%) | 66 (18.4%) |
| $50,000 to $74,999 | 185 (96.4%) | 7 (3.6%) |
| $75,000 to $99,999 | 150 (98.0%) | 3 (2.0%) |
| $100,000 and over | 295 (99.0%) | 3 (1.0%) |
Public vs Private Health Insurance Coverage by Age in Springfield
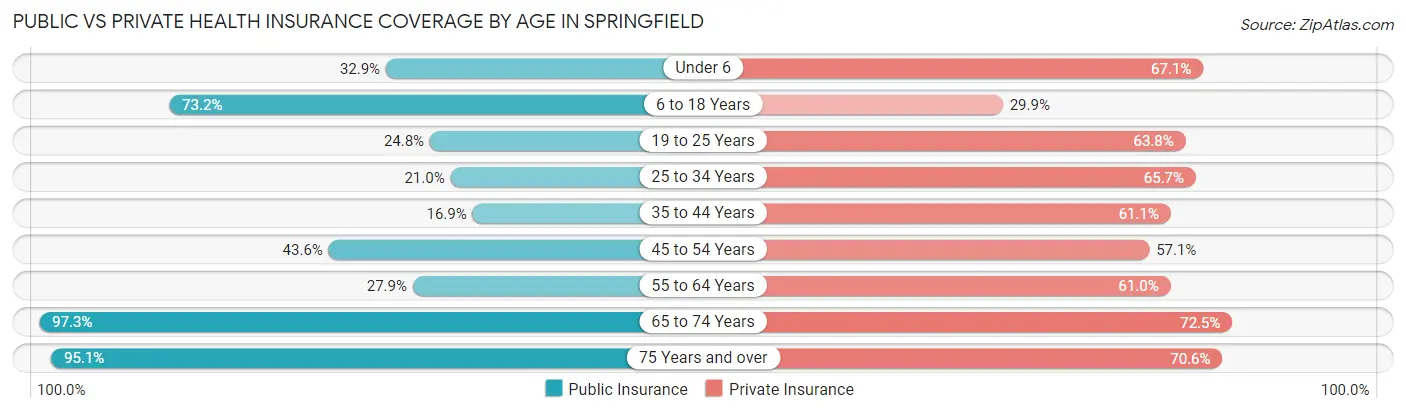
| Age Bracket | Public Insurance | Private Insurance |
| Under 6 | 27 (32.9%) | 55 (67.1%) |
| 6 to 18 Years | 169 (73.2%) | 69 (29.9%) |
| 19 to 25 Years | 26 (24.8%) | 67 (63.8%) |
| 25 to 34 Years | 22 (20.9%) | 69 (65.7%) |
| 35 to 44 Years | 29 (16.9%) | 105 (61.1%) |
| 45 to 54 Years | 71 (43.6%) | 93 (57.1%) |
| 55 to 64 Years | 38 (27.9%) | 83 (61.0%) |
| 65 to 74 Years | 145 (97.3%) | 108 (72.5%) |
| 75 Years and over | 136 (95.1%) | 101 (70.6%) |
| Total | 663 (51.6%) | 750 (58.3%) |
Disability Status by Sex by Age in Springfield
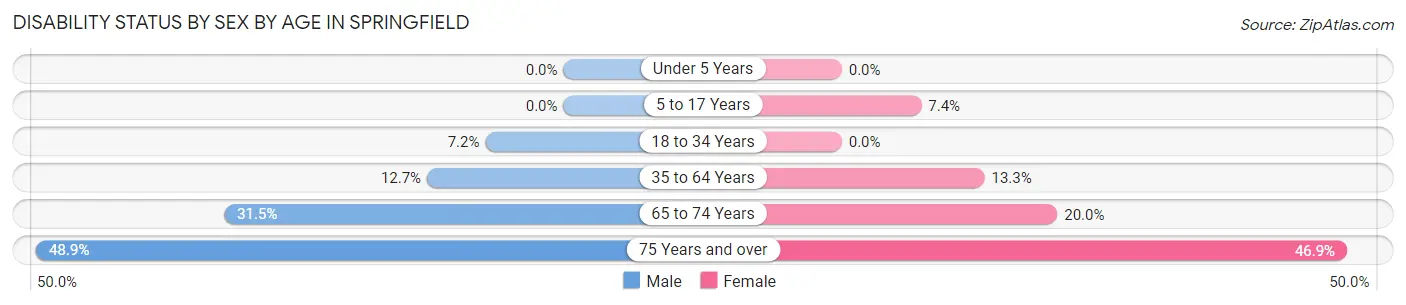
| Age Bracket | Male | Female |
| Under 5 Years | 0 (0.0%) | 0 (0.0%) |
| 5 to 17 Years | 0 (0.0%) | 9 (7.4%) |
| 18 to 34 Years | 11 (7.2%) | 0 (0.0%) |
| 35 to 64 Years | 30 (12.7%) | 31 (13.3%) |
| 65 to 74 Years | 17 (31.5%) | 19 (20.0%) |
| 75 Years and over | 23 (48.9%) | 45 (46.9%) |
Disability Class by Sex by Age in Springfield
Disability Class: Hearing Difficulty
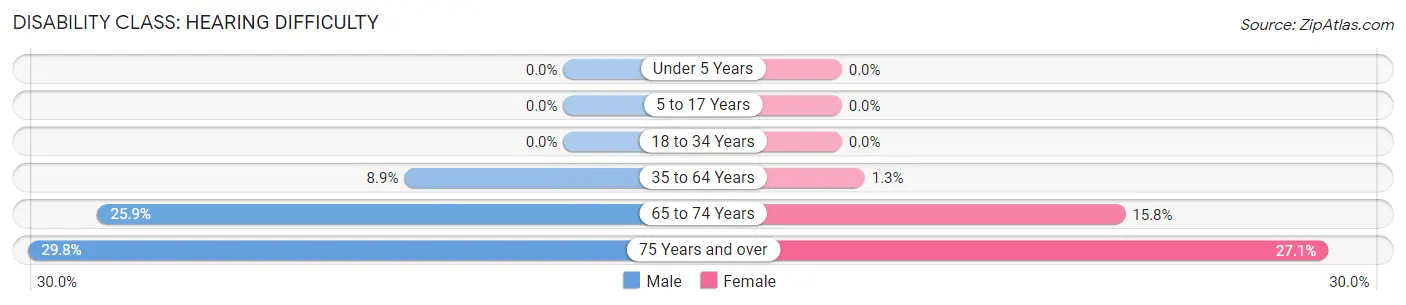
| Age Bracket | Male | Female |
| Under 5 Years | 0 (0.0%) | 0 (0.0%) |
| 5 to 17 Years | 0 (0.0%) | 0 (0.0%) |
| 18 to 34 Years | 0 (0.0%) | 0 (0.0%) |
| 35 to 64 Years | 21 (8.9%) | 3 (1.3%) |
| 65 to 74 Years | 14 (25.9%) | 15 (15.8%) |
| 75 Years and over | 14 (29.8%) | 26 (27.1%) |
Disability Class: Vision Difficulty
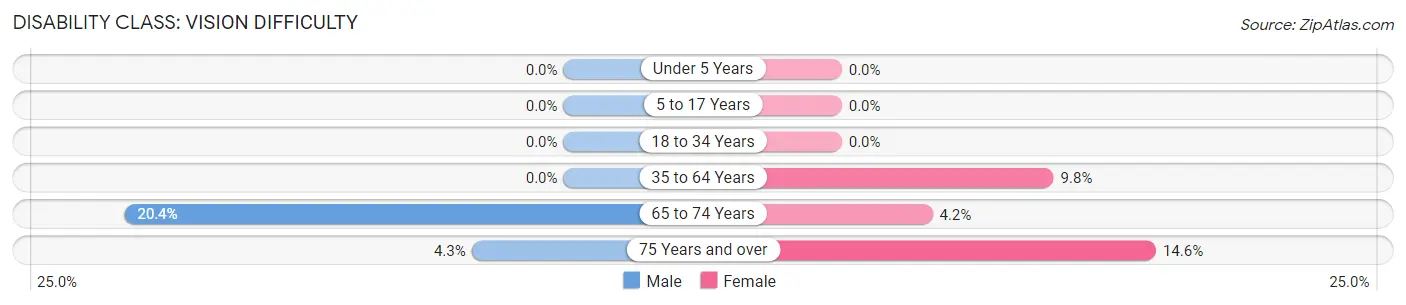
| Age Bracket | Male | Female |
| Under 5 Years | 0 (0.0%) | 0 (0.0%) |
| 5 to 17 Years | 0 (0.0%) | 0 (0.0%) |
| 18 to 34 Years | 0 (0.0%) | 0 (0.0%) |
| 35 to 64 Years | 0 (0.0%) | 23 (9.8%) |
| 65 to 74 Years | 11 (20.4%) | 4 (4.2%) |
| 75 Years and over | 2 (4.3%) | 14 (14.6%) |
Disability Class: Cognitive Difficulty
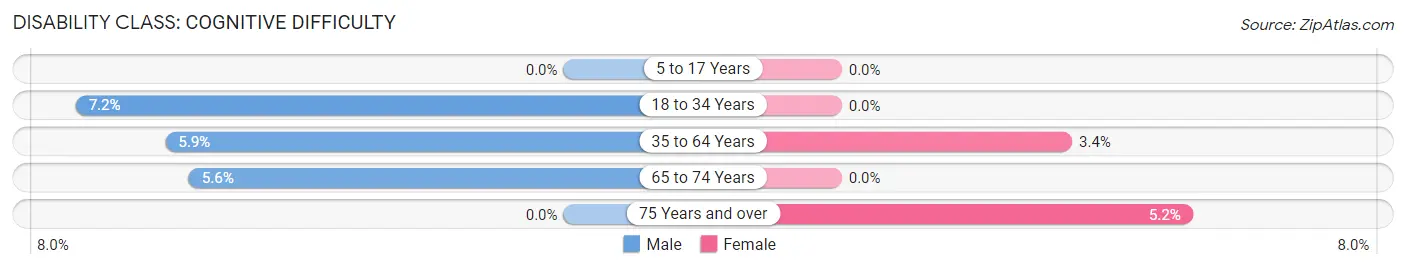
| Age Bracket | Male | Female |
| 5 to 17 Years | 0 (0.0%) | 0 (0.0%) |
| 18 to 34 Years | 11 (7.2%) | 0 (0.0%) |
| 35 to 64 Years | 14 (5.9%) | 8 (3.4%) |
| 65 to 74 Years | 3 (5.6%) | 0 (0.0%) |
| 75 Years and over | 0 (0.0%) | 5 (5.2%) |
Disability Class: Ambulatory Difficulty
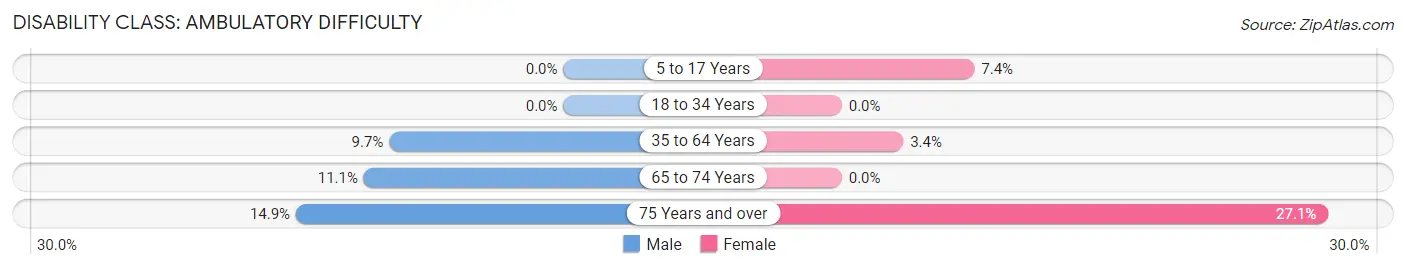
| Age Bracket | Male | Female |
| 5 to 17 Years | 0 (0.0%) | 9 (7.4%) |
| 18 to 34 Years | 0 (0.0%) | 0 (0.0%) |
| 35 to 64 Years | 23 (9.7%) | 8 (3.4%) |
| 65 to 74 Years | 6 (11.1%) | 0 (0.0%) |
| 75 Years and over | 7 (14.9%) | 26 (27.1%) |
Disability Class: Self-Care Difficulty
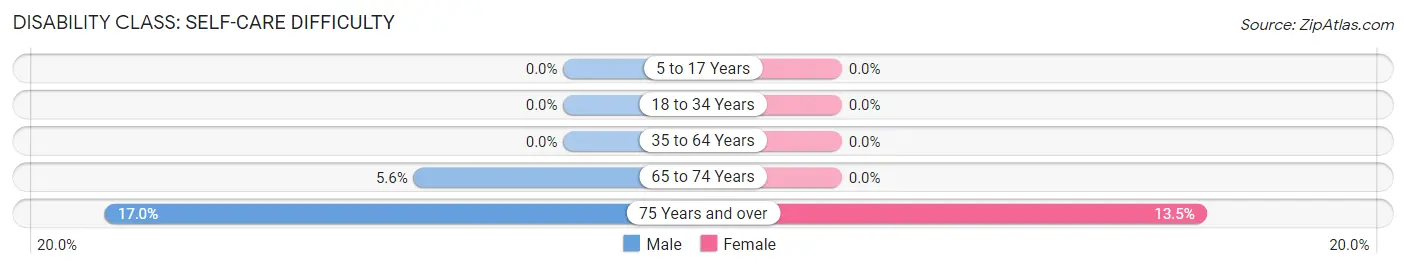
| Age Bracket | Male | Female |
| 5 to 17 Years | 0 (0.0%) | 0 (0.0%) |
| 18 to 34 Years | 0 (0.0%) | 0 (0.0%) |
| 35 to 64 Years | 0 (0.0%) | 0 (0.0%) |
| 65 to 74 Years | 3 (5.6%) | 0 (0.0%) |
| 75 Years and over | 8 (17.0%) | 13 (13.5%) |
Technology Access in Springfield
Computing Device Access in Springfield
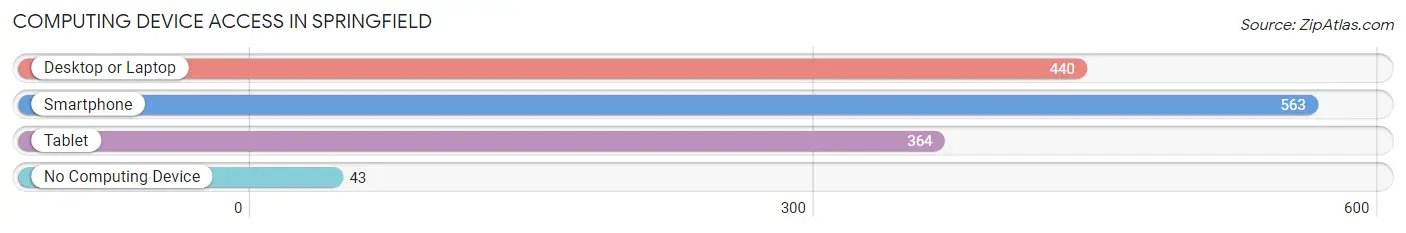
| Device Type | # Households | % Households |
| Desktop or Laptop | 440 | 70.6% |
| Smartphone | 563 | 90.4% |
| Tablet | 364 | 58.4% |
| No Computing Device | 43 | 6.9% |
| Total | 623 | 100.0% |
Internet Access in Springfield
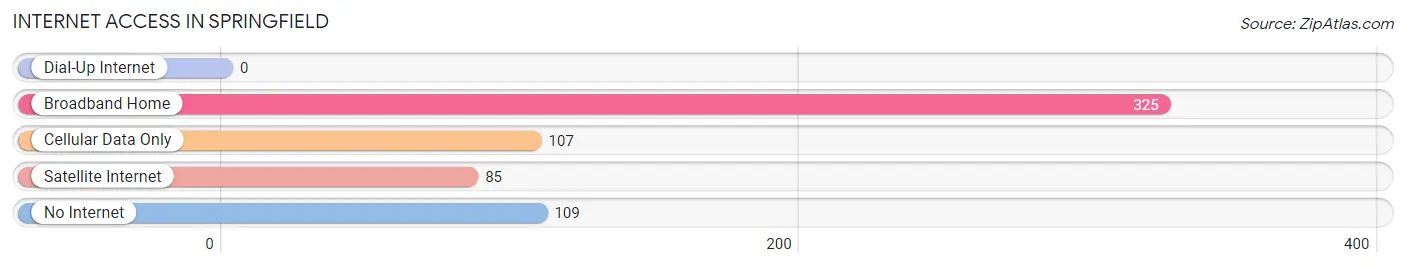
| Internet Type | # Households | % Households |
| Dial-Up Internet | 0 | 0.0% |
| Broadband Home | 325 | 52.2% |
| Cellular Data Only | 107 | 17.2% |
| Satellite Internet | 85 | 13.6% |
| No Internet | 109 | 17.5% |
| Total | 623 | 100.0% |
Springfield Summary
Springfield, Colorado is a small town located in Baca County in the southeastern corner of the state. It is situated on the Arkansas River, near the Oklahoma border. The town was founded in 1881 and has a population of approximately 1,000 people.
History
Springfield was founded in 1881 by a group of settlers from Springfield, Missouri. The town was named after the Missouri city, and the settlers brought with them the same values and traditions. The town was originally a farming community, and the settlers grew wheat, corn, and other crops. The town also had a small sawmill and a blacksmith shop.
In the early 1900s, the town began to grow and prosper. The railroad came to town in 1906, and the town became a shipping point for cattle, grain, and other goods. The town also had a hotel, a bank, and a post office.
In the 1920s, the town began to decline. The railroad stopped running, and the town's economy suffered. The population decreased, and the town became a ghost town.
In the 1950s, the town began to revive. The population increased, and the town began to attract new businesses. The town also became a popular tourist destination, and the town's economy began to improve.
Geography
Springfield is located in Baca County in the southeastern corner of Colorado. The town is situated on the Arkansas River, near the Oklahoma border. The town is surrounded by rolling hills and prairies. The town is located in a semi-arid climate, and the average annual precipitation is about 15 inches.
Economy
The economy of Springfield is largely based on agriculture. The town is home to several farms, and the town's main crops are wheat, corn, and hay. The town also has a small sawmill and a blacksmith shop.
The town also has a few small businesses, including a grocery store, a hardware store, and a few restaurants. The town also has a few tourist attractions, including a museum and a historic theater.
Demographics
As of the 2010 census, the population of Springfield was 1,000 people. The town is predominantly white, with about 95% of the population being white. The town also has a small Hispanic population, with about 5% of the population being Hispanic. The median household income in the town is about $35,000.
Common Questions
What is Per Capita Income in Springfield?
Per Capita income in Springfield is $26,127.
What is the Median Family Income in Springfield?
Median Family Income in Springfield is $60,455.
What is the Median Household income in Springfield?
Median Household Income in Springfield is $36,354.
What is Income or Wage Gap in Springfield?
Income or Wage Gap in Springfield is 2.5%.
Women in Springfield earn 97.5 cents for every dollar earned by a man.
What is Family Income Deficit in Springfield?
Family Income Deficit in Springfield is $8,126.
Families that are below poverty line in Springfield earn $8,126 less on average than the poverty threshold level.
What is Inequality or Gini Index in Springfield?
Inequality or Gini Index in Springfield is 0.50.
What is the Total Population of Springfield?
Total Population of Springfield is 1,357.
What is the Total Male Population of Springfield?
Total Male Population of Springfield is 684.
What is the Total Female Population of Springfield?
Total Female Population of Springfield is 673.
What is the Ratio of Males per 100 Females in Springfield?
There are 101.63 Males per 100 Females in Springfield.
What is the Ratio of Females per 100 Males in Springfield?
There are 98.39 Females per 100 Males in Springfield.
What is the Median Population Age in Springfield?
Median Population Age in Springfield is 43.4 Years.
What is the Average Family Size in Springfield
Average Family Size in Springfield is 2.9 People.
What is the Average Household Size in Springfield
Average Household Size in Springfield is 2.1 People.
How Large is the Labor Force in Springfield?
There are 568 People in the Labor Forcein in Springfield.
What is the Percentage of People in the Labor Force in Springfield?
53.3% of People are in the Labor Force in Springfield.
What is the Unemployment Rate in Springfield?
Unemployment Rate in Springfield is 2.3%.