South Fork, CO Map & Demographics
South Fork Map
South Fork Overview
$45,949
PER CAPITA INCOME
$72,232
AVG FAMILY INCOME
$70,804
AVG HOUSEHOLD INCOME
13.2%
WAGE / INCOME GAP [ % ]
86.8¢/ $1
WAGE / INCOME GAP [ $ ]
0.43
INEQUALITY / GINI INDEX
458
TOTAL POPULATION
242
MALE POPULATION
216
FEMALE POPULATION
112.04
MALES / 100 FEMALES
89.26
FEMALES / 100 MALES
59.3
MEDIAN AGE
2.4
AVG FAMILY SIZE
2.1
AVG HOUSEHOLD SIZE
180
LABOR FORCE [ PEOPLE ]
44.2%
PERCENT IN LABOR FORCE
8.3%
UNEMPLOYMENT RATE
South Fork Zip Codes
South Fork Area Codes
Income in South Fork
Income Overview in South Fork
Per Capita Income in South Fork is $45,949, while median incomes of families and households are $72,232 and $70,804 respectively.
| Characteristic | Number | Measure |
| Per Capita Income | 458 | $45,949 |
| Median Family Income | 139 | $72,232 |
| Mean Family Income | 139 | $92,830 |
| Median Household Income | 213 | $70,804 |
| Mean Household Income | 213 | $95,365 |
| Income Deficit | 139 | $0 |
| Wage / Income Gap (%) | 458 | 13.20% |
| Wage / Income Gap ($) | 458 | 86.80¢ per $1 |
| Gini / Inequality Index | 458 | 0.43 |
Earnings by Sex in South Fork
Average Earnings in South Fork are $42,917, $43,021 for men and $37,344 for women, a difference of 13.2%.
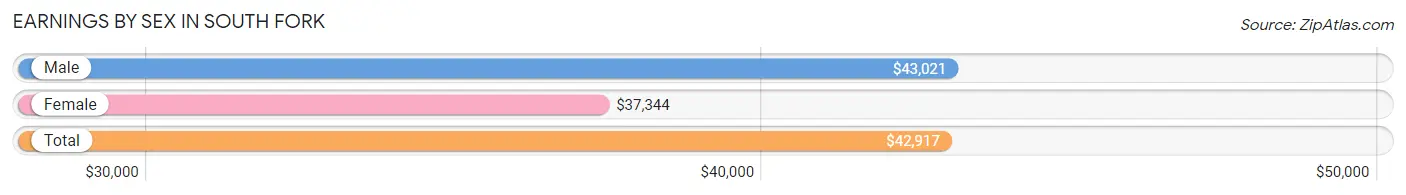
| Sex | Number | Average Earnings |
| Male | 127 (65.5%) | $43,021 |
| Female | 67 (34.5%) | $37,344 |
| Total | 194 (100.0%) | $42,917 |
Earnings by Sex by Income Bracket in South Fork
The most common earnings brackets in South Fork are $2,499 or less for men (21 | 16.5%) and $75,000 to $99,999 for women (13 | 19.4%).
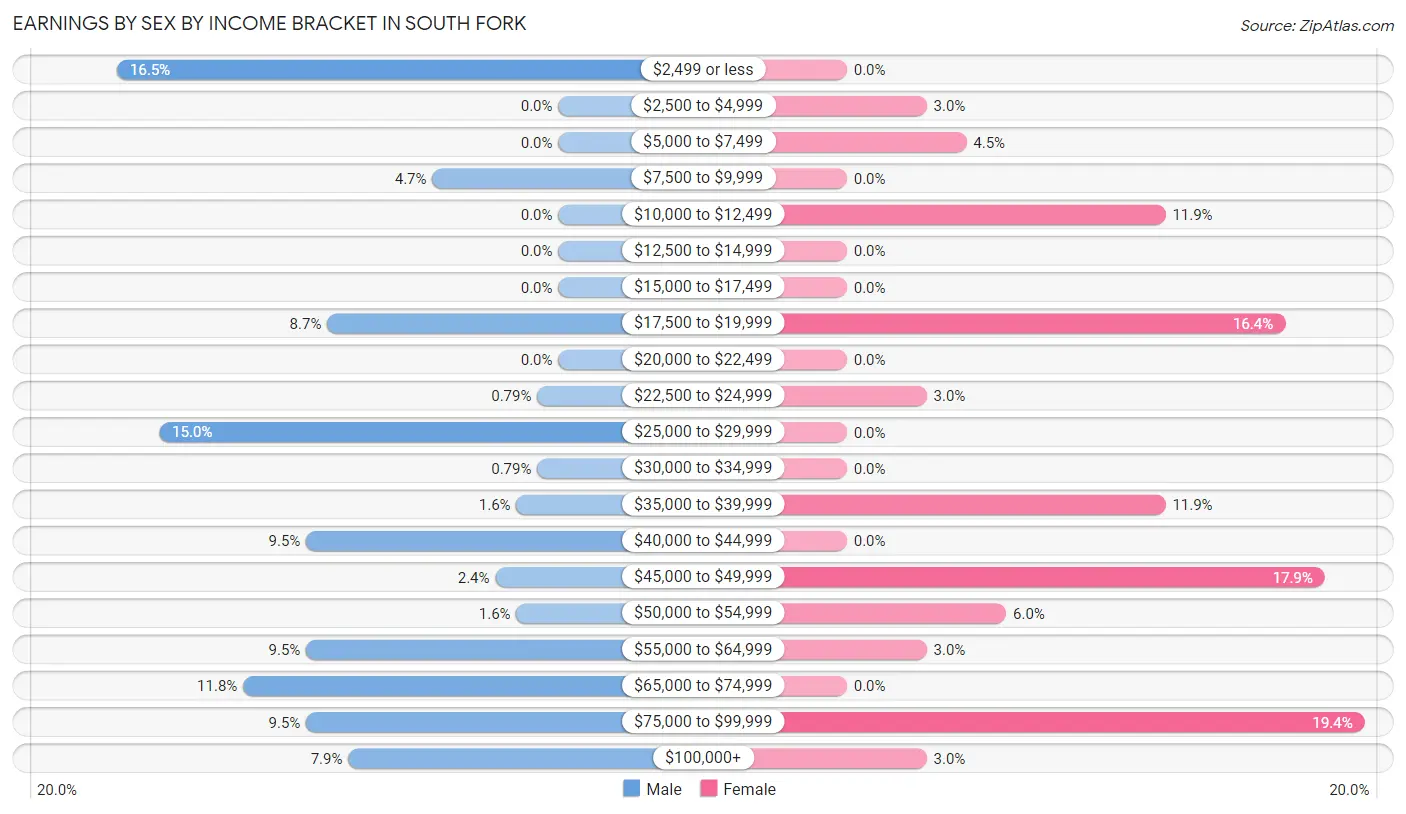
| Income | Male | Female |
| $2,499 or less | 21 (16.5%) | 0 (0.0%) |
| $2,500 to $4,999 | 0 (0.0%) | 2 (3.0%) |
| $5,000 to $7,499 | 0 (0.0%) | 3 (4.5%) |
| $7,500 to $9,999 | 6 (4.7%) | 0 (0.0%) |
| $10,000 to $12,499 | 0 (0.0%) | 8 (11.9%) |
| $12,500 to $14,999 | 0 (0.0%) | 0 (0.0%) |
| $15,000 to $17,499 | 0 (0.0%) | 0 (0.0%) |
| $17,500 to $19,999 | 11 (8.7%) | 11 (16.4%) |
| $20,000 to $22,499 | 0 (0.0%) | 0 (0.0%) |
| $22,500 to $24,999 | 1 (0.8%) | 2 (3.0%) |
| $25,000 to $29,999 | 19 (15.0%) | 0 (0.0%) |
| $30,000 to $34,999 | 1 (0.8%) | 0 (0.0%) |
| $35,000 to $39,999 | 2 (1.6%) | 8 (11.9%) |
| $40,000 to $44,999 | 12 (9.5%) | 0 (0.0%) |
| $45,000 to $49,999 | 3 (2.4%) | 12 (17.9%) |
| $50,000 to $54,999 | 2 (1.6%) | 4 (6.0%) |
| $55,000 to $64,999 | 12 (9.5%) | 2 (3.0%) |
| $65,000 to $74,999 | 15 (11.8%) | 0 (0.0%) |
| $75,000 to $99,999 | 12 (9.5%) | 13 (19.4%) |
| $100,000+ | 10 (7.9%) | 2 (3.0%) |
| Total | 127 (100.0%) | 67 (100.0%) |
Earnings by Sex by Educational Attainment in South Fork
Average earnings in South Fork are $44,792 for men and $36,250 for women, a difference of 19.1%. Men with an educational attainment of bachelor's degree enjoy the highest average annual earnings of $64,844, while those with bachelor's degree education earn the least with $64,844. Women with an educational attainment of college or associate's degree earn the most with the average annual earnings of $35,781, while those with college or associate's degree education have the smallest earnings of $35,781.
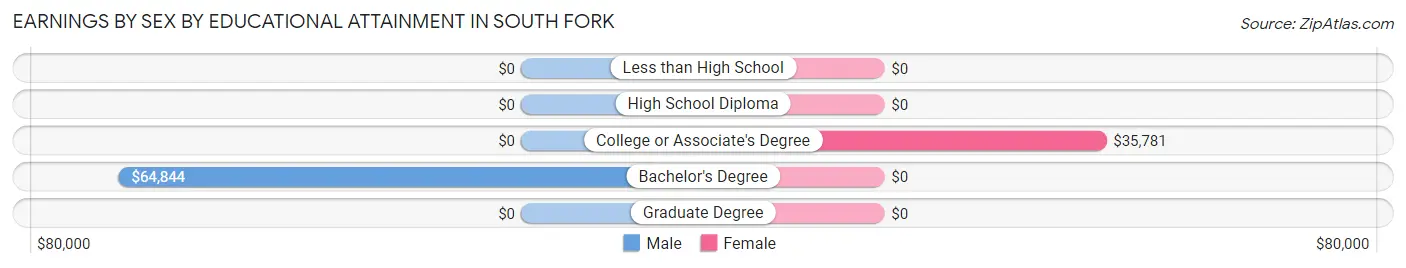
| Educational Attainment | Male Income | Female Income |
| Less than High School | - | - |
| High School Diploma | - | - |
| College or Associate's Degree | - | - |
| Bachelor's Degree | $64,844 | $0 |
| Graduate Degree | - | - |
| Total | $44,792 | $36,250 |
Family Income in South Fork
Family Income Brackets in South Fork
According to the South Fork family income data, there are 42 families falling into the $150,000 to $199,999 income range, which is the most common income bracket and makes up 30.2% of all families.
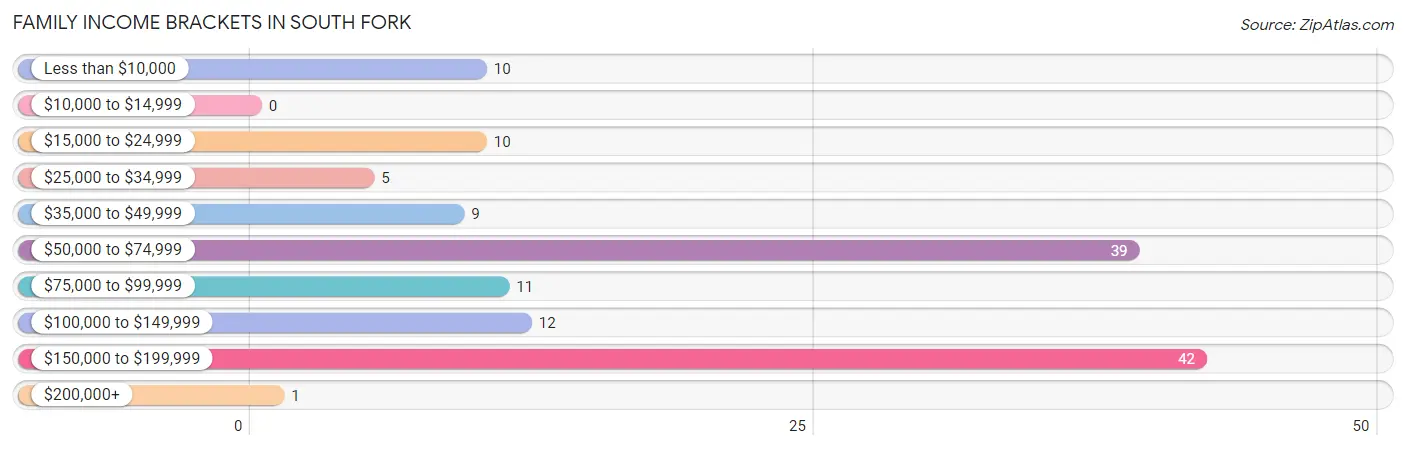
| Income Bracket | # Families | % Families |
| Less than $10,000 | 10 | 7.2% |
| $10,000 to $14,999 | 0 | 0.0% |
| $15,000 to $24,999 | 10 | 7.2% |
| $25,000 to $34,999 | 5 | 3.6% |
| $35,000 to $49,999 | 9 | 6.5% |
| $50,000 to $74,999 | 39 | 28.1% |
| $75,000 to $99,999 | 11 | 7.9% |
| $100,000 to $149,999 | 12 | 8.6% |
| $150,000 to $199,999 | 42 | 30.2% |
| $200,000+ | 1 | 0.7% |
Family Income by Famaliy Size in South Fork
3-person families (12 | 8.6%) account for the highest median family income in South Fork with $151,667 per family, while 3-person families (12 | 8.6%) have the highest median income of $50,556 per family member.
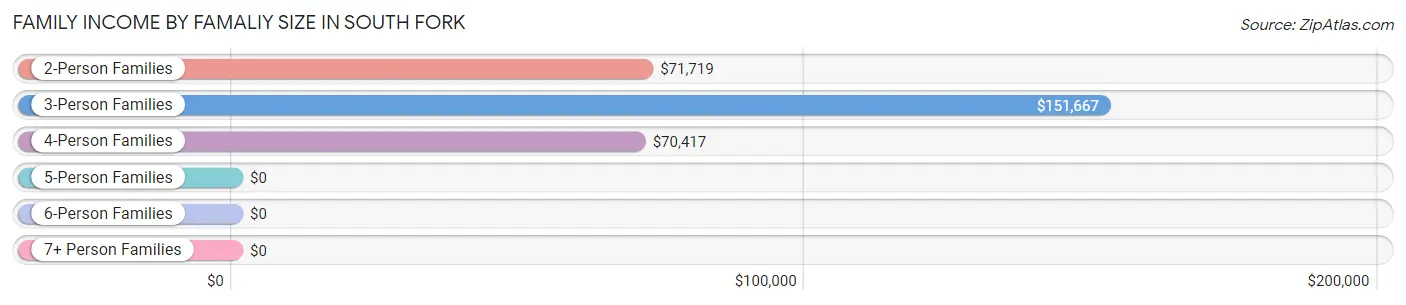
| Income Bracket | # Families | Median Income |
| 2-Person Families | 113 (81.3%) | $71,719 |
| 3-Person Families | 12 (8.6%) | $151,667 |
| 4-Person Families | 14 (10.1%) | $70,417 |
| 5-Person Families | 0 (0.0%) | $0 |
| 6-Person Families | 0 (0.0%) | $0 |
| 7+ Person Families | 0 (0.0%) | $0 |
| Total | 139 (100.0%) | $72,232 |
Family Income by Number of Earners in South Fork
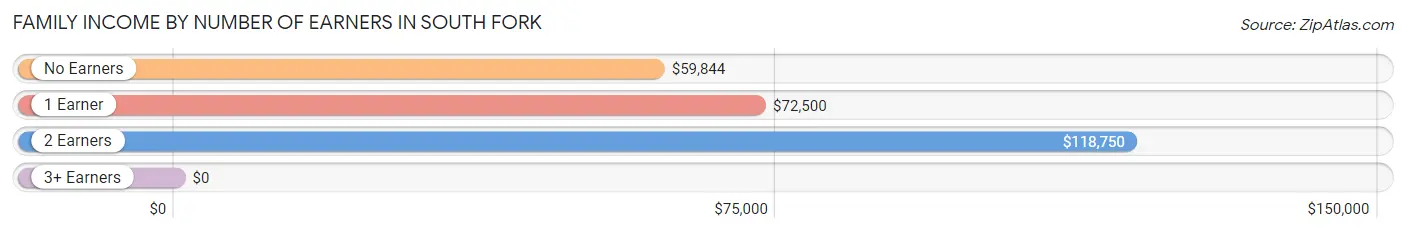
| Number of Earners | # Families | Median Income |
| No Earners | 53 (38.1%) | $59,844 |
| 1 Earner | 52 (37.4%) | $72,500 |
| 2 Earners | 25 (18.0%) | $118,750 |
| 3+ Earners | 9 (6.5%) | $0 |
| Total | 139 (100.0%) | $72,232 |
Household Income in South Fork
Household Income Brackets in South Fork
With 51 households falling in the category, the $50,000 to $74,999 income range is the most frequent in South Fork, accounting for 23.9% of all households. In contrast, only 2 households (0.9%) fall into the $10,000 to $14,999 income bracket, making it the least populous group.
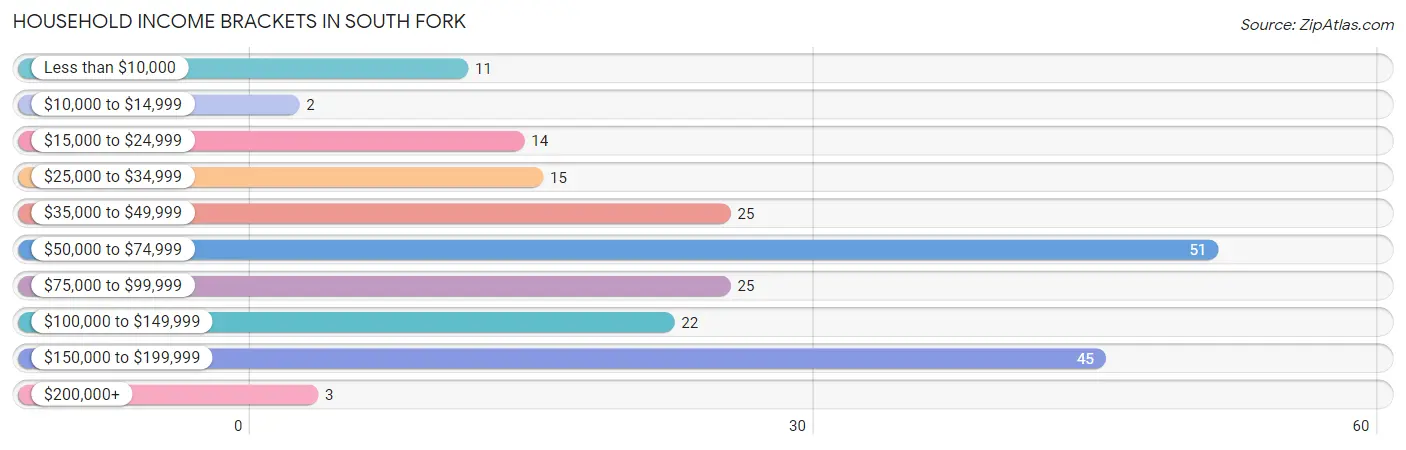
| Income Bracket | # Households | % Households |
| Less than $10,000 | 11 | 5.2% |
| $10,000 to $14,999 | 2 | 0.9% |
| $15,000 to $24,999 | 14 | 6.6% |
| $25,000 to $34,999 | 15 | 7.0% |
| $35,000 to $49,999 | 25 | 11.7% |
| $50,000 to $74,999 | 51 | 23.9% |
| $75,000 to $99,999 | 25 | 11.7% |
| $100,000 to $149,999 | 22 | 10.3% |
| $150,000 to $199,999 | 45 | 21.1% |
| $200,000+ | 3 | 1.4% |
Household Income by Householder Age in South Fork
The median household income in South Fork is $70,804, with the highest median household income of $86,719 found in the 45 to 64 years age bracket for the primary householder. A total of 83 households (39.0%) fall into this category. Meanwhile, the 15 to 24 years age bracket for the primary householder has the lowest median household income of $0, with 7 households (3.3%) in this group.
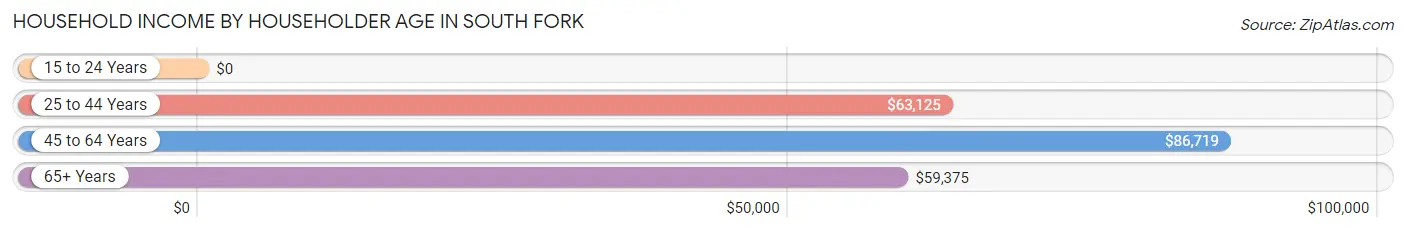
| Income Bracket | # Households | Median Income |
| 15 to 24 Years | 7 (3.3%) | $0 |
| 25 to 44 Years | 37 (17.4%) | $63,125 |
| 45 to 64 Years | 83 (39.0%) | $86,719 |
| 65+ Years | 86 (40.4%) | $59,375 |
| Total | 213 (100.0%) | $70,804 |
Poverty in South Fork
Income Below Poverty by Sex and Age in South Fork
With 7.4% poverty level for males and 11.1% for females among the residents of South Fork, 25 to 34 year old males and 45 to 54 year old females are the most vulnerable to poverty, with 6 males (14.6%) and 4 females (23.5%) in their respective age groups living below the poverty level.
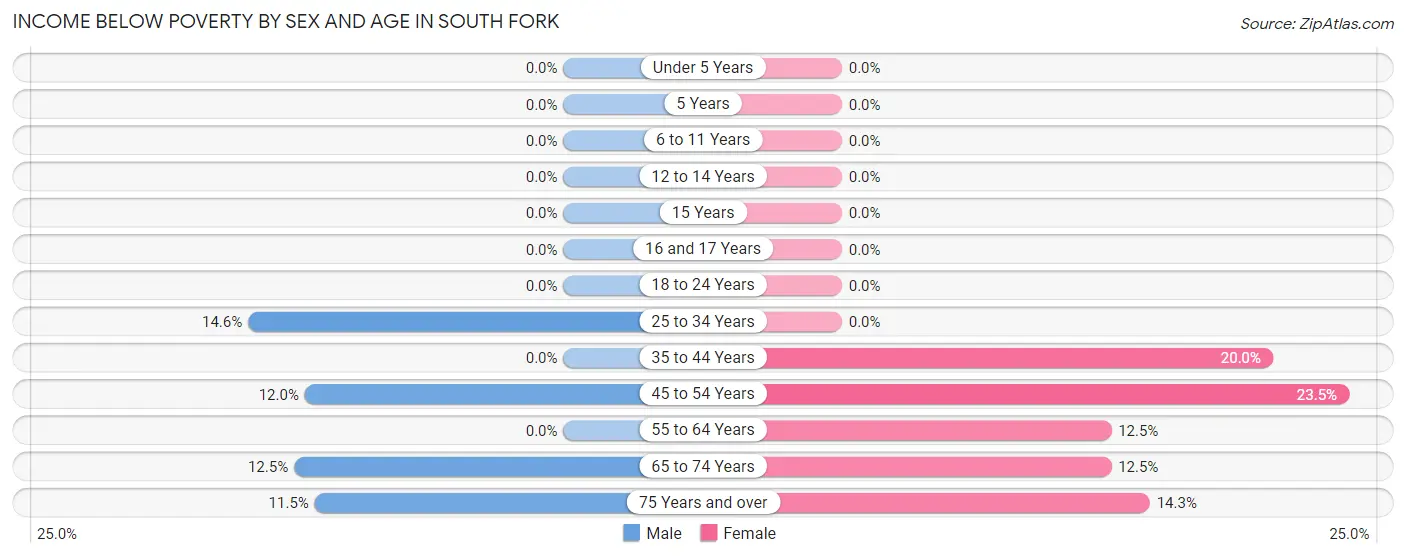
| Age Bracket | Male | Female |
| Under 5 Years | 0 (0.0%) | 0 (0.0%) |
| 5 Years | 0 (0.0%) | 0 (0.0%) |
| 6 to 11 Years | 0 (0.0%) | 0 (0.0%) |
| 12 to 14 Years | 0 (0.0%) | 0 (0.0%) |
| 15 Years | 0 (0.0%) | 0 (0.0%) |
| 16 and 17 Years | 0 (0.0%) | 0 (0.0%) |
| 18 to 24 Years | 0 (0.0%) | 0 (0.0%) |
| 25 to 34 Years | 6 (14.6%) | 0 (0.0%) |
| 35 to 44 Years | 0 (0.0%) | 1 (20.0%) |
| 45 to 54 Years | 3 (12.0%) | 4 (23.5%) |
| 55 to 64 Years | 0 (0.0%) | 7 (12.5%) |
| 65 to 74 Years | 6 (12.5%) | 7 (12.5%) |
| 75 Years and over | 3 (11.5%) | 3 (14.3%) |
| Total | 18 (7.4%) | 22 (11.1%) |
Income Above Poverty by Sex and Age in South Fork
According to the poverty statistics in South Fork, males aged under 5 years and females aged under 5 years are the age groups that are most secure financially, with 100.0% of males and 100.0% of females in these age groups living above the poverty line.
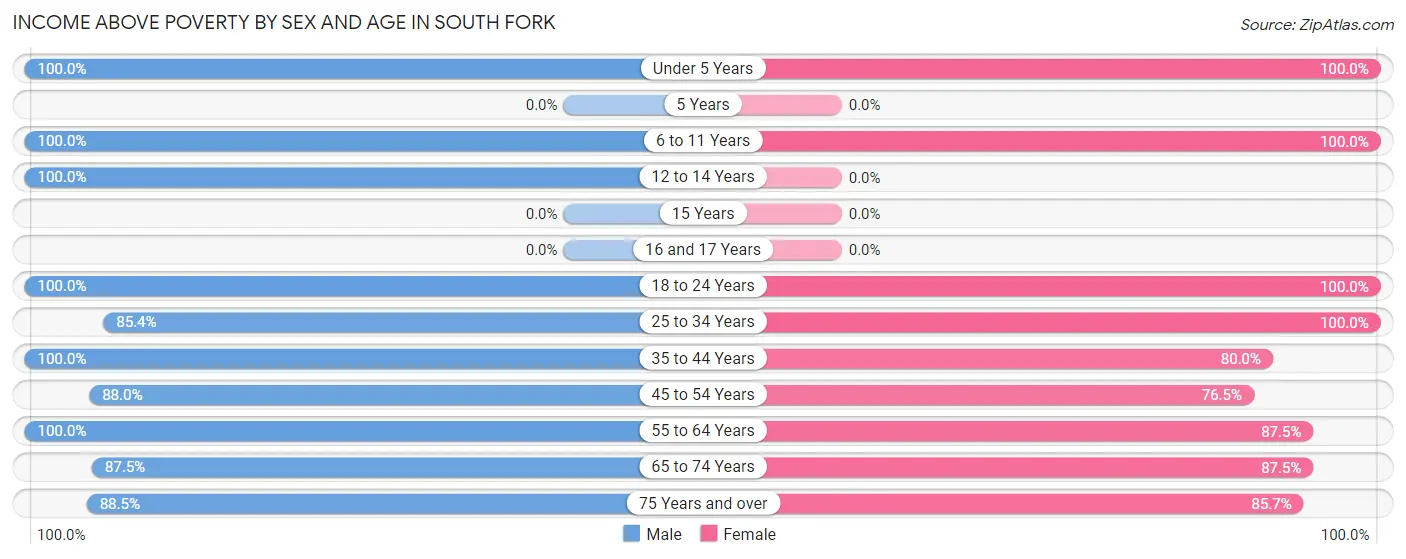
| Age Bracket | Male | Female |
| Under 5 Years | 14 (100.0%) | 11 (100.0%) |
| 5 Years | 0 (0.0%) | 0 (0.0%) |
| 6 to 11 Years | 1 (100.0%) | 5 (100.0%) |
| 12 to 14 Years | 2 (100.0%) | 0 (0.0%) |
| 15 Years | 0 (0.0%) | 0 (0.0%) |
| 16 and 17 Years | 0 (0.0%) | 0 (0.0%) |
| 18 to 24 Years | 17 (100.0%) | 7 (100.0%) |
| 25 to 34 Years | 35 (85.4%) | 20 (100.0%) |
| 35 to 44 Years | 24 (100.0%) | 4 (80.0%) |
| 45 to 54 Years | 22 (88.0%) | 13 (76.5%) |
| 55 to 64 Years | 44 (100.0%) | 49 (87.5%) |
| 65 to 74 Years | 42 (87.5%) | 49 (87.5%) |
| 75 Years and over | 23 (88.5%) | 18 (85.7%) |
| Total | 224 (92.6%) | 176 (88.9%) |
Income Below Poverty Among Married-Couple Families in South Fork
The poverty statistics for married-couple families in South Fork show that 6.8% or 8 of the total 118 families live below the poverty line. Families with no children have the highest poverty rate of 7.8%, comprising of 8 families. On the other hand, families with 1 or 2 children have the lowest poverty rate of 0.0%, which includes 0 families.
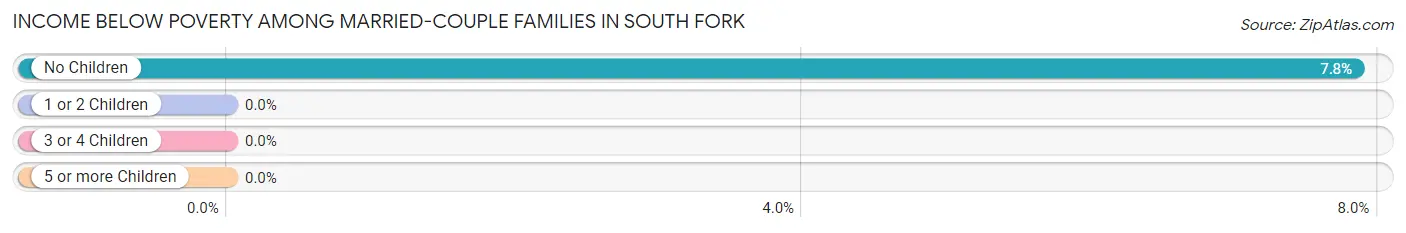
| Children | Above Poverty | Below Poverty |
| No Children | 94 (92.2%) | 8 (7.8%) |
| 1 or 2 Children | 16 (100.0%) | 0 (0.0%) |
| 3 or 4 Children | 0 (0.0%) | 0 (0.0%) |
| 5 or more Children | 0 (0.0%) | 0 (0.0%) |
| Total | 110 (93.2%) | 8 (6.8%) |
Income Below Poverty Among Single-Parent Households in South Fork
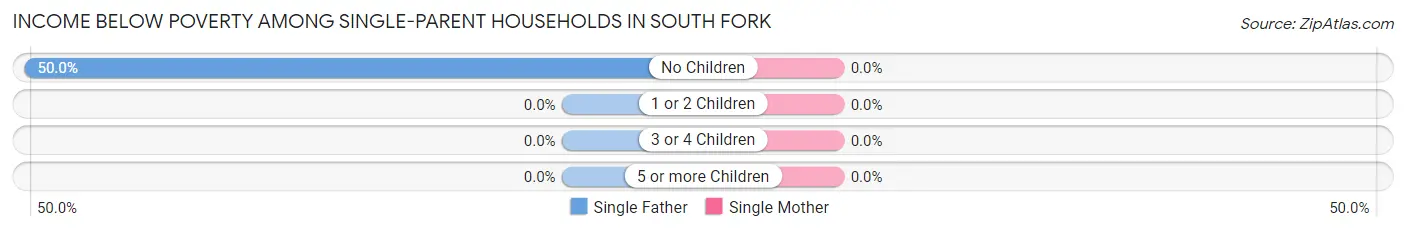
| Children | Single Father | Single Mother |
| No Children | 6 (50.0%) | 0 (0.0%) |
| 1 or 2 Children | 0 (0.0%) | 0 (0.0%) |
| 3 or 4 Children | 0 (0.0%) | 0 (0.0%) |
| 5 or more Children | 0 (0.0%) | 0 (0.0%) |
| Total | 6 (50.0%) | 0 (0.0%) |
Income Below Poverty Among Married-Couple vs Single-Parent Households in South Fork
The poverty data for South Fork shows that 8 of the married-couple family households (6.8%) and 6 of the single-parent households (28.6%) are living below the poverty level. Within the married-couple family households, those with no children have the highest poverty rate, with 8 households (7.8%) falling below the poverty line. Among the single-parent households, those with no children have the highest poverty rate, with 6 household (28.6%) living below poverty.
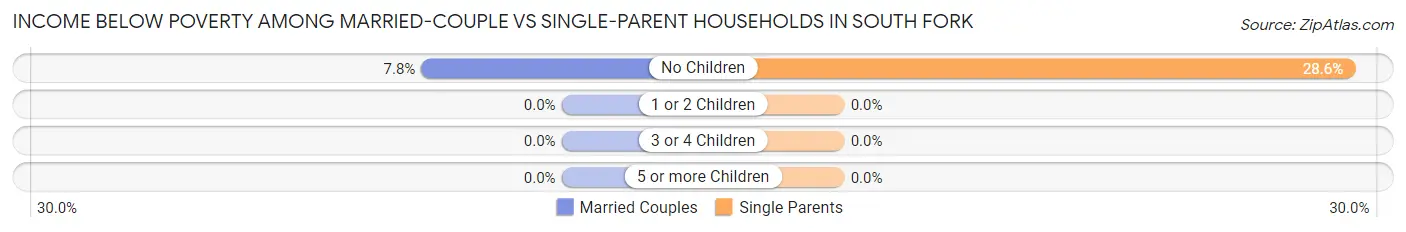
| Children | Married-Couple Families | Single-Parent Households |
| No Children | 8 (7.8%) | 6 (28.6%) |
| 1 or 2 Children | 0 (0.0%) | 0 (0.0%) |
| 3 or 4 Children | 0 (0.0%) | 0 (0.0%) |
| 5 or more Children | 0 (0.0%) | 0 (0.0%) |
| Total | 8 (6.8%) | 6 (28.6%) |
Race in South Fork
The most populous races in South Fork are White / Caucasian (427 | 93.2%), Hispanic or Latino (30 | 6.6%), and Two or more Races (20 | 4.4%).
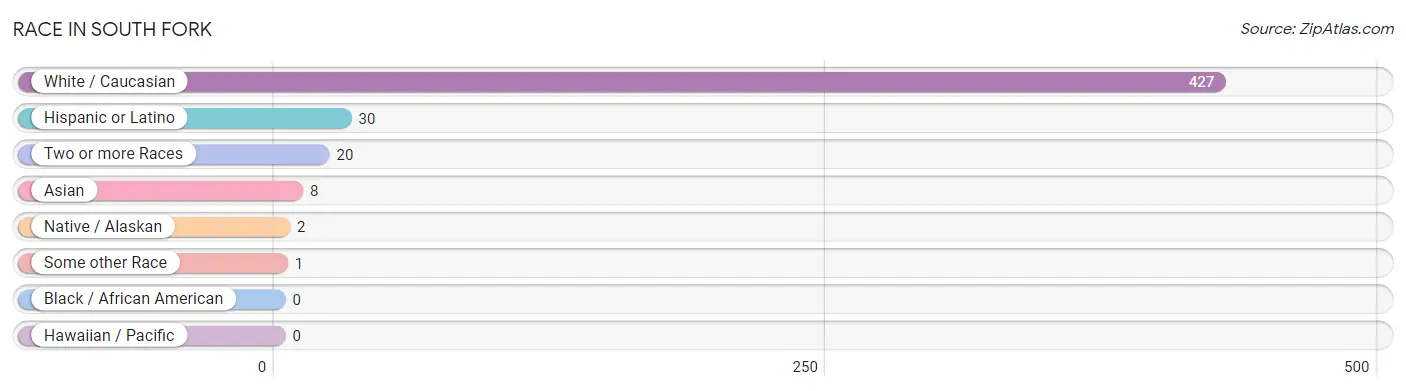
| Race | # Population | % Population |
| Asian | 8 | 1.8% |
| Black / African American | 0 | 0.0% |
| Hawaiian / Pacific | 0 | 0.0% |
| Hispanic or Latino | 30 | 6.6% |
| Native / Alaskan | 2 | 0.4% |
| White / Caucasian | 427 | 93.2% |
| Two or more Races | 20 | 4.4% |
| Some other Race | 1 | 0.2% |
| Total | 458 | 100.0% |
Ancestry in South Fork
The most populous ancestries reported in South Fork are German (119 | 26.0%), Irish (57 | 12.4%), English (53 | 11.6%), Italian (38 | 8.3%), and Scottish (28 | 6.1%), together accounting for 64.4% of all South Fork residents.
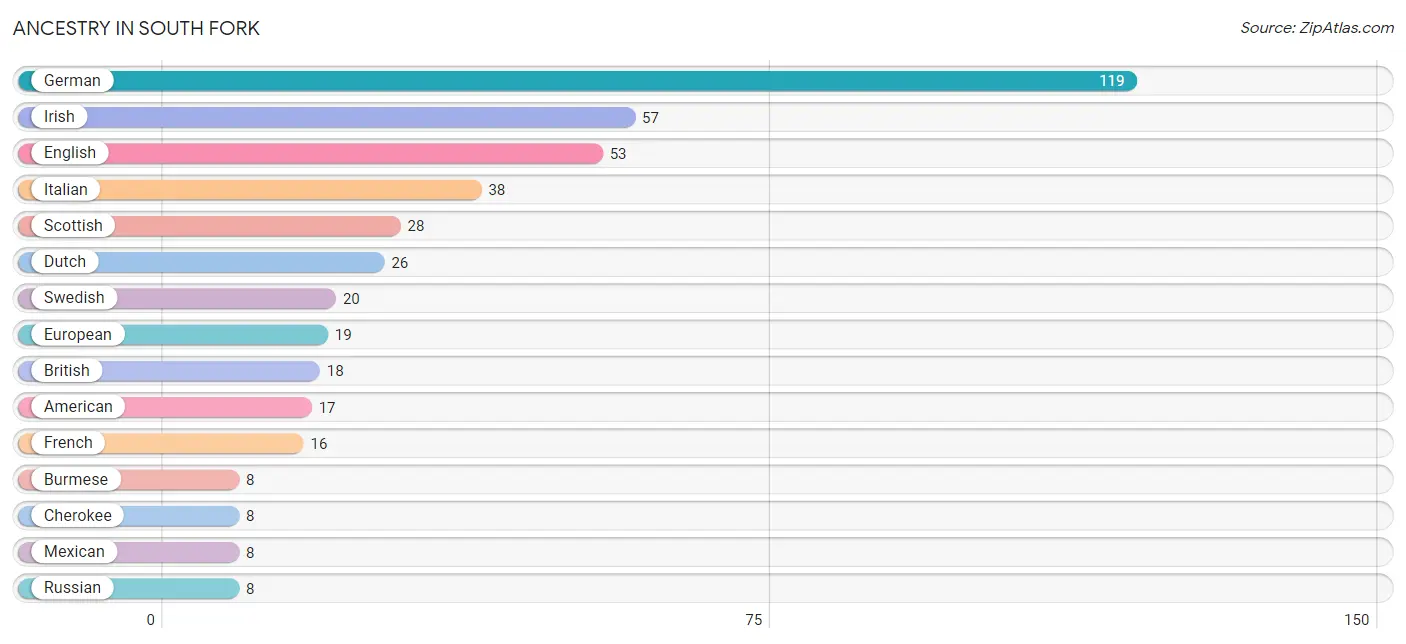
| Ancestry | # Population | % Population |
| American | 17 | 3.7% |
| Bhutanese | 3 | 0.7% |
| British | 18 | 3.9% |
| Burmese | 8 | 1.8% |
| Cherokee | 8 | 1.8% |
| Creek | 2 | 0.4% |
| Czech | 2 | 0.4% |
| Dutch | 26 | 5.7% |
| English | 53 | 11.6% |
| European | 19 | 4.2% |
| French | 16 | 3.5% |
| French Canadian | 1 | 0.2% |
| German | 119 | 26.0% |
| Greek | 6 | 1.3% |
| Hungarian | 2 | 0.4% |
| Irish | 57 | 12.4% |
| Italian | 38 | 8.3% |
| Mexican | 8 | 1.8% |
| Norwegian | 3 | 0.7% |
| Polish | 5 | 1.1% |
| Russian | 8 | 1.8% |
| Scandinavian | 2 | 0.4% |
| Scotch-Irish | 4 | 0.9% |
| Scottish | 28 | 6.1% |
| Swedish | 20 | 4.4% |
| Swiss | 2 | 0.4% | View All 26 Rows |
Immigrants in South Fork
The most numerous immigrant groups reported in South Fork came from Central America (3 | 0.7%), Latin America (3 | 0.7%), and Mexico (3 | 0.7%), together accounting for 2.0% of all South Fork residents.
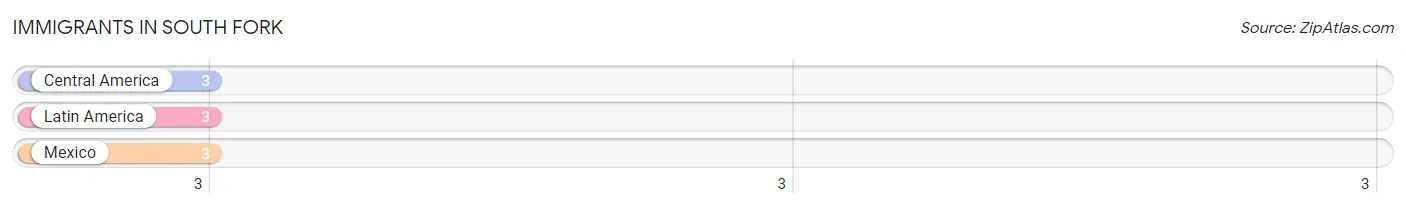
| Immigration Origin | # Population | % Population |
| Central America | 3 | 0.7% |
| Latin America | 3 | 0.7% |
| Mexico | 3 | 0.7% | View All 3 Rows |
Sex and Age in South Fork
Sex and Age in South Fork
The most populous age groups in South Fork are 60 to 64 Years (43 | 17.8%) for men and 70 to 74 Years (35 | 16.2%) for women.
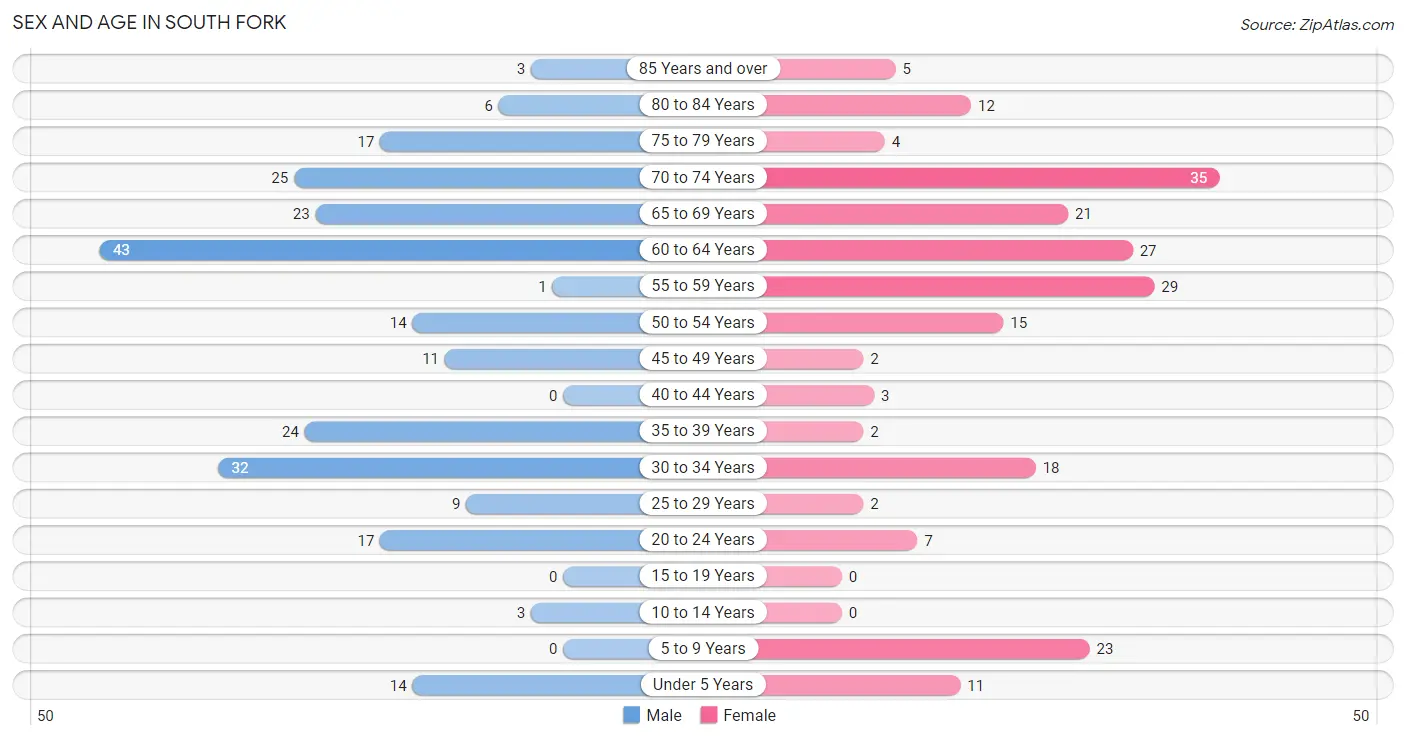
| Age Bracket | Male | Female |
| Under 5 Years | 14 (5.8%) | 11 (5.1%) |
| 5 to 9 Years | 0 (0.0%) | 23 (10.6%) |
| 10 to 14 Years | 3 (1.2%) | 0 (0.0%) |
| 15 to 19 Years | 0 (0.0%) | 0 (0.0%) |
| 20 to 24 Years | 17 (7.0%) | 7 (3.2%) |
| 25 to 29 Years | 9 (3.7%) | 2 (0.9%) |
| 30 to 34 Years | 32 (13.2%) | 18 (8.3%) |
| 35 to 39 Years | 24 (9.9%) | 2 (0.9%) |
| 40 to 44 Years | 0 (0.0%) | 3 (1.4%) |
| 45 to 49 Years | 11 (4.5%) | 2 (0.9%) |
| 50 to 54 Years | 14 (5.8%) | 15 (6.9%) |
| 55 to 59 Years | 1 (0.4%) | 29 (13.4%) |
| 60 to 64 Years | 43 (17.8%) | 27 (12.5%) |
| 65 to 69 Years | 23 (9.5%) | 21 (9.7%) |
| 70 to 74 Years | 25 (10.3%) | 35 (16.2%) |
| 75 to 79 Years | 17 (7.0%) | 4 (1.8%) |
| 80 to 84 Years | 6 (2.5%) | 12 (5.6%) |
| 85 Years and over | 3 (1.2%) | 5 (2.3%) |
| Total | 242 (100.0%) | 216 (100.0%) |
Families and Households in South Fork
Median Family Size in South Fork
The median family size in South Fork is 2.37 persons per family, with married-couple families (118 | 84.9%) accounting for the largest median family size of 2.47 persons per family. On the other hand, single male/father families (12 | 8.6%) represent the smallest median family size with 1.75 persons per family.
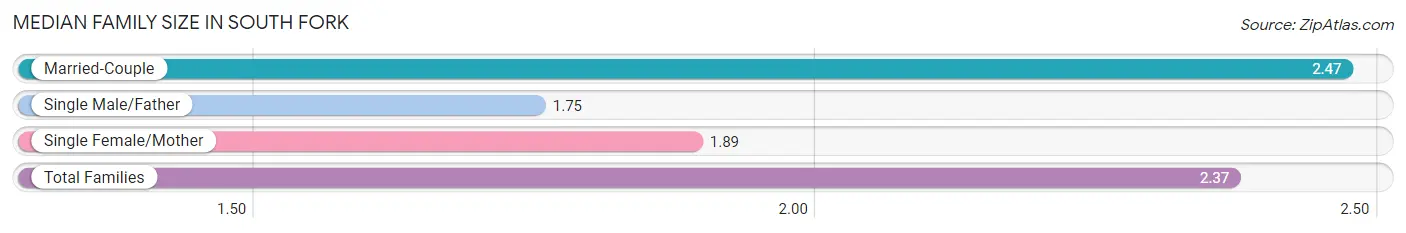
| Family Type | # Families | Family Size |
| Married-Couple | 118 (84.9%) | 2.47 |
| Single Male/Father | 12 (8.6%) | 1.75 |
| Single Female/Mother | 9 (6.5%) | 1.89 |
| Total Families | 139 (100.0%) | 2.37 |
Median Household Size in South Fork
The median household size in South Fork is 2.15 persons per household, with married-couple households (118 | 55.4%) accounting for the largest median household size of 2.72 persons per household. non-family households (74 | 34.7%) represent the smallest median household size with 1.34 persons per household.
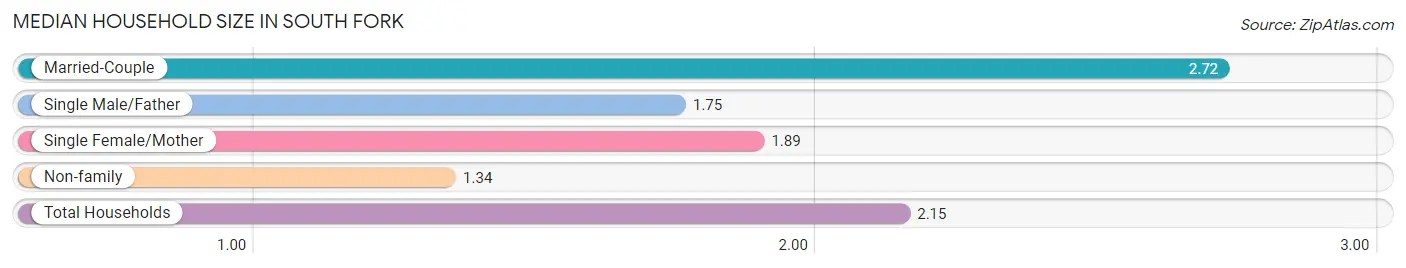
| Household Type | # Households | Household Size |
| Married-Couple | 118 (55.4%) | 2.72 |
| Single Male/Father | 12 (5.6%) | 1.75 |
| Single Female/Mother | 9 (4.2%) | 1.89 |
| Non-family | 74 (34.7%) | 1.34 |
| Total Households | 213 (100.0%) | 2.15 |
Household Size by Marriage Status in South Fork
Out of a total of 213 households in South Fork, 139 (65.3%) are family households, while 74 (34.7%) are nonfamily households. The most numerous type of family households are 2-person households, comprising 107, and the most common type of nonfamily households are 1-person households, comprising 53.
| Household Size | Family Households | Nonfamily Households |
| 1-Person Households | - | 53 (24.9%) |
| 2-Person Households | 107 (50.2%) | 21 (9.9%) |
| 3-Person Households | 12 (5.6%) | 0 (0.0%) |
| 4-Person Households | 20 (9.4%) | 0 (0.0%) |
| 5-Person Households | 0 (0.0%) | 0 (0.0%) |
| 6-Person Households | 0 (0.0%) | 0 (0.0%) |
| 7+ Person Households | 0 (0.0%) | 0 (0.0%) |
| Total | 139 (65.3%) | 74 (34.7%) |
Female Fertility in South Fork
Fertility by Age in South Fork
Average fertility rate in South Fork is 93.0 births per 1,000 women. Women in the age bracket of 20 to 34 years have the highest fertility rate with 148.0 births per 1,000 women. Women in the age bracket of 20 to 34 years acount for 100.0% of all women with births.
| Age Bracket | Women with Births | Births / 1,000 Women |
| 15 to 19 years | 0 (0.0%) | 0.0 |
| 20 to 34 years | 4 (100.0%) | 148.0 |
| 35 to 50 years | 0 (0.0%) | 0.0 |
| Total | 4 (100.0%) | 93.0 |
Fertility by Age by Marriage Status in South Fork
| Age Bracket | Married | Unmarried |
| 15 to 19 years | 0 (0.0%) | 0 (0.0%) |
| 20 to 34 years | 4 (100.0%) | 0 (0.0%) |
| 35 to 50 years | 0 (0.0%) | 0 (0.0%) |
| Total | 4 (100.0%) | 0 (0.0%) |
Fertility by Education in South Fork
| Educational Attainment | Women with Births | Births / 1,000 Women |
| Less than High School | 0 (0.0%) | 0.0 |
| High School Diploma | 0 (0.0%) | 0.0 |
| College or Associate's Degree | 0 (0.0%) | 0.0 |
| Bachelor's Degree | 4 (100.0%) | 364.0 |
| Graduate Degree | 0 (0.0%) | 0.0 |
| Total | 4 (100.0%) | 93.0 |
Fertility by Education by Marriage Status in South Fork
| Educational Attainment | Married | Unmarried |
| Less than High School | 0 (0.0%) | 0 (0.0%) |
| High School Diploma | 0 (0.0%) | 0 (0.0%) |
| College or Associate's Degree | 0 (0.0%) | 0 (0.0%) |
| Bachelor's Degree | 4 (100.0%) | 0 (0.0%) |
| Graduate Degree | 0 (0.0%) | 0 (0.0%) |
| Total | 4 (100.0%) | 0 (0.0%) |
Employment Characteristics in South Fork
Employment by Class of Employer in South Fork
Among the 163 employed individuals in South Fork, private company employees (122 | 74.9%), self-employed (not incorporated) (26 | 16.0%), and local government employees (6 | 3.7%) make up the most common classes of employment.
| Employer Class | # Employees | % Employees |
| Private Company Employees | 122 | 74.9% |
| Self-Employed (Incorporated) | 2 | 1.2% |
| Self-Employed (Not Incorporated) | 26 | 16.0% |
| Not-for-profit Organizations | 4 | 2.5% |
| Local Government Employees | 6 | 3.7% |
| State Government Employees | 3 | 1.8% |
| Federal Government Employees | 0 | 0.0% |
| Unpaid Family Workers | 0 | 0.0% |
| Total | 163 | 100.0% |
Employment Status by Age in South Fork
According to the labor force statistics for South Fork, out of the total population over 16 years of age (407), 44.2% or 180 individuals are in the labor force, with 8.3% or 15 of them unemployed. The age group with the highest labor force participation rate is 20 to 24 years, with 100.0% or 24 individuals in the labor force. Within the labor force, the 35 to 44 years age range has the highest percentage of unemployed individuals, with 46.2% or 12 of them being unemployed.
| Age Bracket | In Labor Force | Unemployed |
| 16 to 19 Years | 0 (0.0%) | 0 (0.0%) |
| 20 to 24 Years | 24 (100.0%) | 0 (0.0%) |
| 25 to 29 Years | 11 (100.0%) | 0 (0.0%) |
| 30 to 34 Years | 40 (80.0%) | 0 (0.0%) |
| 35 to 44 Years | 26 (89.7%) | 12 (46.2%) |
| 45 to 54 Years | 32 (76.2%) | 0 (0.0%) |
| 55 to 59 Years | 4 (13.3%) | 0 (0.0%) |
| 60 to 64 Years | 26 (37.1%) | 3 (11.5%) |
| 65 to 74 Years | 17 (16.3%) | 0 (0.0%) |
| 75 Years and over | 0 (0.0%) | 0 (0.0%) |
| Total | 180 (44.2%) | 15 (8.3%) |
Employment Status by Educational Attainment in South Fork
According to labor force statistics for South Fork, 59.9% of individuals (139) out of the total population between 25 and 64 years of age (232) are in the labor force, with 10.8% or 15 of them being unemployed. The group with the highest labor force participation rate are those with the educational attainment of less than high school, with 85.7% or 6 individuals in the labor force. Within the labor force, individuals with high school diploma education have the highest percentage of unemployment, with 27.9% or 12 of them being unemployed.
| Educational Attainment | In Labor Force | Unemployed |
| Less than High School | 6 (85.7%) | 0 (0.0%) |
| High School Diploma | 43 (70.5%) | 17 (27.9%) |
| College / Associate Degree | 46 (57.5%) | 0 (0.0%) |
| Bachelor's Degree or higher | 44 (52.4%) | 6 (6.8%) |
| Total | 139 (59.9%) | 25 (10.8%) |
Employment Occupations by Sex in South Fork
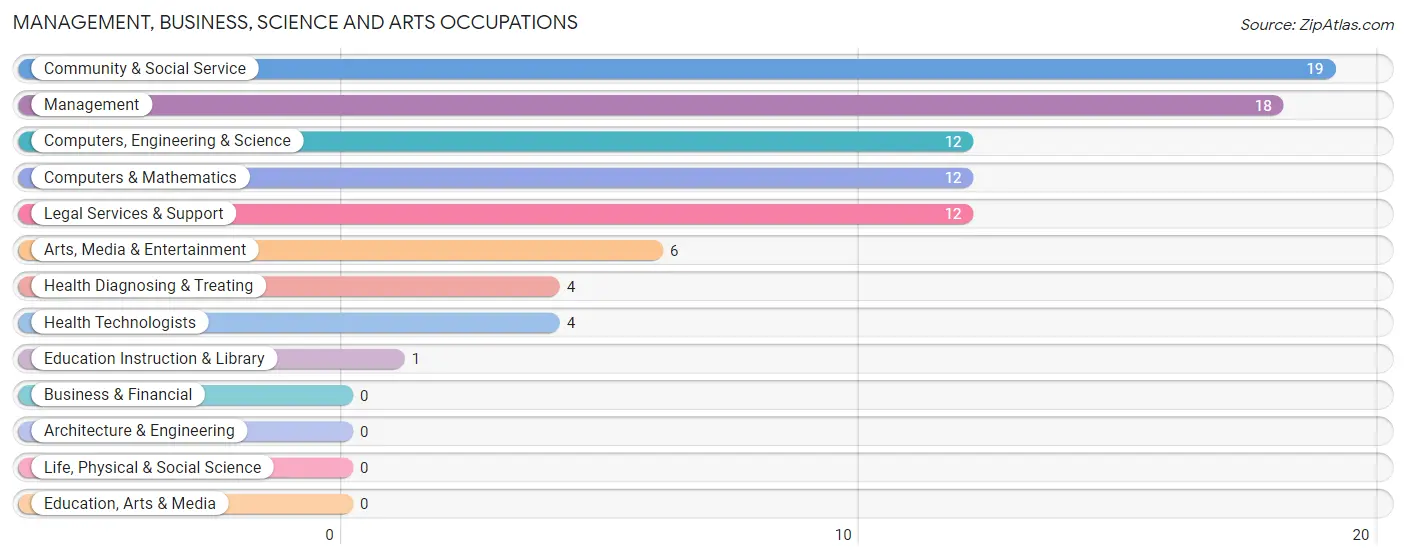
Management, Business, Science and Arts Occupations
The most common Management, Business, Science and Arts occupations in South Fork are Community & Social Service (19 | 11.5%), Management (18 | 10.9%), Computers, Engineering & Science (12 | 7.3%), Computers & Mathematics (12 | 7.3%), and Legal Services & Support (12 | 7.3%).
Management, Business, Science and Arts Occupations by Sex
Within the Management, Business, Science and Arts occupations in South Fork, the most male-oriented occupations are Computers, Engineering & Science (100.0%), Computers & Mathematics (100.0%), and Education Instruction & Library (100.0%), while the most female-oriented occupations are Legal Services & Support (100.0%), Health Diagnosing & Treating (100.0%), and Health Technologists (100.0%).
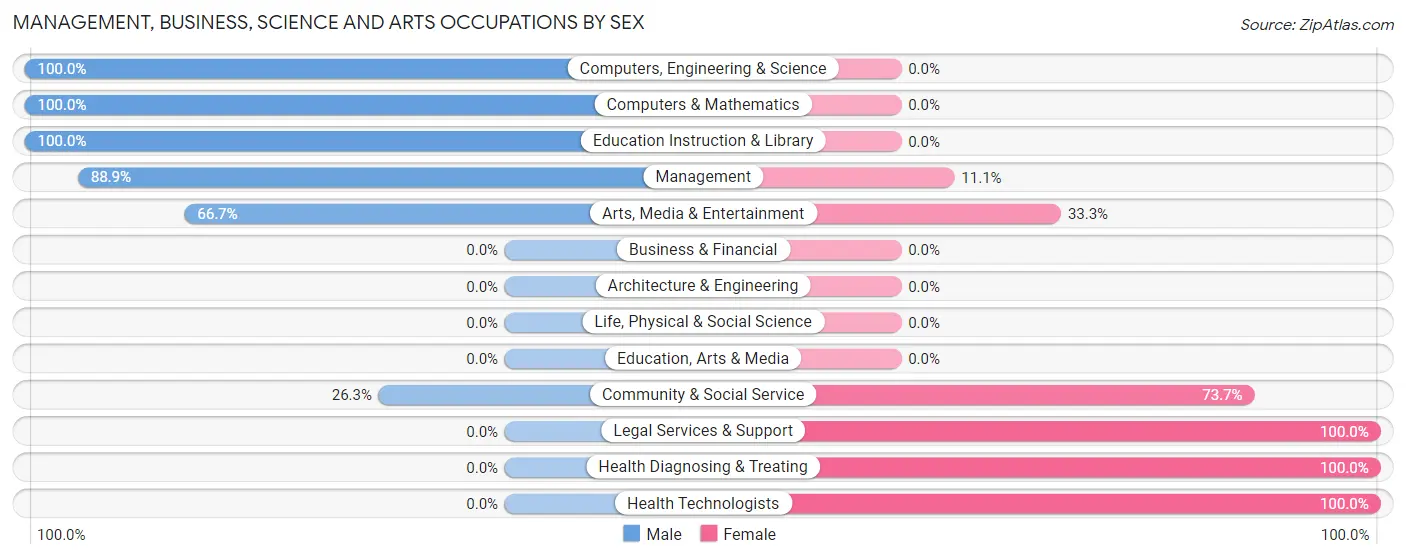
| Occupation | Male | Female |
| Management | 16 (88.9%) | 2 (11.1%) |
| Business & Financial | 0 (0.0%) | 0 (0.0%) |
| Computers, Engineering & Science | 12 (100.0%) | 0 (0.0%) |
| Computers & Mathematics | 12 (100.0%) | 0 (0.0%) |
| Architecture & Engineering | 0 (0.0%) | 0 (0.0%) |
| Life, Physical & Social Science | 0 (0.0%) | 0 (0.0%) |
| Community & Social Service | 5 (26.3%) | 14 (73.7%) |
| Education, Arts & Media | 0 (0.0%) | 0 (0.0%) |
| Legal Services & Support | 0 (0.0%) | 12 (100.0%) |
| Education Instruction & Library | 1 (100.0%) | 0 (0.0%) |
| Arts, Media & Entertainment | 4 (66.7%) | 2 (33.3%) |
| Health Diagnosing & Treating | 0 (0.0%) | 4 (100.0%) |
| Health Technologists | 0 (0.0%) | 4 (100.0%) |
| Total (Category) | 33 (62.3%) | 20 (37.7%) |
| Total (Overall) | 113 (68.5%) | 52 (31.5%) |
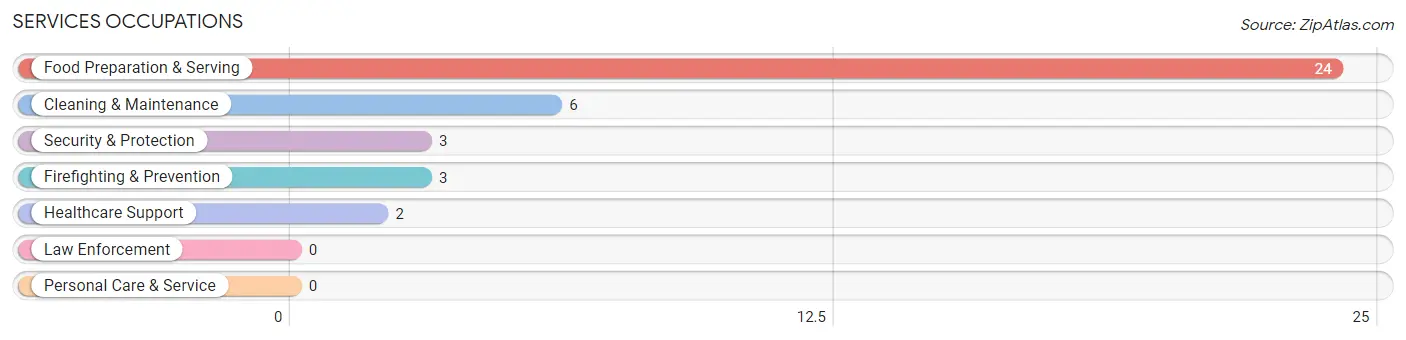
Services Occupations
The most common Services occupations in South Fork are Food Preparation & Serving (24 | 14.5%), Cleaning & Maintenance (6 | 3.6%), Security & Protection (3 | 1.8%), Firefighting & Prevention (3 | 1.8%), and Healthcare Support (2 | 1.2%).
Services Occupations by Sex
Within the Services occupations in South Fork, the most male-oriented occupations are Security & Protection (100.0%), Firefighting & Prevention (100.0%), and Cleaning & Maintenance (100.0%), while the most female-oriented occupations are Healthcare Support (100.0%), and Food Preparation & Serving (45.8%).
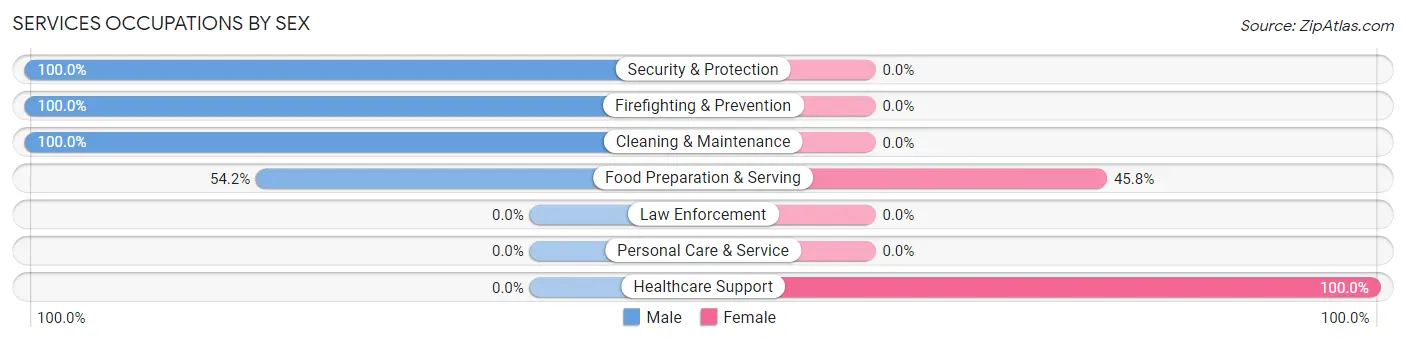
| Occupation | Male | Female |
| Healthcare Support | 0 (0.0%) | 2 (100.0%) |
| Security & Protection | 3 (100.0%) | 0 (0.0%) |
| Firefighting & Prevention | 3 (100.0%) | 0 (0.0%) |
| Law Enforcement | 0 (0.0%) | 0 (0.0%) |
| Food Preparation & Serving | 13 (54.2%) | 11 (45.8%) |
| Cleaning & Maintenance | 6 (100.0%) | 0 (0.0%) |
| Personal Care & Service | 0 (0.0%) | 0 (0.0%) |
| Total (Category) | 22 (62.9%) | 13 (37.1%) |
| Total (Overall) | 113 (68.5%) | 52 (31.5%) |
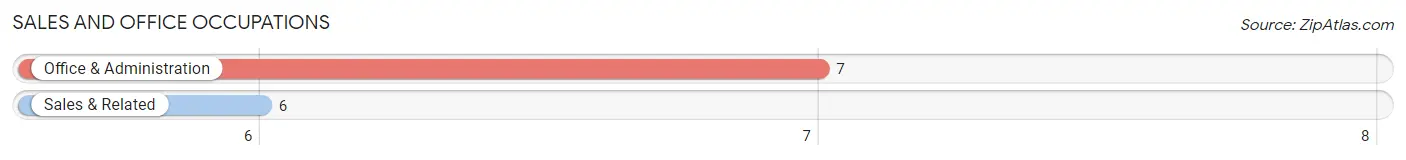
Sales and Office Occupations
The most common Sales and Office occupations in South Fork are Office & Administration (7 | 4.2%), and Sales & Related (6 | 3.6%).
Sales and Office Occupations by Sex
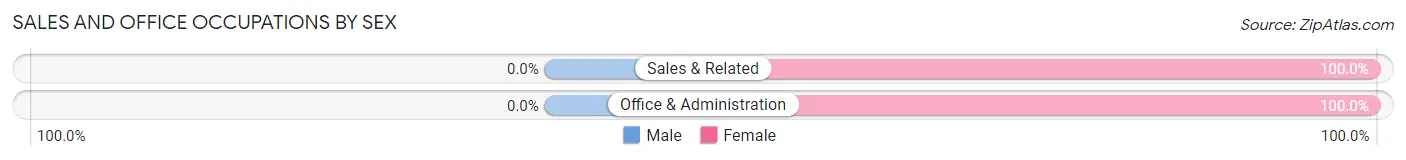
| Occupation | Male | Female |
| Sales & Related | 0 (0.0%) | 6 (100.0%) |
| Office & Administration | 0 (0.0%) | 7 (100.0%) |
| Total (Category) | 0 (0.0%) | 13 (100.0%) |
| Total (Overall) | 113 (68.5%) | 52 (31.5%) |
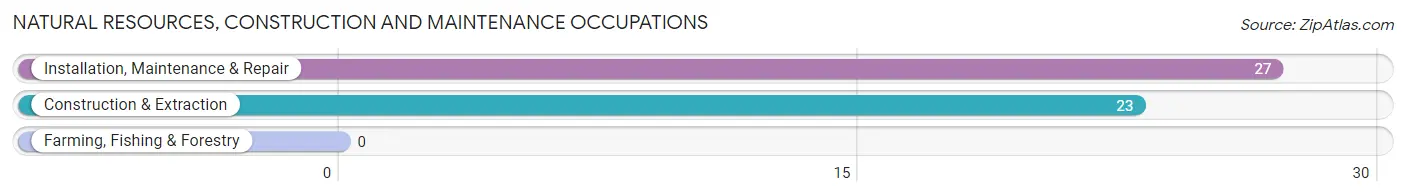
Natural Resources, Construction and Maintenance Occupations
The most common Natural Resources, Construction and Maintenance occupations in South Fork are Installation, Maintenance & Repair (27 | 16.4%), and Construction & Extraction (23 | 13.9%).
Natural Resources, Construction and Maintenance Occupations by Sex
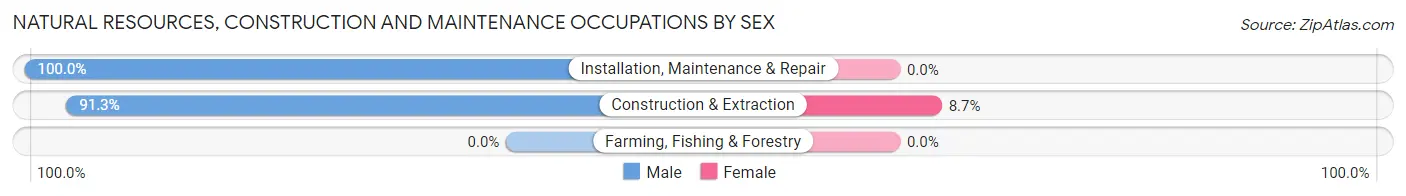
| Occupation | Male | Female |
| Farming, Fishing & Forestry | 0 (0.0%) | 0 (0.0%) |
| Construction & Extraction | 21 (91.3%) | 2 (8.7%) |
| Installation, Maintenance & Repair | 27 (100.0%) | 0 (0.0%) |
| Total (Category) | 48 (96.0%) | 2 (4.0%) |
| Total (Overall) | 113 (68.5%) | 52 (31.5%) |
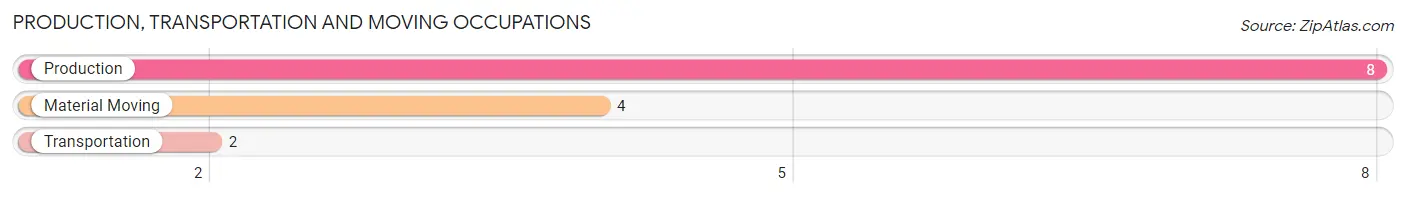
Production, Transportation and Moving Occupations
The most common Production, Transportation and Moving occupations in South Fork are Production (8 | 4.9%), Material Moving (4 | 2.4%), and Transportation (2 | 1.2%).
Production, Transportation and Moving Occupations by Sex
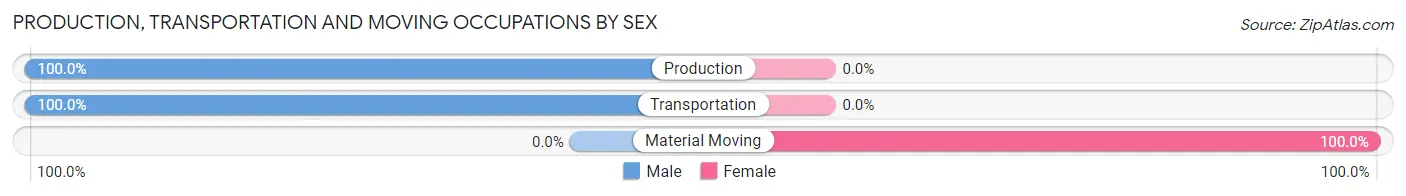
| Occupation | Male | Female |
| Production | 8 (100.0%) | 0 (0.0%) |
| Transportation | 2 (100.0%) | 0 (0.0%) |
| Material Moving | 0 (0.0%) | 4 (100.0%) |
| Total (Category) | 10 (71.4%) | 4 (28.6%) |
| Total (Overall) | 113 (68.5%) | 52 (31.5%) |
Employment Industries by Sex in South Fork
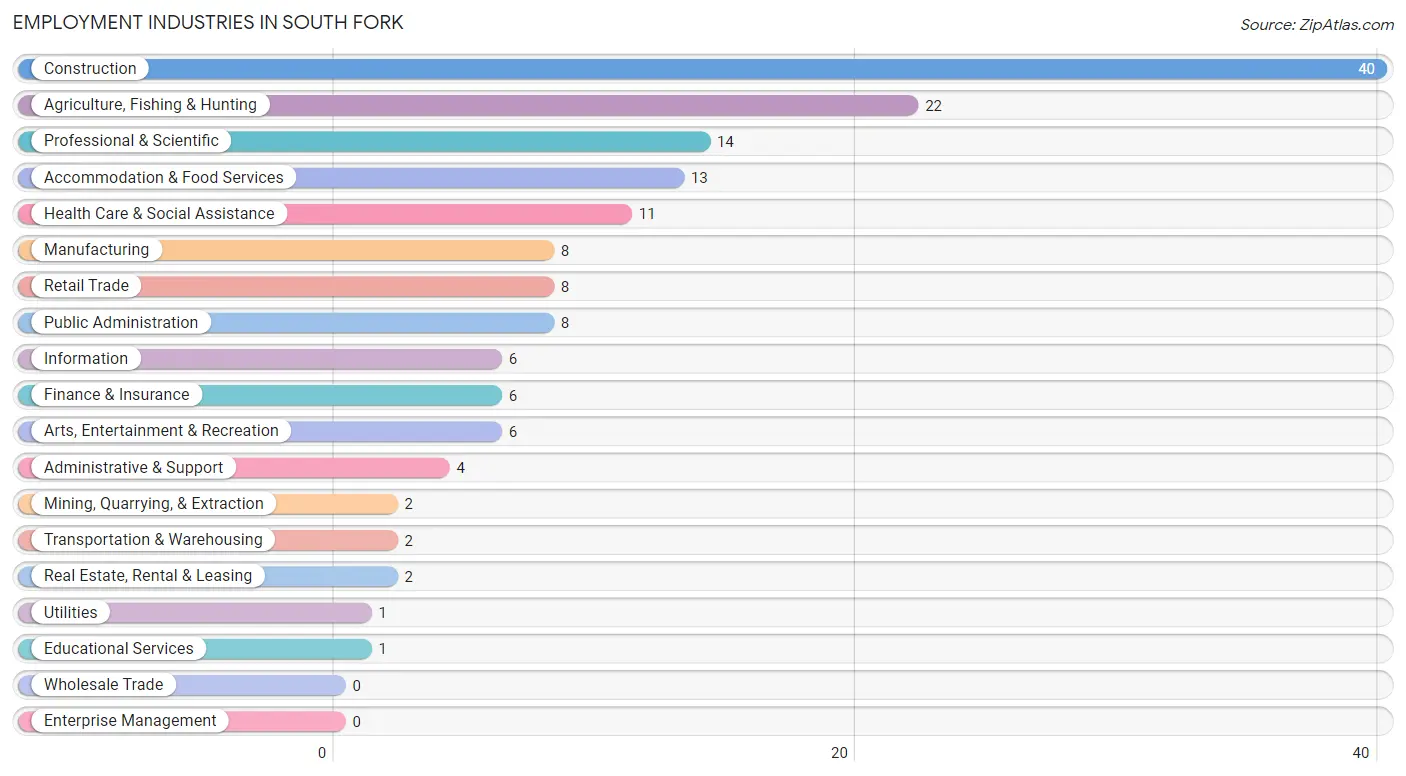
Employment Industries in South Fork
The major employment industries in South Fork include Construction (40 | 24.2%), Agriculture, Fishing & Hunting (22 | 13.3%), Professional & Scientific (14 | 8.5%), Accommodation & Food Services (13 | 7.9%), and Health Care & Social Assistance (11 | 6.7%).
Employment Industries by Sex in South Fork
The South Fork industries that see more men than women are Agriculture, Fishing & Hunting (100.0%), Mining, Quarrying, & Extraction (100.0%), and Manufacturing (100.0%), whereas the industries that tend to have a higher number of women are Real Estate, Rental & Leasing (100.0%), Professional & Scientific (100.0%), and Health Care & Social Assistance (100.0%).
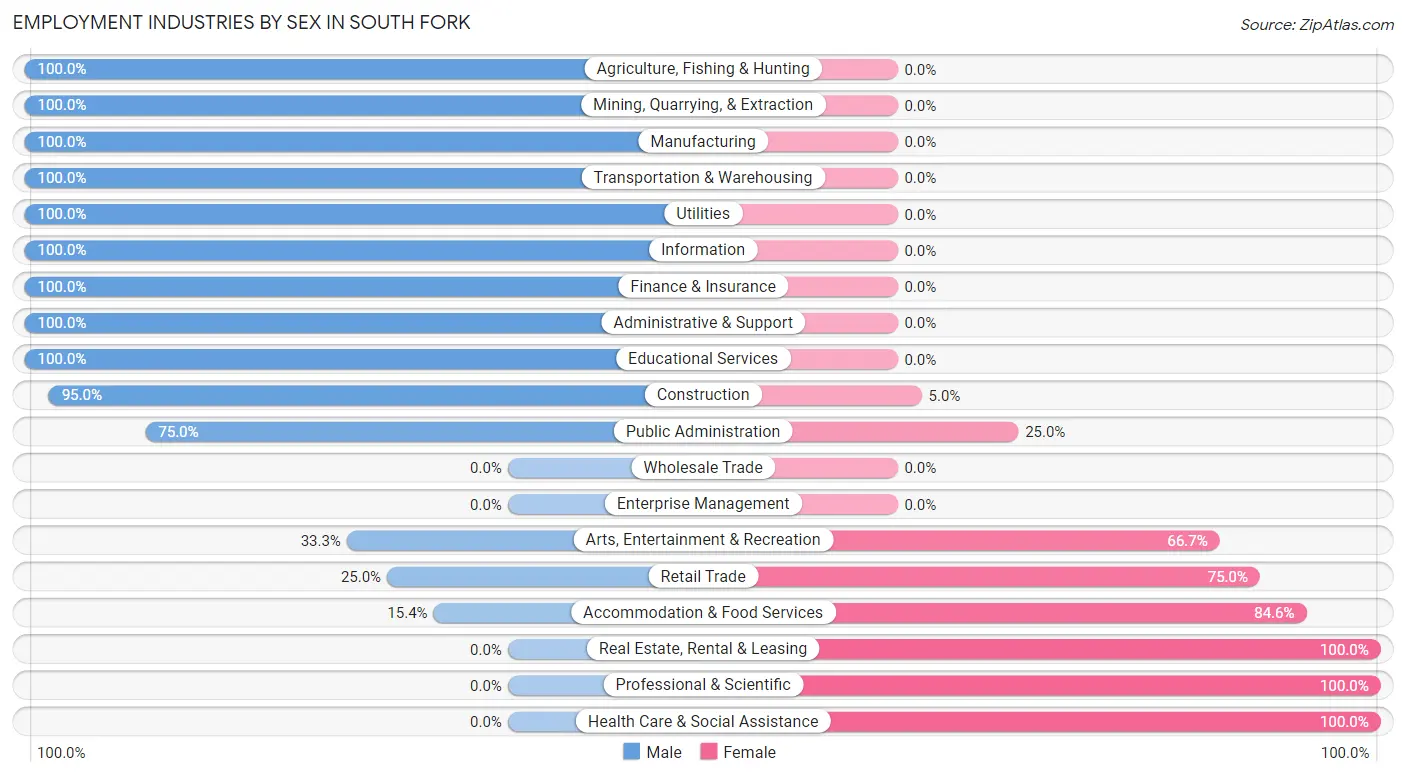
| Industry | Male | Female |
| Agriculture, Fishing & Hunting | 22 (100.0%) | 0 (0.0%) |
| Mining, Quarrying, & Extraction | 2 (100.0%) | 0 (0.0%) |
| Construction | 38 (95.0%) | 2 (5.0%) |
| Manufacturing | 8 (100.0%) | 0 (0.0%) |
| Wholesale Trade | 0 (0.0%) | 0 (0.0%) |
| Retail Trade | 2 (25.0%) | 6 (75.0%) |
| Transportation & Warehousing | 2 (100.0%) | 0 (0.0%) |
| Utilities | 1 (100.0%) | 0 (0.0%) |
| Information | 6 (100.0%) | 0 (0.0%) |
| Finance & Insurance | 6 (100.0%) | 0 (0.0%) |
| Real Estate, Rental & Leasing | 0 (0.0%) | 2 (100.0%) |
| Professional & Scientific | 0 (0.0%) | 14 (100.0%) |
| Enterprise Management | 0 (0.0%) | 0 (0.0%) |
| Administrative & Support | 4 (100.0%) | 0 (0.0%) |
| Educational Services | 1 (100.0%) | 0 (0.0%) |
| Health Care & Social Assistance | 0 (0.0%) | 11 (100.0%) |
| Arts, Entertainment & Recreation | 2 (33.3%) | 4 (66.7%) |
| Accommodation & Food Services | 2 (15.4%) | 11 (84.6%) |
| Public Administration | 6 (75.0%) | 2 (25.0%) |
| Total | 113 (68.5%) | 52 (31.5%) |
Education in South Fork
School Enrollment in South Fork
The most common levels of schooling among the 40 students in South Fork are elementary school (19 | 47.5%), nursery / preschool (10 | 25.0%), and kindergarten (5 | 12.5%).
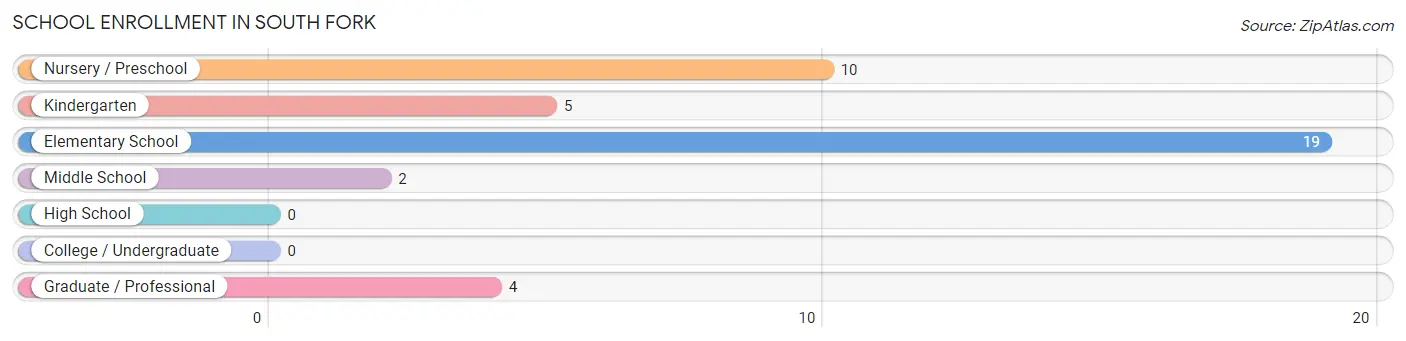
| School Level | # Students | % Students |
| Nursery / Preschool | 10 | 25.0% |
| Kindergarten | 5 | 12.5% |
| Elementary School | 19 | 47.5% |
| Middle School | 2 | 5.0% |
| High School | 0 | 0.0% |
| College / Undergraduate | 0 | 0.0% |
| Graduate / Professional | 4 | 10.0% |
| Total | 40 | 100.0% |
School Enrollment by Age by Funding Source in South Fork
Out of a total of 40 students who are enrolled in schools in South Fork, 4 (10.0%) attend a private institution, while the remaining 36 (90.0%) are enrolled in public schools. The age group of 10 to 14 year olds has the highest likelihood of being enrolled in private schools, with 2 (66.7% in the age bracket) enrolled. Conversely, the age group of 3 to 4 year olds has the lowest likelihood of being enrolled in a private school, with 10 (100.0% in the age bracket) attending a public institution.
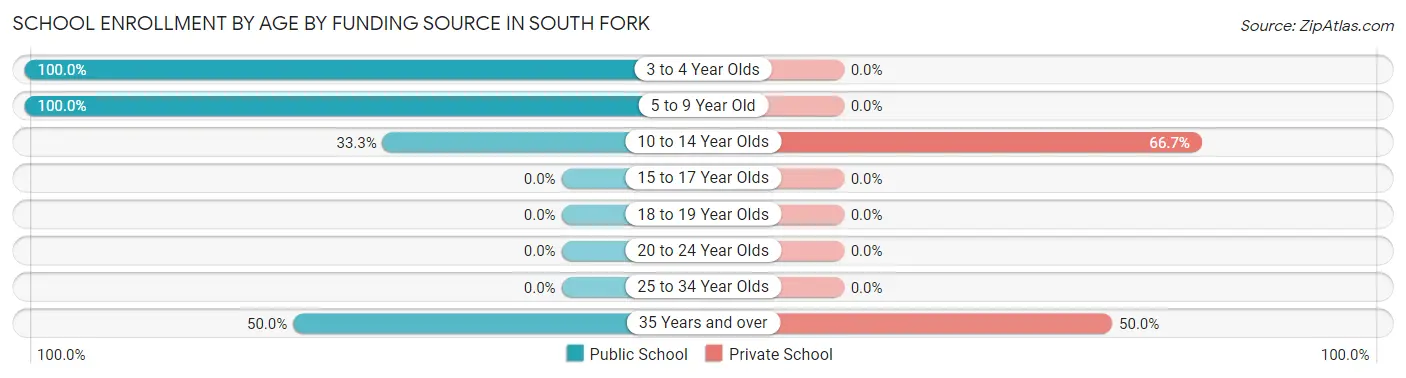
| Age Bracket | Public School | Private School |
| 3 to 4 Year Olds | 10 (100.0%) | 0 (0.0%) |
| 5 to 9 Year Old | 23 (100.0%) | 0 (0.0%) |
| 10 to 14 Year Olds | 1 (33.3%) | 2 (66.7%) |
| 15 to 17 Year Olds | 0 (0.0%) | 0 (0.0%) |
| 18 to 19 Year Olds | 0 (0.0%) | 0 (0.0%) |
| 20 to 24 Year Olds | 0 (0.0%) | 0 (0.0%) |
| 25 to 34 Year Olds | 0 (0.0%) | 0 (0.0%) |
| 35 Years and over | 2 (50.0%) | 2 (50.0%) |
| Total | 36 (90.0%) | 4 (10.0%) |
Educational Attainment by Field of Study in South Fork
Science & technology (31 | 18.8%), education (30 | 18.2%), bio, nature & agricultural (24 | 14.5%), engineering (18 | 10.9%), and physical & health sciences (17 | 10.3%) are the most common fields of study among 165 individuals in South Fork who have obtained a bachelor's degree or higher.
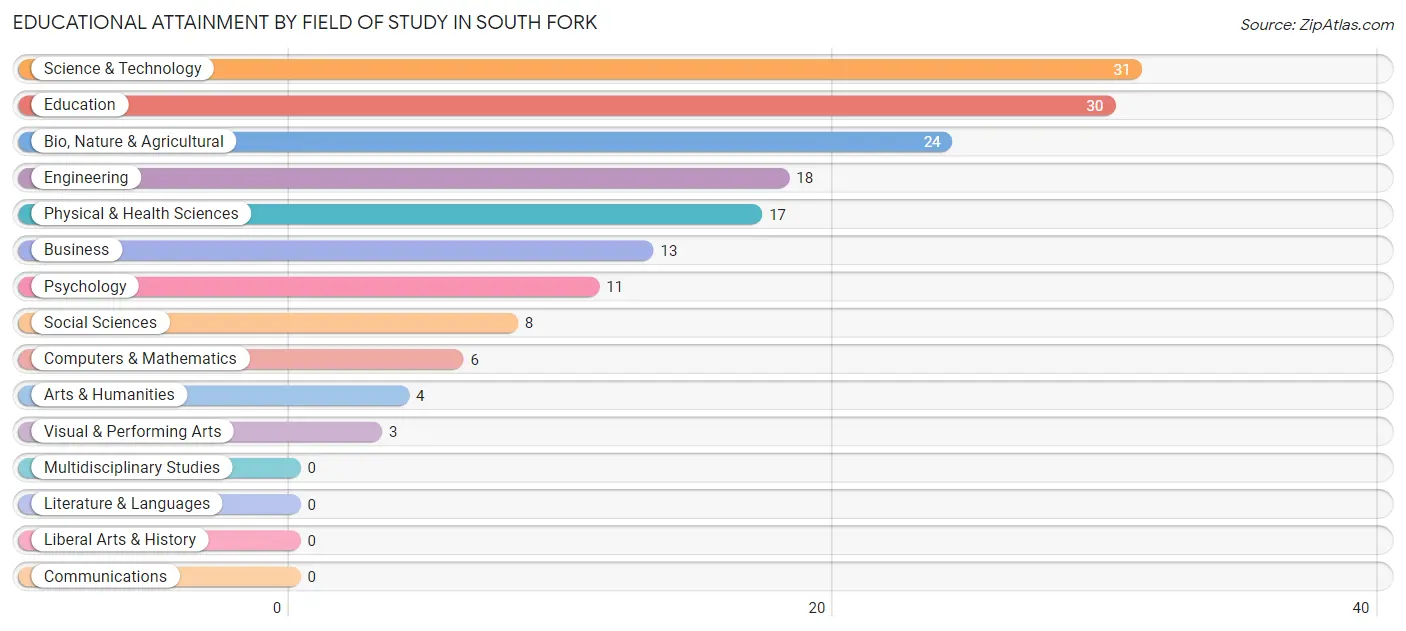
| Field of Study | # Graduates | % Graduates |
| Computers & Mathematics | 6 | 3.6% |
| Bio, Nature & Agricultural | 24 | 14.5% |
| Physical & Health Sciences | 17 | 10.3% |
| Psychology | 11 | 6.7% |
| Social Sciences | 8 | 4.9% |
| Engineering | 18 | 10.9% |
| Multidisciplinary Studies | 0 | 0.0% |
| Science & Technology | 31 | 18.8% |
| Business | 13 | 7.9% |
| Education | 30 | 18.2% |
| Literature & Languages | 0 | 0.0% |
| Liberal Arts & History | 0 | 0.0% |
| Visual & Performing Arts | 3 | 1.8% |
| Communications | 0 | 0.0% |
| Arts & Humanities | 4 | 2.4% |
| Total | 165 | 100.0% |
Transportation & Commute in South Fork
Vehicle Availability by Sex in South Fork
The most prevalent vehicle ownership categories in South Fork are males with 2 vehicles (43, accounting for 38.1%) and females with 2 vehicles (21, making up 86.0%).
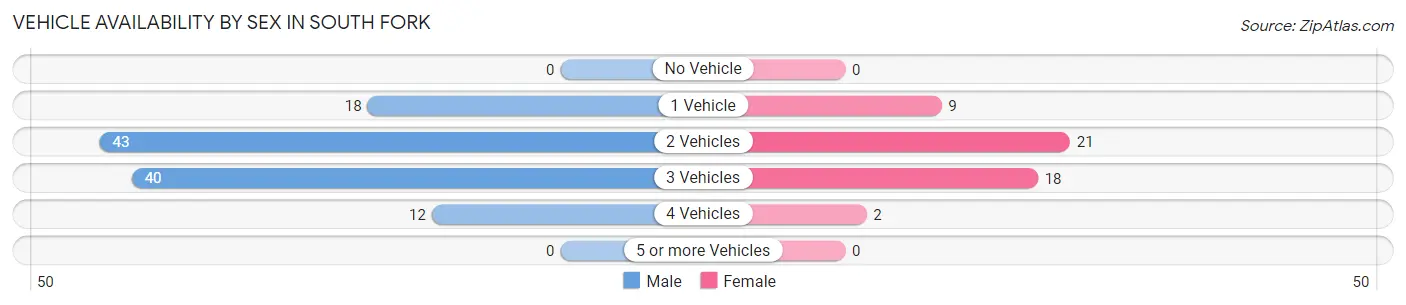
| Vehicles Available | Male | Female |
| No Vehicle | 0 (0.0%) | 0 (0.0%) |
| 1 Vehicle | 18 (15.9%) | 9 (18.0%) |
| 2 Vehicles | 43 (38.1%) | 21 (42.0%) |
| 3 Vehicles | 40 (35.4%) | 18 (36.0%) |
| 4 Vehicles | 12 (10.6%) | 2 (4.0%) |
| 5 or more Vehicles | 0 (0.0%) | 0 (0.0%) |
| Total | 113 (100.0%) | 50 (100.0%) |
Commute Time in South Fork
The most frequently occuring commute durations in South Fork are 30 to 34 minutes (26 commuters, 18.8%), 5 to 9 minutes (24 commuters, 17.4%), and less than 5 minutes (19 commuters, 13.8%).
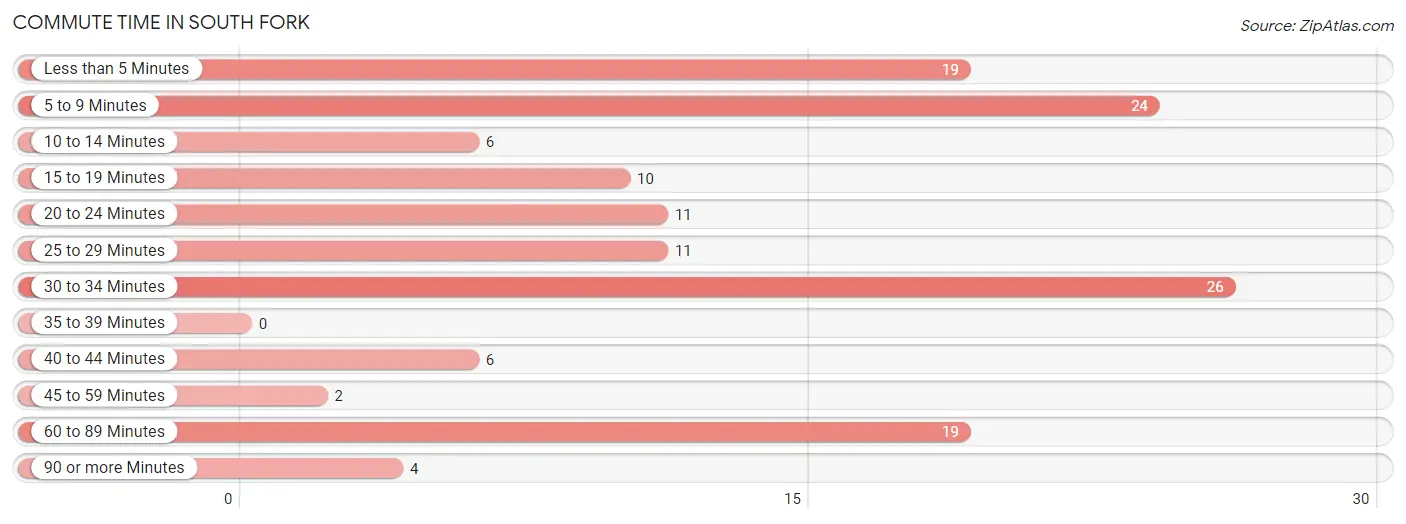
| Commute Time | # Commuters | % Commuters |
| Less than 5 Minutes | 19 | 13.8% |
| 5 to 9 Minutes | 24 | 17.4% |
| 10 to 14 Minutes | 6 | 4.3% |
| 15 to 19 Minutes | 10 | 7.2% |
| 20 to 24 Minutes | 11 | 8.0% |
| 25 to 29 Minutes | 11 | 8.0% |
| 30 to 34 Minutes | 26 | 18.8% |
| 35 to 39 Minutes | 0 | 0.0% |
| 40 to 44 Minutes | 6 | 4.3% |
| 45 to 59 Minutes | 2 | 1.5% |
| 60 to 89 Minutes | 19 | 13.8% |
| 90 or more Minutes | 4 | 2.9% |
Commute Time by Sex in South Fork
The most common commute times in South Fork are 30 to 34 minutes (26 commuters, 26.8%) for males and 5 to 9 minutes (10 commuters, 24.4%) for females.

| Commute Time | Male | Female |
| Less than 5 Minutes | 12 (12.4%) | 7 (17.1%) |
| 5 to 9 Minutes | 14 (14.4%) | 10 (24.4%) |
| 10 to 14 Minutes | 4 (4.1%) | 2 (4.9%) |
| 15 to 19 Minutes | 6 (6.2%) | 4 (9.8%) |
| 20 to 24 Minutes | 3 (3.1%) | 8 (19.5%) |
| 25 to 29 Minutes | 11 (11.3%) | 0 (0.0%) |
| 30 to 34 Minutes | 26 (26.8%) | 0 (0.0%) |
| 35 to 39 Minutes | 0 (0.0%) | 0 (0.0%) |
| 40 to 44 Minutes | 6 (6.2%) | 0 (0.0%) |
| 45 to 59 Minutes | 0 (0.0%) | 2 (4.9%) |
| 60 to 89 Minutes | 11 (11.3%) | 8 (19.5%) |
| 90 or more Minutes | 4 (4.1%) | 0 (0.0%) |
Time of Departure to Work by Sex in South Fork
The most frequent times of departure to work in South Fork are 8:00 AM to 8:29 AM (29, 29.9%) for males and 4:00 PM to 11:59 PM (12, 29.3%) for females.
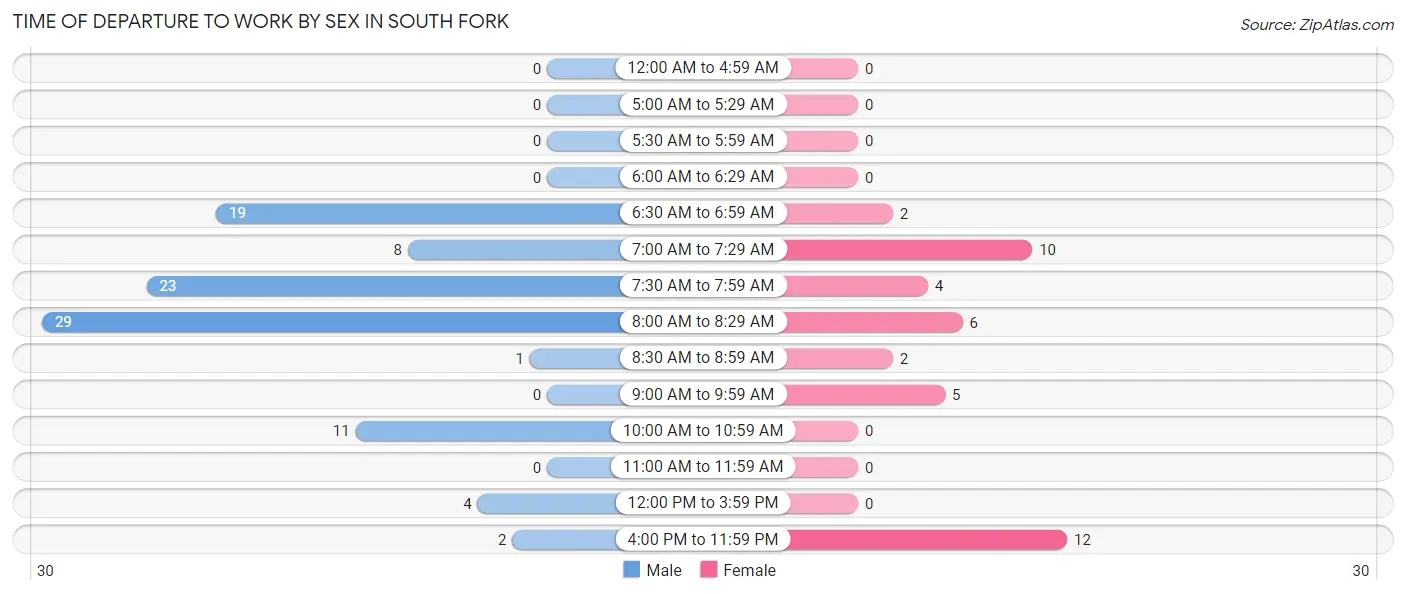
| Time of Departure | Male | Female |
| 12:00 AM to 4:59 AM | 0 (0.0%) | 0 (0.0%) |
| 5:00 AM to 5:29 AM | 0 (0.0%) | 0 (0.0%) |
| 5:30 AM to 5:59 AM | 0 (0.0%) | 0 (0.0%) |
| 6:00 AM to 6:29 AM | 0 (0.0%) | 0 (0.0%) |
| 6:30 AM to 6:59 AM | 19 (19.6%) | 2 (4.9%) |
| 7:00 AM to 7:29 AM | 8 (8.3%) | 10 (24.4%) |
| 7:30 AM to 7:59 AM | 23 (23.7%) | 4 (9.8%) |
| 8:00 AM to 8:29 AM | 29 (29.9%) | 6 (14.6%) |
| 8:30 AM to 8:59 AM | 1 (1.0%) | 2 (4.9%) |
| 9:00 AM to 9:59 AM | 0 (0.0%) | 5 (12.2%) |
| 10:00 AM to 10:59 AM | 11 (11.3%) | 0 (0.0%) |
| 11:00 AM to 11:59 AM | 0 (0.0%) | 0 (0.0%) |
| 12:00 PM to 3:59 PM | 4 (4.1%) | 0 (0.0%) |
| 4:00 PM to 11:59 PM | 2 (2.1%) | 12 (29.3%) |
| Total | 97 (100.0%) | 41 (100.0%) |
Housing Occupancy in South Fork
Occupancy by Ownership in South Fork
Of the total 213 dwellings in South Fork, owner-occupied units account for 159 (74.7%), while renter-occupied units make up 54 (25.4%).
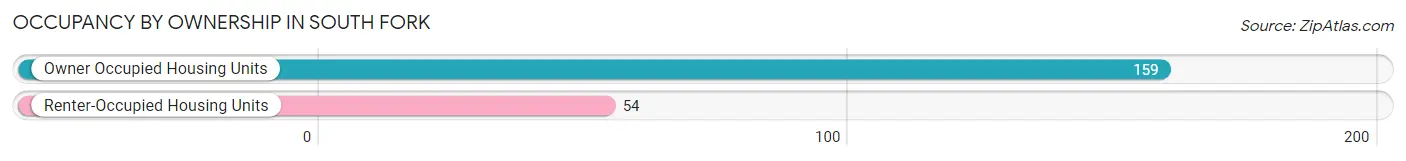
| Occupancy | # Housing Units | % Housing Units |
| Owner Occupied Housing Units | 159 | 74.7% |
| Renter-Occupied Housing Units | 54 | 25.4% |
| Total Occupied Housing Units | 213 | 100.0% |
Occupancy by Household Size in South Fork
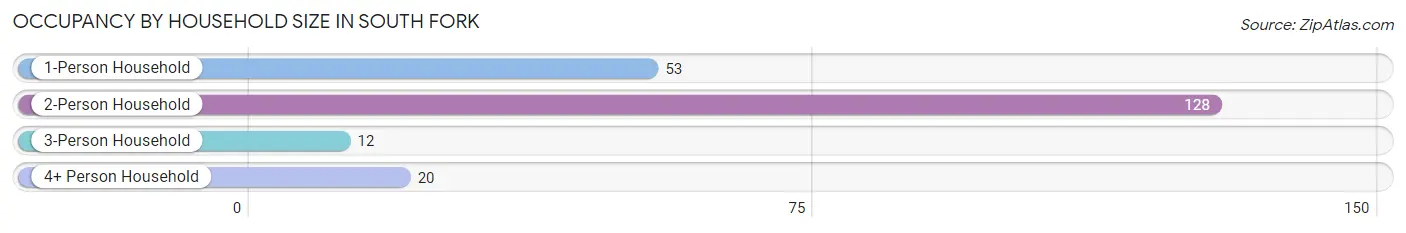
| Household Size | # Housing Units | % Housing Units |
| 1-Person Household | 53 | 24.9% |
| 2-Person Household | 128 | 60.1% |
| 3-Person Household | 12 | 5.6% |
| 4+ Person Household | 20 | 9.4% |
| Total Housing Units | 213 | 100.0% |
Occupancy by Ownership by Household Size in South Fork
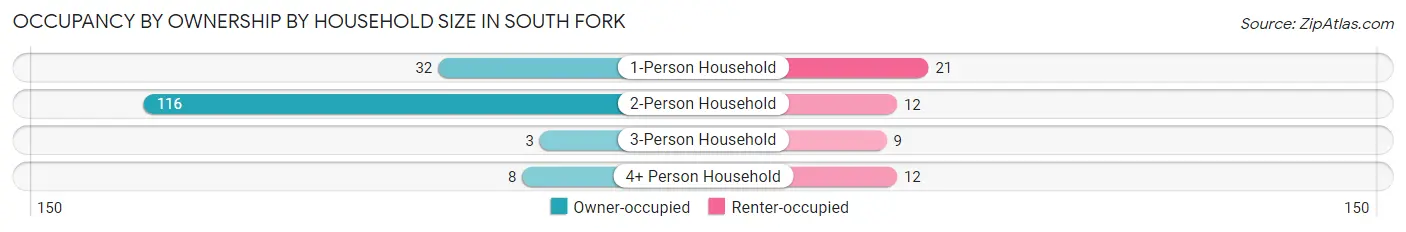
| Household Size | Owner-occupied | Renter-occupied |
| 1-Person Household | 32 (60.4%) | 21 (39.6%) |
| 2-Person Household | 116 (90.6%) | 12 (9.4%) |
| 3-Person Household | 3 (25.0%) | 9 (75.0%) |
| 4+ Person Household | 8 (40.0%) | 12 (60.0%) |
| Total Housing Units | 159 (74.7%) | 54 (25.4%) |
Occupancy by Educational Attainment in South Fork
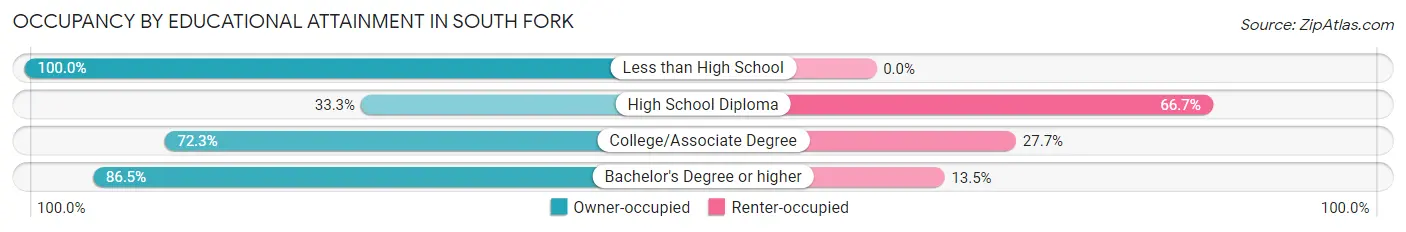
| Household Size | Owner-occupied | Renter-occupied |
| Less than High School | 7 (100.0%) | 0 (0.0%) |
| High School Diploma | 9 (33.3%) | 18 (66.7%) |
| College/Associate Degree | 60 (72.3%) | 23 (27.7%) |
| Bachelor's Degree or higher | 83 (86.5%) | 13 (13.5%) |
Occupancy by Age of Householder in South Fork
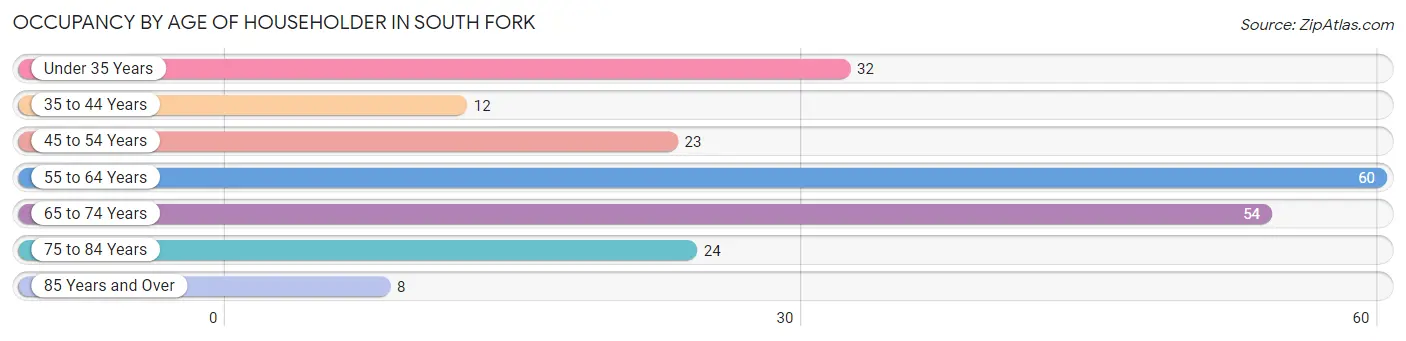
| Age Bracket | # Households | % Households |
| Under 35 Years | 32 | 15.0% |
| 35 to 44 Years | 12 | 5.6% |
| 45 to 54 Years | 23 | 10.8% |
| 55 to 64 Years | 60 | 28.2% |
| 65 to 74 Years | 54 | 25.4% |
| 75 to 84 Years | 24 | 11.3% |
| 85 Years and Over | 8 | 3.8% |
| Total | 213 | 100.0% |
Housing Finances in South Fork
Median Income by Occupancy in South Fork
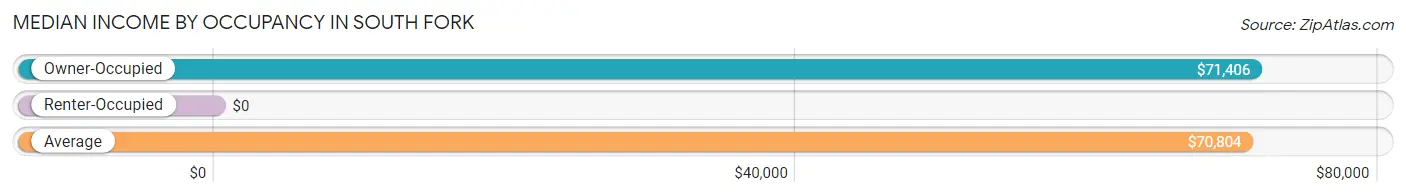
| Occupancy Type | # Households | Median Income |
| Owner-Occupied | 159 (74.7%) | $71,406 |
| Renter-Occupied | 54 (25.4%) | $0 |
| Average | 213 (100.0%) | $70,804 |
Occupancy by Householder Income Bracket in South Fork
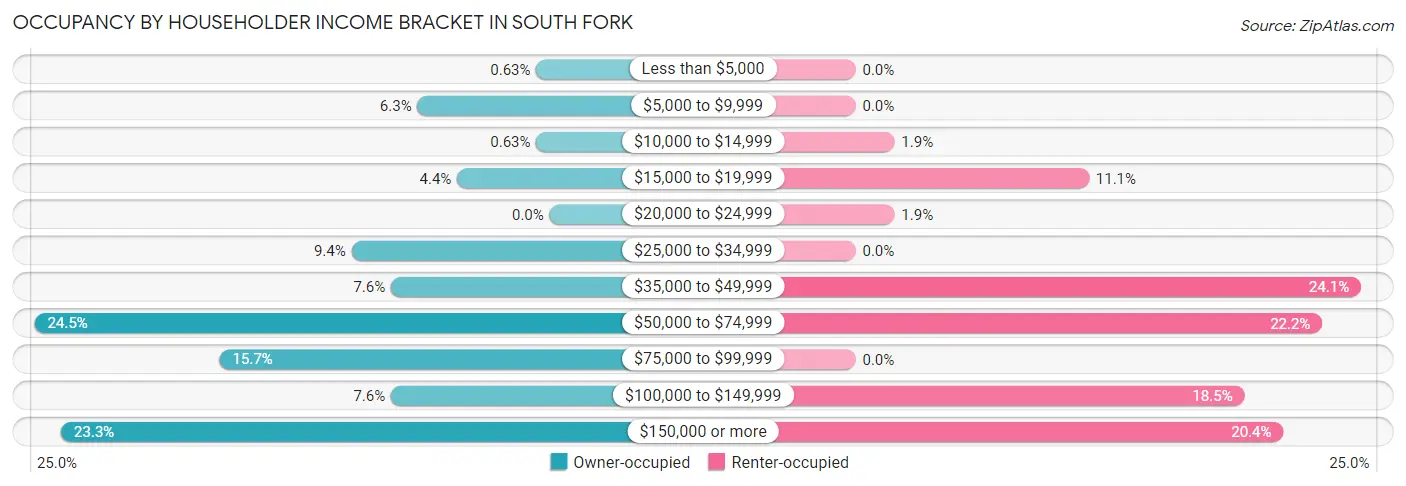
| Income Bracket | Owner-occupied | Renter-occupied |
| Less than $5,000 | 1 (0.6%) | 0 (0.0%) |
| $5,000 to $9,999 | 10 (6.3%) | 0 (0.0%) |
| $10,000 to $14,999 | 1 (0.6%) | 1 (1.8%) |
| $15,000 to $19,999 | 7 (4.4%) | 6 (11.1%) |
| $20,000 to $24,999 | 0 (0.0%) | 1 (1.8%) |
| $25,000 to $34,999 | 15 (9.4%) | 0 (0.0%) |
| $35,000 to $49,999 | 12 (7.5%) | 13 (24.1%) |
| $50,000 to $74,999 | 39 (24.5%) | 12 (22.2%) |
| $75,000 to $99,999 | 25 (15.7%) | 0 (0.0%) |
| $100,000 to $149,999 | 12 (7.5%) | 10 (18.5%) |
| $150,000 or more | 37 (23.3%) | 11 (20.4%) |
| Total | 159 (100.0%) | 54 (100.0%) |
Monthly Housing Cost Tiers in South Fork
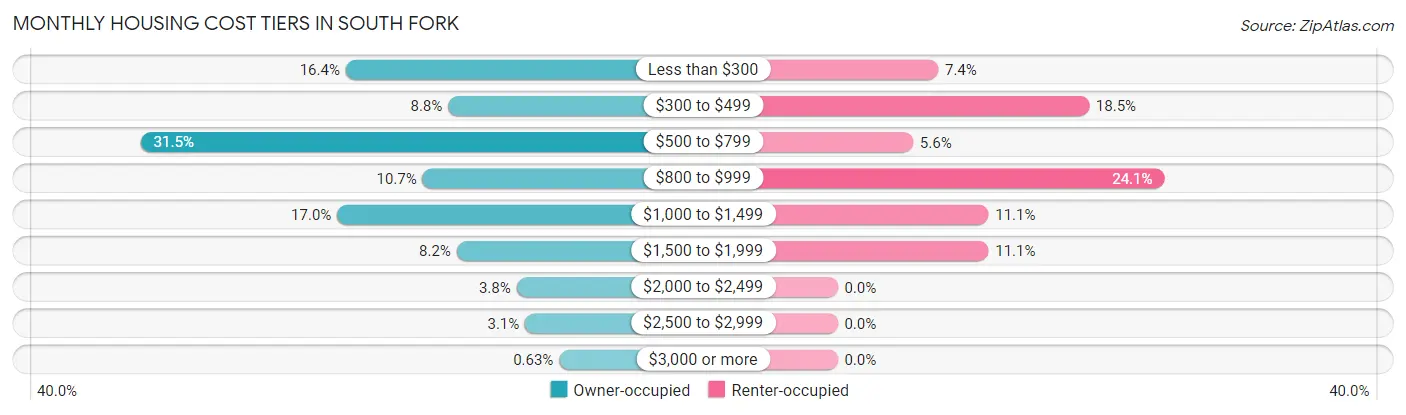
| Monthly Cost | Owner-occupied | Renter-occupied |
| Less than $300 | 26 (16.4%) | 4 (7.4%) |
| $300 to $499 | 14 (8.8%) | 10 (18.5%) |
| $500 to $799 | 50 (31.5%) | 3 (5.6%) |
| $800 to $999 | 17 (10.7%) | 13 (24.1%) |
| $1,000 to $1,499 | 27 (17.0%) | 6 (11.1%) |
| $1,500 to $1,999 | 13 (8.2%) | 6 (11.1%) |
| $2,000 to $2,499 | 6 (3.8%) | 0 (0.0%) |
| $2,500 to $2,999 | 5 (3.1%) | 0 (0.0%) |
| $3,000 or more | 1 (0.6%) | 0 (0.0%) |
| Total | 159 (100.0%) | 54 (100.0%) |
Physical Housing Characteristics in South Fork
Housing Structures in South Fork
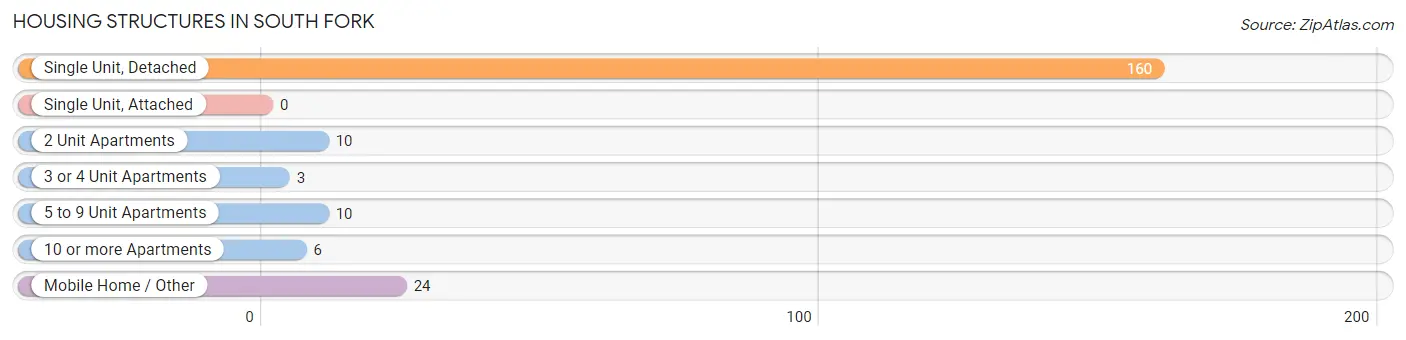
| Structure Type | # Housing Units | % Housing Units |
| Single Unit, Detached | 160 | 75.1% |
| Single Unit, Attached | 0 | 0.0% |
| 2 Unit Apartments | 10 | 4.7% |
| 3 or 4 Unit Apartments | 3 | 1.4% |
| 5 to 9 Unit Apartments | 10 | 4.7% |
| 10 or more Apartments | 6 | 2.8% |
| Mobile Home / Other | 24 | 11.3% |
| Total | 213 | 100.0% |
Housing Structures by Occupancy in South Fork
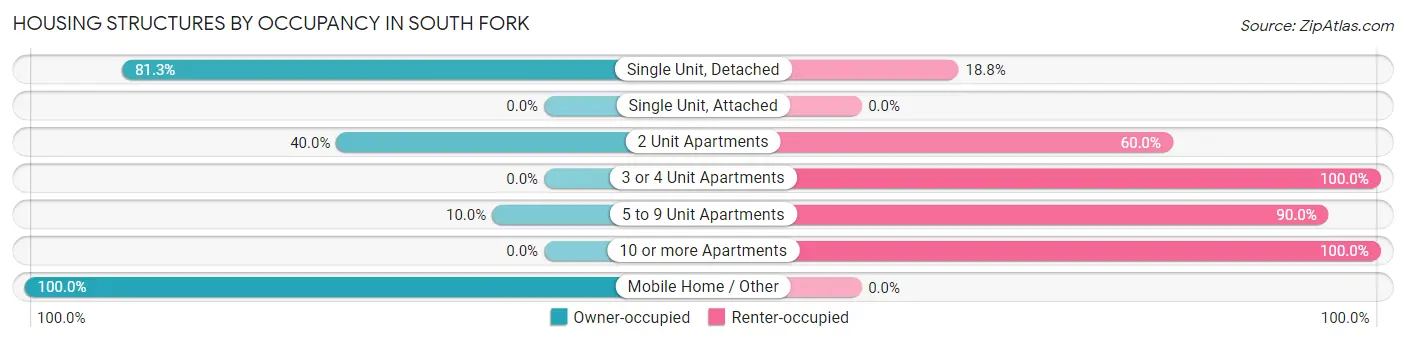
| Structure Type | Owner-occupied | Renter-occupied |
| Single Unit, Detached | 130 (81.2%) | 30 (18.8%) |
| Single Unit, Attached | 0 (0.0%) | 0 (0.0%) |
| 2 Unit Apartments | 4 (40.0%) | 6 (60.0%) |
| 3 or 4 Unit Apartments | 0 (0.0%) | 3 (100.0%) |
| 5 to 9 Unit Apartments | 1 (10.0%) | 9 (90.0%) |
| 10 or more Apartments | 0 (0.0%) | 6 (100.0%) |
| Mobile Home / Other | 24 (100.0%) | 0 (0.0%) |
| Total | 159 (74.7%) | 54 (25.4%) |
Housing Structures by Number of Rooms in South Fork
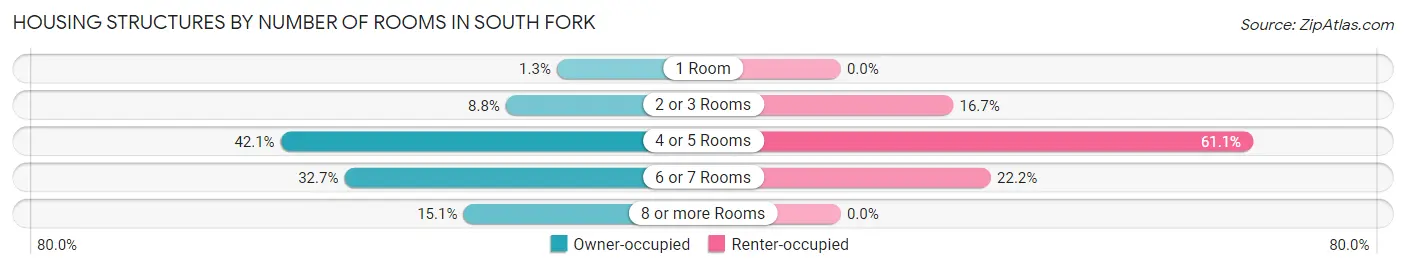
| Number of Rooms | Owner-occupied | Renter-occupied |
| 1 Room | 2 (1.3%) | 0 (0.0%) |
| 2 or 3 Rooms | 14 (8.8%) | 9 (16.7%) |
| 4 or 5 Rooms | 67 (42.1%) | 33 (61.1%) |
| 6 or 7 Rooms | 52 (32.7%) | 12 (22.2%) |
| 8 or more Rooms | 24 (15.1%) | 0 (0.0%) |
| Total | 159 (100.0%) | 54 (100.0%) |
Housing Structure by Heating Type in South Fork
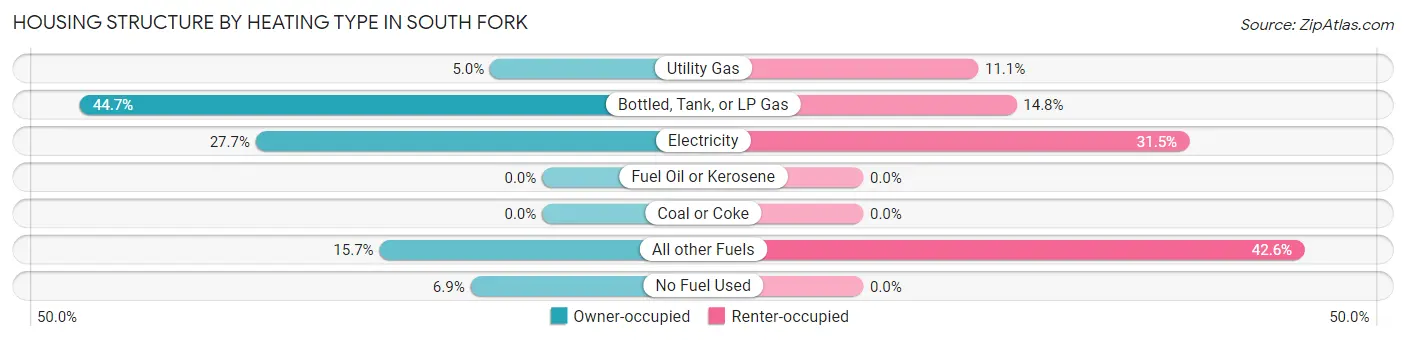
| Heating Type | Owner-occupied | Renter-occupied |
| Utility Gas | 8 (5.0%) | 6 (11.1%) |
| Bottled, Tank, or LP Gas | 71 (44.7%) | 8 (14.8%) |
| Electricity | 44 (27.7%) | 17 (31.5%) |
| Fuel Oil or Kerosene | 0 (0.0%) | 0 (0.0%) |
| Coal or Coke | 0 (0.0%) | 0 (0.0%) |
| All other Fuels | 25 (15.7%) | 23 (42.6%) |
| No Fuel Used | 11 (6.9%) | 0 (0.0%) |
| Total | 159 (100.0%) | 54 (100.0%) |
Household Vehicle Usage in South Fork
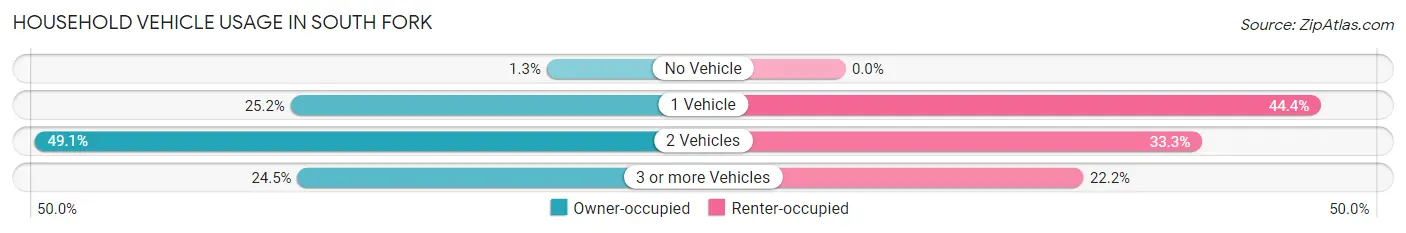
| Vehicles per Household | Owner-occupied | Renter-occupied |
| No Vehicle | 2 (1.3%) | 0 (0.0%) |
| 1 Vehicle | 40 (25.2%) | 24 (44.4%) |
| 2 Vehicles | 78 (49.1%) | 18 (33.3%) |
| 3 or more Vehicles | 39 (24.5%) | 12 (22.2%) |
| Total | 159 (100.0%) | 54 (100.0%) |
Real Estate & Mortgages in South Fork
Real Estate and Mortgage Overview in South Fork
| Characteristic | Without Mortgage | With Mortgage |
| Housing Units | 105 | 54 |
| Median Property Value | $334,000 | $383,300 |
| Median Household Income | $84,375 | $2 |
| Monthly Housing Costs | $629 | $1 |
| Real Estate Taxes | $1,143 | $6 |
Property Value by Mortgage Status in South Fork
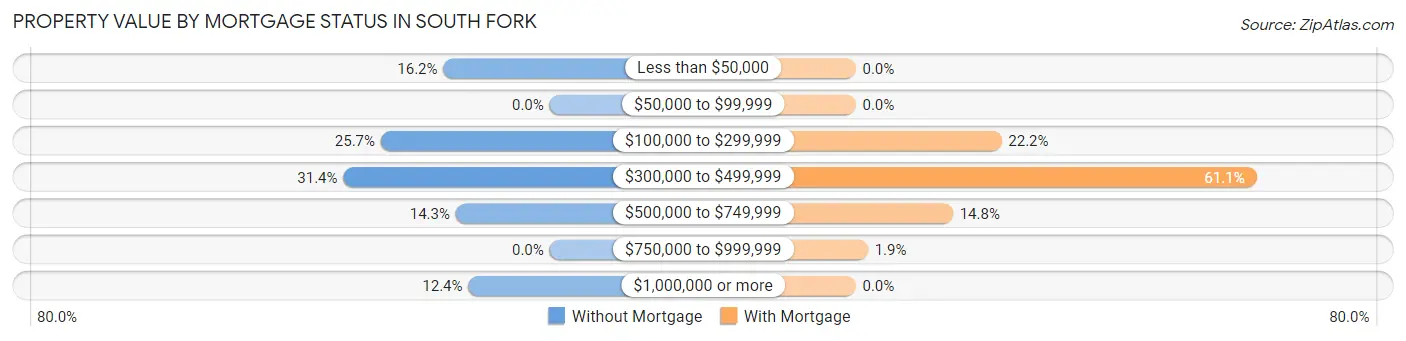
| Property Value | Without Mortgage | With Mortgage |
| Less than $50,000 | 17 (16.2%) | 0 (0.0%) |
| $50,000 to $99,999 | 0 (0.0%) | 0 (0.0%) |
| $100,000 to $299,999 | 27 (25.7%) | 12 (22.2%) |
| $300,000 to $499,999 | 33 (31.4%) | 33 (61.1%) |
| $500,000 to $749,999 | 15 (14.3%) | 8 (14.8%) |
| $750,000 to $999,999 | 0 (0.0%) | 1 (1.8%) |
| $1,000,000 or more | 13 (12.4%) | 0 (0.0%) |
| Total | 105 (100.0%) | 54 (100.0%) |
Household Income by Mortgage Status in South Fork
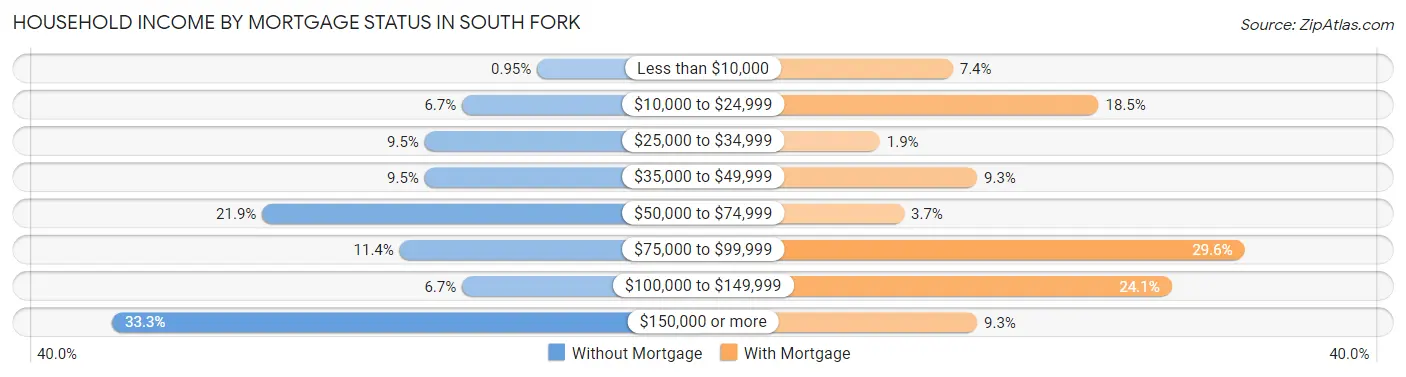
| Household Income | Without Mortgage | With Mortgage |
| Less than $10,000 | 1 (0.9%) | 4 (7.4%) |
| $10,000 to $24,999 | 7 (6.7%) | 10 (18.5%) |
| $25,000 to $34,999 | 10 (9.5%) | 1 (1.8%) |
| $35,000 to $49,999 | 10 (9.5%) | 5 (9.3%) |
| $50,000 to $74,999 | 23 (21.9%) | 2 (3.7%) |
| $75,000 to $99,999 | 12 (11.4%) | 16 (29.6%) |
| $100,000 to $149,999 | 7 (6.7%) | 13 (24.1%) |
| $150,000 or more | 35 (33.3%) | 5 (9.3%) |
| Total | 105 (100.0%) | 54 (100.0%) |
Property Value to Household Income Ratio in South Fork
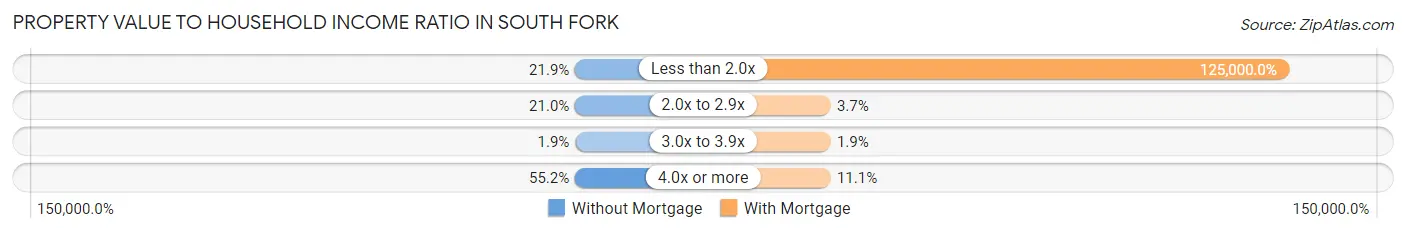
| Value-to-Income Ratio | Without Mortgage | With Mortgage |
| Less than 2.0x | 23 (21.9%) | 67,500 (125,000.0%) |
| 2.0x to 2.9x | 22 (20.9%) | 2 (3.7%) |
| 3.0x to 3.9x | 2 (1.9%) | 1 (1.8%) |
| 4.0x or more | 58 (55.2%) | 6 (11.1%) |
| Total | 105 (100.0%) | 54 (100.0%) |
Real Estate Taxes by Mortgage Status in South Fork
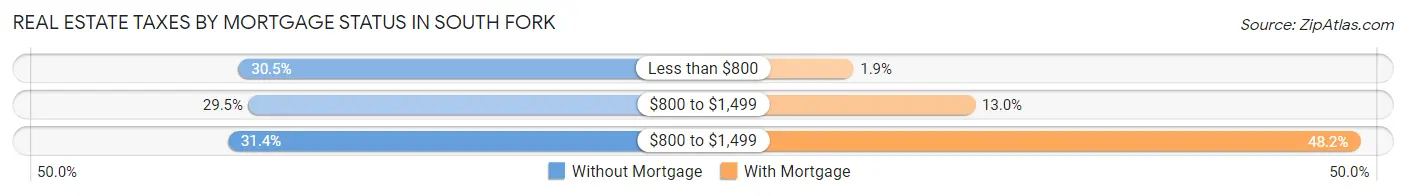
| Property Taxes | Without Mortgage | With Mortgage |
| Less than $800 | 32 (30.5%) | 1 (1.8%) |
| $800 to $1,499 | 31 (29.5%) | 7 (13.0%) |
| $800 to $1,499 | 33 (31.4%) | 26 (48.1%) |
| Total | 105 (100.0%) | 54 (100.0%) |
Health & Disability in South Fork
Health Insurance Coverage by Age in South Fork
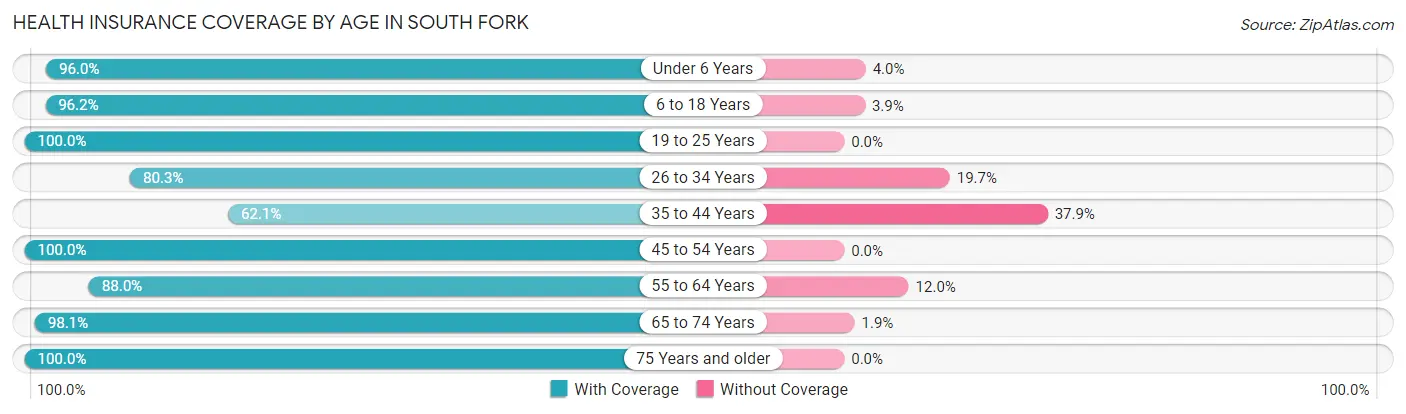
| Age Bracket | With Coverage | Without Coverage |
| Under 6 Years | 24 (96.0%) | 1 (4.0%) |
| 6 to 18 Years | 25 (96.2%) | 1 (3.8%) |
| 19 to 25 Years | 24 (100.0%) | 0 (0.0%) |
| 26 to 34 Years | 49 (80.3%) | 12 (19.7%) |
| 35 to 44 Years | 18 (62.1%) | 11 (37.9%) |
| 45 to 54 Years | 42 (100.0%) | 0 (0.0%) |
| 55 to 64 Years | 88 (88.0%) | 12 (12.0%) |
| 65 to 74 Years | 102 (98.1%) | 2 (1.9%) |
| 75 Years and older | 47 (100.0%) | 0 (0.0%) |
| Total | 419 (91.5%) | 39 (8.5%) |
Health Insurance Coverage by Citizenship Status in South Fork
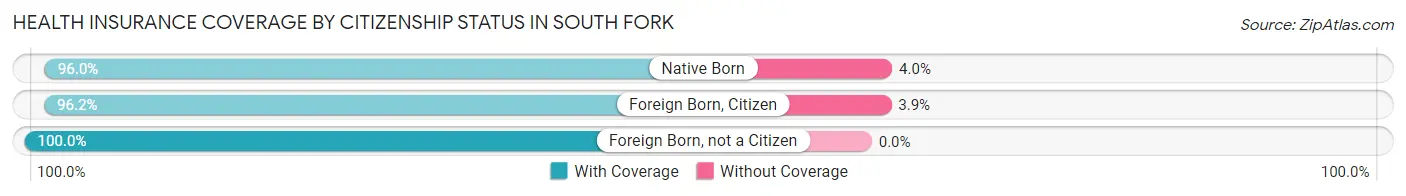
| Citizenship Status | With Coverage | Without Coverage |
| Native Born | 24 (96.0%) | 1 (4.0%) |
| Foreign Born, Citizen | 25 (96.2%) | 1 (3.8%) |
| Foreign Born, not a Citizen | 24 (100.0%) | 0 (0.0%) |
Health Insurance Coverage by Household Income in South Fork
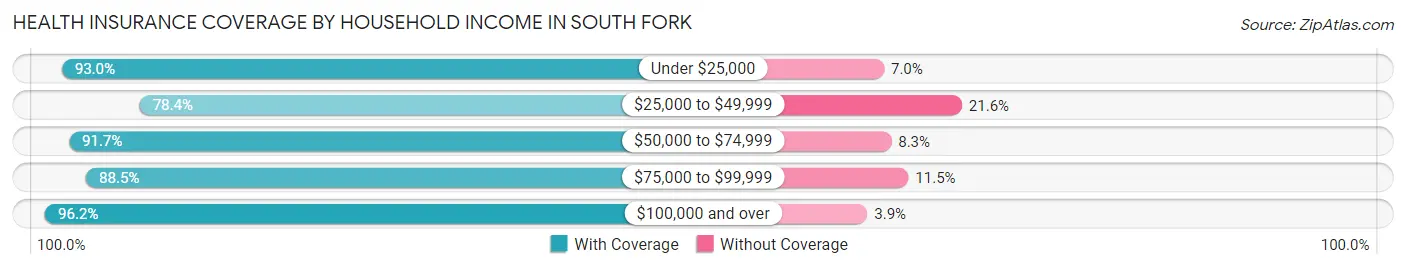
| Household Income | With Coverage | Without Coverage |
| Under $25,000 | 40 (93.0%) | 3 (7.0%) |
| $25,000 to $49,999 | 40 (78.4%) | 11 (21.6%) |
| $50,000 to $74,999 | 143 (91.7%) | 13 (8.3%) |
| $75,000 to $99,999 | 46 (88.5%) | 6 (11.5%) |
| $100,000 and over | 150 (96.2%) | 6 (3.8%) |
Public vs Private Health Insurance Coverage by Age in South Fork
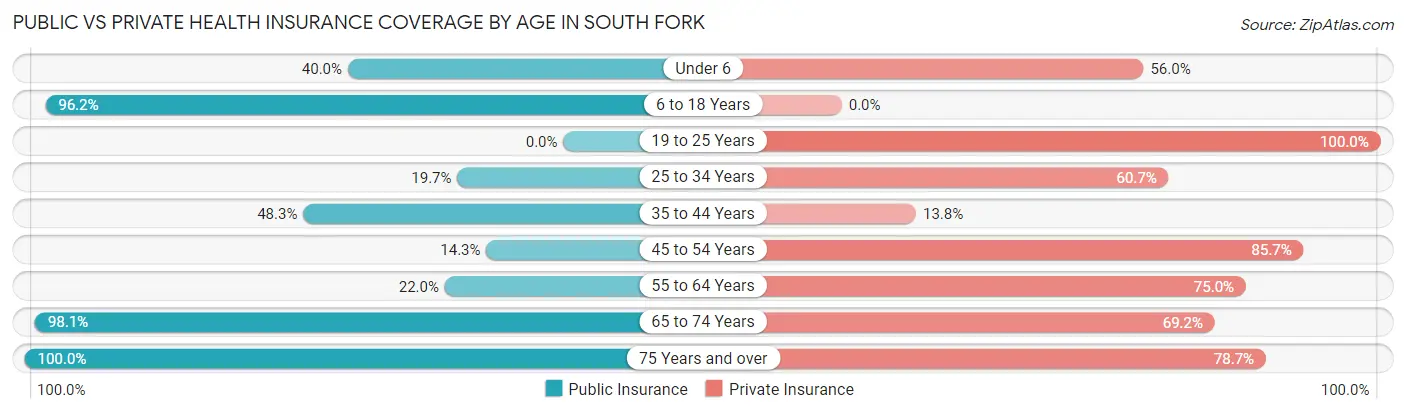
| Age Bracket | Public Insurance | Private Insurance |
| Under 6 | 10 (40.0%) | 14 (56.0%) |
| 6 to 18 Years | 25 (96.2%) | 0 (0.0%) |
| 19 to 25 Years | 0 (0.0%) | 24 (100.0%) |
| 25 to 34 Years | 12 (19.7%) | 37 (60.7%) |
| 35 to 44 Years | 14 (48.3%) | 4 (13.8%) |
| 45 to 54 Years | 6 (14.3%) | 36 (85.7%) |
| 55 to 64 Years | 22 (22.0%) | 75 (75.0%) |
| 65 to 74 Years | 102 (98.1%) | 72 (69.2%) |
| 75 Years and over | 47 (100.0%) | 37 (78.7%) |
| Total | 238 (52.0%) | 299 (65.3%) |
Disability Status by Sex by Age in South Fork
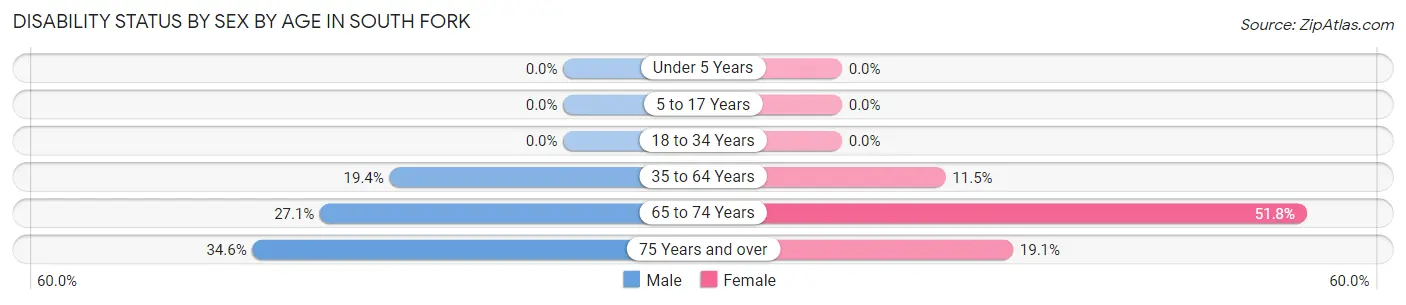
| Age Bracket | Male | Female |
| Under 5 Years | 0 (0.0%) | 0 (0.0%) |
| 5 to 17 Years | 0 (0.0%) | 0 (0.0%) |
| 18 to 34 Years | 0 (0.0%) | 0 (0.0%) |
| 35 to 64 Years | 18 (19.4%) | 9 (11.5%) |
| 65 to 74 Years | 13 (27.1%) | 29 (51.8%) |
| 75 Years and over | 9 (34.6%) | 4 (19.1%) |
Disability Class by Sex by Age in South Fork
Disability Class: Hearing Difficulty
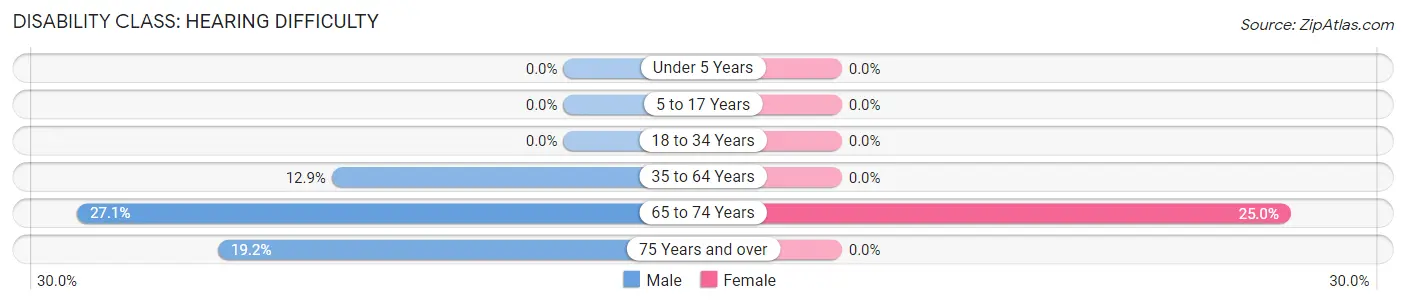
| Age Bracket | Male | Female |
| Under 5 Years | 0 (0.0%) | 0 (0.0%) |
| 5 to 17 Years | 0 (0.0%) | 0 (0.0%) |
| 18 to 34 Years | 0 (0.0%) | 0 (0.0%) |
| 35 to 64 Years | 12 (12.9%) | 0 (0.0%) |
| 65 to 74 Years | 13 (27.1%) | 14 (25.0%) |
| 75 Years and over | 5 (19.2%) | 0 (0.0%) |
Disability Class: Vision Difficulty
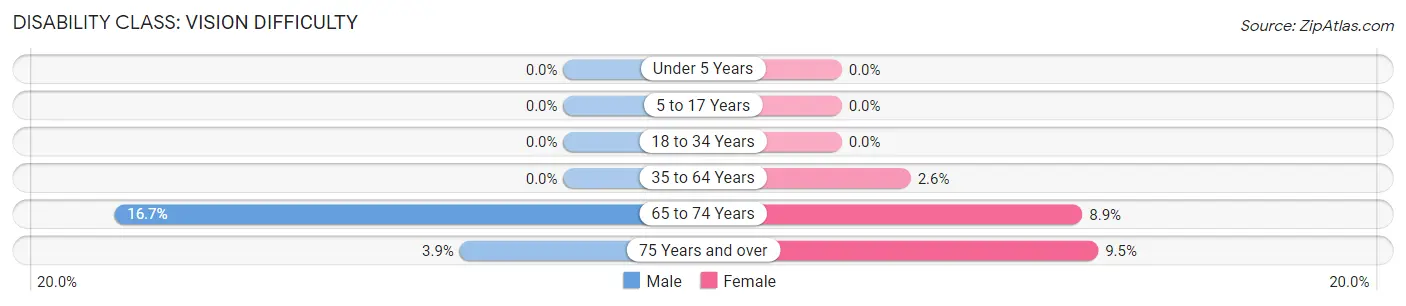
| Age Bracket | Male | Female |
| Under 5 Years | 0 (0.0%) | 0 (0.0%) |
| 5 to 17 Years | 0 (0.0%) | 0 (0.0%) |
| 18 to 34 Years | 0 (0.0%) | 0 (0.0%) |
| 35 to 64 Years | 0 (0.0%) | 2 (2.6%) |
| 65 to 74 Years | 8 (16.7%) | 5 (8.9%) |
| 75 Years and over | 1 (3.8%) | 2 (9.5%) |
Disability Class: Cognitive Difficulty
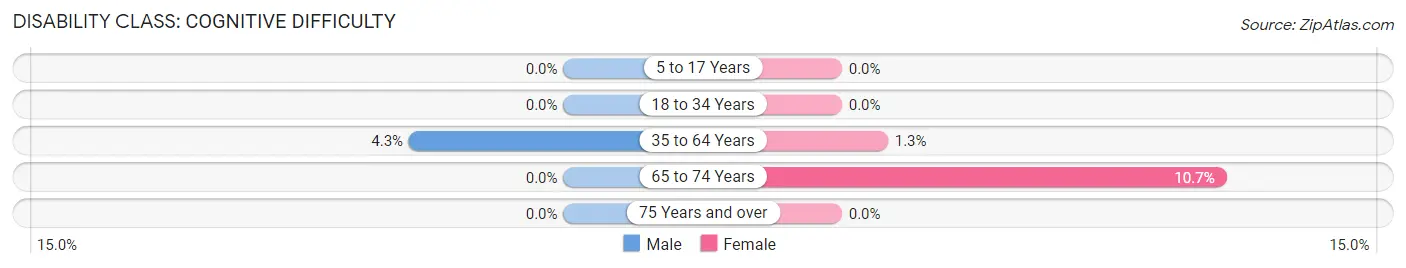
| Age Bracket | Male | Female |
| 5 to 17 Years | 0 (0.0%) | 0 (0.0%) |
| 18 to 34 Years | 0 (0.0%) | 0 (0.0%) |
| 35 to 64 Years | 4 (4.3%) | 1 (1.3%) |
| 65 to 74 Years | 0 (0.0%) | 6 (10.7%) |
| 75 Years and over | 0 (0.0%) | 0 (0.0%) |
Disability Class: Ambulatory Difficulty
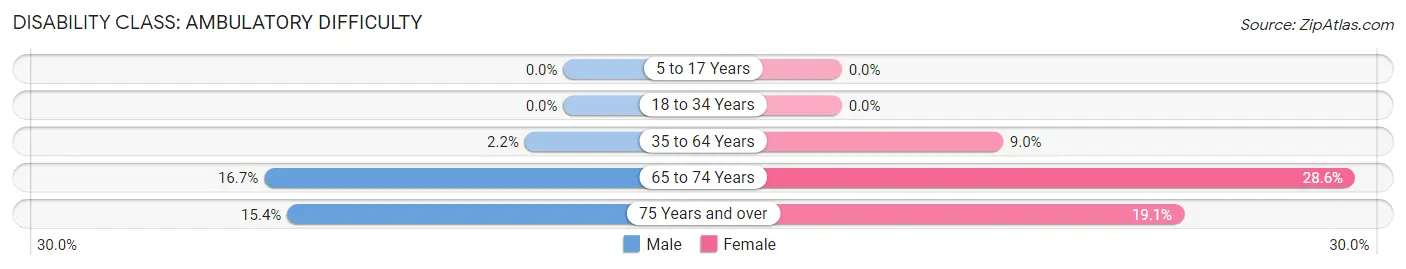
| Age Bracket | Male | Female |
| 5 to 17 Years | 0 (0.0%) | 0 (0.0%) |
| 18 to 34 Years | 0 (0.0%) | 0 (0.0%) |
| 35 to 64 Years | 2 (2.1%) | 7 (9.0%) |
| 65 to 74 Years | 8 (16.7%) | 16 (28.6%) |
| 75 Years and over | 4 (15.4%) | 4 (19.1%) |
Disability Class: Self-Care Difficulty
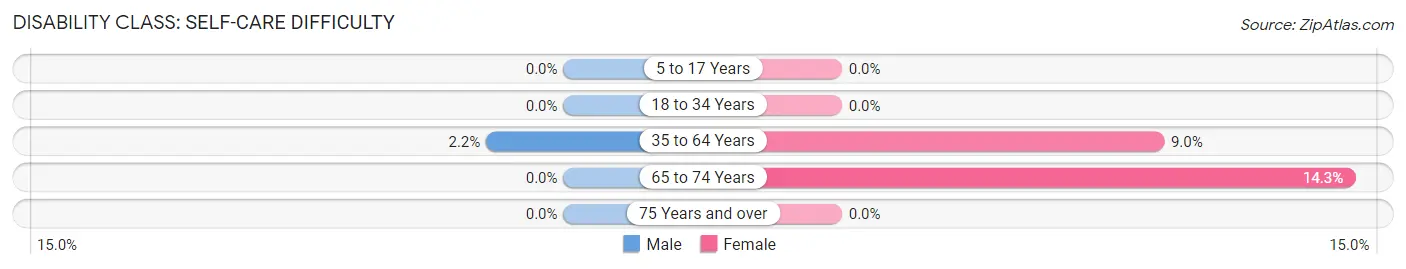
| Age Bracket | Male | Female |
| 5 to 17 Years | 0 (0.0%) | 0 (0.0%) |
| 18 to 34 Years | 0 (0.0%) | 0 (0.0%) |
| 35 to 64 Years | 2 (2.1%) | 7 (9.0%) |
| 65 to 74 Years | 0 (0.0%) | 8 (14.3%) |
| 75 Years and over | 0 (0.0%) | 0 (0.0%) |
Technology Access in South Fork
Computing Device Access in South Fork
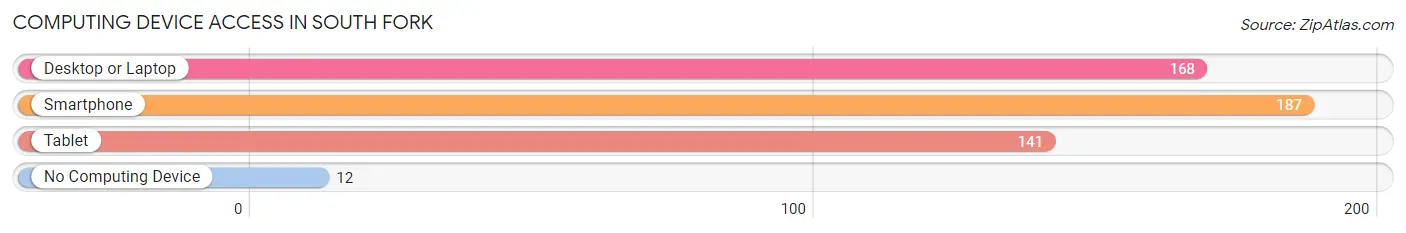
| Device Type | # Households | % Households |
| Desktop or Laptop | 168 | 78.9% |
| Smartphone | 187 | 87.8% |
| Tablet | 141 | 66.2% |
| No Computing Device | 12 | 5.6% |
| Total | 213 | 100.0% |
Internet Access in South Fork

| Internet Type | # Households | % Households |
| Dial-Up Internet | 0 | 0.0% |
| Broadband Home | 183 | 85.9% |
| Cellular Data Only | 17 | 8.0% |
| Satellite Internet | 13 | 6.1% |
| No Internet | 11 | 5.2% |
| Total | 213 | 100.0% |
South Fork Summary
History
South Fork is a small town located in the San Luis Valley of south-central Colorado. It is situated at the confluence of the Rio Grande and South Fork Rivers, and is surrounded by the majestic San Juan Mountains. The town was founded in 1876 by prospectors who were searching for gold and silver in the area. The town was originally called South Fork City, but the name was changed to South Fork in 1882.
The town was a popular destination for miners and prospectors during the late 19th century, and it was also a popular stop for travelers on the Denver & Rio Grande Railroad. The railroad was instrumental in the development of the town, as it provided access to the surrounding area and allowed for the transportation of goods and services.
The town experienced a period of growth in the early 20th century, as the mining industry in the area flourished. The town was also home to a number of businesses, including a hotel, a bank, a general store, and a post office.
In the late 20th century, the town experienced a period of decline as the mining industry in the area declined. The town was also affected by the closure of the Denver & Rio Grande Railroad in the late 1980s.
Geography
South Fork is located in the San Luis Valley of south-central Colorado. The town is situated at the confluence of the Rio Grande and South Fork Rivers, and is surrounded by the majestic San Juan Mountains. The town is located at an elevation of 8,000 feet, and has a total area of 1.2 square miles.
The climate in South Fork is semi-arid, with hot summers and cold winters. The average annual temperature is 45 degrees Fahrenheit, and the average annual precipitation is 12 inches.
Economy
The economy of South Fork is largely based on tourism. The town is a popular destination for outdoor enthusiasts, as it is surrounded by the San Juan Mountains and is home to a number of recreational activities, including fishing, camping, hiking, and skiing.
The town is also home to a number of businesses, including restaurants, hotels, and retail stores. The town is also home to a number of manufacturing and service-based businesses, including a lumber mill, a sawmill, and a machine shop.
Demographics
As of the 2010 census, the population of South Fork was 562. The racial makeup of the town was 95.3% White, 0.7% Native American, 0.2% Asian, 0.2% from other races, and 3.6% from two or more races. The median household income was $37,500, and the median family income was $41,250.
The town is home to a number of religious organizations, including the South Fork United Methodist Church, the South Fork Baptist Church, and the South Fork Presbyterian Church. The town is also home to a number of civic organizations, including the South Fork Lions Club and the South Fork Chamber of Commerce.
Common Questions
What is Per Capita Income in South Fork?
Per Capita income in South Fork is $45,949.
What is the Median Family Income in South Fork?
Median Family Income in South Fork is $72,232.
What is the Median Household income in South Fork?
Median Household Income in South Fork is $70,804.
What is Income or Wage Gap in South Fork?
Income or Wage Gap in South Fork is 13.2%.
Women in South Fork earn 86.8 cents for every dollar earned by a man.
What is Inequality or Gini Index in South Fork?
Inequality or Gini Index in South Fork is 0.43.
What is the Total Population of South Fork?
Total Population of South Fork is 458.
What is the Total Male Population of South Fork?
Total Male Population of South Fork is 242.
What is the Total Female Population of South Fork?
Total Female Population of South Fork is 216.
What is the Ratio of Males per 100 Females in South Fork?
There are 112.04 Males per 100 Females in South Fork.
What is the Ratio of Females per 100 Males in South Fork?
There are 89.26 Females per 100 Males in South Fork.
What is the Median Population Age in South Fork?
Median Population Age in South Fork is 59.3 Years.
What is the Average Family Size in South Fork
Average Family Size in South Fork is 2.4 People.
What is the Average Household Size in South Fork
Average Household Size in South Fork is 2.1 People.
How Large is the Labor Force in South Fork?
There are 180 People in the Labor Forcein in South Fork.
What is the Percentage of People in the Labor Force in South Fork?
44.2% of People are in the Labor Force in South Fork.
What is the Unemployment Rate in South Fork?
Unemployment Rate in South Fork is 8.3%.