Sheridan Lake, CO Map & Demographics
Sheridan Lake Map
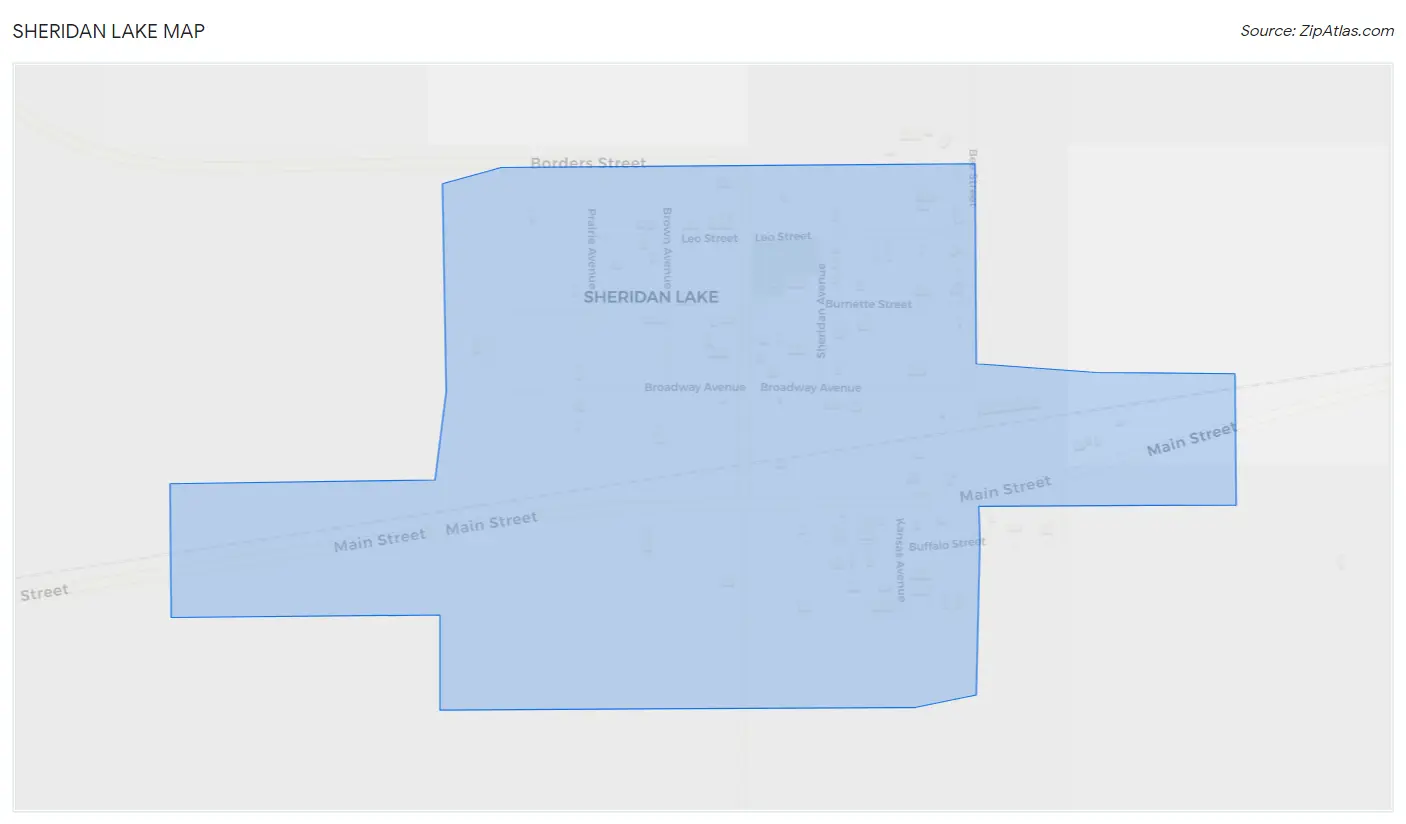
Sheridan Lake Overview
$21,189
PER CAPITA INCOME
$51,250
AVG FAMILY INCOME
$58,125
AVG HOUSEHOLD INCOME
45.8%
WAGE / INCOME GAP [ % ]
54.2¢/ $1
WAGE / INCOME GAP [ $ ]
0.38
INEQUALITY / GINI INDEX
56
TOTAL POPULATION
27
MALE POPULATION
29
FEMALE POPULATION
93.10
MALES / 100 FEMALES
107.41
FEMALES / 100 MALES
26.8
MEDIAN AGE
3.5
AVG FAMILY SIZE
3.7
AVG HOUSEHOLD SIZE
21
LABOR FORCE [ PEOPLE ]
67.7%
PERCENT IN LABOR FORCE
Sheridan Lake Zip Codes
Sheridan Lake Area Codes
Income in Sheridan Lake
Income Overview in Sheridan Lake
Per Capita Income in Sheridan Lake is $21,189, while median incomes of families and households are $51,250 and $58,125 respectively.
| Characteristic | Number | Measure |
| Per Capita Income | 56 | $21,189 |
| Median Family Income | 15 | $51,250 |
| Mean Family Income | 15 | $69,813 |
| Median Household Income | 15 | $58,125 |
| Mean Household Income | 15 | $77,180 |
| Income Deficit | 15 | $0 |
| Wage / Income Gap (%) | 56 | 45.81% |
| Wage / Income Gap ($) | 56 | 54.19¢ per $1 |
| Gini / Inequality Index | 56 | 0.38 |
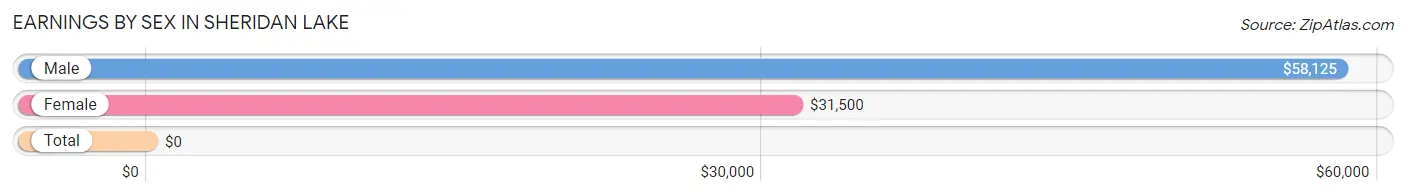
Earnings by Sex in Sheridan Lake
| Sex | Number | Average Earnings |
| Male | 11 (52.4%) | $58,125 |
| Female | 10 (47.6%) | $31,500 |
| Total | 21 (100.0%) | $0 |
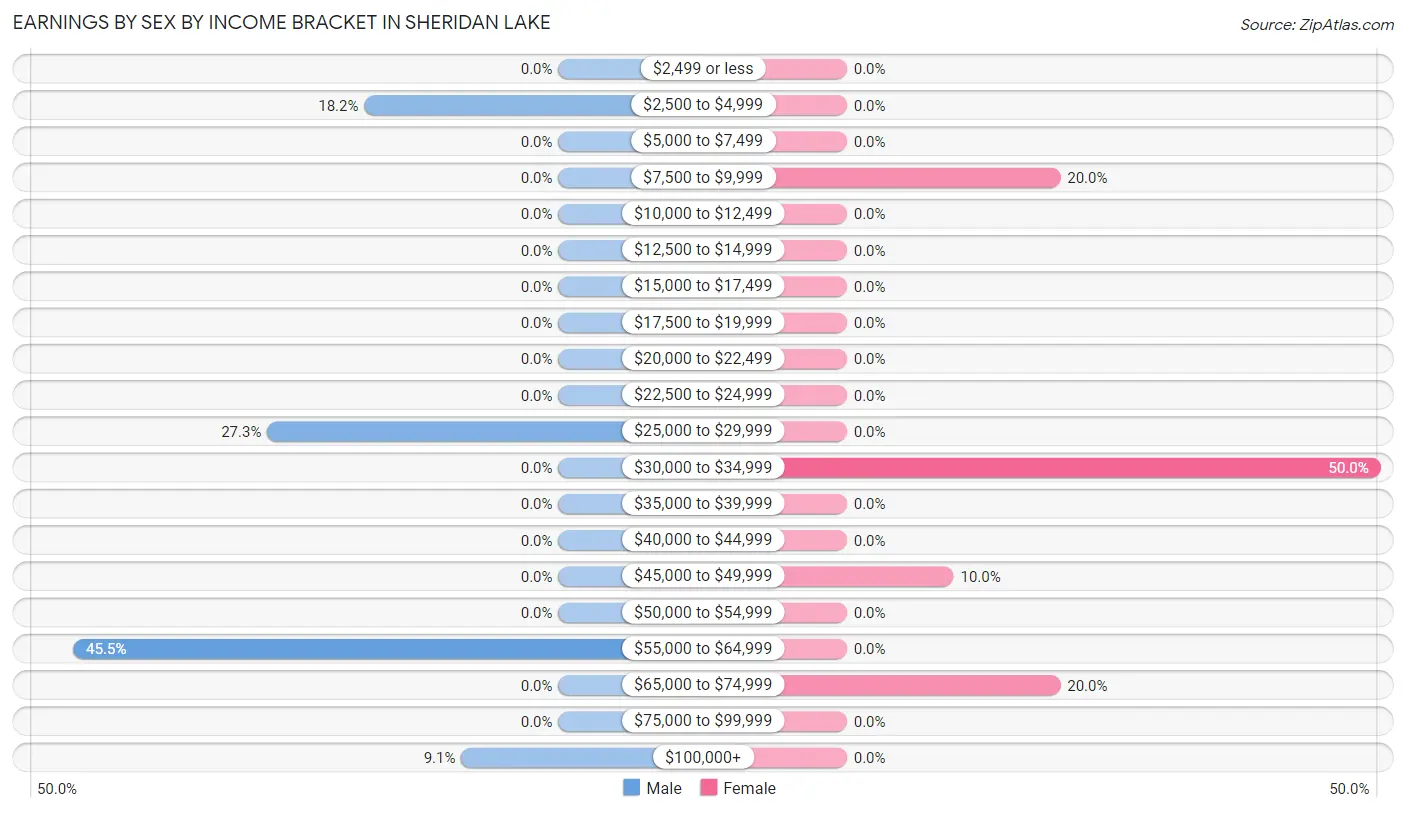
Earnings by Sex by Income Bracket in Sheridan Lake
The most common earnings brackets in Sheridan Lake are $55,000 to $64,999 for men (5 | 45.5%) and $30,000 to $34,999 for women (5 | 50.0%).
| Income | Male | Female |
| $2,499 or less | 0 (0.0%) | 0 (0.0%) |
| $2,500 to $4,999 | 2 (18.2%) | 0 (0.0%) |
| $5,000 to $7,499 | 0 (0.0%) | 0 (0.0%) |
| $7,500 to $9,999 | 0 (0.0%) | 2 (20.0%) |
| $10,000 to $12,499 | 0 (0.0%) | 0 (0.0%) |
| $12,500 to $14,999 | 0 (0.0%) | 0 (0.0%) |
| $15,000 to $17,499 | 0 (0.0%) | 0 (0.0%) |
| $17,500 to $19,999 | 0 (0.0%) | 0 (0.0%) |
| $20,000 to $22,499 | 0 (0.0%) | 0 (0.0%) |
| $22,500 to $24,999 | 0 (0.0%) | 0 (0.0%) |
| $25,000 to $29,999 | 3 (27.3%) | 0 (0.0%) |
| $30,000 to $34,999 | 0 (0.0%) | 5 (50.0%) |
| $35,000 to $39,999 | 0 (0.0%) | 0 (0.0%) |
| $40,000 to $44,999 | 0 (0.0%) | 0 (0.0%) |
| $45,000 to $49,999 | 0 (0.0%) | 1 (10.0%) |
| $50,000 to $54,999 | 0 (0.0%) | 0 (0.0%) |
| $55,000 to $64,999 | 5 (45.5%) | 0 (0.0%) |
| $65,000 to $74,999 | 0 (0.0%) | 2 (20.0%) |
| $75,000 to $99,999 | 0 (0.0%) | 0 (0.0%) |
| $100,000+ | 1 (9.1%) | 0 (0.0%) |
| Total | 11 (100.0%) | 10 (100.0%) |
Earnings by Sex by Educational Attainment in Sheridan Lake
| Educational Attainment | Male Income | Female Income |
| Less than High School | - | - |
| High School Diploma | - | - |
| College or Associate's Degree | - | - |
| Bachelor's Degree | - | - |
| Graduate Degree | - | - |
| Total | $58,125 | $31,500 |
Family Income in Sheridan Lake
Family Income Brackets in Sheridan Lake
According to the Sheridan Lake family income data, there are 6 families falling into the $50,000 to $74,999 income range, which is the most common income bracket and makes up 40.0% of all families.
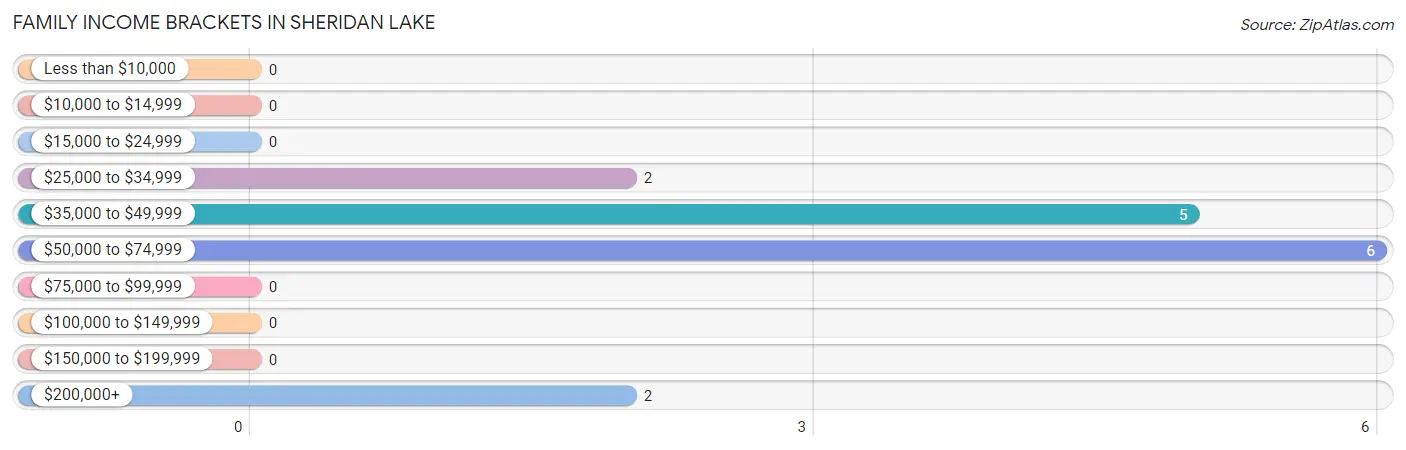
| Income Bracket | # Families | % Families |
| Less than $10,000 | 0 | 0.0% |
| $10,000 to $14,999 | 0 | 0.0% |
| $15,000 to $24,999 | 0 | 0.0% |
| $25,000 to $34,999 | 2 | 13.3% |
| $35,000 to $49,999 | 5 | 33.3% |
| $50,000 to $74,999 | 6 | 40.0% |
| $75,000 to $99,999 | 0 | 0.0% |
| $100,000 to $149,999 | 0 | 0.0% |
| $150,000 to $199,999 | 0 | 0.0% |
| $200,000+ | 2 | 13.3% |
Family Income by Famaliy Size in Sheridan Lake
2-person families (9 | 60.0%) account for the highest median family income in Sheridan Lake with $62,917 per family, while 2-person families (9 | 60.0%) have the highest median income of $31,458 per family member.
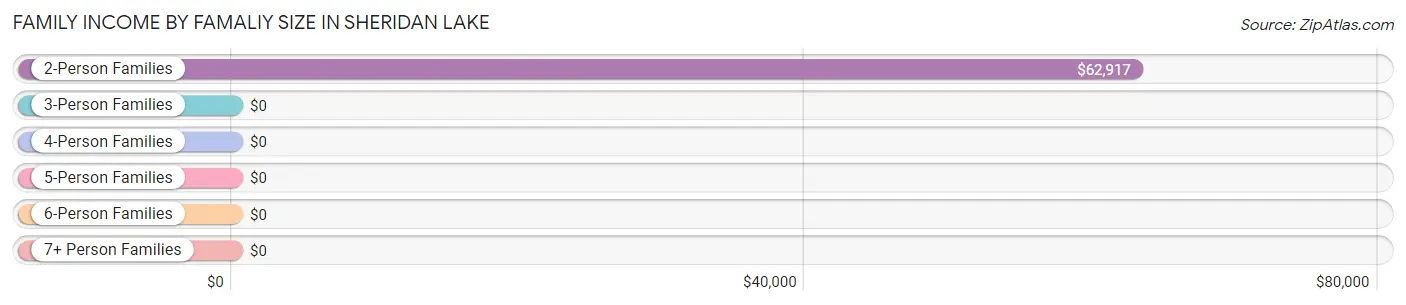
| Income Bracket | # Families | Median Income |
| 2-Person Families | 9 (60.0%) | $62,917 |
| 3-Person Families | 2 (13.3%) | $0 |
| 4-Person Families | 2 (13.3%) | $0 |
| 5-Person Families | 0 (0.0%) | $0 |
| 6-Person Families | 2 (13.3%) | $0 |
| 7+ Person Families | 0 (0.0%) | $0 |
| Total | 15 (100.0%) | $51,250 |
Family Income by Number of Earners in Sheridan Lake
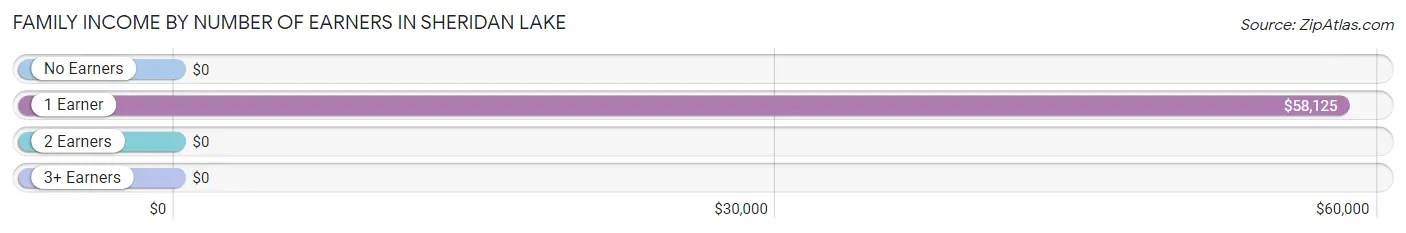
| Number of Earners | # Families | Median Income |
| No Earners | 0 (0.0%) | $0 |
| 1 Earner | 13 (86.7%) | $58,125 |
| 2 Earners | 2 (13.3%) | $0 |
| 3+ Earners | 0 (0.0%) | $0 |
| Total | 15 (100.0%) | $51,250 |
Household Income in Sheridan Lake
Household Income Brackets in Sheridan Lake
With 5 households falling in the category, the $35,000 to $49,999 income range is the most frequent in Sheridan Lake, accounting for 33.3% of all households.
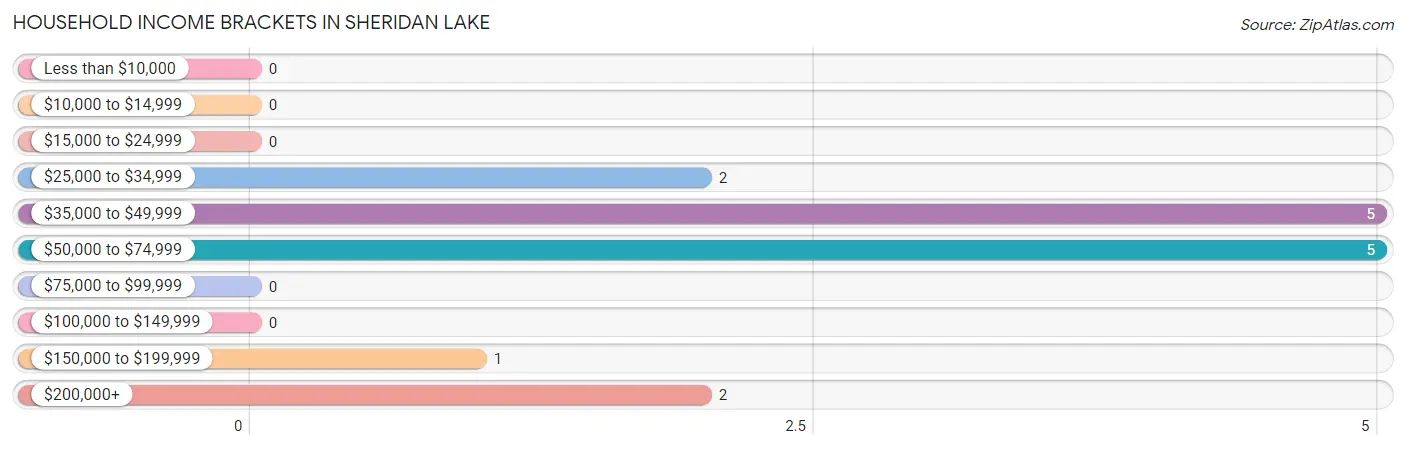
| Income Bracket | # Households | % Households |
| Less than $10,000 | 0 | 0.0% |
| $10,000 to $14,999 | 0 | 0.0% |
| $15,000 to $24,999 | 0 | 0.0% |
| $25,000 to $34,999 | 2 | 13.3% |
| $35,000 to $49,999 | 5 | 33.3% |
| $50,000 to $74,999 | 5 | 33.3% |
| $75,000 to $99,999 | 0 | 0.0% |
| $100,000 to $149,999 | 0 | 0.0% |
| $150,000 to $199,999 | 1 | 6.7% |
| $200,000+ | 2 | 13.3% |
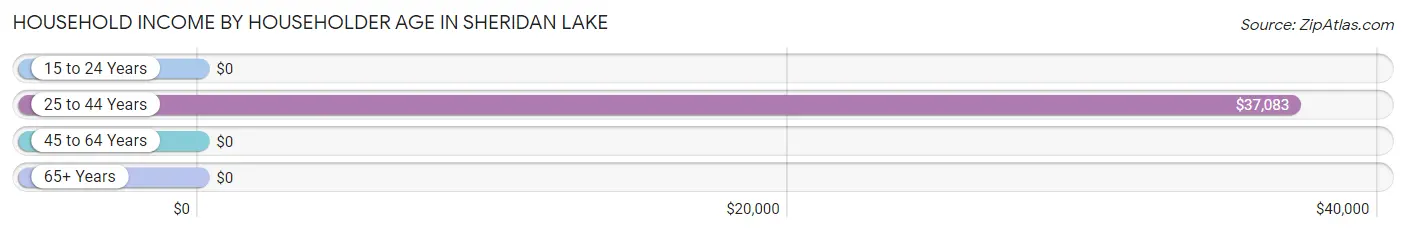
Household Income by Householder Age in Sheridan Lake
The median household income in Sheridan Lake is $58,125, with the highest median household income of $37,083 found in the 25 to 44 years age bracket for the primary householder. A total of 9 households (60.0%) fall into this category.
| Income Bracket | # Households | Median Income |
| 15 to 24 Years | 0 (0.0%) | $0 |
| 25 to 44 Years | 9 (60.0%) | $37,083 |
| 45 to 64 Years | 4 (26.7%) | $0 |
| 65+ Years | 2 (13.3%) | $0 |
| Total | 15 (100.0%) | $58,125 |
Poverty in Sheridan Lake
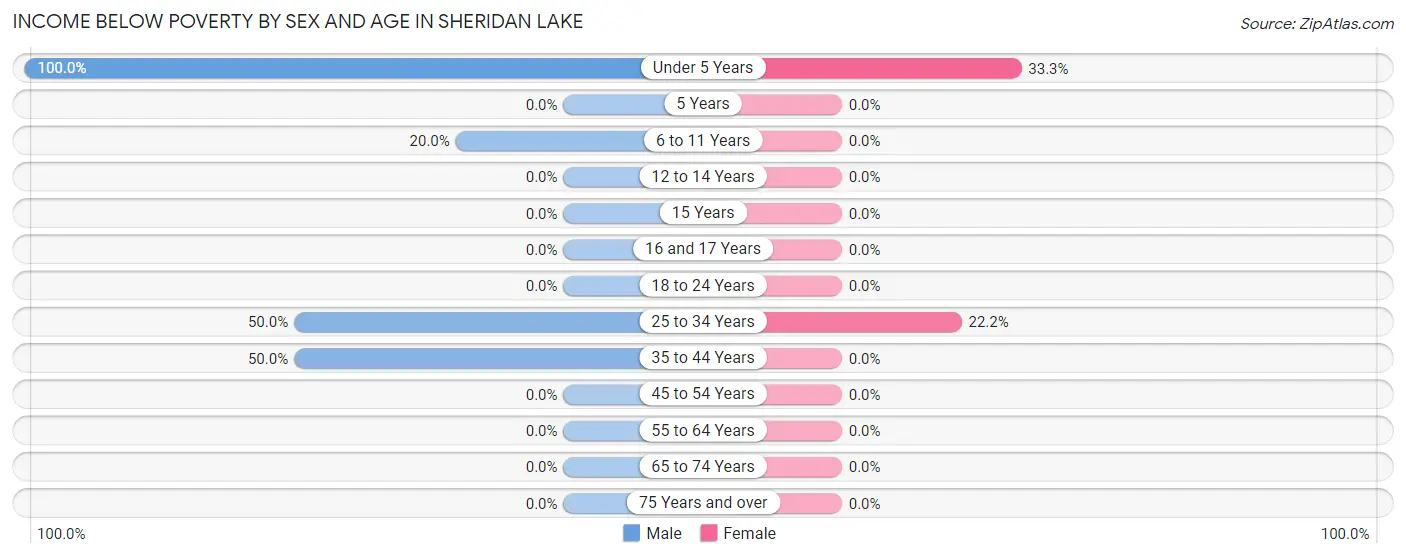
Income Below Poverty by Sex and Age in Sheridan Lake
With 44.4% poverty level for males and 20.7% for females among the residents of Sheridan Lake, under 5 year old males and under 5 year old females are the most vulnerable to poverty, with 6 males (100.0%) and 4 females (33.3%) in their respective age groups living below the poverty level.
| Age Bracket | Male | Female |
| Under 5 Years | 6 (100.0%) | 4 (33.3%) |
| 5 Years | 0 (0.0%) | 0 (0.0%) |
| 6 to 11 Years | 1 (20.0%) | 0 (0.0%) |
| 12 to 14 Years | 0 (0.0%) | 0 (0.0%) |
| 15 Years | 0 (0.0%) | 0 (0.0%) |
| 16 and 17 Years | 0 (0.0%) | 0 (0.0%) |
| 18 to 24 Years | 0 (0.0%) | 0 (0.0%) |
| 25 to 34 Years | 2 (50.0%) | 2 (22.2%) |
| 35 to 44 Years | 3 (50.0%) | 0 (0.0%) |
| 45 to 54 Years | 0 (0.0%) | 0 (0.0%) |
| 55 to 64 Years | 0 (0.0%) | 0 (0.0%) |
| 65 to 74 Years | 0 (0.0%) | 0 (0.0%) |
| 75 Years and over | 0 (0.0%) | 0 (0.0%) |
| Total | 12 (44.4%) | 6 (20.7%) |
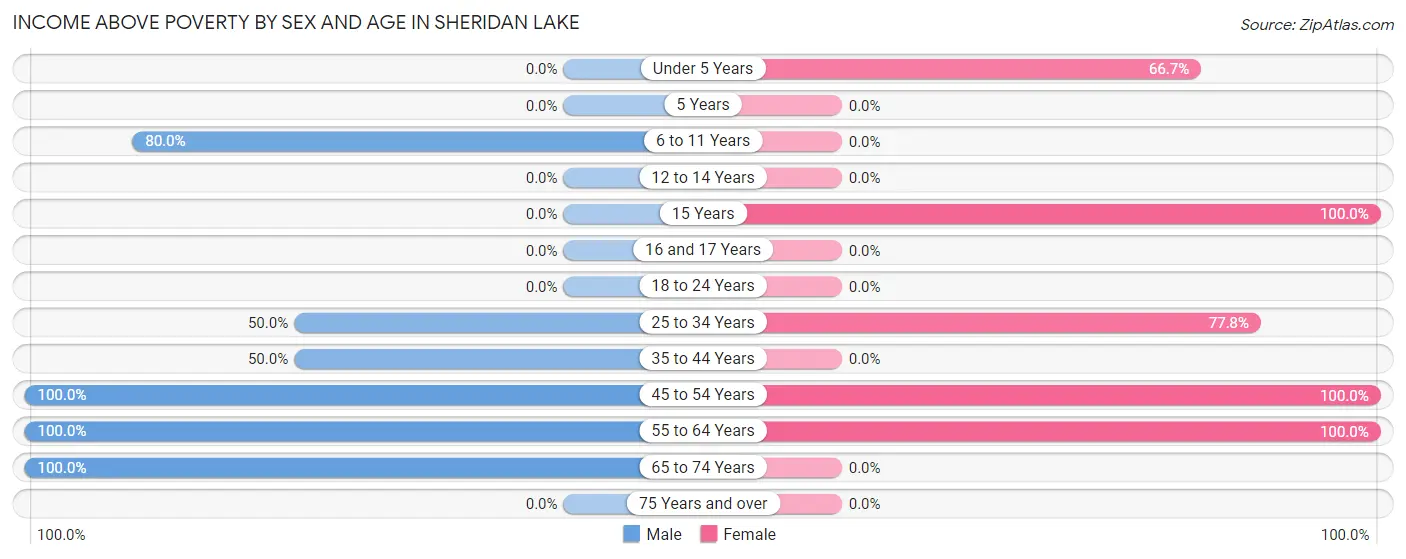
Income Above Poverty by Sex and Age in Sheridan Lake
According to the poverty statistics in Sheridan Lake, males aged 45 to 54 years and females aged 15 years are the age groups that are most secure financially, with 100.0% of males and 100.0% of females in these age groups living above the poverty line.
| Age Bracket | Male | Female |
| Under 5 Years | 0 (0.0%) | 8 (66.7%) |
| 5 Years | 0 (0.0%) | 0 (0.0%) |
| 6 to 11 Years | 4 (80.0%) | 0 (0.0%) |
| 12 to 14 Years | 0 (0.0%) | 0 (0.0%) |
| 15 Years | 0 (0.0%) | 2 (100.0%) |
| 16 and 17 Years | 0 (0.0%) | 0 (0.0%) |
| 18 to 24 Years | 0 (0.0%) | 0 (0.0%) |
| 25 to 34 Years | 2 (50.0%) | 7 (77.8%) |
| 35 to 44 Years | 3 (50.0%) | 0 (0.0%) |
| 45 to 54 Years | 1 (100.0%) | 1 (100.0%) |
| 55 to 64 Years | 3 (100.0%) | 5 (100.0%) |
| 65 to 74 Years | 2 (100.0%) | 0 (0.0%) |
| 75 Years and over | 0 (0.0%) | 0 (0.0%) |
| Total | 15 (55.6%) | 23 (79.3%) |
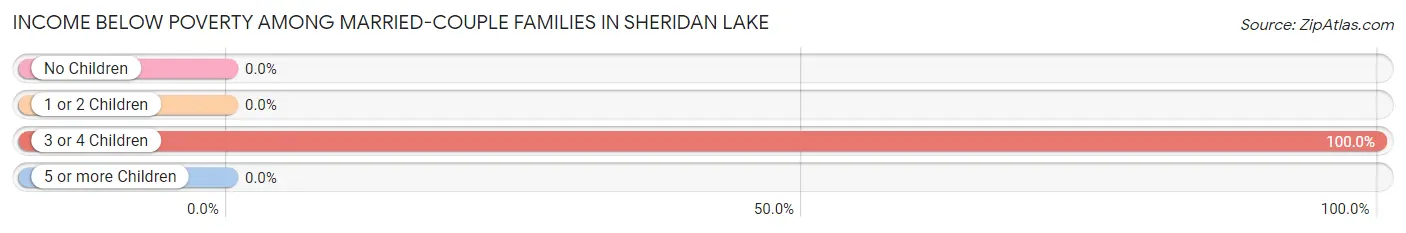
Income Below Poverty Among Married-Couple Families in Sheridan Lake
The poverty statistics for married-couple families in Sheridan Lake show that 22.2% or 2 of the total 9 families live below the poverty line. Families with 3 or 4 children have the highest poverty rate of 100.0%, comprising of 2 families. On the other hand, families with no children have the lowest poverty rate of 0.0%, which includes 0 families.
| Children | Above Poverty | Below Poverty |
| No Children | 5 (100.0%) | 0 (0.0%) |
| 1 or 2 Children | 2 (100.0%) | 0 (0.0%) |
| 3 or 4 Children | 0 (0.0%) | 2 (100.0%) |
| 5 or more Children | 0 (0.0%) | 0 (0.0%) |
| Total | 7 (77.8%) | 2 (22.2%) |
Income Below Poverty Among Single-Parent Households in Sheridan Lake
| Children | Single Father | Single Mother |
| No Children | 0 (0.0%) | 0 (0.0%) |
| 1 or 2 Children | 0 (0.0%) | 0 (0.0%) |
| 3 or 4 Children | 0 (0.0%) | 0 (0.0%) |
| 5 or more Children | 0 (0.0%) | 0 (0.0%) |
| Total | 0 (0.0%) | 0 (0.0%) |
Income Below Poverty Among Married-Couple vs Single-Parent Households in Sheridan Lake
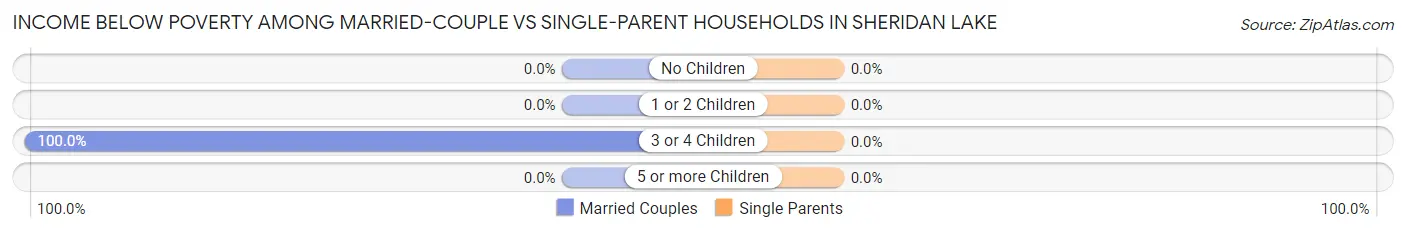
| Children | Married-Couple Families | Single-Parent Households |
| No Children | 0 (0.0%) | 0 (0.0%) |
| 1 or 2 Children | 0 (0.0%) | 0 (0.0%) |
| 3 or 4 Children | 2 (100.0%) | 0 (0.0%) |
| 5 or more Children | 0 (0.0%) | 0 (0.0%) |
| Total | 2 (22.2%) | 0 (0.0%) |
Race in Sheridan Lake
The most populous races in Sheridan Lake are White / Caucasian (54 | 96.4%), Hispanic or Latino (11 | 19.6%), and Some other Race (2 | 3.6%).
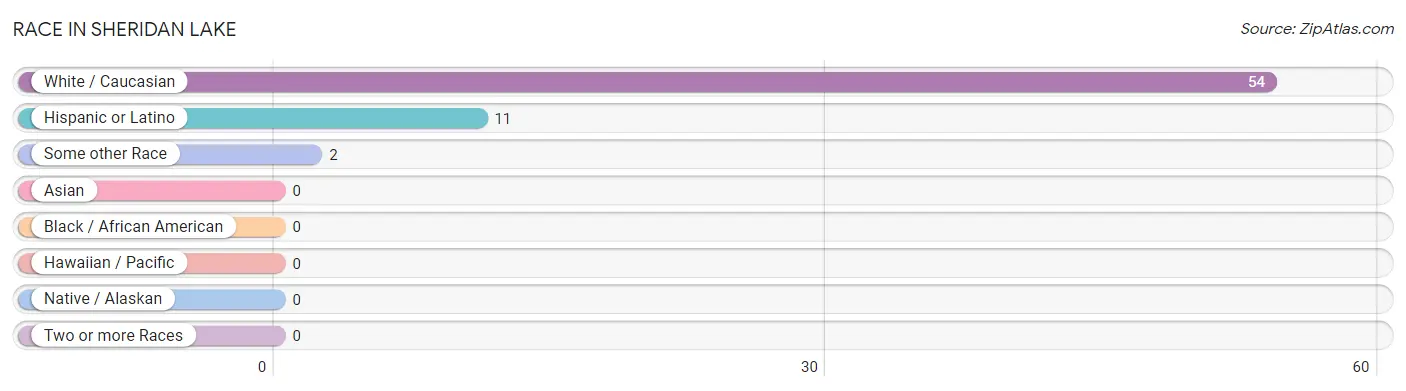
| Race | # Population | % Population |
| Asian | 0 | 0.0% |
| Black / African American | 0 | 0.0% |
| Hawaiian / Pacific | 0 | 0.0% |
| Hispanic or Latino | 11 | 19.6% |
| Native / Alaskan | 0 | 0.0% |
| White / Caucasian | 54 | 96.4% |
| Two or more Races | 0 | 0.0% |
| Some other Race | 2 | 3.6% |
| Total | 56 | 100.0% |
Ancestry in Sheridan Lake
The most populous ancestries reported in Sheridan Lake are German (33 | 58.9%), Mexican (11 | 19.6%), English (4 | 7.1%), Irish (2 | 3.6%), and Polish (2 | 3.6%), together accounting for 92.8% of all Sheridan Lake residents.
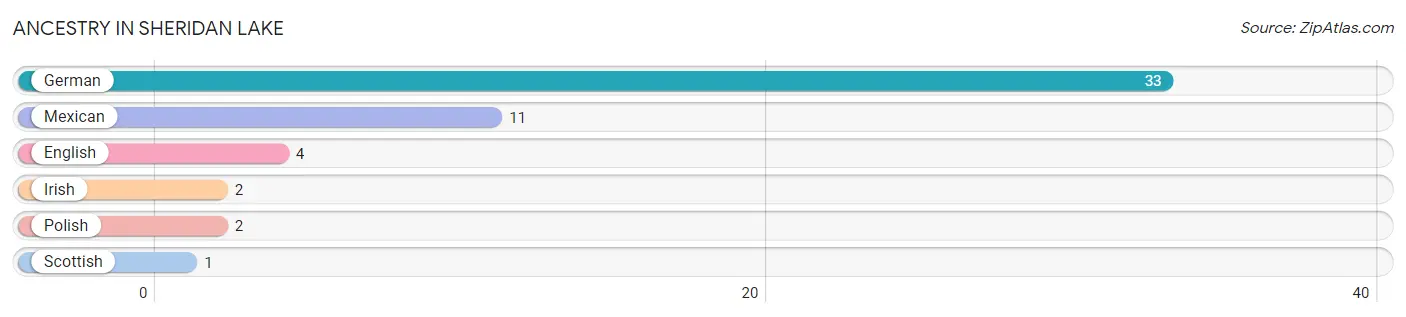
| Ancestry | # Population | % Population |
| English | 4 | 7.1% |
| German | 33 | 58.9% |
| Irish | 2 | 3.6% |
| Mexican | 11 | 19.6% |
| Polish | 2 | 3.6% |
| Scottish | 1 | 1.8% | View All 6 Rows |
Immigrants in Sheridan Lake

| Immigration Origin | # Population | % Population | View All 0 Rows |
Sex and Age in Sheridan Lake
Sex and Age in Sheridan Lake
The most populous age groups in Sheridan Lake are Under 5 Years (6 | 22.2%) for men and Under 5 Years (12 | 41.4%) for women.
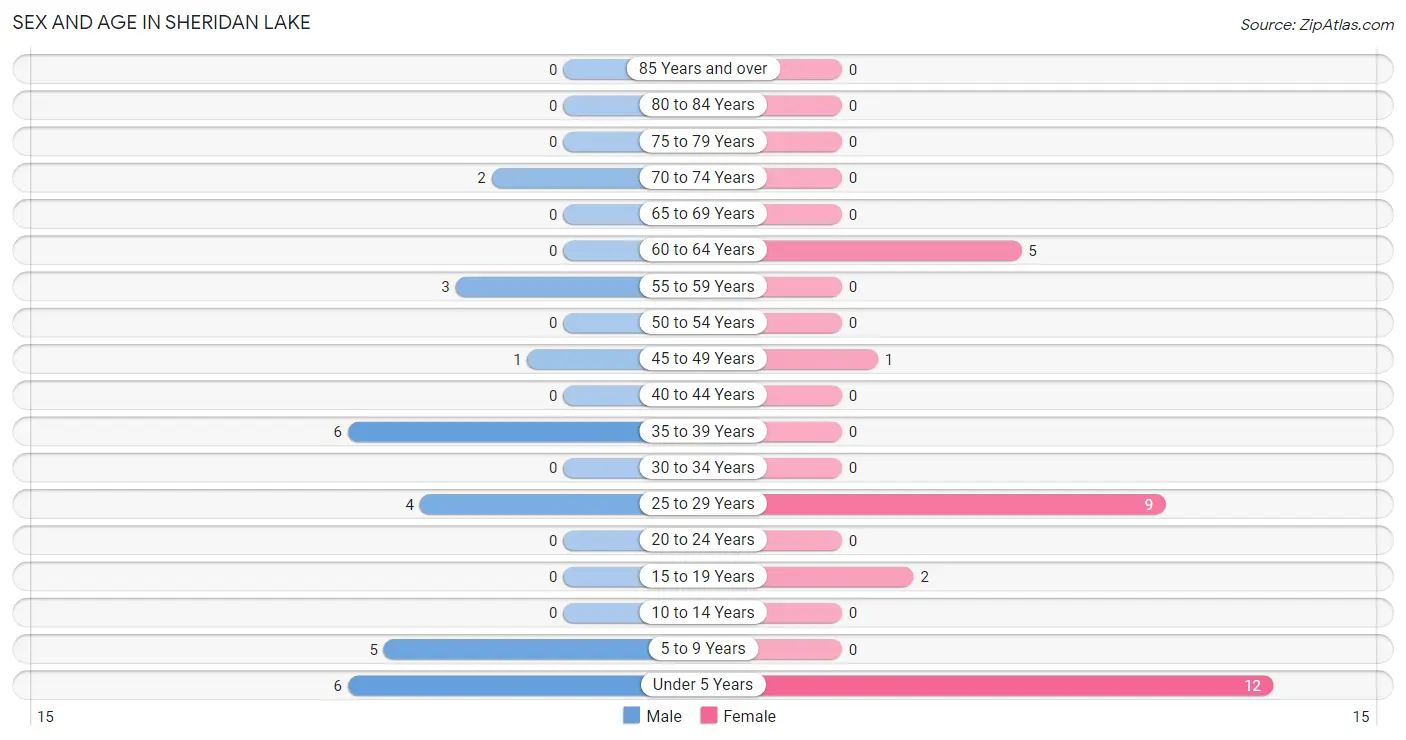
| Age Bracket | Male | Female |
| Under 5 Years | 6 (22.2%) | 12 (41.4%) |
| 5 to 9 Years | 5 (18.5%) | 0 (0.0%) |
| 10 to 14 Years | 0 (0.0%) | 0 (0.0%) |
| 15 to 19 Years | 0 (0.0%) | 2 (6.9%) |
| 20 to 24 Years | 0 (0.0%) | 0 (0.0%) |
| 25 to 29 Years | 4 (14.8%) | 9 (31.0%) |
| 30 to 34 Years | 0 (0.0%) | 0 (0.0%) |
| 35 to 39 Years | 6 (22.2%) | 0 (0.0%) |
| 40 to 44 Years | 0 (0.0%) | 0 (0.0%) |
| 45 to 49 Years | 1 (3.7%) | 1 (3.5%) |
| 50 to 54 Years | 0 (0.0%) | 0 (0.0%) |
| 55 to 59 Years | 3 (11.1%) | 0 (0.0%) |
| 60 to 64 Years | 0 (0.0%) | 5 (17.2%) |
| 65 to 69 Years | 0 (0.0%) | 0 (0.0%) |
| 70 to 74 Years | 2 (7.4%) | 0 (0.0%) |
| 75 to 79 Years | 0 (0.0%) | 0 (0.0%) |
| 80 to 84 Years | 0 (0.0%) | 0 (0.0%) |
| 85 Years and over | 0 (0.0%) | 0 (0.0%) |
| Total | 27 (100.0%) | 29 (100.0%) |
Families and Households in Sheridan Lake
Median Family Size in Sheridan Lake
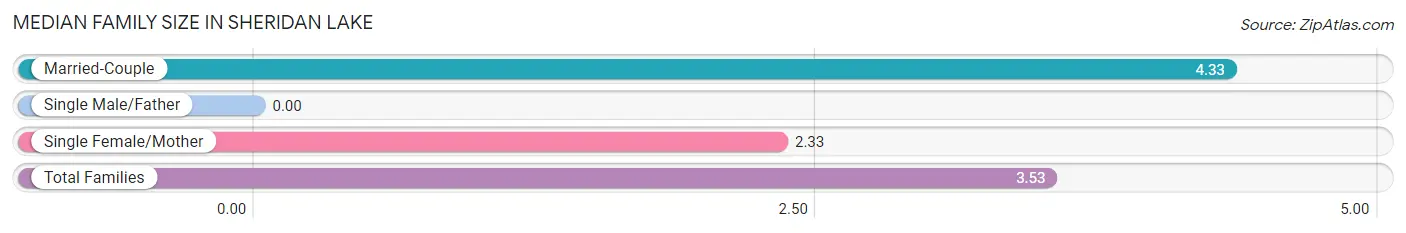
| Family Type | # Families | Family Size |
| Married-Couple | 9 (60.0%) | 4.33 |
| Single Male/Father | 0 (0.0%) | - |
| Single Female/Mother | 6 (40.0%) | 2.33 |
| Total Families | 15 (100.0%) | 3.53 |
Median Household Size in Sheridan Lake
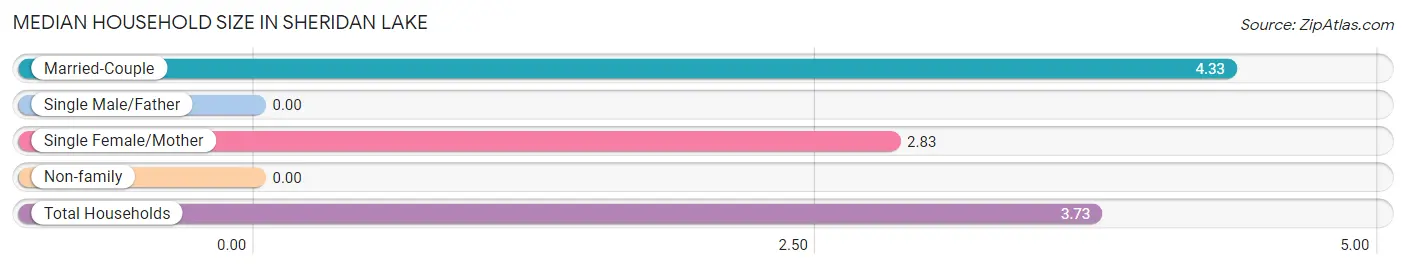
| Household Type | # Households | Household Size |
| Married-Couple | 9 (60.0%) | 4.33 |
| Single Male/Father | 0 (0.0%) | - |
| Single Female/Mother | 6 (40.0%) | 2.83 |
| Non-family | 0 (0.0%) | - |
| Total Households | 15 (100.0%) | 3.73 |
Household Size by Marriage Status in Sheridan Lake
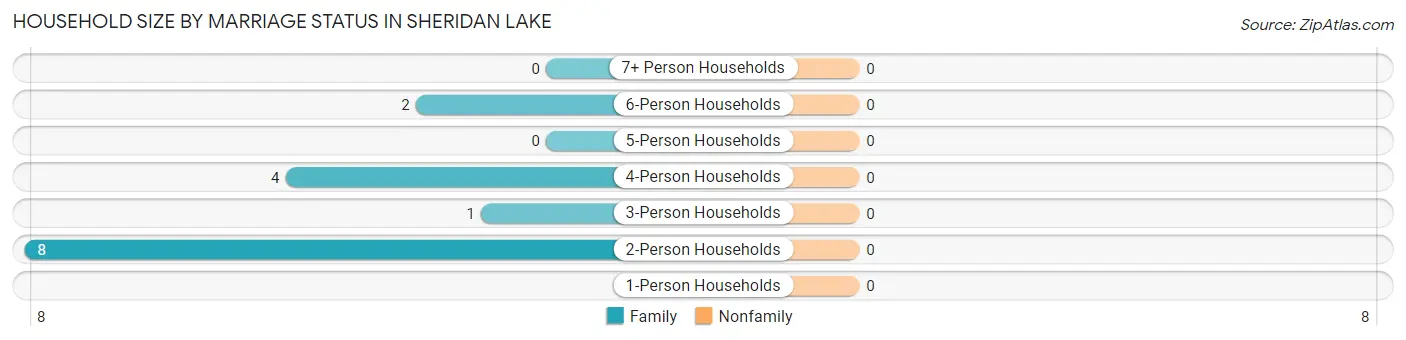
| Household Size | Family Households | Nonfamily Households |
| 1-Person Households | - | 0 (0.0%) |
| 2-Person Households | 8 (53.3%) | 0 (0.0%) |
| 3-Person Households | 1 (6.7%) | 0 (0.0%) |
| 4-Person Households | 4 (26.7%) | 0 (0.0%) |
| 5-Person Households | 0 (0.0%) | 0 (0.0%) |
| 6-Person Households | 2 (13.3%) | 0 (0.0%) |
| 7+ Person Households | 0 (0.0%) | 0 (0.0%) |
| Total | 15 (100.0%) | 0 (0.0%) |
Female Fertility in Sheridan Lake
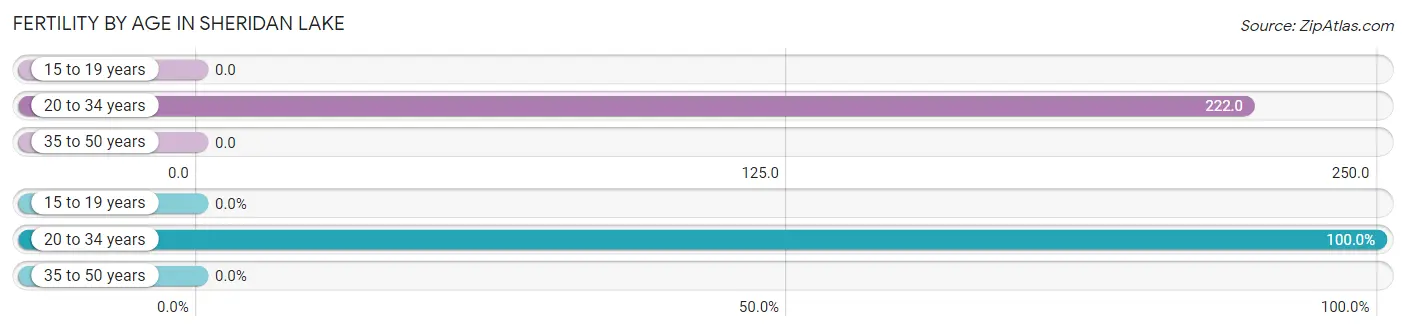
Fertility by Age in Sheridan Lake
Average fertility rate in Sheridan Lake is 167.0 births per 1,000 women. Women in the age bracket of 20 to 34 years have the highest fertility rate with 222.0 births per 1,000 women. Women in the age bracket of 20 to 34 years acount for 100.0% of all women with births.
| Age Bracket | Women with Births | Births / 1,000 Women |
| 15 to 19 years | 0 (0.0%) | 0.0 |
| 20 to 34 years | 2 (100.0%) | 222.0 |
| 35 to 50 years | 0 (0.0%) | 0.0 |
| Total | 2 (100.0%) | 167.0 |
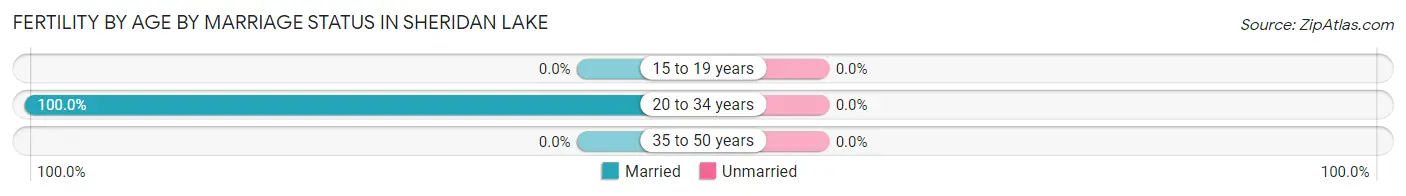
Fertility by Age by Marriage Status in Sheridan Lake
| Age Bracket | Married | Unmarried |
| 15 to 19 years | 0 (0.0%) | 0 (0.0%) |
| 20 to 34 years | 2 (100.0%) | 0 (0.0%) |
| 35 to 50 years | 0 (0.0%) | 0 (0.0%) |
| Total | 2 (100.0%) | 0 (0.0%) |
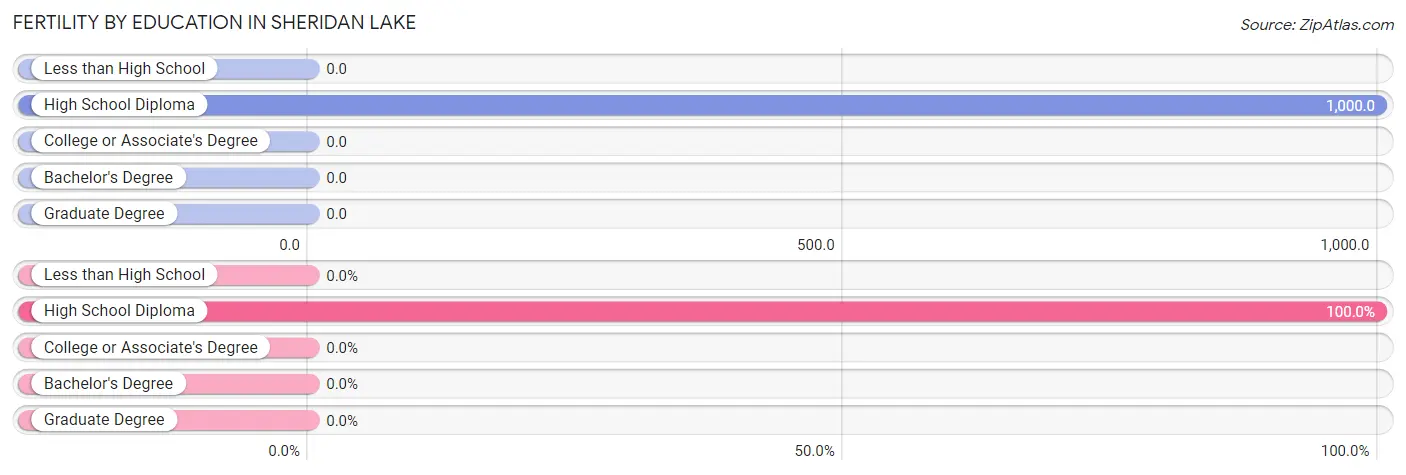
Fertility by Education in Sheridan Lake
| Educational Attainment | Women with Births | Births / 1,000 Women |
| Less than High School | 0 (0.0%) | 0.0 |
| High School Diploma | 2 (100.0%) | 1,000.0 |
| College or Associate's Degree | 0 (0.0%) | 0.0 |
| Bachelor's Degree | 0 (0.0%) | 0.0 |
| Graduate Degree | 0 (0.0%) | 0.0 |
| Total | 2 (100.0%) | 167.0 |
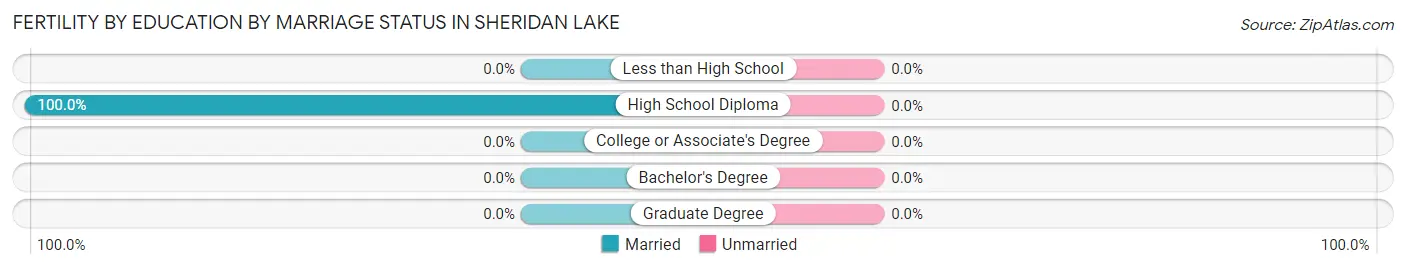
Fertility by Education by Marriage Status in Sheridan Lake
| Educational Attainment | Married | Unmarried |
| Less than High School | 0 (0.0%) | 0 (0.0%) |
| High School Diploma | 2 (100.0%) | 0 (0.0%) |
| College or Associate's Degree | 0 (0.0%) | 0 (0.0%) |
| Bachelor's Degree | 0 (0.0%) | 0 (0.0%) |
| Graduate Degree | 0 (0.0%) | 0 (0.0%) |
| Total | 2 (100.0%) | 0 (0.0%) |
Employment Characteristics in Sheridan Lake
Employment by Class of Employer in Sheridan Lake
Among the 21 employed individuals in Sheridan Lake, private company employees (18 | 85.7%), not-for-profit organizations (2 | 9.5%), and local government employees (1 | 4.8%) make up the most common classes of employment.
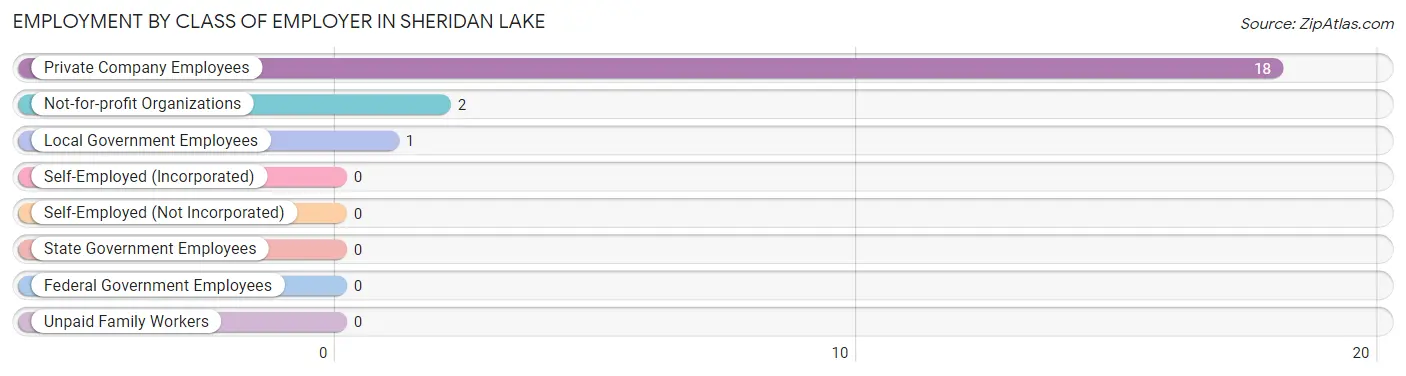
| Employer Class | # Employees | % Employees |
| Private Company Employees | 18 | 85.7% |
| Self-Employed (Incorporated) | 0 | 0.0% |
| Self-Employed (Not Incorporated) | 0 | 0.0% |
| Not-for-profit Organizations | 2 | 9.5% |
| Local Government Employees | 1 | 4.8% |
| State Government Employees | 0 | 0.0% |
| Federal Government Employees | 0 | 0.0% |
| Unpaid Family Workers | 0 | 0.0% |
| Total | 21 | 100.0% |
Employment Status by Age in Sheridan Lake
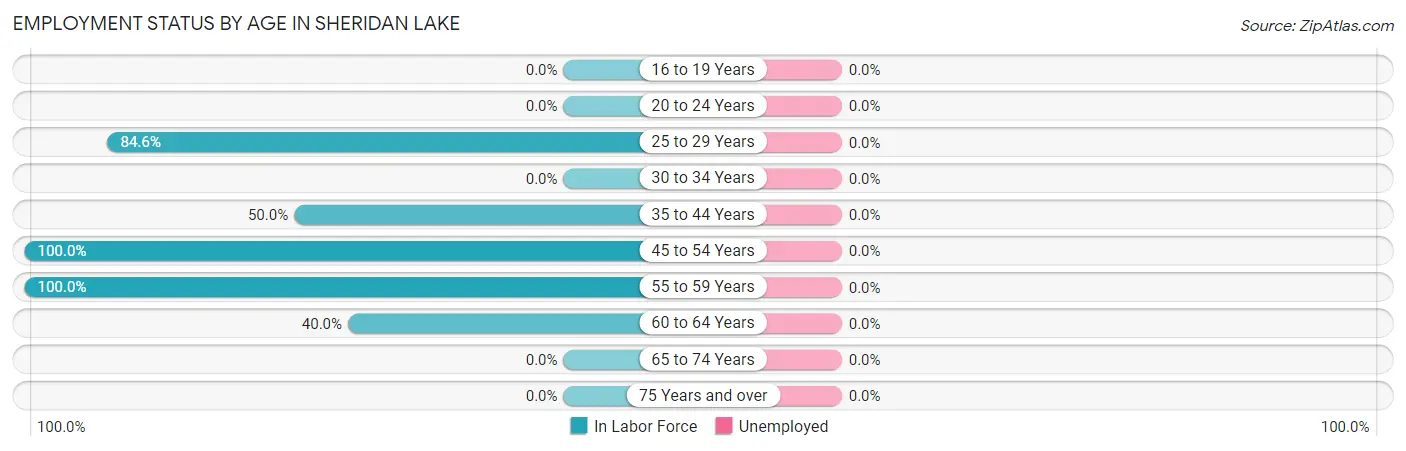
| Age Bracket | In Labor Force | Unemployed |
| 16 to 19 Years | 0 (0.0%) | 0 (0.0%) |
| 20 to 24 Years | 0 (0.0%) | 0 (0.0%) |
| 25 to 29 Years | 11 (84.6%) | 0 (0.0%) |
| 30 to 34 Years | 0 (0.0%) | 0 (0.0%) |
| 35 to 44 Years | 3 (50.0%) | 0 (0.0%) |
| 45 to 54 Years | 2 (100.0%) | 0 (0.0%) |
| 55 to 59 Years | 3 (100.0%) | 0 (0.0%) |
| 60 to 64 Years | 2 (40.0%) | 0 (0.0%) |
| 65 to 74 Years | 0 (0.0%) | 0 (0.0%) |
| 75 Years and over | 0 (0.0%) | 0 (0.0%) |
| Total | 21 (67.7%) | 0 (0.0%) |
Employment Status by Educational Attainment in Sheridan Lake
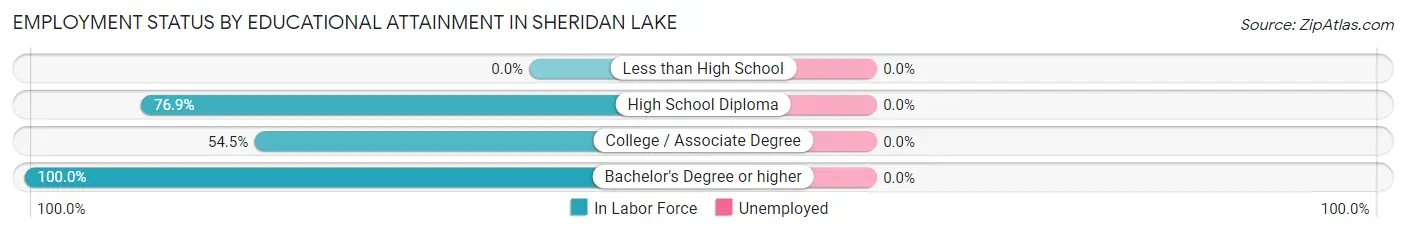
| Educational Attainment | In Labor Force | Unemployed |
| Less than High School | 0 (0.0%) | 0 (0.0%) |
| High School Diploma | 10 (76.9%) | 0 (0.0%) |
| College / Associate Degree | 6 (54.5%) | 0 (0.0%) |
| Bachelor's Degree or higher | 5 (100.0%) | 0 (0.0%) |
| Total | 21 (72.4%) | 0 (0.0%) |
Employment Occupations by Sex in Sheridan Lake
Management, Business, Science and Arts Occupations
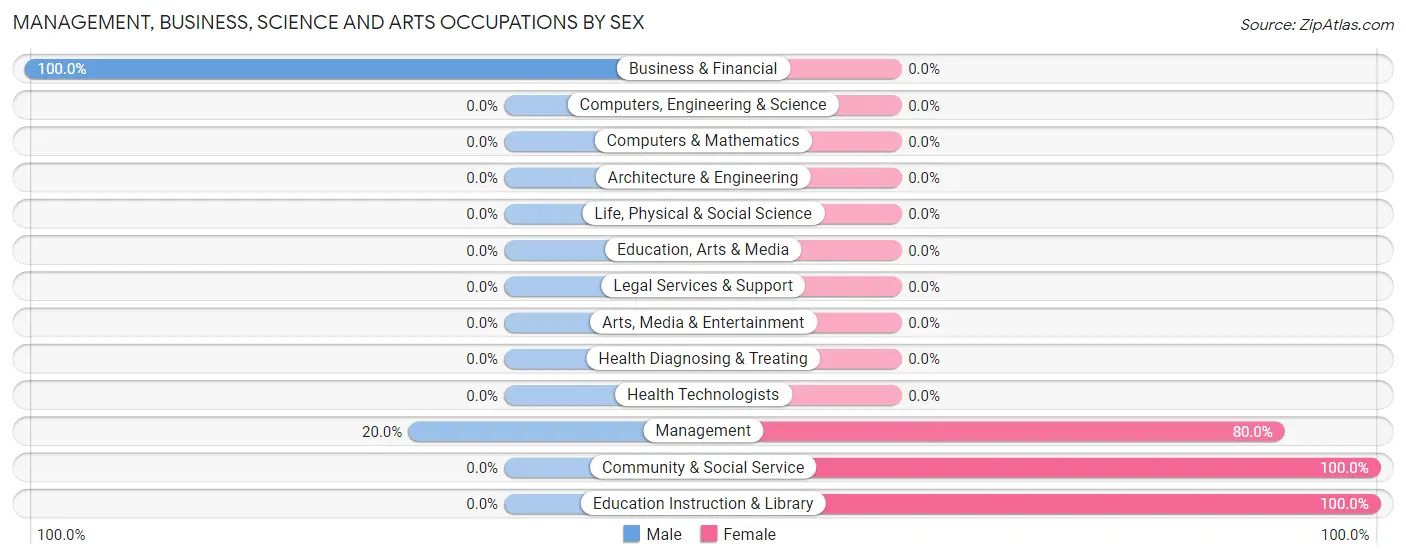
The most common Management, Business, Science and Arts occupations in Sheridan Lake are Management (5 | 23.8%), Business & Financial (2 | 9.5%), Community & Social Service (2 | 9.5%), and Education Instruction & Library (2 | 9.5%).
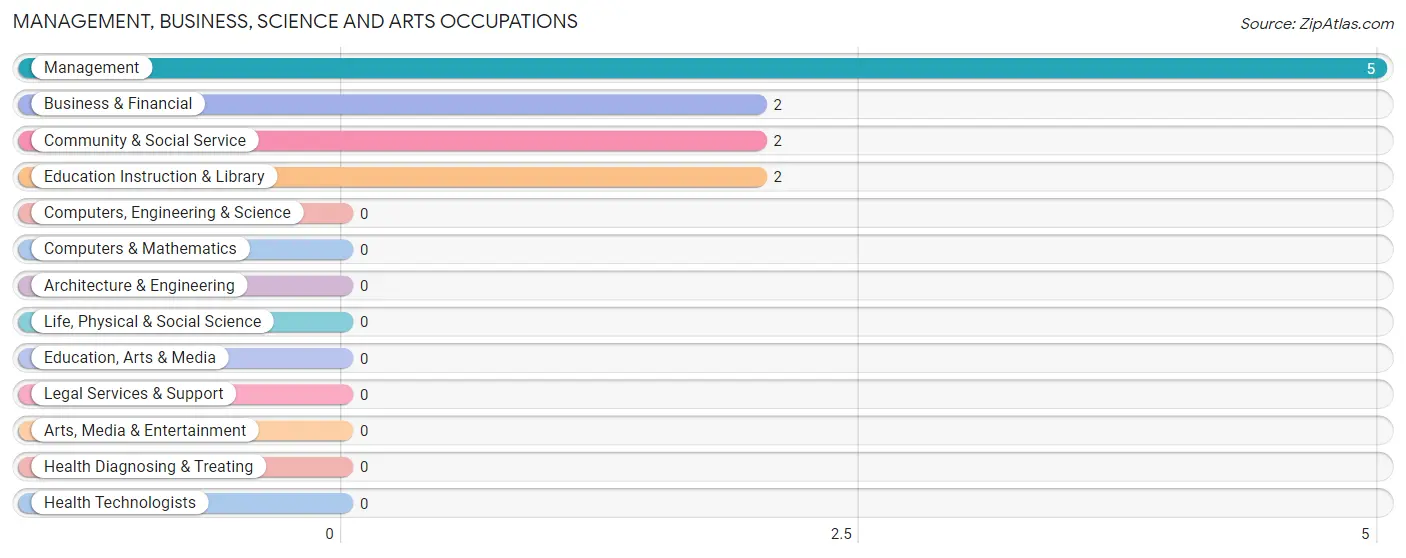
Management, Business, Science and Arts Occupations by Sex
Within the Management, Business, Science and Arts occupations in Sheridan Lake, the most male-oriented occupations are Business & Financial (100.0%), and Management (20.0%), while the most female-oriented occupations are Community & Social Service (100.0%), Education Instruction & Library (100.0%), and Management (80.0%).
| Occupation | Male | Female |
| Management | 1 (20.0%) | 4 (80.0%) |
| Business & Financial | 2 (100.0%) | 0 (0.0%) |
| Computers, Engineering & Science | 0 (0.0%) | 0 (0.0%) |
| Computers & Mathematics | 0 (0.0%) | 0 (0.0%) |
| Architecture & Engineering | 0 (0.0%) | 0 (0.0%) |
| Life, Physical & Social Science | 0 (0.0%) | 0 (0.0%) |
| Community & Social Service | 0 (0.0%) | 2 (100.0%) |
| Education, Arts & Media | 0 (0.0%) | 0 (0.0%) |
| Legal Services & Support | 0 (0.0%) | 0 (0.0%) |
| Education Instruction & Library | 0 (0.0%) | 2 (100.0%) |
| Arts, Media & Entertainment | 0 (0.0%) | 0 (0.0%) |
| Health Diagnosing & Treating | 0 (0.0%) | 0 (0.0%) |
| Health Technologists | 0 (0.0%) | 0 (0.0%) |
| Total (Category) | 3 (33.3%) | 6 (66.7%) |
| Total (Overall) | 11 (52.4%) | 10 (47.6%) |
Services Occupations
The most common Services occupations in Sheridan Lake are , and Food Preparation & Serving (2 | 9.5%).
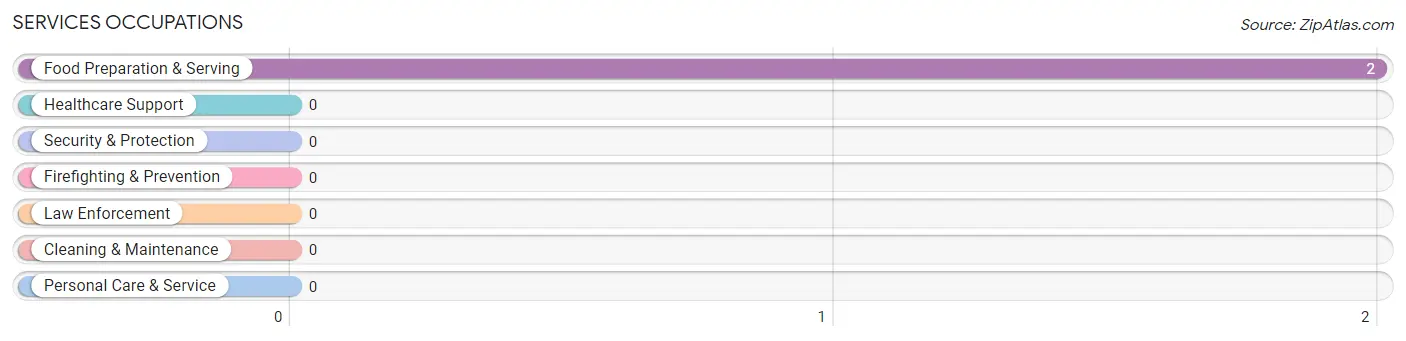
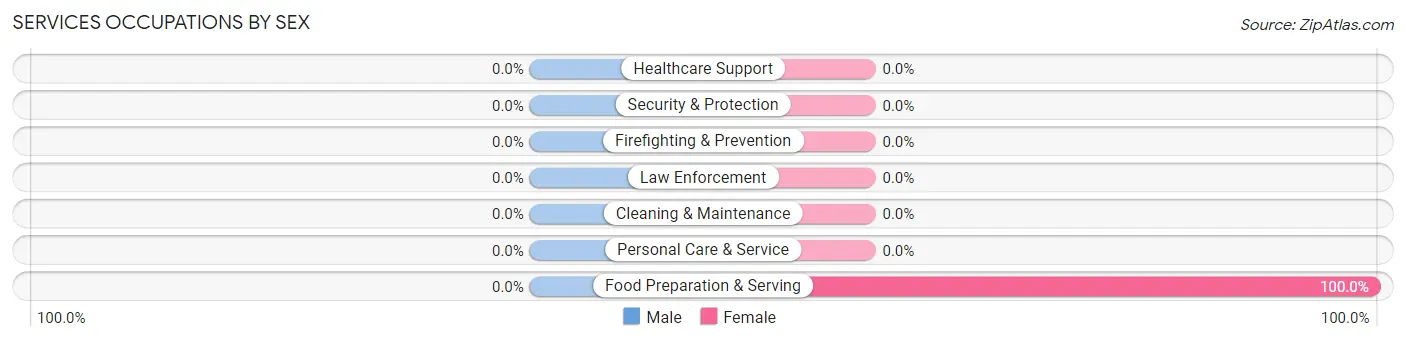
Services Occupations by Sex
| Occupation | Male | Female |
| Healthcare Support | 0 (0.0%) | 0 (0.0%) |
| Security & Protection | 0 (0.0%) | 0 (0.0%) |
| Firefighting & Prevention | 0 (0.0%) | 0 (0.0%) |
| Law Enforcement | 0 (0.0%) | 0 (0.0%) |
| Food Preparation & Serving | 0 (0.0%) | 2 (100.0%) |
| Cleaning & Maintenance | 0 (0.0%) | 0 (0.0%) |
| Personal Care & Service | 0 (0.0%) | 0 (0.0%) |
| Total (Category) | 0 (0.0%) | 2 (100.0%) |
| Total (Overall) | 11 (52.4%) | 10 (47.6%) |
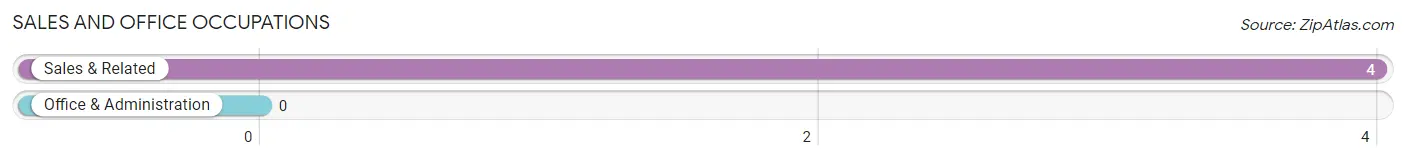
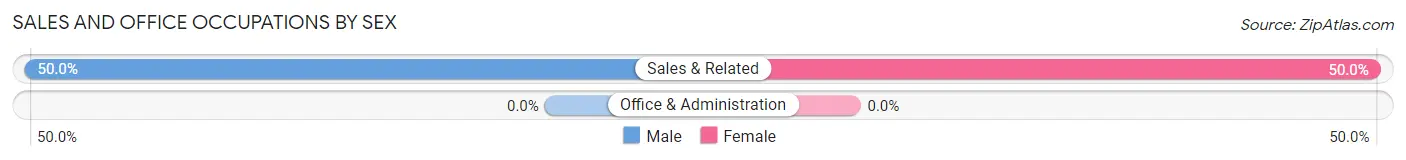
Sales and Office Occupations
The most common Sales and Office occupations in Sheridan Lake are , and Sales & Related (4 | 19.1%).
Sales and Office Occupations by Sex
| Occupation | Male | Female |
| Sales & Related | 2 (50.0%) | 2 (50.0%) |
| Office & Administration | 0 (0.0%) | 0 (0.0%) |
| Total (Category) | 2 (50.0%) | 2 (50.0%) |
| Total (Overall) | 11 (52.4%) | 10 (47.6%) |
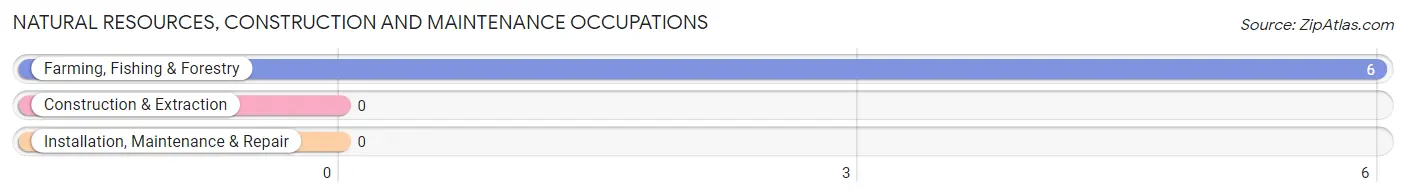
Natural Resources, Construction and Maintenance Occupations
The most common Natural Resources, Construction and Maintenance occupations in Sheridan Lake are , and Farming, Fishing & Forestry (6 | 28.6%).
Natural Resources, Construction and Maintenance Occupations by Sex
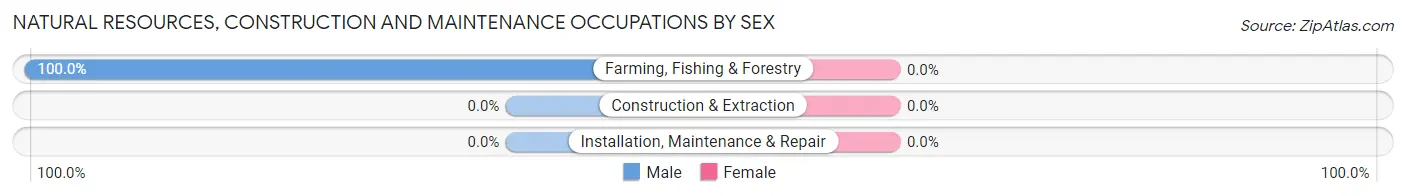
| Occupation | Male | Female |
| Farming, Fishing & Forestry | 6 (100.0%) | 0 (0.0%) |
| Construction & Extraction | 0 (0.0%) | 0 (0.0%) |
| Installation, Maintenance & Repair | 0 (0.0%) | 0 (0.0%) |
| Total (Category) | 6 (100.0%) | 0 (0.0%) |
| Total (Overall) | 11 (52.4%) | 10 (47.6%) |
Production, Transportation and Moving Occupations
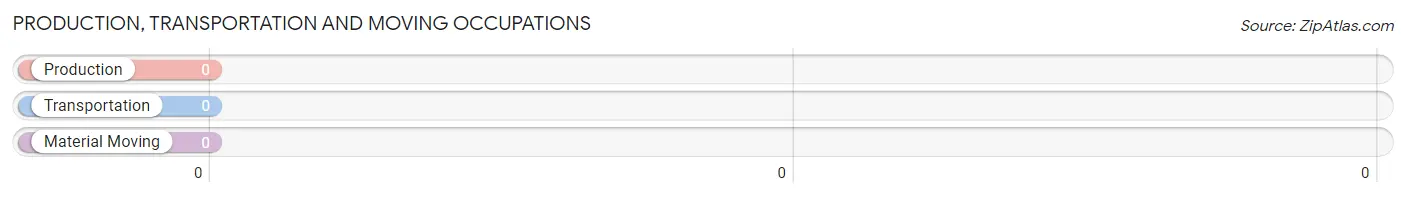
Production, Transportation and Moving Occupations by Sex
| Occupation | Male | Female |
| Production | 0 (0.0%) | 0 (0.0%) |
| Transportation | 0 (0.0%) | 0 (0.0%) |
| Material Moving | 0 (0.0%) | 0 (0.0%) |
| Total (Category) | 0 (0.0%) | 0 (0.0%) |
| Total (Overall) | 11 (52.4%) | 10 (47.6%) |
Employment Industries by Sex in Sheridan Lake
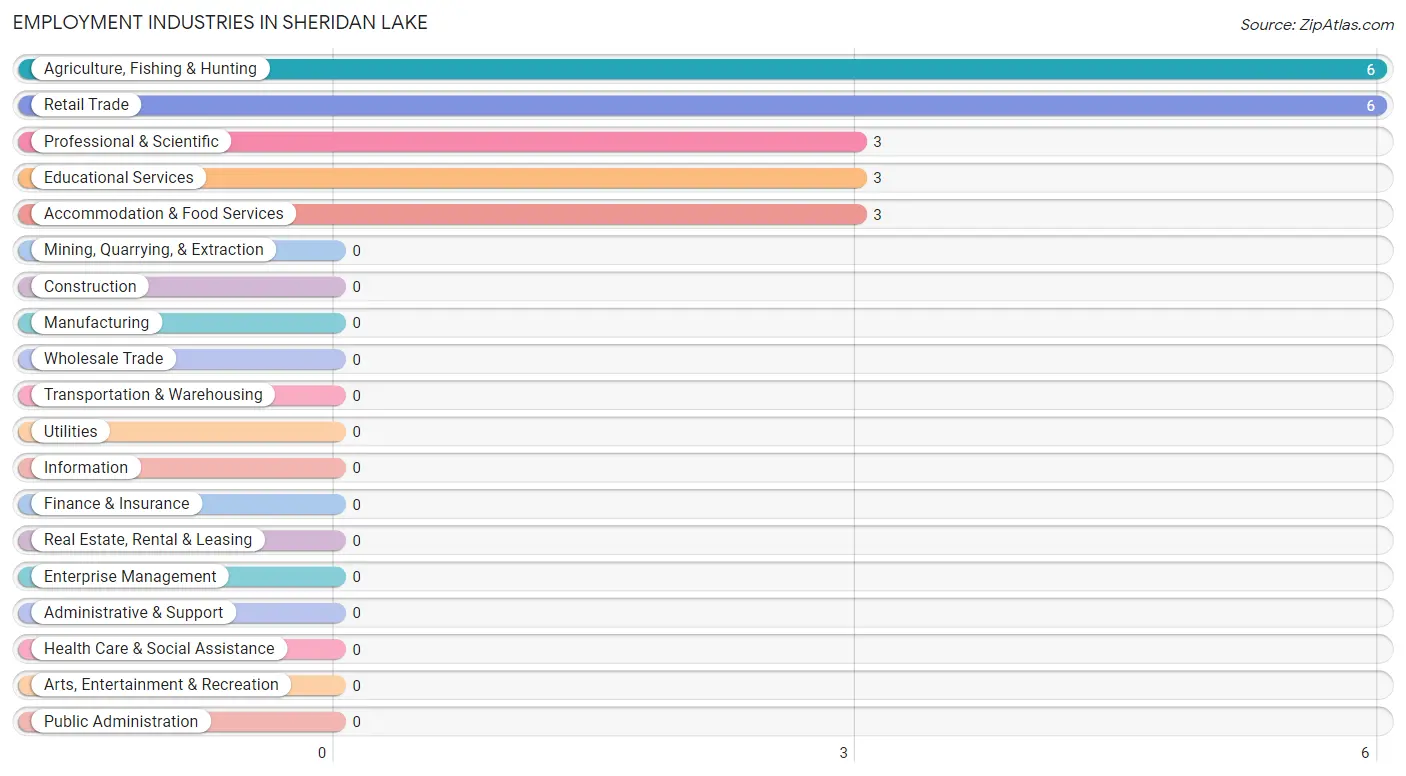
Employment Industries in Sheridan Lake
The major employment industries in Sheridan Lake include Agriculture, Fishing & Hunting (6 | 28.6%), Retail Trade (6 | 28.6%), Professional & Scientific (3 | 14.3%), Educational Services (3 | 14.3%), and Accommodation & Food Services (3 | 14.3%).
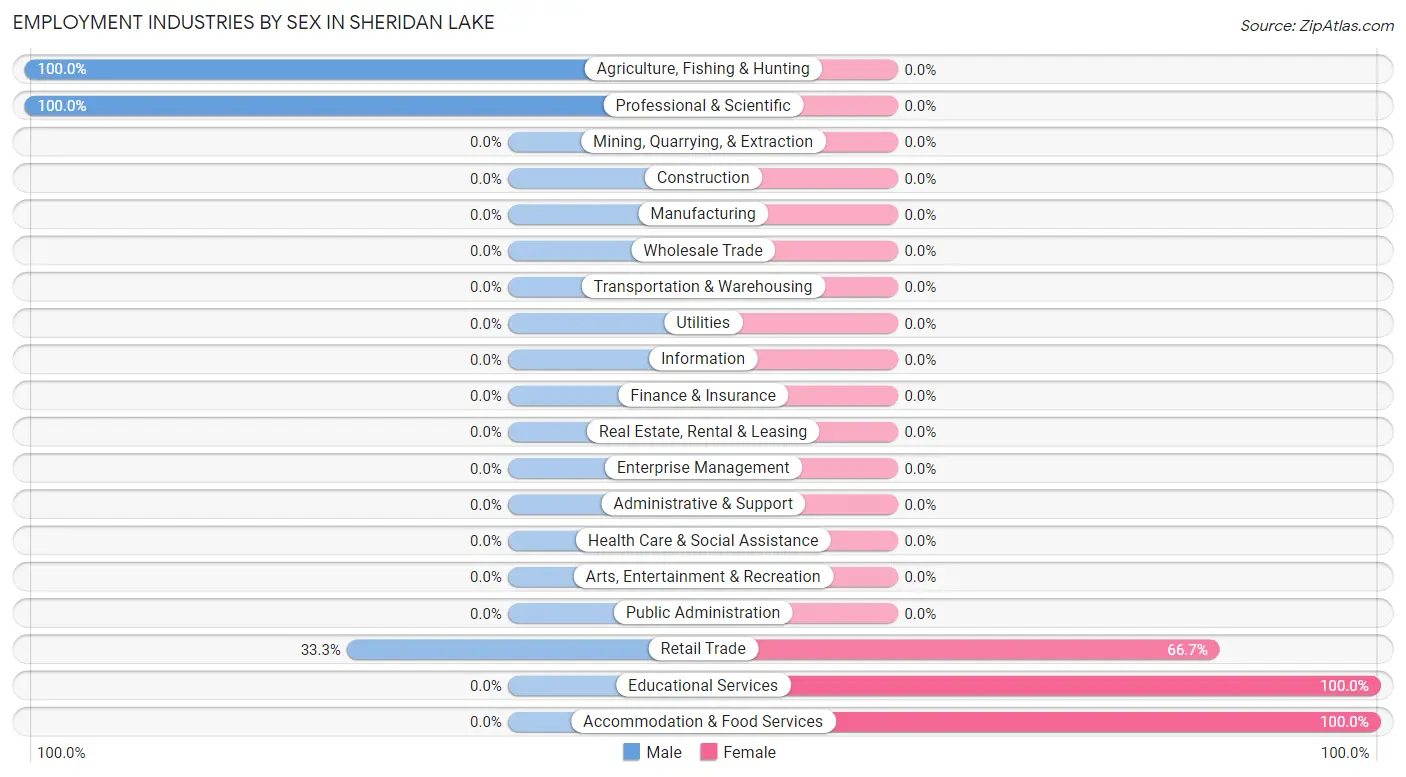
Employment Industries by Sex in Sheridan Lake
The Sheridan Lake industries that see more men than women are Agriculture, Fishing & Hunting (100.0%), Professional & Scientific (100.0%), and Retail Trade (33.3%), whereas the industries that tend to have a higher number of women are Educational Services (100.0%), Accommodation & Food Services (100.0%), and Retail Trade (66.7%).
| Industry | Male | Female |
| Agriculture, Fishing & Hunting | 6 (100.0%) | 0 (0.0%) |
| Mining, Quarrying, & Extraction | 0 (0.0%) | 0 (0.0%) |
| Construction | 0 (0.0%) | 0 (0.0%) |
| Manufacturing | 0 (0.0%) | 0 (0.0%) |
| Wholesale Trade | 0 (0.0%) | 0 (0.0%) |
| Retail Trade | 2 (33.3%) | 4 (66.7%) |
| Transportation & Warehousing | 0 (0.0%) | 0 (0.0%) |
| Utilities | 0 (0.0%) | 0 (0.0%) |
| Information | 0 (0.0%) | 0 (0.0%) |
| Finance & Insurance | 0 (0.0%) | 0 (0.0%) |
| Real Estate, Rental & Leasing | 0 (0.0%) | 0 (0.0%) |
| Professional & Scientific | 3 (100.0%) | 0 (0.0%) |
| Enterprise Management | 0 (0.0%) | 0 (0.0%) |
| Administrative & Support | 0 (0.0%) | 0 (0.0%) |
| Educational Services | 0 (0.0%) | 3 (100.0%) |
| Health Care & Social Assistance | 0 (0.0%) | 0 (0.0%) |
| Arts, Entertainment & Recreation | 0 (0.0%) | 0 (0.0%) |
| Accommodation & Food Services | 0 (0.0%) | 3 (100.0%) |
| Public Administration | 0 (0.0%) | 0 (0.0%) |
| Total | 11 (52.4%) | 10 (47.6%) |
Education in Sheridan Lake
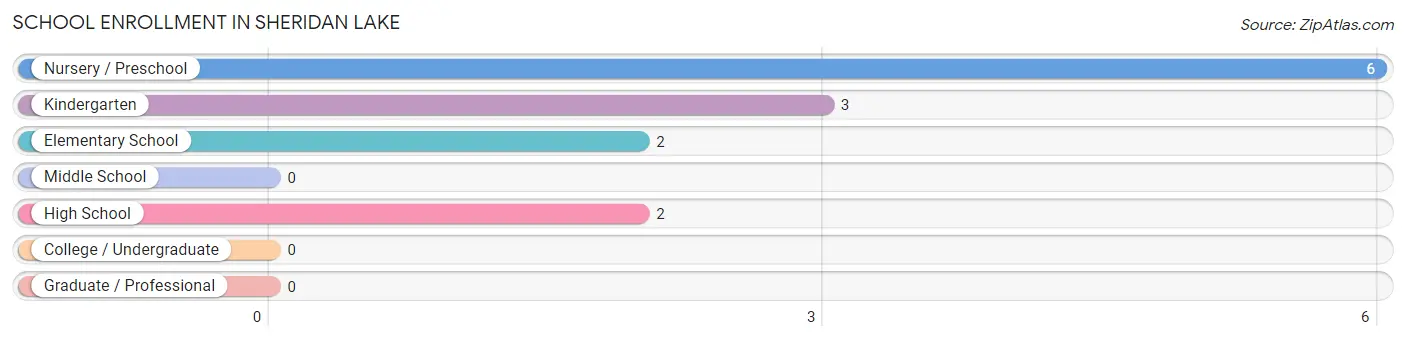
School Enrollment in Sheridan Lake
The most common levels of schooling among the 13 students in Sheridan Lake are nursery / preschool (6 | 46.2%), kindergarten (3 | 23.1%), and elementary school (2 | 15.4%).
| School Level | # Students | % Students |
| Nursery / Preschool | 6 | 46.2% |
| Kindergarten | 3 | 23.1% |
| Elementary School | 2 | 15.4% |
| Middle School | 0 | 0.0% |
| High School | 2 | 15.4% |
| College / Undergraduate | 0 | 0.0% |
| Graduate / Professional | 0 | 0.0% |
| Total | 13 | 100.0% |
School Enrollment by Age by Funding Source in Sheridan Lake
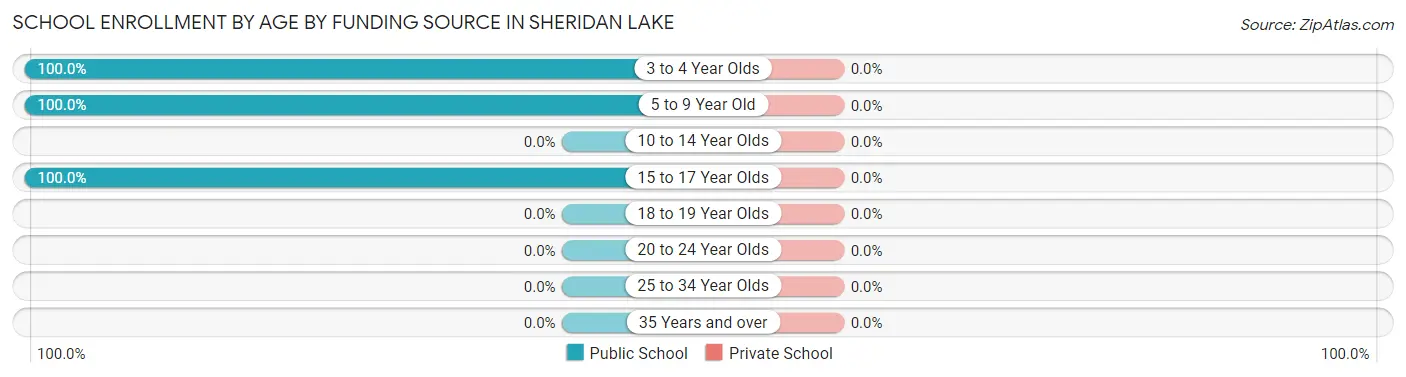
| Age Bracket | Public School | Private School |
| 3 to 4 Year Olds | 6 (100.0%) | 0 (0.0%) |
| 5 to 9 Year Old | 5 (100.0%) | 0 (0.0%) |
| 10 to 14 Year Olds | 0 (0.0%) | 0 (0.0%) |
| 15 to 17 Year Olds | 2 (100.0%) | 0 (0.0%) |
| 18 to 19 Year Olds | 0 (0.0%) | 0 (0.0%) |
| 20 to 24 Year Olds | 0 (0.0%) | 0 (0.0%) |
| 25 to 34 Year Olds | 0 (0.0%) | 0 (0.0%) |
| 35 Years and over | 0 (0.0%) | 0 (0.0%) |
| Total | 13 (100.0%) | 0 (0.0%) |
Educational Attainment by Field of Study in Sheridan Lake
Business (4 | 57.1%), science & technology (2 | 28.6%), and liberal arts & history (1 | 14.3%) are the most common fields of study among 7 individuals in Sheridan Lake who have obtained a bachelor's degree or higher.
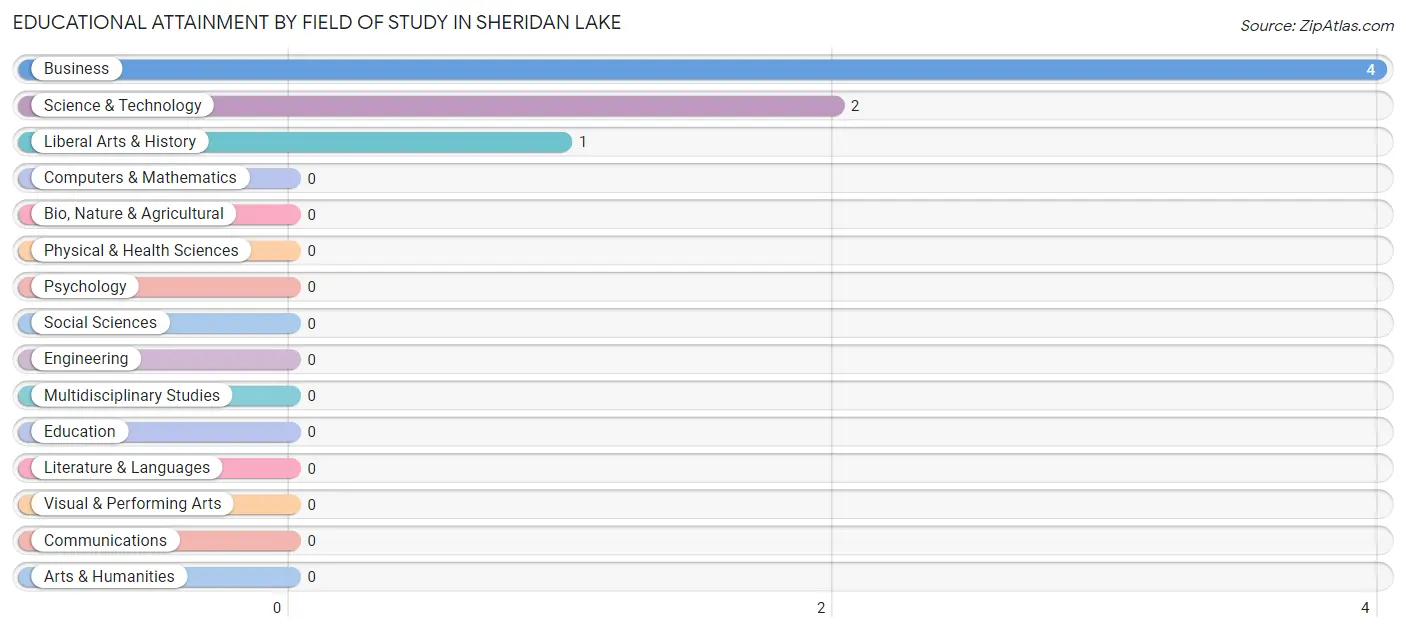
| Field of Study | # Graduates | % Graduates |
| Computers & Mathematics | 0 | 0.0% |
| Bio, Nature & Agricultural | 0 | 0.0% |
| Physical & Health Sciences | 0 | 0.0% |
| Psychology | 0 | 0.0% |
| Social Sciences | 0 | 0.0% |
| Engineering | 0 | 0.0% |
| Multidisciplinary Studies | 0 | 0.0% |
| Science & Technology | 2 | 28.6% |
| Business | 4 | 57.1% |
| Education | 0 | 0.0% |
| Literature & Languages | 0 | 0.0% |
| Liberal Arts & History | 1 | 14.3% |
| Visual & Performing Arts | 0 | 0.0% |
| Communications | 0 | 0.0% |
| Arts & Humanities | 0 | 0.0% |
| Total | 7 | 100.0% |
Transportation & Commute in Sheridan Lake
Vehicle Availability by Sex in Sheridan Lake
The most prevalent vehicle ownership categories in Sheridan Lake are males with 2 vehicles (5, accounting for 45.5%) and females with 2 vehicles (4, making up 50.0%).
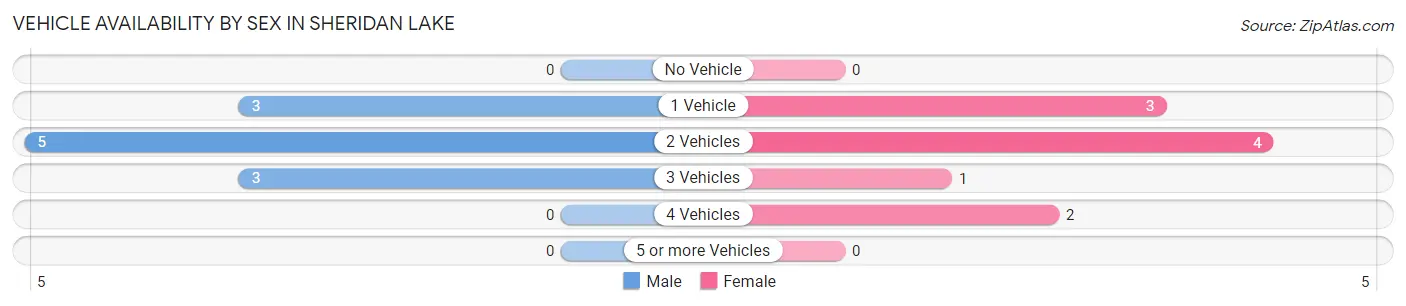
| Vehicles Available | Male | Female |
| No Vehicle | 0 (0.0%) | 0 (0.0%) |
| 1 Vehicle | 3 (27.3%) | 3 (30.0%) |
| 2 Vehicles | 5 (45.5%) | 4 (40.0%) |
| 3 Vehicles | 3 (27.3%) | 1 (10.0%) |
| 4 Vehicles | 0 (0.0%) | 2 (20.0%) |
| 5 or more Vehicles | 0 (0.0%) | 0 (0.0%) |
| Total | 11 (100.0%) | 10 (100.0%) |
Commute Time in Sheridan Lake
The most frequently occuring commute durations in Sheridan Lake are 5 to 9 minutes (5 commuters, 23.8%), 30 to 34 minutes (5 commuters, 23.8%), and 15 to 19 minutes (3 commuters, 14.3%).
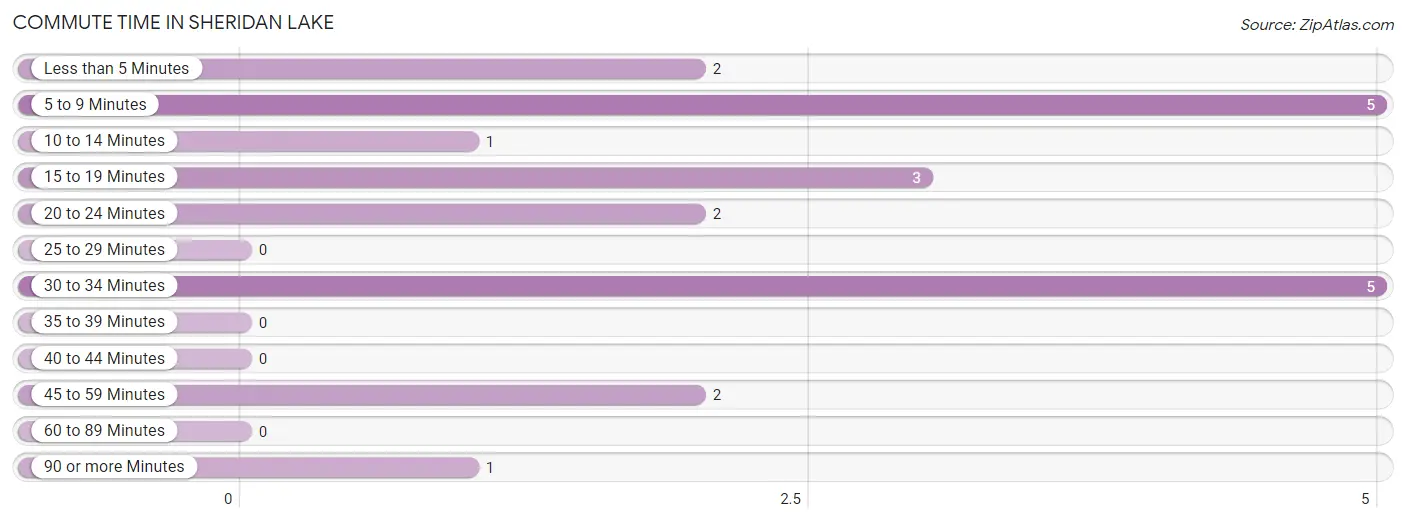
| Commute Time | # Commuters | % Commuters |
| Less than 5 Minutes | 2 | 9.5% |
| 5 to 9 Minutes | 5 | 23.8% |
| 10 to 14 Minutes | 1 | 4.8% |
| 15 to 19 Minutes | 3 | 14.3% |
| 20 to 24 Minutes | 2 | 9.5% |
| 25 to 29 Minutes | 0 | 0.0% |
| 30 to 34 Minutes | 5 | 23.8% |
| 35 to 39 Minutes | 0 | 0.0% |
| 40 to 44 Minutes | 0 | 0.0% |
| 45 to 59 Minutes | 2 | 9.5% |
| 60 to 89 Minutes | 0 | 0.0% |
| 90 or more Minutes | 1 | 4.8% |
Commute Time by Sex in Sheridan Lake
The most common commute times in Sheridan Lake are 5 to 9 minutes (5 commuters, 45.5%) for males and 30 to 34 minutes (3 commuters, 30.0%) for females.
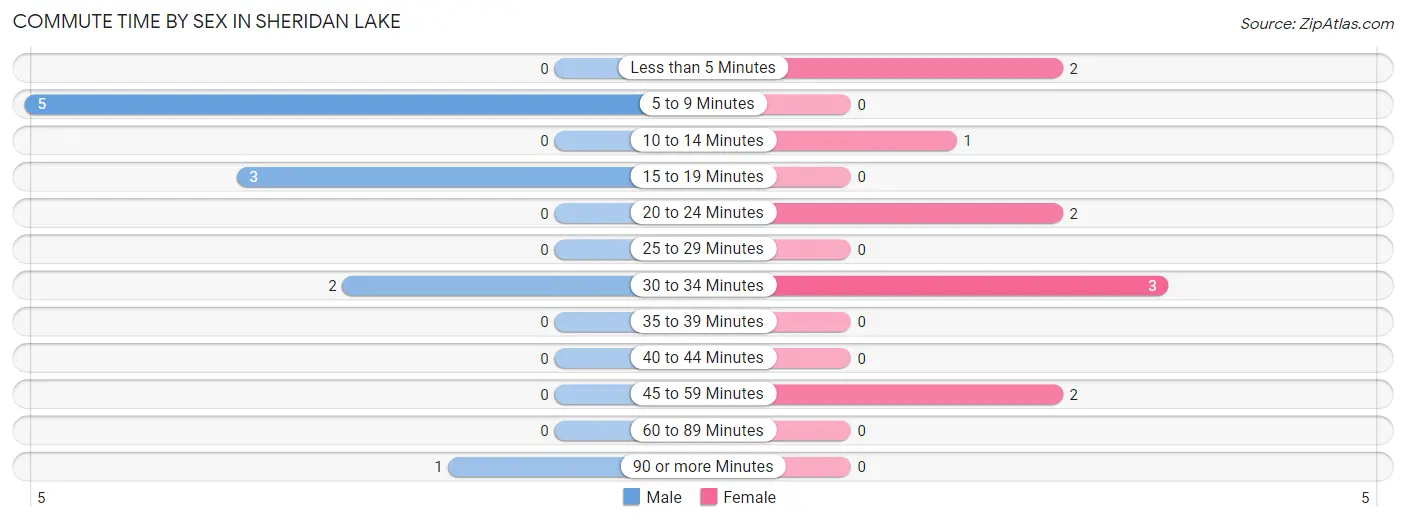
| Commute Time | Male | Female |
| Less than 5 Minutes | 0 (0.0%) | 2 (20.0%) |
| 5 to 9 Minutes | 5 (45.5%) | 0 (0.0%) |
| 10 to 14 Minutes | 0 (0.0%) | 1 (10.0%) |
| 15 to 19 Minutes | 3 (27.3%) | 0 (0.0%) |
| 20 to 24 Minutes | 0 (0.0%) | 2 (20.0%) |
| 25 to 29 Minutes | 0 (0.0%) | 0 (0.0%) |
| 30 to 34 Minutes | 2 (18.2%) | 3 (30.0%) |
| 35 to 39 Minutes | 0 (0.0%) | 0 (0.0%) |
| 40 to 44 Minutes | 0 (0.0%) | 0 (0.0%) |
| 45 to 59 Minutes | 0 (0.0%) | 2 (20.0%) |
| 60 to 89 Minutes | 0 (0.0%) | 0 (0.0%) |
| 90 or more Minutes | 1 (9.1%) | 0 (0.0%) |
Time of Departure to Work by Sex in Sheridan Lake
The most frequent times of departure to work in Sheridan Lake are 6:30 AM to 6:59 AM (6, 54.5%) for males and 6:30 AM to 6:59 AM (3, 30.0%) for females.
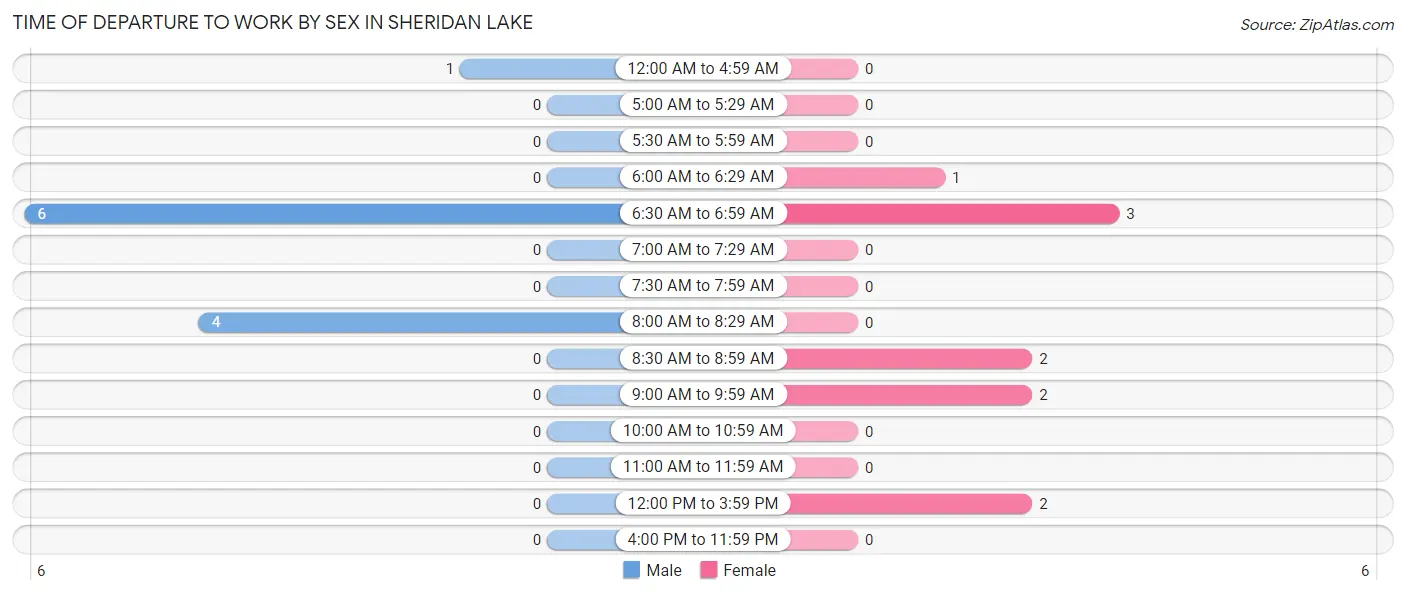
| Time of Departure | Male | Female |
| 12:00 AM to 4:59 AM | 1 (9.1%) | 0 (0.0%) |
| 5:00 AM to 5:29 AM | 0 (0.0%) | 0 (0.0%) |
| 5:30 AM to 5:59 AM | 0 (0.0%) | 0 (0.0%) |
| 6:00 AM to 6:29 AM | 0 (0.0%) | 1 (10.0%) |
| 6:30 AM to 6:59 AM | 6 (54.5%) | 3 (30.0%) |
| 7:00 AM to 7:29 AM | 0 (0.0%) | 0 (0.0%) |
| 7:30 AM to 7:59 AM | 0 (0.0%) | 0 (0.0%) |
| 8:00 AM to 8:29 AM | 4 (36.4%) | 0 (0.0%) |
| 8:30 AM to 8:59 AM | 0 (0.0%) | 2 (20.0%) |
| 9:00 AM to 9:59 AM | 0 (0.0%) | 2 (20.0%) |
| 10:00 AM to 10:59 AM | 0 (0.0%) | 0 (0.0%) |
| 11:00 AM to 11:59 AM | 0 (0.0%) | 0 (0.0%) |
| 12:00 PM to 3:59 PM | 0 (0.0%) | 2 (20.0%) |
| 4:00 PM to 11:59 PM | 0 (0.0%) | 0 (0.0%) |
| Total | 11 (100.0%) | 10 (100.0%) |
Housing Occupancy in Sheridan Lake
Occupancy by Ownership in Sheridan Lake
Of the total 15 dwellings in Sheridan Lake, owner-occupied units account for 8 (53.3%), while renter-occupied units make up 7 (46.7%).
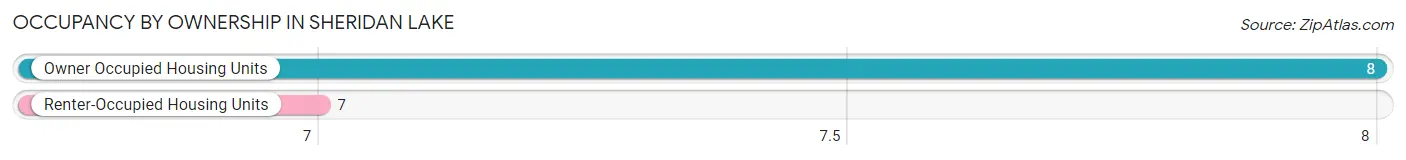
| Occupancy | # Housing Units | % Housing Units |
| Owner Occupied Housing Units | 8 | 53.3% |
| Renter-Occupied Housing Units | 7 | 46.7% |
| Total Occupied Housing Units | 15 | 100.0% |
Occupancy by Household Size in Sheridan Lake
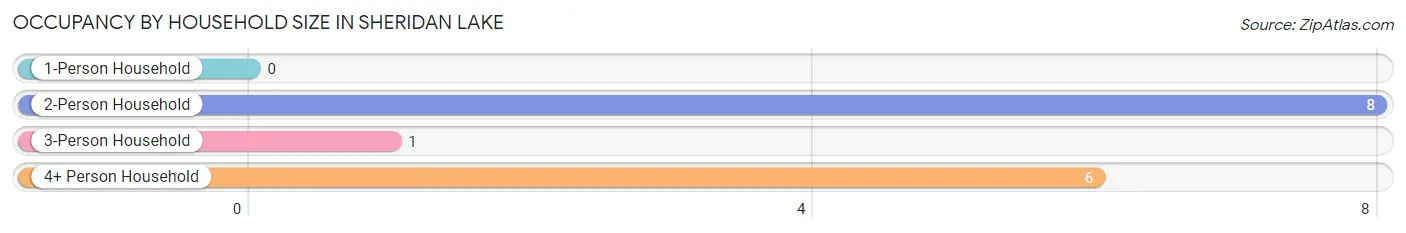
| Household Size | # Housing Units | % Housing Units |
| 1-Person Household | 0 | 0.0% |
| 2-Person Household | 8 | 53.3% |
| 3-Person Household | 1 | 6.7% |
| 4+ Person Household | 6 | 40.0% |
| Total Housing Units | 15 | 100.0% |
Occupancy by Ownership by Household Size in Sheridan Lake
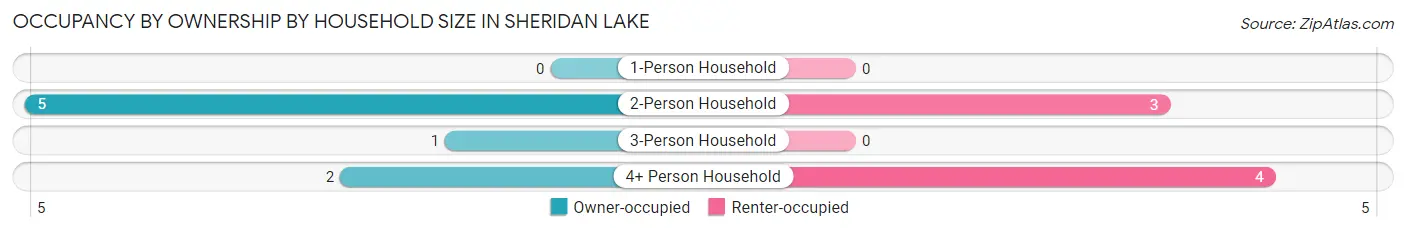
| Household Size | Owner-occupied | Renter-occupied |
| 1-Person Household | 0 (0.0%) | 0 (0.0%) |
| 2-Person Household | 5 (62.5%) | 3 (37.5%) |
| 3-Person Household | 1 (100.0%) | 0 (0.0%) |
| 4+ Person Household | 2 (33.3%) | 4 (66.7%) |
| Total Housing Units | 8 (53.3%) | 7 (46.7%) |
Occupancy by Educational Attainment in Sheridan Lake
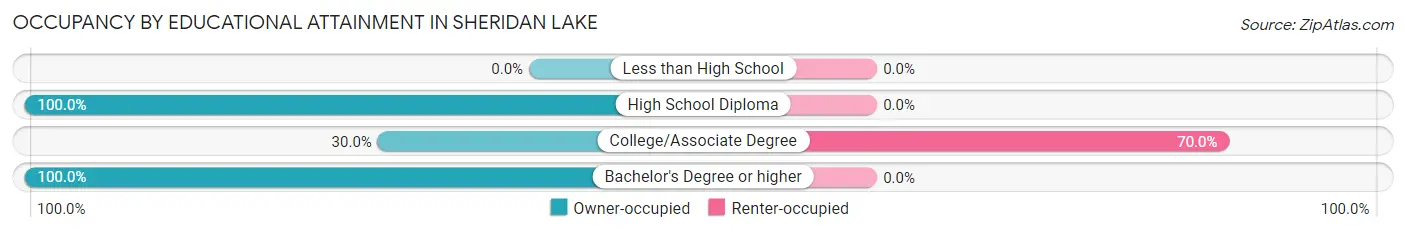
| Household Size | Owner-occupied | Renter-occupied |
| Less than High School | 0 (0.0%) | 0 (0.0%) |
| High School Diploma | 2 (100.0%) | 0 (0.0%) |
| College/Associate Degree | 3 (30.0%) | 7 (70.0%) |
| Bachelor's Degree or higher | 3 (100.0%) | 0 (0.0%) |
Occupancy by Age of Householder in Sheridan Lake
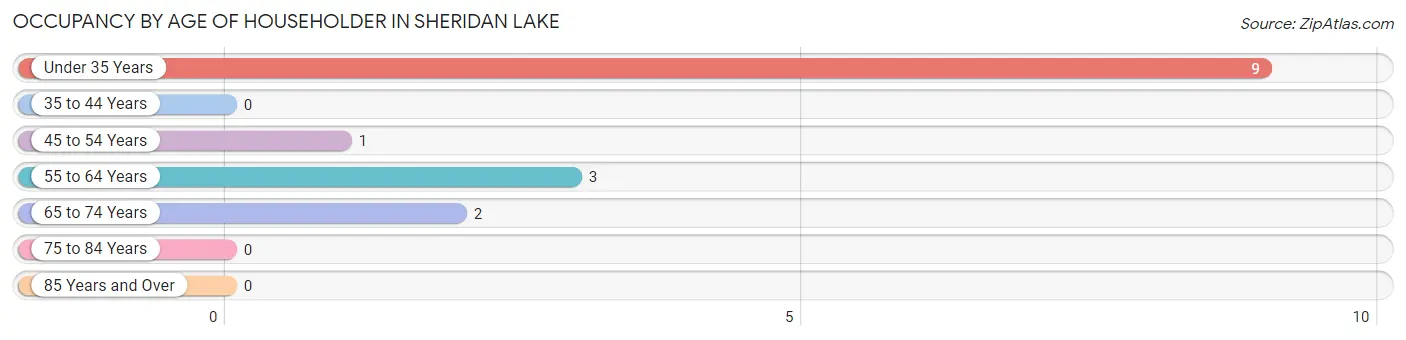
| Age Bracket | # Households | % Households |
| Under 35 Years | 9 | 60.0% |
| 35 to 44 Years | 0 | 0.0% |
| 45 to 54 Years | 1 | 6.7% |
| 55 to 64 Years | 3 | 20.0% |
| 65 to 74 Years | 2 | 13.3% |
| 75 to 84 Years | 0 | 0.0% |
| 85 Years and Over | 0 | 0.0% |
| Total | 15 | 100.0% |
Housing Finances in Sheridan Lake
Median Income by Occupancy in Sheridan Lake
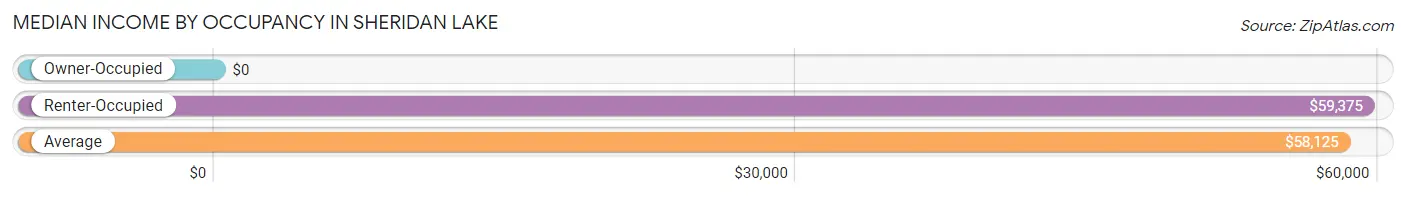
| Occupancy Type | # Households | Median Income |
| Owner-Occupied | 8 (53.3%) | $0 |
| Renter-Occupied | 7 (46.7%) | $59,375 |
| Average | 15 (100.0%) | $58,125 |
Occupancy by Householder Income Bracket in Sheridan Lake
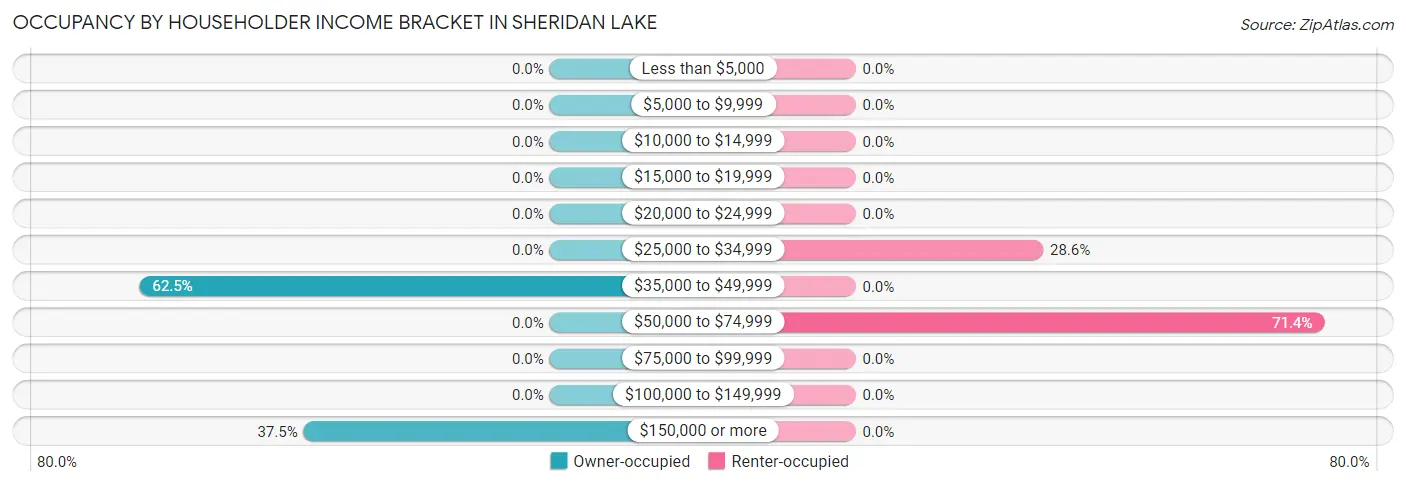
| Income Bracket | Owner-occupied | Renter-occupied |
| Less than $5,000 | 0 (0.0%) | 0 (0.0%) |
| $5,000 to $9,999 | 0 (0.0%) | 0 (0.0%) |
| $10,000 to $14,999 | 0 (0.0%) | 0 (0.0%) |
| $15,000 to $19,999 | 0 (0.0%) | 0 (0.0%) |
| $20,000 to $24,999 | 0 (0.0%) | 0 (0.0%) |
| $25,000 to $34,999 | 0 (0.0%) | 2 (28.6%) |
| $35,000 to $49,999 | 5 (62.5%) | 0 (0.0%) |
| $50,000 to $74,999 | 0 (0.0%) | 5 (71.4%) |
| $75,000 to $99,999 | 0 (0.0%) | 0 (0.0%) |
| $100,000 to $149,999 | 0 (0.0%) | 0 (0.0%) |
| $150,000 or more | 3 (37.5%) | 0 (0.0%) |
| Total | 8 (100.0%) | 7 (100.0%) |
Monthly Housing Cost Tiers in Sheridan Lake
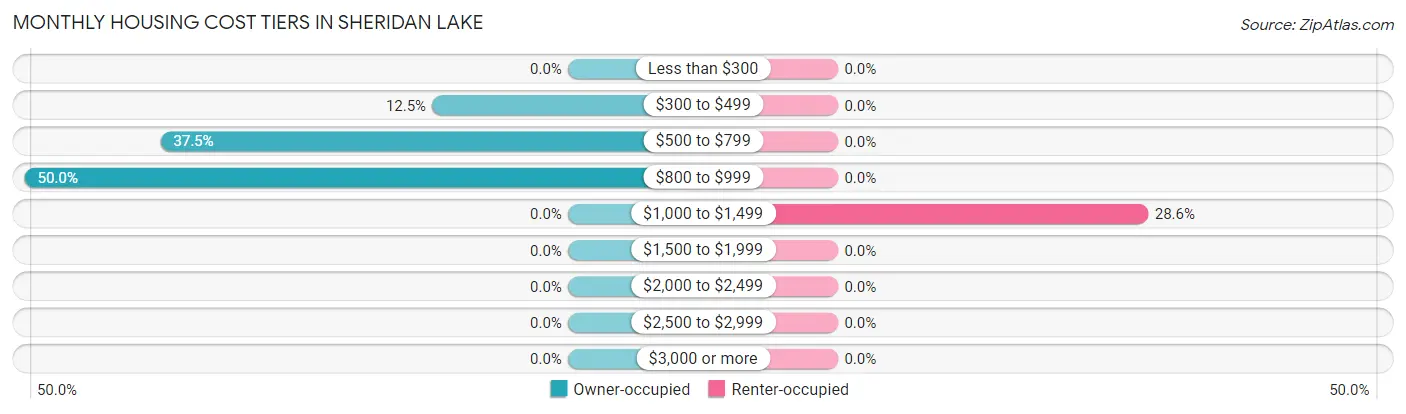
| Monthly Cost | Owner-occupied | Renter-occupied |
| Less than $300 | 0 (0.0%) | 0 (0.0%) |
| $300 to $499 | 1 (12.5%) | 0 (0.0%) |
| $500 to $799 | 3 (37.5%) | 0 (0.0%) |
| $800 to $999 | 4 (50.0%) | 0 (0.0%) |
| $1,000 to $1,499 | 0 (0.0%) | 2 (28.6%) |
| $1,500 to $1,999 | 0 (0.0%) | 0 (0.0%) |
| $2,000 to $2,499 | 0 (0.0%) | 0 (0.0%) |
| $2,500 to $2,999 | 0 (0.0%) | 0 (0.0%) |
| $3,000 or more | 0 (0.0%) | 0 (0.0%) |
| Total | 8 (100.0%) | 7 (100.0%) |
Physical Housing Characteristics in Sheridan Lake
Housing Structures in Sheridan Lake
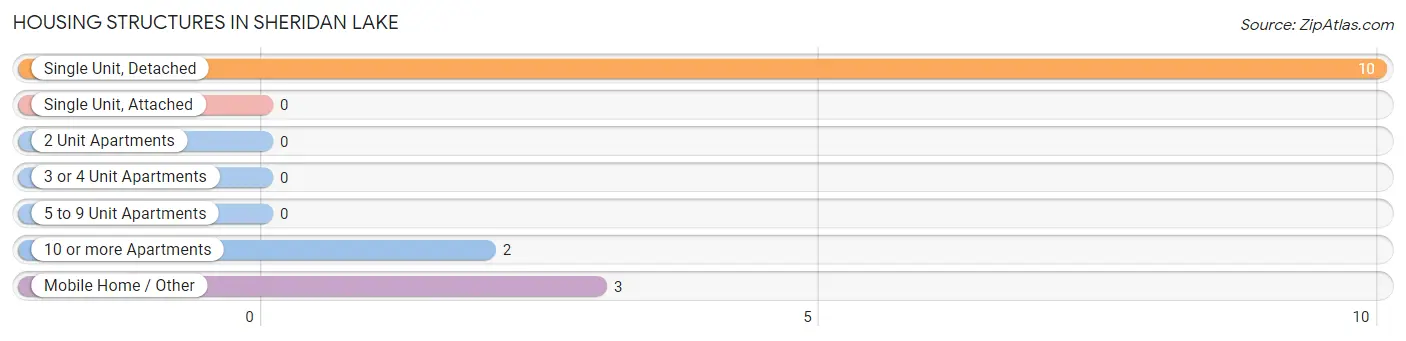
| Structure Type | # Housing Units | % Housing Units |
| Single Unit, Detached | 10 | 66.7% |
| Single Unit, Attached | 0 | 0.0% |
| 2 Unit Apartments | 0 | 0.0% |
| 3 or 4 Unit Apartments | 0 | 0.0% |
| 5 to 9 Unit Apartments | 0 | 0.0% |
| 10 or more Apartments | 2 | 13.3% |
| Mobile Home / Other | 3 | 20.0% |
| Total | 15 | 100.0% |
Housing Structures by Occupancy in Sheridan Lake
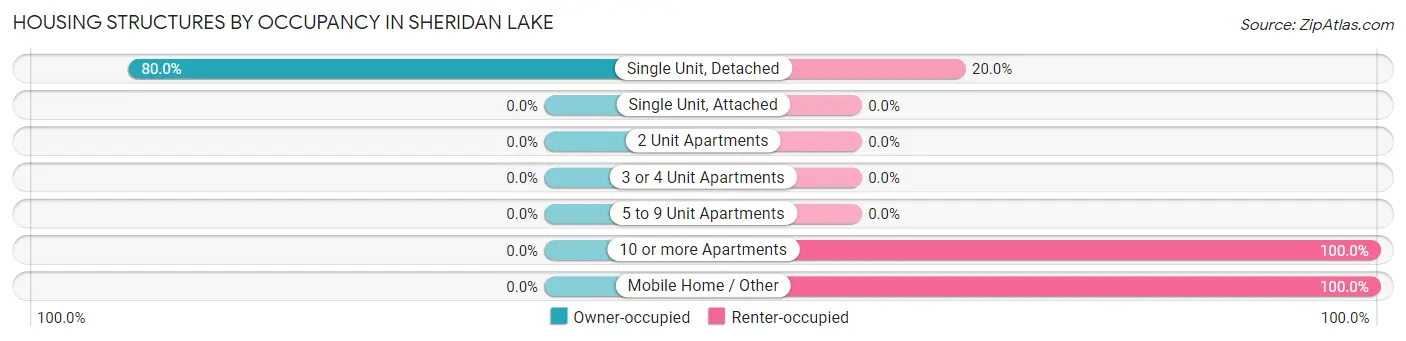
| Structure Type | Owner-occupied | Renter-occupied |
| Single Unit, Detached | 8 (80.0%) | 2 (20.0%) |
| Single Unit, Attached | 0 (0.0%) | 0 (0.0%) |
| 2 Unit Apartments | 0 (0.0%) | 0 (0.0%) |
| 3 or 4 Unit Apartments | 0 (0.0%) | 0 (0.0%) |
| 5 to 9 Unit Apartments | 0 (0.0%) | 0 (0.0%) |
| 10 or more Apartments | 0 (0.0%) | 2 (100.0%) |
| Mobile Home / Other | 0 (0.0%) | 3 (100.0%) |
| Total | 8 (53.3%) | 7 (46.7%) |
Housing Structures by Number of Rooms in Sheridan Lake
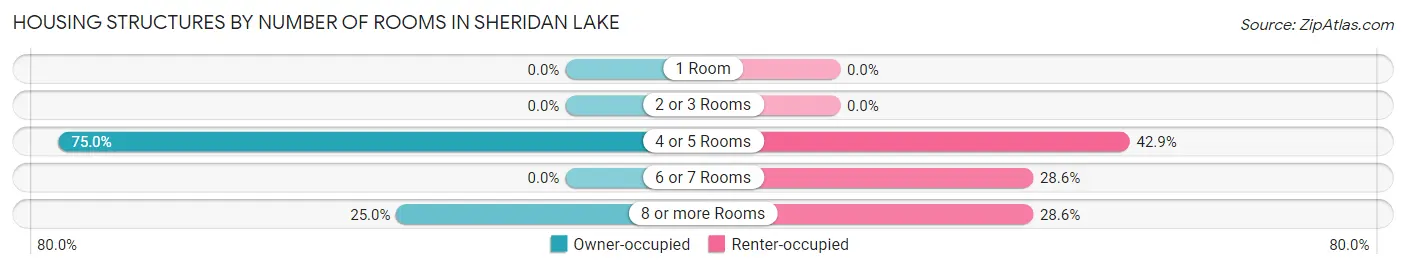
| Number of Rooms | Owner-occupied | Renter-occupied |
| 1 Room | 0 (0.0%) | 0 (0.0%) |
| 2 or 3 Rooms | 0 (0.0%) | 0 (0.0%) |
| 4 or 5 Rooms | 6 (75.0%) | 3 (42.9%) |
| 6 or 7 Rooms | 0 (0.0%) | 2 (28.6%) |
| 8 or more Rooms | 2 (25.0%) | 2 (28.6%) |
| Total | 8 (100.0%) | 7 (100.0%) |
Housing Structure by Heating Type in Sheridan Lake
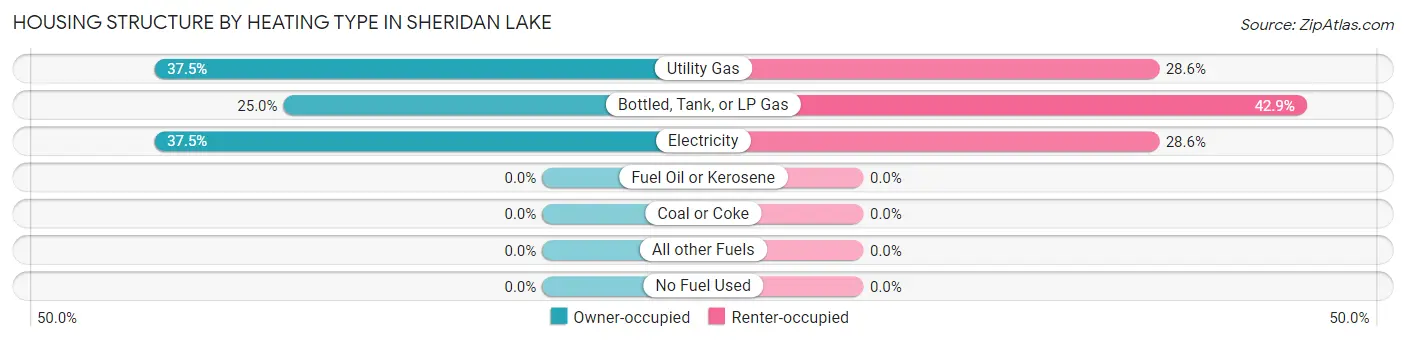
| Heating Type | Owner-occupied | Renter-occupied |
| Utility Gas | 3 (37.5%) | 2 (28.6%) |
| Bottled, Tank, or LP Gas | 2 (25.0%) | 3 (42.9%) |
| Electricity | 3 (37.5%) | 2 (28.6%) |
| Fuel Oil or Kerosene | 0 (0.0%) | 0 (0.0%) |
| Coal or Coke | 0 (0.0%) | 0 (0.0%) |
| All other Fuels | 0 (0.0%) | 0 (0.0%) |
| No Fuel Used | 0 (0.0%) | 0 (0.0%) |
| Total | 8 (100.0%) | 7 (100.0%) |
Household Vehicle Usage in Sheridan Lake
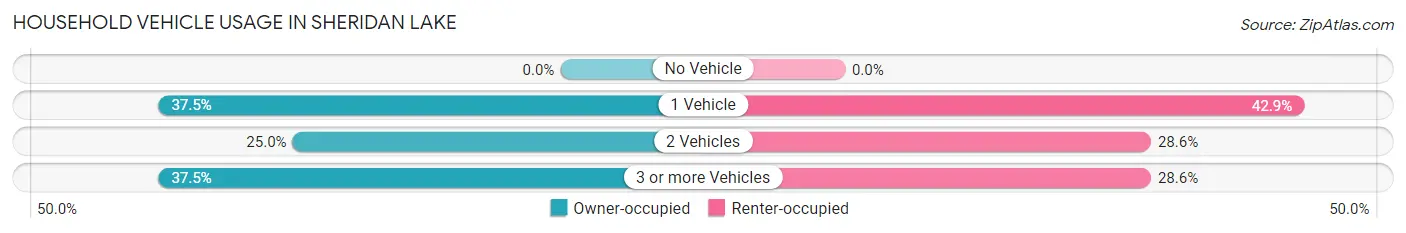
| Vehicles per Household | Owner-occupied | Renter-occupied |
| No Vehicle | 0 (0.0%) | 0 (0.0%) |
| 1 Vehicle | 3 (37.5%) | 3 (42.9%) |
| 2 Vehicles | 2 (25.0%) | 2 (28.6%) |
| 3 or more Vehicles | 3 (37.5%) | 2 (28.6%) |
| Total | 8 (100.0%) | 7 (100.0%) |
Real Estate & Mortgages in Sheridan Lake
Real Estate and Mortgage Overview in Sheridan Lake
| Characteristic | Without Mortgage | With Mortgage |
| Housing Units | 6 | 2 |
| Median Property Value | $76,700 | $0 |
| Median Household Income | - | - |
| Monthly Housing Costs | $567 | $0 |
| Real Estate Taxes | - | - |
Property Value by Mortgage Status in Sheridan Lake
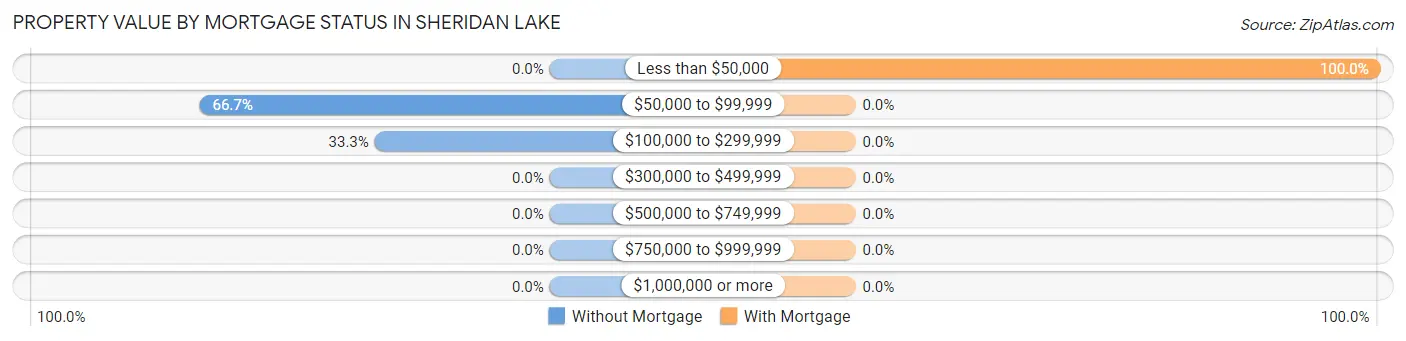
| Property Value | Without Mortgage | With Mortgage |
| Less than $50,000 | 0 (0.0%) | 2 (100.0%) |
| $50,000 to $99,999 | 4 (66.7%) | 0 (0.0%) |
| $100,000 to $299,999 | 2 (33.3%) | 0 (0.0%) |
| $300,000 to $499,999 | 0 (0.0%) | 0 (0.0%) |
| $500,000 to $749,999 | 0 (0.0%) | 0 (0.0%) |
| $750,000 to $999,999 | 0 (0.0%) | 0 (0.0%) |
| $1,000,000 or more | 0 (0.0%) | 0 (0.0%) |
| Total | 6 (100.0%) | 2 (100.0%) |
Household Income by Mortgage Status in Sheridan Lake
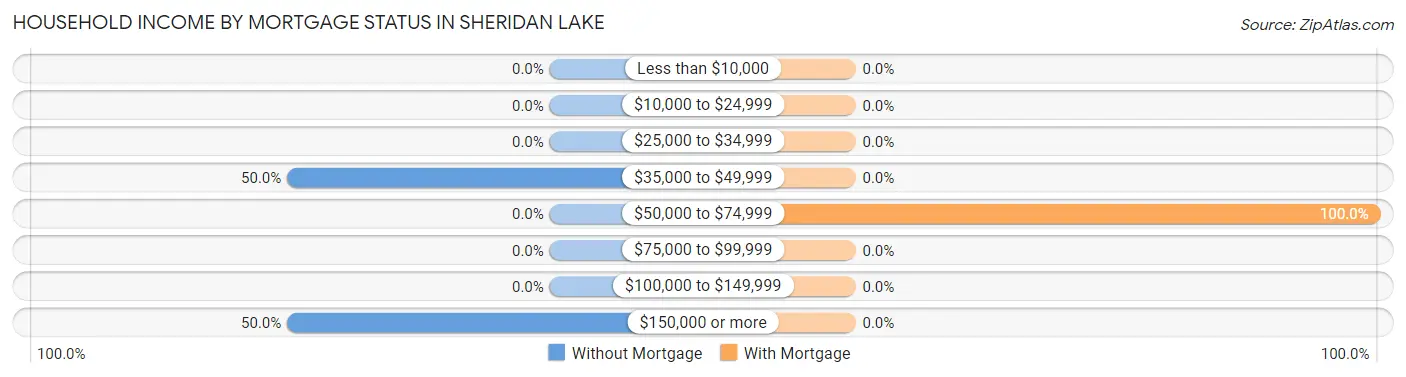
| Household Income | Without Mortgage | With Mortgage |
| Less than $10,000 | 0 (0.0%) | 0 (0.0%) |
| $10,000 to $24,999 | 0 (0.0%) | 0 (0.0%) |
| $25,000 to $34,999 | 0 (0.0%) | 0 (0.0%) |
| $35,000 to $49,999 | 3 (50.0%) | 0 (0.0%) |
| $50,000 to $74,999 | 0 (0.0%) | 2 (100.0%) |
| $75,000 to $99,999 | 0 (0.0%) | 0 (0.0%) |
| $100,000 to $149,999 | 0 (0.0%) | 0 (0.0%) |
| $150,000 or more | 3 (50.0%) | 0 (0.0%) |
| Total | 6 (100.0%) | 2 (100.0%) |
Property Value to Household Income Ratio in Sheridan Lake
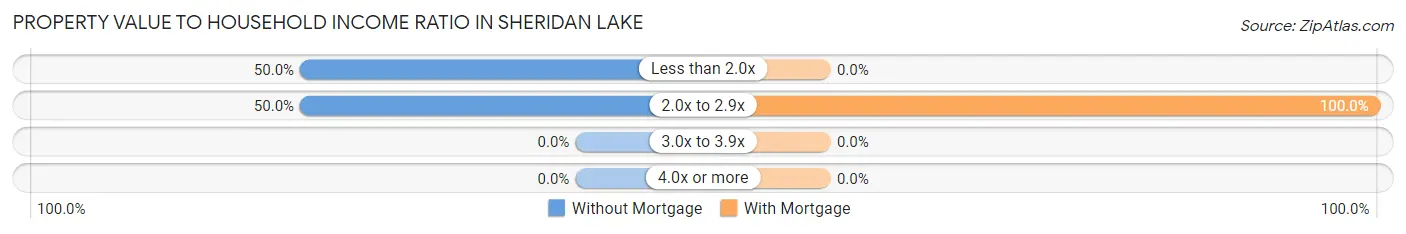
| Value-to-Income Ratio | Without Mortgage | With Mortgage |
| Less than 2.0x | 3 (50.0%) | 0 (0.0%) |
| 2.0x to 2.9x | 3 (50.0%) | 2 (100.0%) |
| 3.0x to 3.9x | 0 (0.0%) | 0 (0.0%) |
| 4.0x or more | 0 (0.0%) | 0 (0.0%) |
| Total | 6 (100.0%) | 2 (100.0%) |
Real Estate Taxes by Mortgage Status in Sheridan Lake
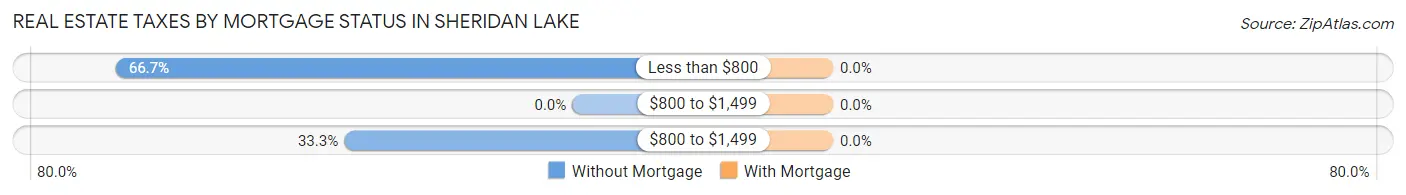
| Property Taxes | Without Mortgage | With Mortgage |
| Less than $800 | 4 (66.7%) | 0 (0.0%) |
| $800 to $1,499 | 0 (0.0%) | 0 (0.0%) |
| $800 to $1,499 | 2 (33.3%) | 0 (0.0%) |
| Total | 6 (100.0%) | 2 (100.0%) |
Health & Disability in Sheridan Lake
Health Insurance Coverage by Age in Sheridan Lake
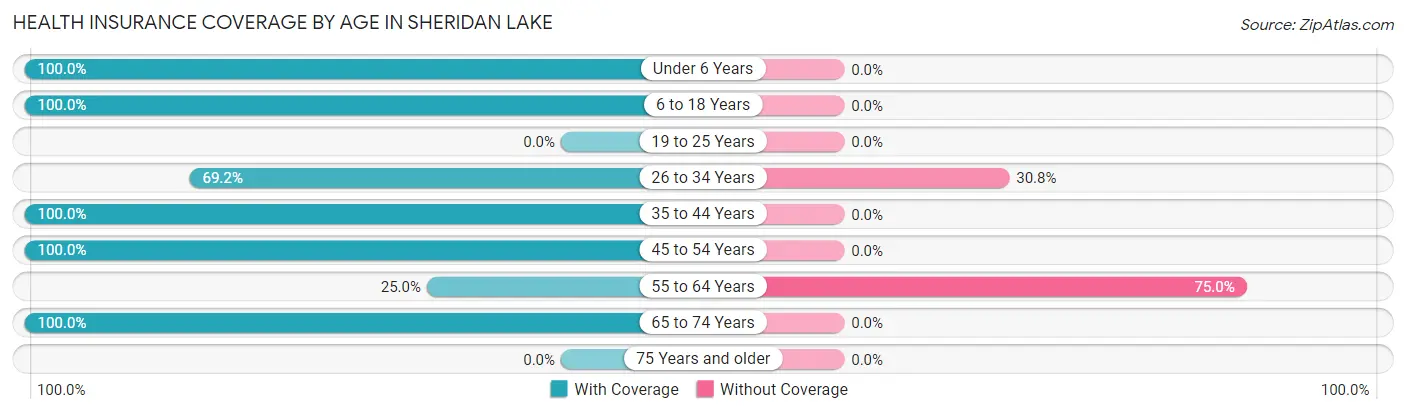
| Age Bracket | With Coverage | Without Coverage |
| Under 6 Years | 18 (100.0%) | 0 (0.0%) |
| 6 to 18 Years | 7 (100.0%) | 0 (0.0%) |
| 19 to 25 Years | 0 (0.0%) | 0 (0.0%) |
| 26 to 34 Years | 9 (69.2%) | 4 (30.8%) |
| 35 to 44 Years | 6 (100.0%) | 0 (0.0%) |
| 45 to 54 Years | 2 (100.0%) | 0 (0.0%) |
| 55 to 64 Years | 2 (25.0%) | 6 (75.0%) |
| 65 to 74 Years | 2 (100.0%) | 0 (0.0%) |
| 75 Years and older | 0 (0.0%) | 0 (0.0%) |
| Total | 46 (82.1%) | 10 (17.9%) |
Health Insurance Coverage by Citizenship Status in Sheridan Lake
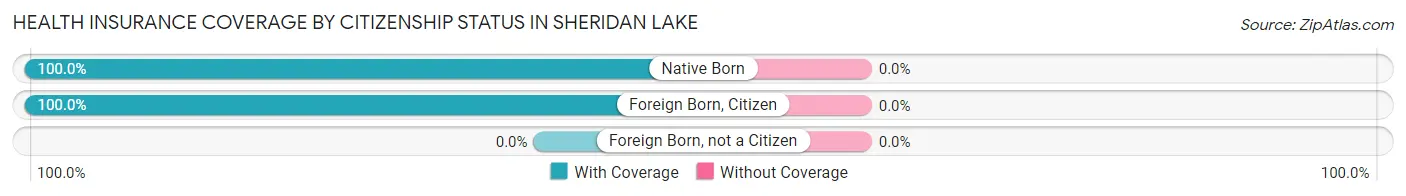
| Citizenship Status | With Coverage | Without Coverage |
| Native Born | 18 (100.0%) | 0 (0.0%) |
| Foreign Born, Citizen | 7 (100.0%) | 0 (0.0%) |
| Foreign Born, not a Citizen | 0 (0.0%) | 0 (0.0%) |
Health Insurance Coverage by Household Income in Sheridan Lake
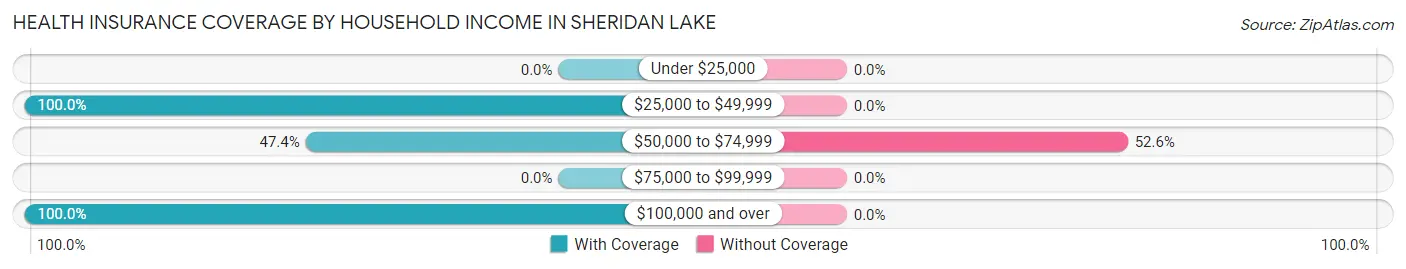
| Household Income | With Coverage | Without Coverage |
| Under $25,000 | 0 (0.0%) | 0 (0.0%) |
| $25,000 to $49,999 | 29 (100.0%) | 0 (0.0%) |
| $50,000 to $74,999 | 9 (47.4%) | 10 (52.6%) |
| $75,000 to $99,999 | 0 (0.0%) | 0 (0.0%) |
| $100,000 and over | 8 (100.0%) | 0 (0.0%) |
Public vs Private Health Insurance Coverage by Age in Sheridan Lake
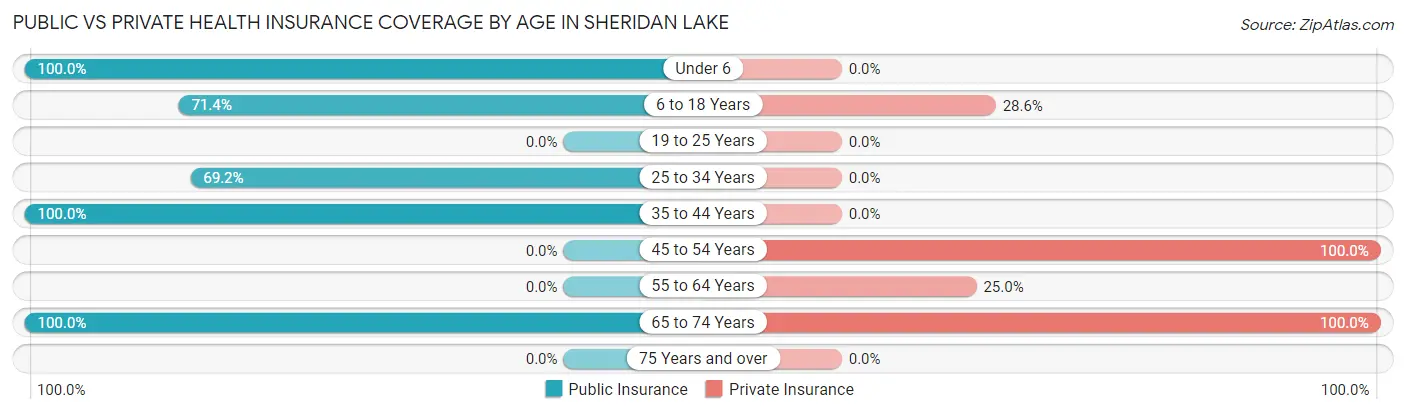
| Age Bracket | Public Insurance | Private Insurance |
| Under 6 | 18 (100.0%) | 0 (0.0%) |
| 6 to 18 Years | 5 (71.4%) | 2 (28.6%) |
| 19 to 25 Years | 0 (0.0%) | 0 (0.0%) |
| 25 to 34 Years | 9 (69.2%) | 0 (0.0%) |
| 35 to 44 Years | 6 (100.0%) | 0 (0.0%) |
| 45 to 54 Years | 0 (0.0%) | 2 (100.0%) |
| 55 to 64 Years | 0 (0.0%) | 2 (25.0%) |
| 65 to 74 Years | 2 (100.0%) | 2 (100.0%) |
| 75 Years and over | 0 (0.0%) | 0 (0.0%) |
| Total | 40 (71.4%) | 8 (14.3%) |
Disability Status by Sex by Age in Sheridan Lake
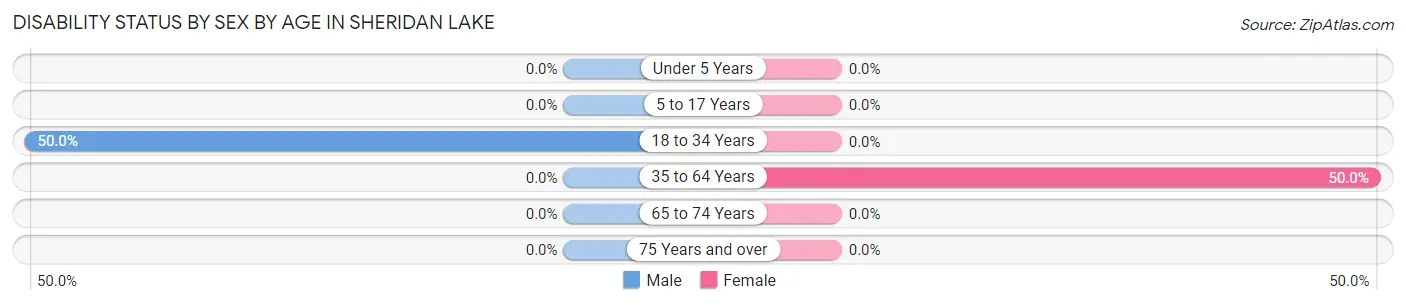
| Age Bracket | Male | Female |
| Under 5 Years | 0 (0.0%) | 0 (0.0%) |
| 5 to 17 Years | 0 (0.0%) | 0 (0.0%) |
| 18 to 34 Years | 2 (50.0%) | 0 (0.0%) |
| 35 to 64 Years | 0 (0.0%) | 3 (50.0%) |
| 65 to 74 Years | 0 (0.0%) | 0 (0.0%) |
| 75 Years and over | 0 (0.0%) | 0 (0.0%) |
Disability Class by Sex by Age in Sheridan Lake
Disability Class: Hearing Difficulty
| Age Bracket | Male | Female |
| Under 5 Years | 0 (0.0%) | 0 (0.0%) |
| 5 to 17 Years | 0 (0.0%) | 0 (0.0%) |
| 18 to 34 Years | 0 (0.0%) | 0 (0.0%) |
| 35 to 64 Years | 0 (0.0%) | 0 (0.0%) |
| 65 to 74 Years | 0 (0.0%) | 0 (0.0%) |
| 75 Years and over | 0 (0.0%) | 0 (0.0%) |
Disability Class: Vision Difficulty
| Age Bracket | Male | Female |
| Under 5 Years | 0 (0.0%) | 0 (0.0%) |
| 5 to 17 Years | 0 (0.0%) | 0 (0.0%) |
| 18 to 34 Years | 2 (50.0%) | 0 (0.0%) |
| 35 to 64 Years | 0 (0.0%) | 0 (0.0%) |
| 65 to 74 Years | 0 (0.0%) | 0 (0.0%) |
| 75 Years and over | 0 (0.0%) | 0 (0.0%) |
Disability Class: Cognitive Difficulty

| Age Bracket | Male | Female |
| 5 to 17 Years | 0 (0.0%) | 0 (0.0%) |
| 18 to 34 Years | 0 (0.0%) | 0 (0.0%) |
| 35 to 64 Years | 0 (0.0%) | 0 (0.0%) |
| 65 to 74 Years | 0 (0.0%) | 0 (0.0%) |
| 75 Years and over | 0 (0.0%) | 0 (0.0%) |
Disability Class: Ambulatory Difficulty
| Age Bracket | Male | Female |
| 5 to 17 Years | 0 (0.0%) | 0 (0.0%) |
| 18 to 34 Years | 0 (0.0%) | 0 (0.0%) |
| 35 to 64 Years | 0 (0.0%) | 3 (50.0%) |
| 65 to 74 Years | 0 (0.0%) | 0 (0.0%) |
| 75 Years and over | 0 (0.0%) | 0 (0.0%) |
Disability Class: Self-Care Difficulty
| Age Bracket | Male | Female |
| 5 to 17 Years | 0 (0.0%) | 0 (0.0%) |
| 18 to 34 Years | 0 (0.0%) | 0 (0.0%) |
| 35 to 64 Years | 0 (0.0%) | 0 (0.0%) |
| 65 to 74 Years | 0 (0.0%) | 0 (0.0%) |
| 75 Years and over | 0 (0.0%) | 0 (0.0%) |
Technology Access in Sheridan Lake
Computing Device Access in Sheridan Lake
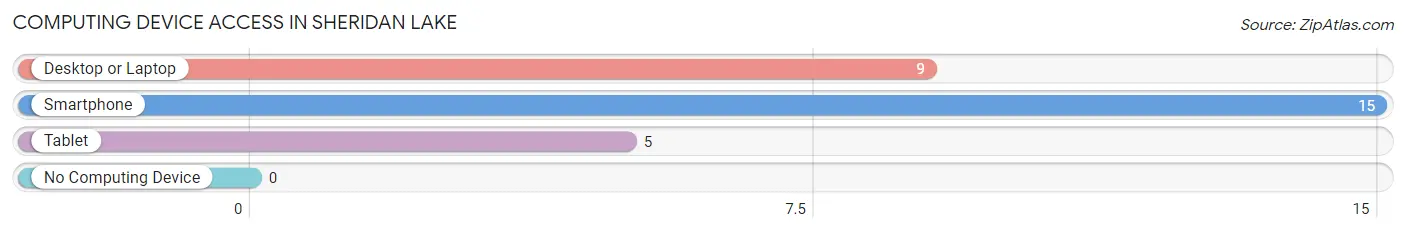
| Device Type | # Households | % Households |
| Desktop or Laptop | 9 | 60.0% |
| Smartphone | 15 | 100.0% |
| Tablet | 5 | 33.3% |
| No Computing Device | 0 | 0.0% |
| Total | 15 | 100.0% |
Internet Access in Sheridan Lake
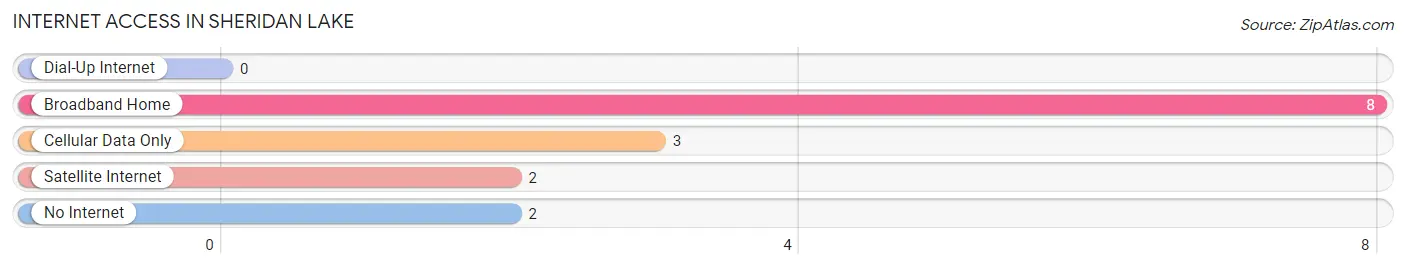
| Internet Type | # Households | % Households |
| Dial-Up Internet | 0 | 0.0% |
| Broadband Home | 8 | 53.3% |
| Cellular Data Only | 3 | 20.0% |
| Satellite Internet | 2 | 13.3% |
| No Internet | 2 | 13.3% |
| Total | 15 | 100.0% |
Sheridan Lake Summary
Sheridan Lake is a small town located in Kiowa County, Colorado. It is situated in the southeastern corner of the state, approximately 30 miles east of the Colorado-Kansas border. The town was founded in 1887 and is named after the nearby Sheridan Lake, which was named after General Philip Sheridan. The town has a population of approximately 200 people and is a popular destination for fishing, camping, and other outdoor activities.
History
Sheridan Lake was founded in 1887 by a group of settlers from Kansas. The town was named after the nearby Sheridan Lake, which was named after General Philip Sheridan. The town was originally a farming community, but the area quickly became known for its abundance of fish and wildlife. In the early 1900s, the town began to attract tourists and anglers from all over the country. The town was incorporated in 1909 and has remained a small, rural community ever since.
Geography
Sheridan Lake is located in Kiowa County, Colorado. It is situated in the southeastern corner of the state, approximately 30 miles east of the Colorado-Kansas border. The town is located at an elevation of 6,400 feet and is surrounded by rolling hills and prairies. The nearby Sheridan Lake is a popular destination for fishing, camping, and other outdoor activities.
Economy
The economy of Sheridan Lake is largely based on agriculture and tourism. The town is home to several small farms and ranches, which produce a variety of crops and livestock. Tourism is also an important part of the local economy, as the town is a popular destination for fishing, camping, and other outdoor activities. In addition, the town is home to several small businesses, including a grocery store, a hardware store, and a restaurant.
Demographics
As of the 2010 census, the population of Sheridan Lake was approximately 200 people. The town is predominantly white, with a small Hispanic population. The median household income is $37,500, and the median home value is $90,000. The town has a low unemployment rate and a high rate of homeownership.
Conclusion
Sheridan Lake is a small town located in Kiowa County, Colorado. It was founded in 1887 and is named after the nearby Sheridan Lake. The town has a population of approximately 200 people and is a popular destination for fishing, camping, and other outdoor activities. The economy of Sheridan Lake is largely based on agriculture and tourism, and the town is predominantly white, with a small Hispanic population.
Common Questions
What is Per Capita Income in Sheridan Lake?
Per Capita income in Sheridan Lake is $21,189.
What is the Median Family Income in Sheridan Lake?
Median Family Income in Sheridan Lake is $51,250.
What is the Median Household income in Sheridan Lake?
Median Household Income in Sheridan Lake is $58,125.
What is Income or Wage Gap in Sheridan Lake?
Income or Wage Gap in Sheridan Lake is 45.8%.
Women in Sheridan Lake earn 54.2 cents for every dollar earned by a man.
What is Inequality or Gini Index in Sheridan Lake?
Inequality or Gini Index in Sheridan Lake is 0.38.
What is the Total Population of Sheridan Lake?
Total Population of Sheridan Lake is 56.
What is the Total Male Population of Sheridan Lake?
Total Male Population of Sheridan Lake is 27.
What is the Total Female Population of Sheridan Lake?
Total Female Population of Sheridan Lake is 29.
What is the Ratio of Males per 100 Females in Sheridan Lake?
There are 93.10 Males per 100 Females in Sheridan Lake.
What is the Ratio of Females per 100 Males in Sheridan Lake?
There are 107.41 Females per 100 Males in Sheridan Lake.
What is the Median Population Age in Sheridan Lake?
Median Population Age in Sheridan Lake is 26.8 Years.
What is the Average Family Size in Sheridan Lake
Average Family Size in Sheridan Lake is 3.5 People.
What is the Average Household Size in Sheridan Lake
Average Household Size in Sheridan Lake is 3.7 People.
How Large is the Labor Force in Sheridan Lake?
There are 21 People in the Labor Forcein in Sheridan Lake.
What is the Percentage of People in the Labor Force in Sheridan Lake?
67.7% of People are in the Labor Force in Sheridan Lake.